
1) Which of the following trade-offs does the production possibilities frontier illustrate?
a.If an economy wants to increase efficiency in production, then it must sacrifice
equality in consumption.
b.Once an economy has reached the efficient points on its production possibilities
frontier, the only way of getting more of one good is to get less of the other.
c.For an economy to consume more of one good, it must stop consuming the other good
entirely.
d.For an economy to produce and consume goods, it must sacrifice environmental
quality.
2) The theory of monopolistic competition is somewhat disappointing in that it fails to
a.pinpoint a profit-maximizing level of output for monopolistically competitive firms.
b.yield simple and compelling advice for public policy.
c.explain why product differentiation is observed in monopolistically competitive
markets.
d.explain why monopolistically competitive firms have excess capacity.
3) Coal is considered to be a non-renewable energy source. Which of the following
statements is correct?
a.Coal is an unlimited resource.
b.Coal is a scarce resource.
c.Coal is a non-productive resource.
d.Coal is not a resource.
4) The two major problems caused by asymmetric information are the moral-hazard
problem and the principal-agent problem.
a.True
b.False
5) Table 17-1
Imagine a small town in which only two residents, Rochelle and Alec, own wells that
produce safe drinking water. Each week Rochelle and Alec work together to decide how
many gallons of water to pump. They bring the water to town and sell it at whatever
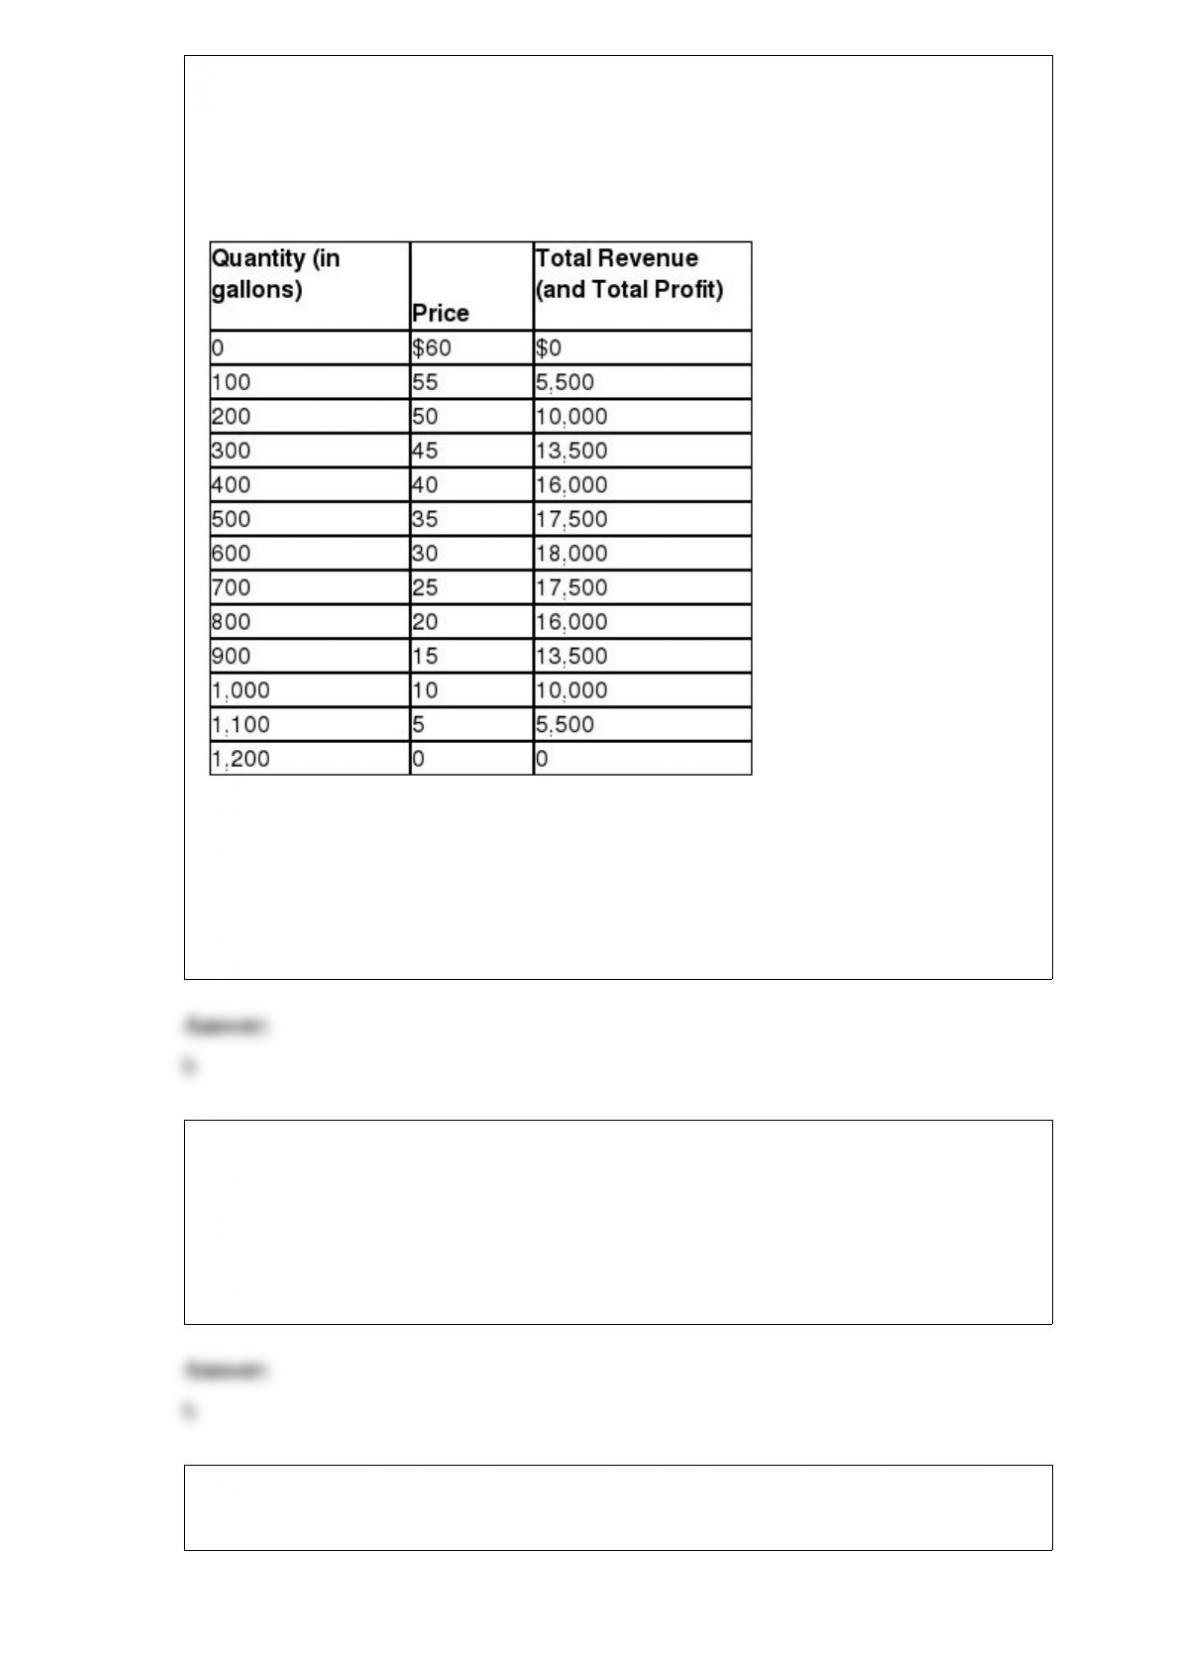
price the market will bear. To keep things simple, suppose that Rochelle and Alec can
pump as much water as they want without cost so that the marginal cost of water equals
zero. The weekly town demand schedule and total revenue schedule for water is shown
in the table below:
Refer to Table 17-1. If Rochelle and Alec operate as a profit-maximizing monopoly in
the market for water, what price will they charge?
a.$25
b.$30
c.$35
d.$40
6) A firm can signal the high quality of its product by
a.spending nothing on advertising to convey that the product is so good that the firm
does not even need to advertise.
b.spending a large amount of money on advertising.
c.getting a patent for the product.
d.not worrying about getting a patent for the product.
7) Uzbekistan’s Production Possibilities FrontierAzerbaijan’s Production
Possibilities Frontier
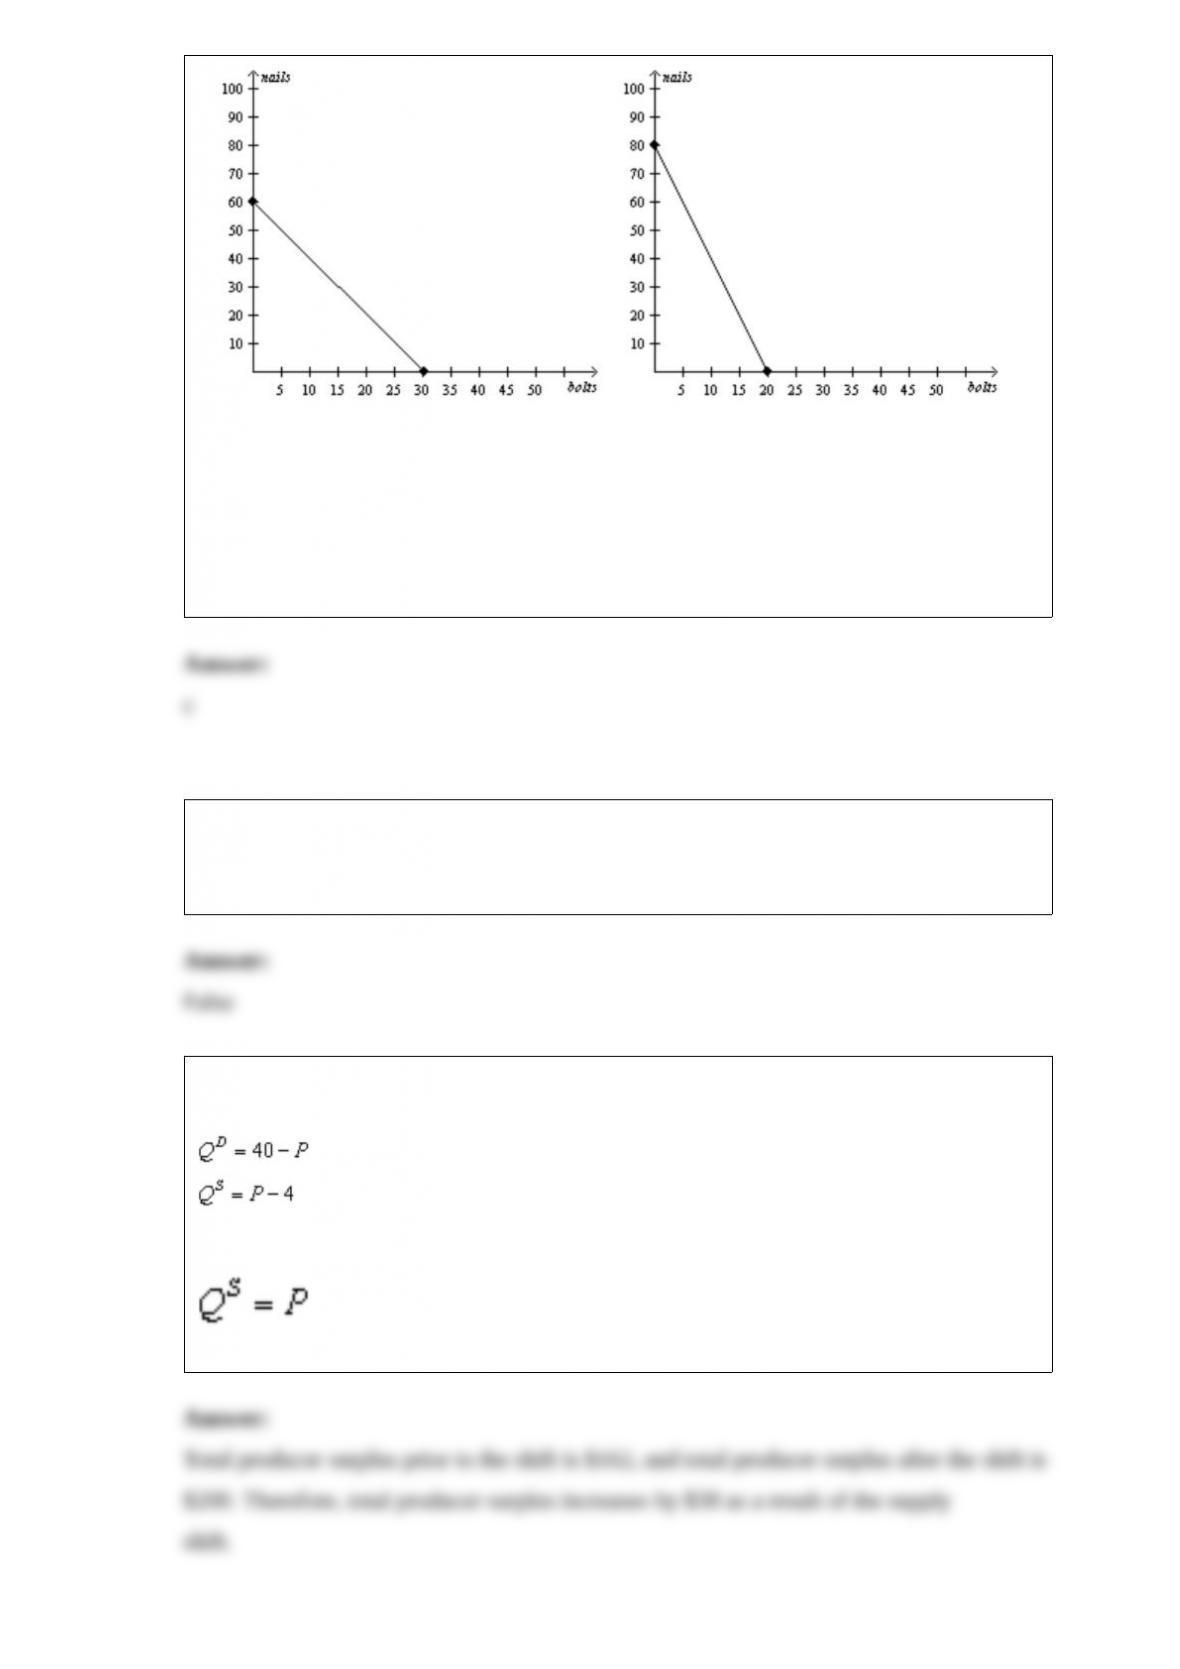
Suppose Azerbaijan decides to increase its production of nails by 20. What is the
opportunity cost of this decision?
a.1/4 bolt
b.4 bolts
c.5 bolts
d.80 bolts
8) Historical episodes are not valuable to economists.
a.True
b.False
9) Scenario 7-2
Suppose market demand and market supply are given by the equations:
Refer to Scenario 7-2. Suppose a reduction in input prices shifts the market supply
curve to
By how much does total producer surplus increase as a result of this supply shift?

10) Table 13-5
Assume that fixed costs are $500, and variable costs are $100 per worker. For this firm,
what are the shapes of the production function and the total-cost curve?
a.Both the production function and total-cost curve are increasing at an increasing rate.
b.Both the production function and total-cost curve are increasing at a decreasing rate.
c.The production function is increasing at an increasing rate, whereas the total-cost
function is increasing at a decreasing rate.
d.The production function is increasing at a decreasing rate, whereas the total-cost
function is increasing at an increasing rate.
11) When two variables move in opposite directions, the curve relating them is
a.upward sloping, and we say the variables are positively related.
b.upward sloping, and we say the variables are negatively related.
c.downward sloping, and we say the variables are positively related.
d.downward sloping, and we say the variables are negatively related.
12) Scenario 20-3
Suppose that a society is made up of five families whose incomes are as follows:
$120,000; $90,000; $30,000; $30,000; and $18,000.
The federal government is considering two potential income tax plans:
Plan A is a negative income tax plan where the taxes owed equal 1/3 of income minus
$20,000.
Plan B is a two-tiered plan where families earning less than $35,000 pay no income tax
and families earning more than $35,000 pay 10% of their income in taxes. The income
tax revenue collected from those families earning over
$35,000 is then redistributed equally to those families earning less than $35,000.
Refer to Scenario 20-3. Assuming that utility is directly proportional to the cash value
of after-tax income, which government policy would an advocate of libertarianism
prefer?

a.Plan A
b.Plan B
c.either Plan A or Plan B
d.neither Plan A nor Plan B because any plan that forcibly redistributes income is
against the philosophy
13) In a competitive market the current price is $5. The typical firm in the market has
ATC = $5.50 and AVC = $4.50.
a.In the short run firms will shut down, and in the long run firms will leave the market.
b.In the short run firms will continue to operate, but in the long run firms will leave the
market.
c.New firms will likely enter this market to capture any remaining economic profits.
d.The firm will earn zero profits in both the short run and long run.
14) Which of the following is not a characteristic of a perfectly competitive market?
a.Different sellers sell identical products.
b.There are many sellers.
c.Sellers must accept the price the market determines.
d.All of the above are characteristics of a perfectly competitive market.
15) A Principles of Microeconomics professor wants to know how much prior
knowledge her students have before beginning the class so she gives them a pre-test.
This action is an example of
a.signaling.
b.screening.
c.adverse selection.
d.moral hazard.