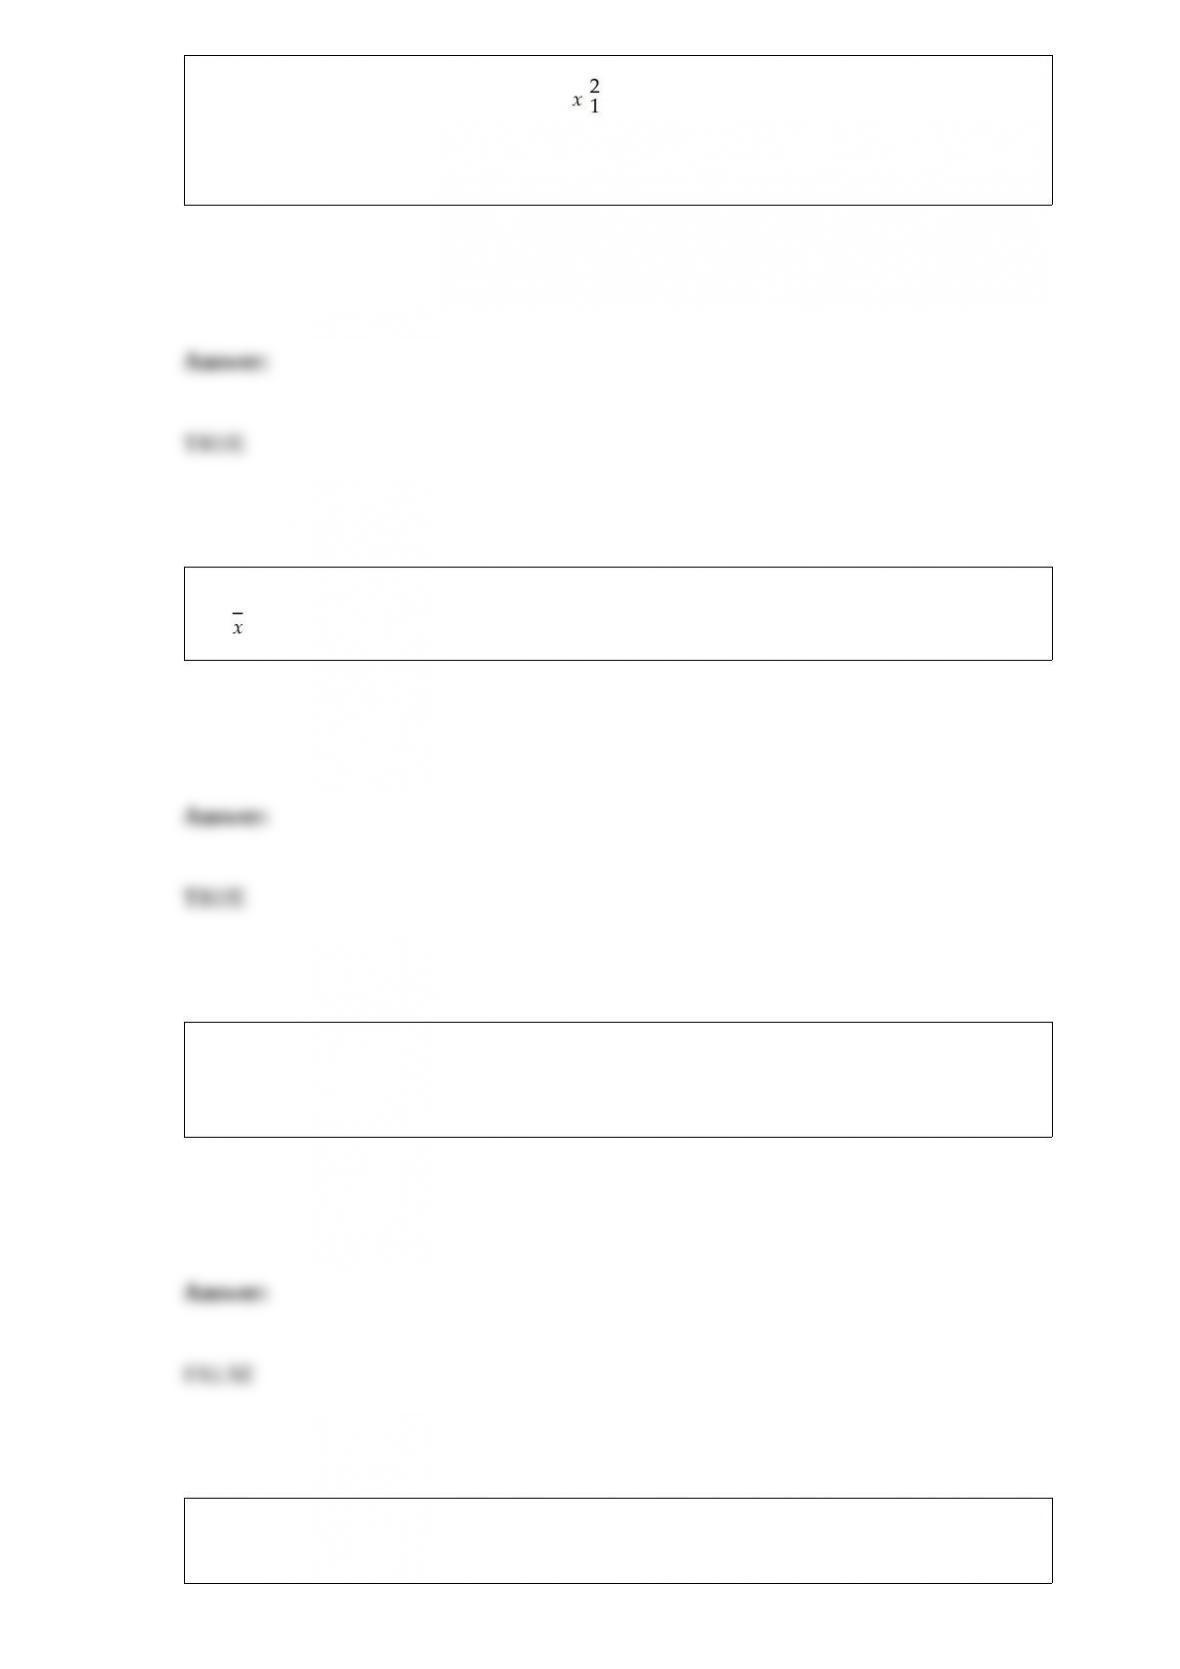
In regression model: y = β0 + β1x1 + β2 + ε , if β2< 0, then the value of y is expected
to increase with x until x reaches a certain point after which the value of y is expected
to decrease.
It is entirely possible for the R-chart to show that a process is in statistical control and
the -chart to show that the same process is out of control.
In a recent meeting, a manager indicated that sales tend to be higher during October,
November, and December and lower in the spring. In making this statement, she is
indicating that sales for the company are cyclical.
The loan manager for State Bank and Trust has claimed that the mean loan balance on
outstanding loans at the bank is over $14,500. To test this at a significance level of 0.05,
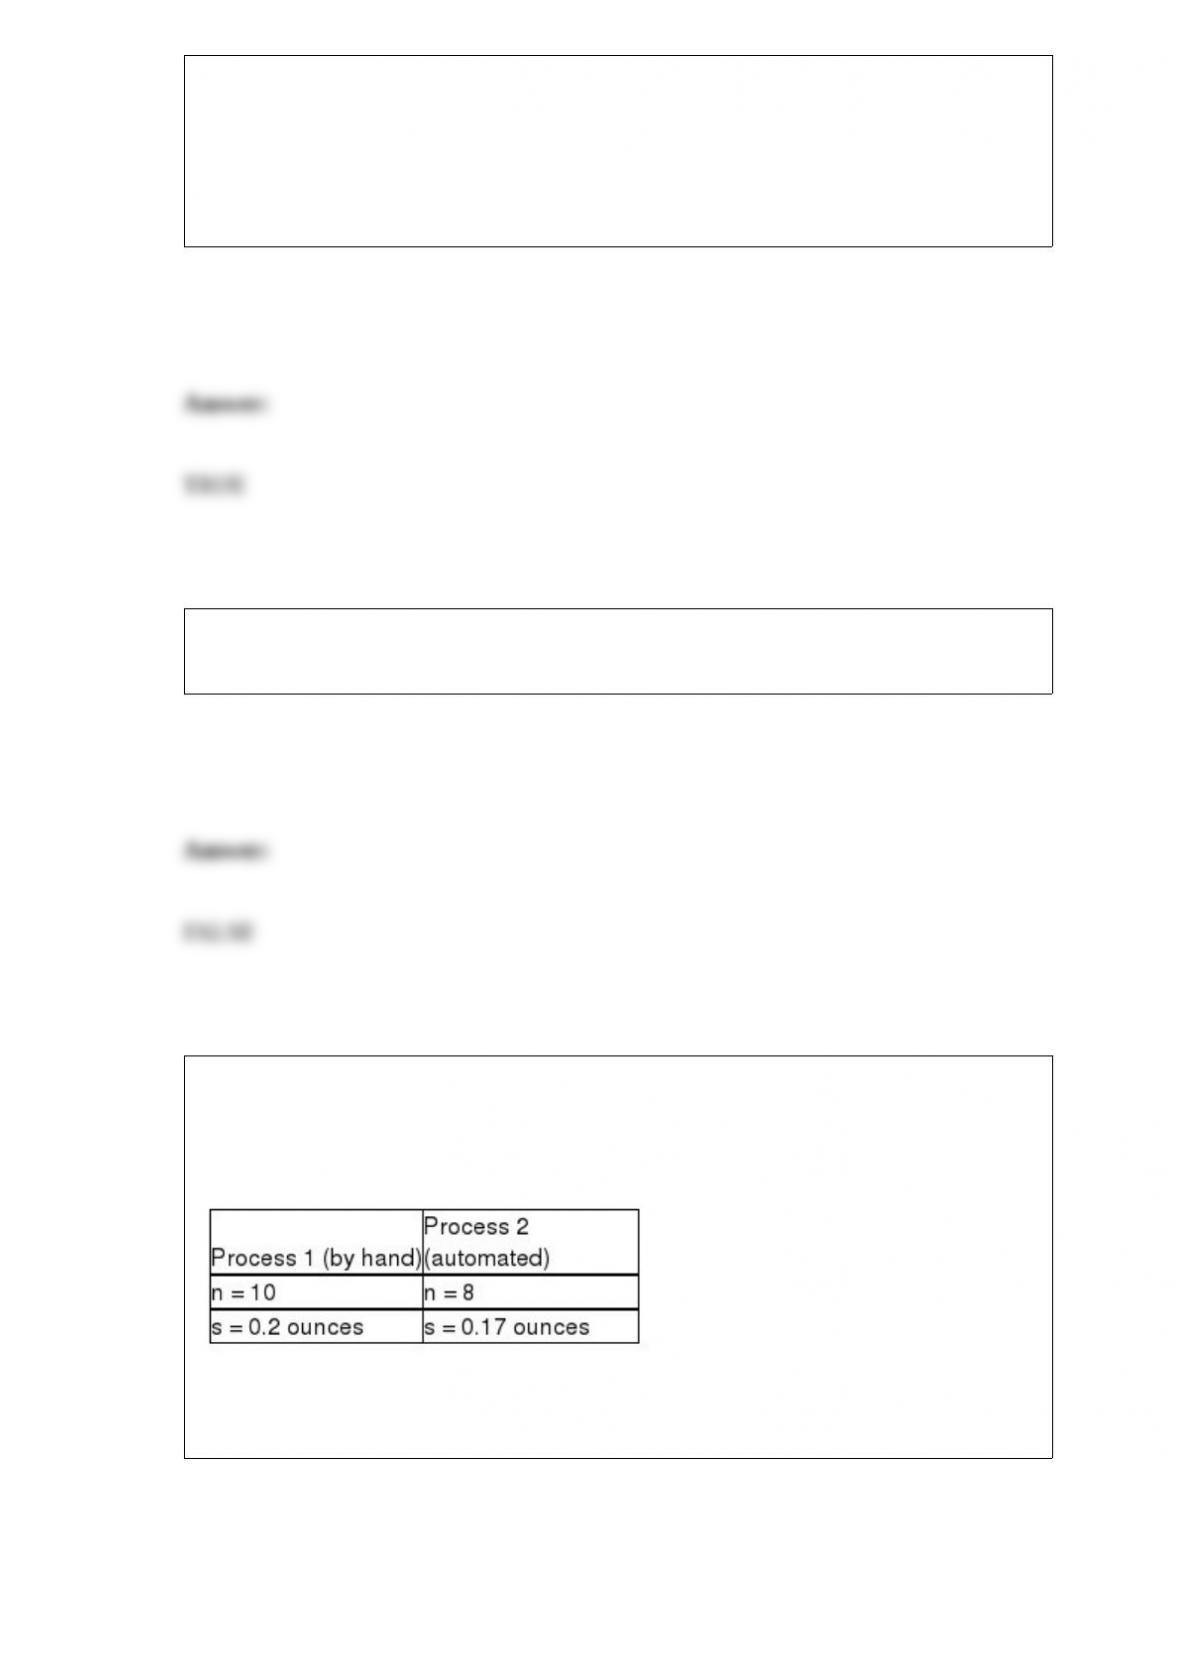
a random sample of n = 100 loan accounts is selected. Assuming that the population
standard deviation is known to be $3,000, the null and alternative hypotheses to be
tested are:
H0 : μ ≤ $14,500
HA : μ > $14,500
In a sample size determination situation, reducing the margin of error by half will
double the required sample size.
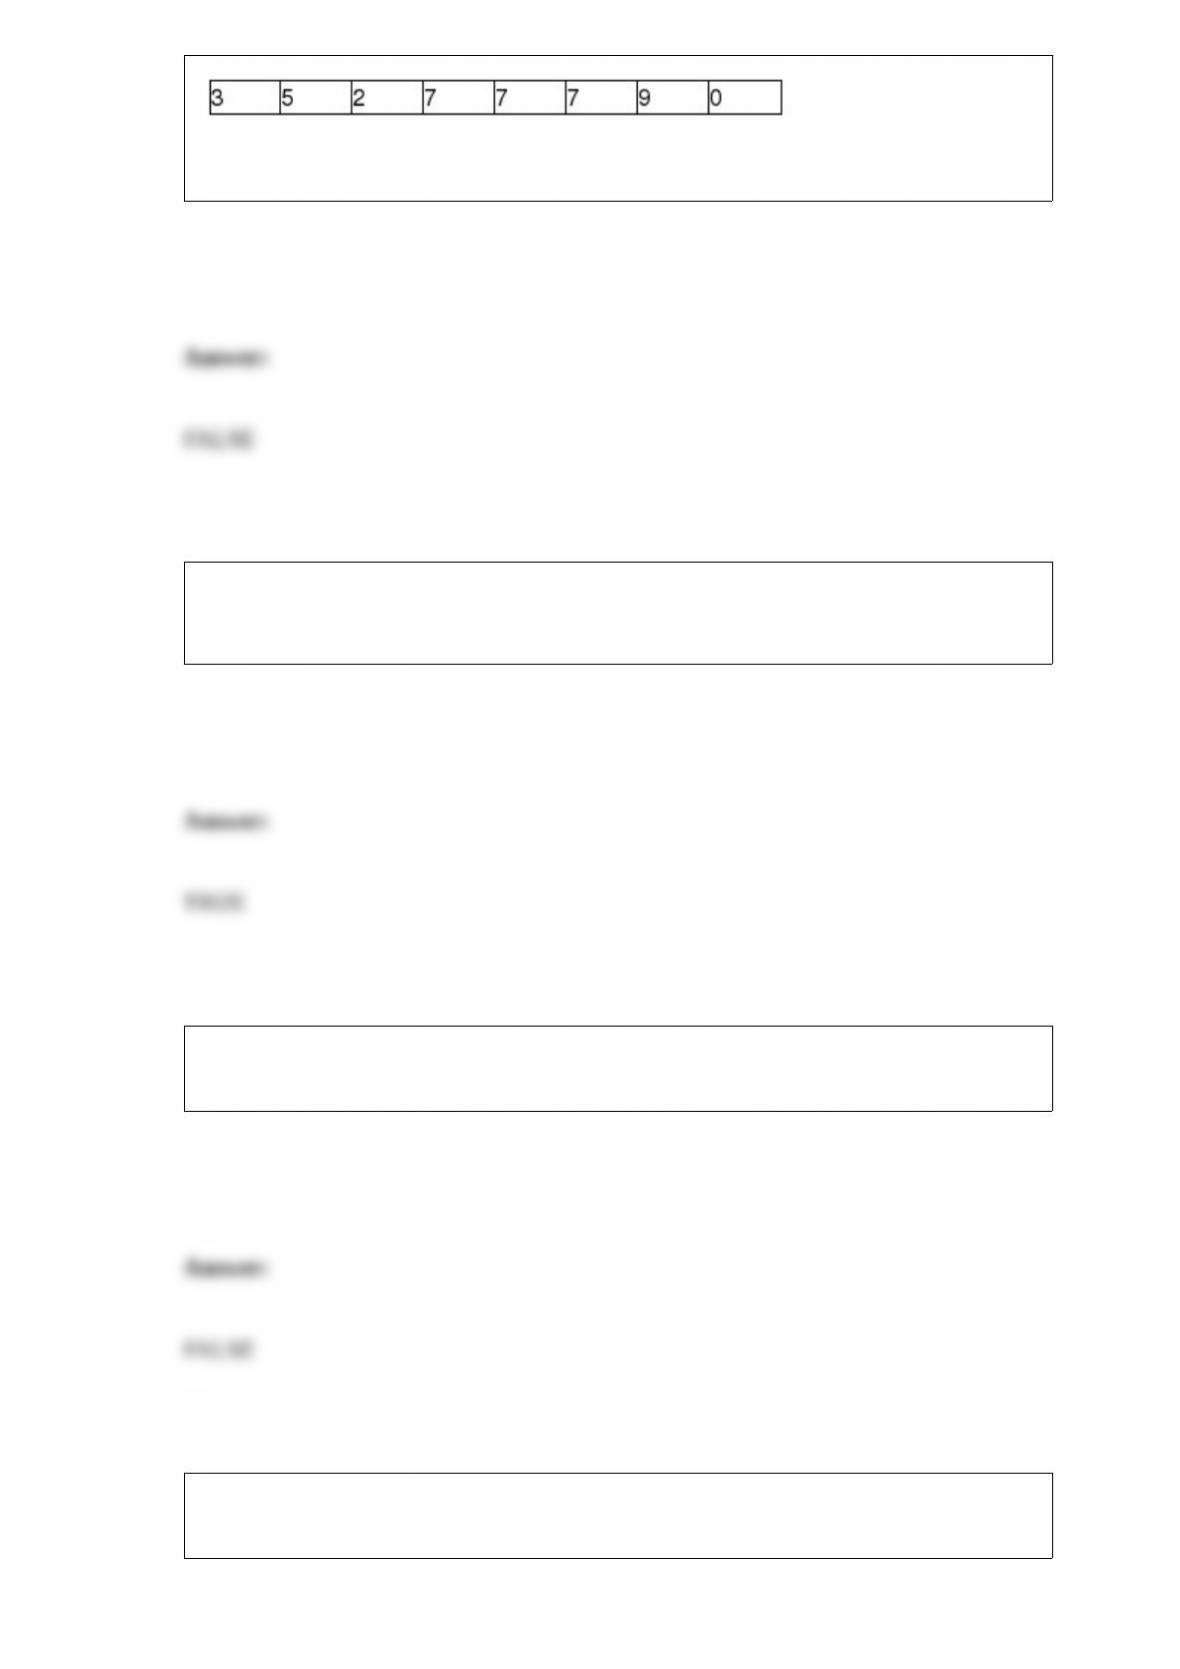
A frozen food company that makes burritos currently has employees making burritos by
hand. It is considering purchasing equipment to automate the process and wants to
determine if the automated process would result in lower variability of burrito weights.
It takes a random sample from each process as shown below.
To conduct a hypothesis test using a 0.05 level of significance, the critical value is
3.347.
The Varden Packaging Company has a contract to fill 50-gallon barrels with gasoline
for use by the U.S. Army. The machine that Varden uses has an adjustable device that
allows the average fill per barrel to be adjusted as desired. However, the actual
distribution of fill volume from the machine is known to be normally distributed with a
standard deviation equal to 0.5 gallons. The contract that Varden has with the military
calls for no more than 2 percent of all barrels to contain less than 49.2 gallons of
gasoline. In order to meet this requirement, Varden should set the mean fill to
approximately 50.225 gallons.
If the standard error for the sampling distribution of a proportion is equal to 0.0327 and
if the population proportion, p, is equal to .80, the sample size must be 150.
The advantage of using the interquartile range as a measure of variation is that it utilizes
all the data in its computation.
When determining sample size for a proportion, the farther that p is from 0.5, the
smaller the resulting sample size will be.
The makers of furnace filters recently conducted a test to determine whether the median
number of particulates that would pass through their four leading filters was the same. A
random sample of 6 of each type of filter was used with the following data being
recorded:
If the managers are unwilling to assume that the populations are normally distributed,
the appropriate test in this case would be the Mann-Whitney U test.
The actual weight of 2-pound sacks of salted peanuts is found to be normally
distributed with a mean equal to 2.04 pounds and a standard deviation of 0.25 pounds.
Given this information, the probability of a sack weighing more than 2.40 pounds is
0.4251.
A used car lot has 15 cars. Five of these cars were manufactured in the United States
and the others were made in other countries. If one car is purchased at random from this
car lot, the probability that it is a U.S. car is 0.33.
A one-tailed hypothesis test for a population variance always has the rejection region in
the upper tail.
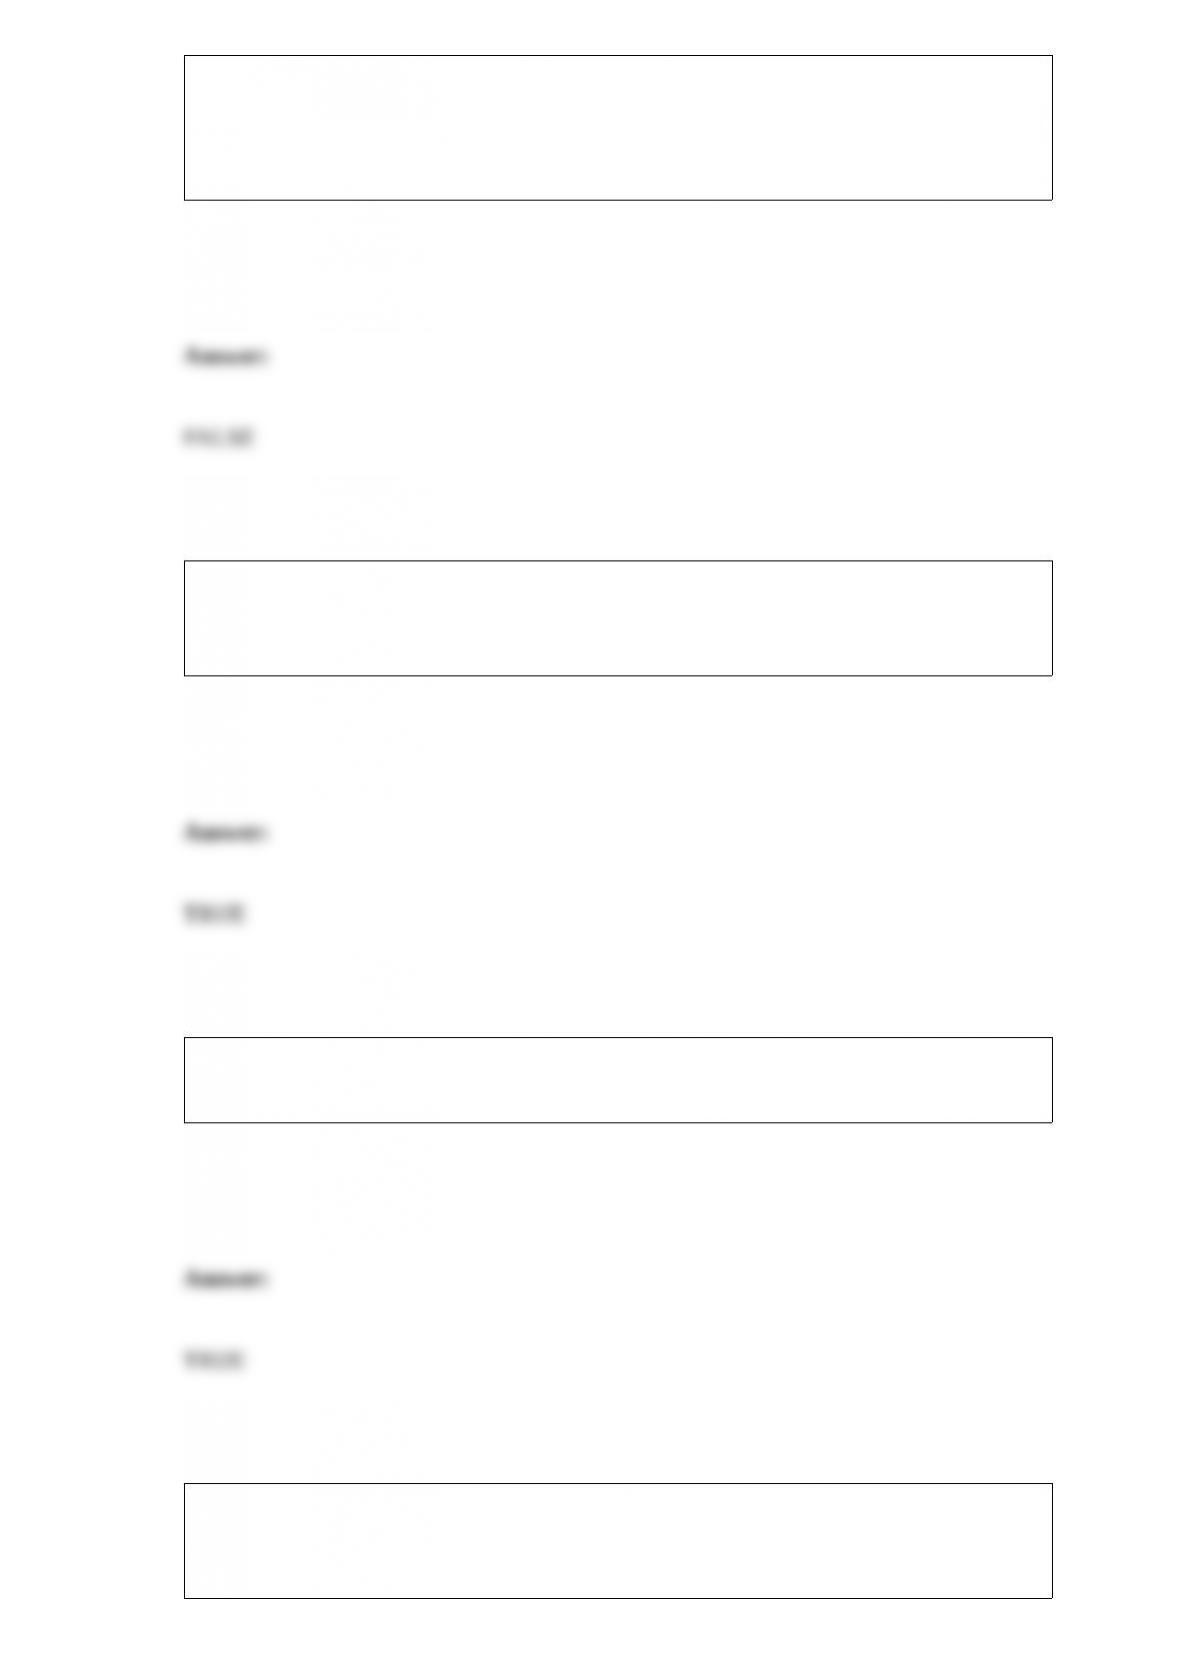
The Good-Guys Car Dealership has tracked the number of used cars sold at its
downtown dealership. Consider the following data as representing the population of
cars sold in each of the 8 weeks that the dealership has been open.
The population variance is approximately 9.43.
In a two-tailed hypothesis test for the difference between two population variances, if s1
= 3 and s2 = 5, then the test statistic is F = 2.7778.
If two variables are graphed on the same line chart, two separate scales are always
required.
Based on the empirical rule we can assume that all bell-shaped distributions have
approximately 95 percent of the values within 2 standard deviations of the mean.
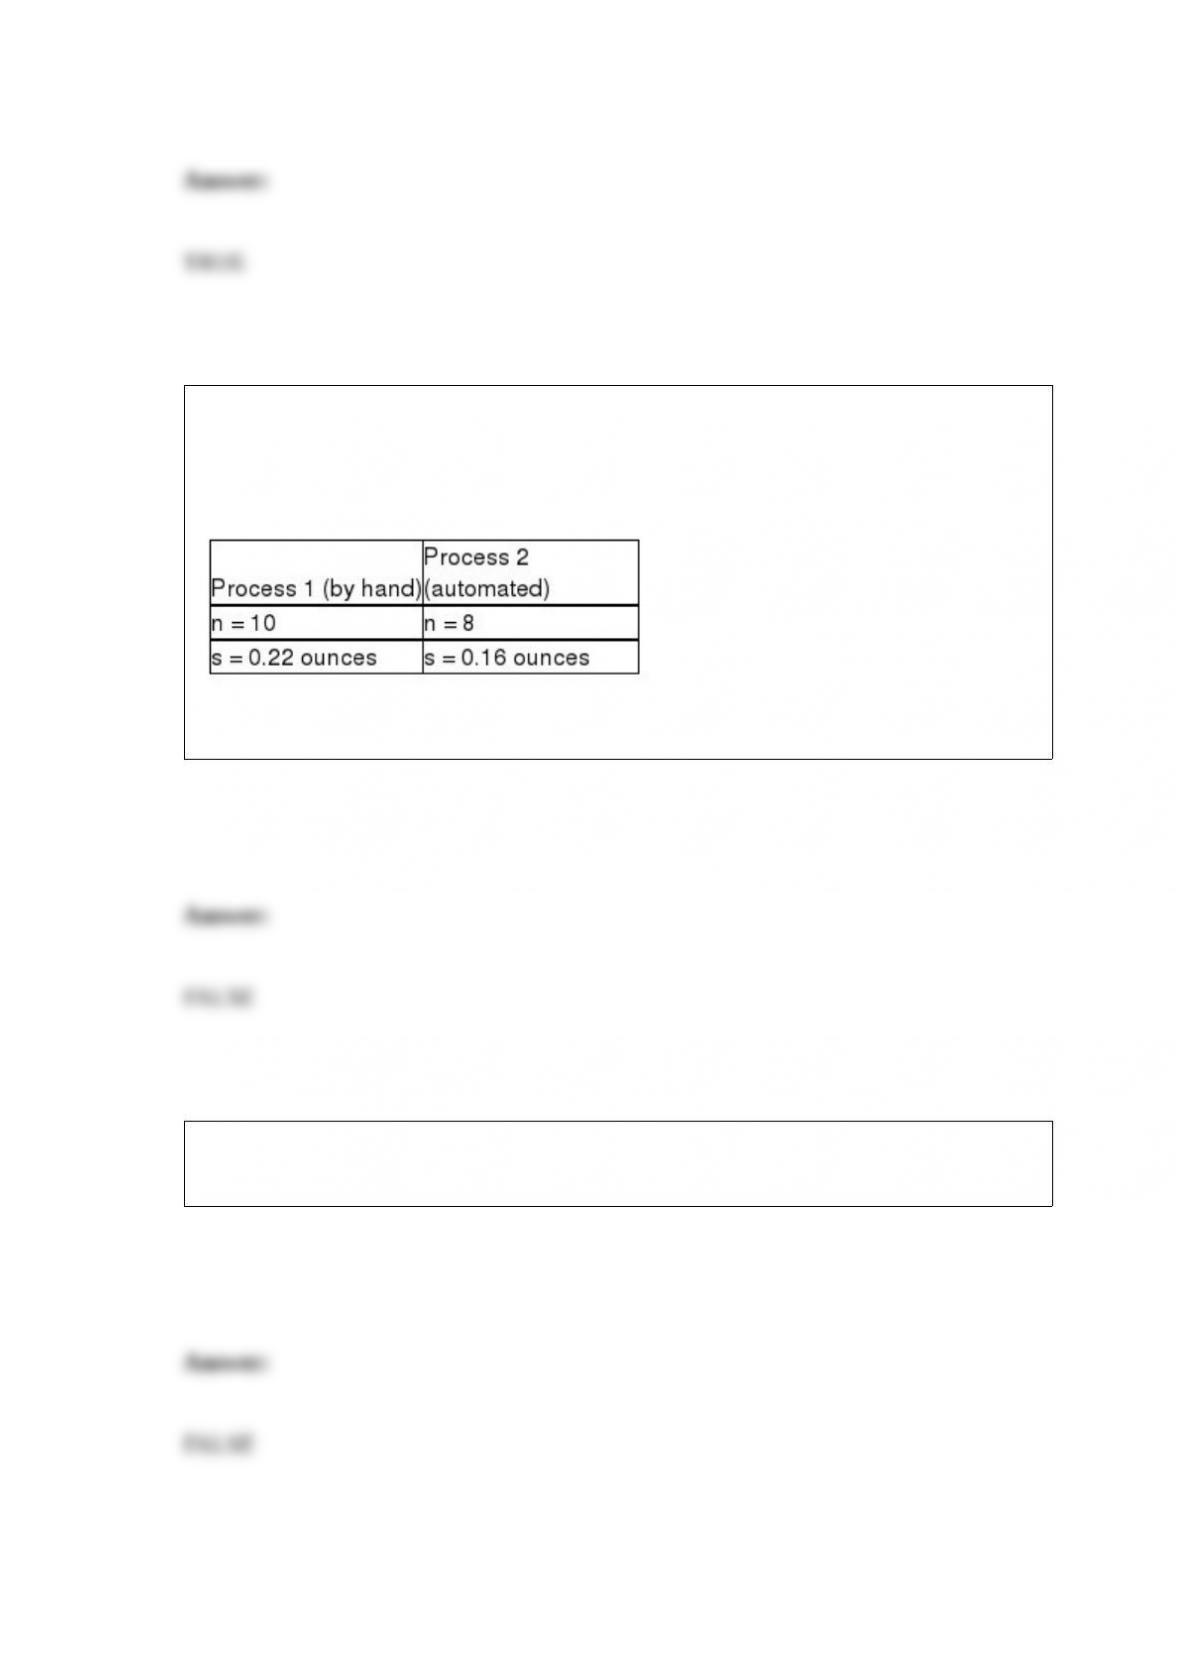
A frozen food company that makes burritos currently has employees making burritos by
hand. It is considering purchasing equipment to automate the process and wants to
determine if the automated process would result in lower variability of burrito weights.
It takes a random sample from each process as shown below.
In conducting the hypothesis test, the test statistic is F = 1.375.
A sampling distribution is the distribution of the individual values that are included in a
sample from a population.
A stem and leaf diagram is more appropriate for graphically displaying a joint
frequency distribution than is a histogram since the stems can be used to display one
variable while the leaves can be used to display the second variable.
The F-distribution is used to test whether two sample variances are equal.
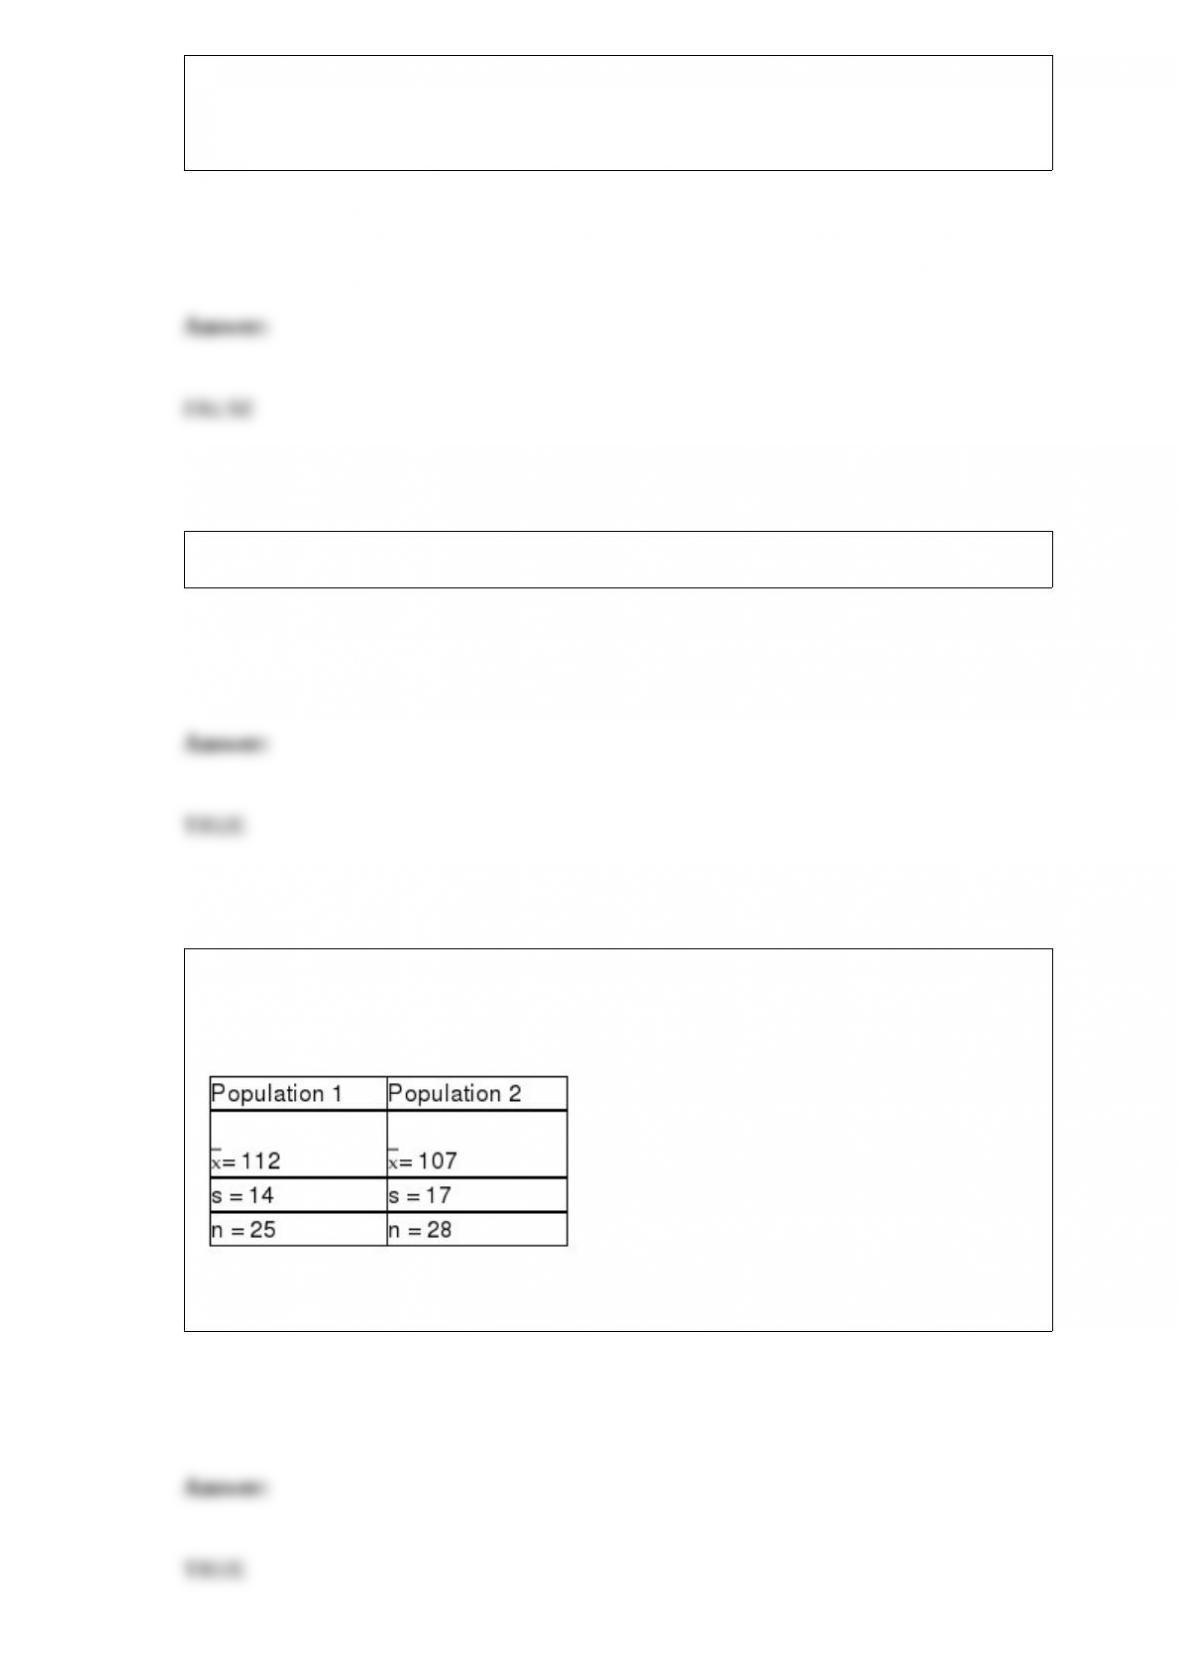
In order to test the difference in populations means, samples were collected for two
independent populations where the variances are assumed equal and the population
normally distributed. The following data resulted:
The value of the pooled standard deviation is 15.66.
A histogram can be used to display a joint frequency distribution between two
quantitative variables.
In a report describing the number of people in the family of each of the 400 employees
at a manufacturing company, the frequency count at the value 3 was 220. This means
that the relative frequency at the 3 level is .44.
Suppose the time it takes for a customer to be served at a fast-food chain business is
thought to be uniformly distributed between 3 and 8 minutes, then the probability that it
will take exactly 5 minutes is 0.20.
The one sure thing that can be said about a point estimate is that it will most likely be
subject to sampling error and not equal the parameter.
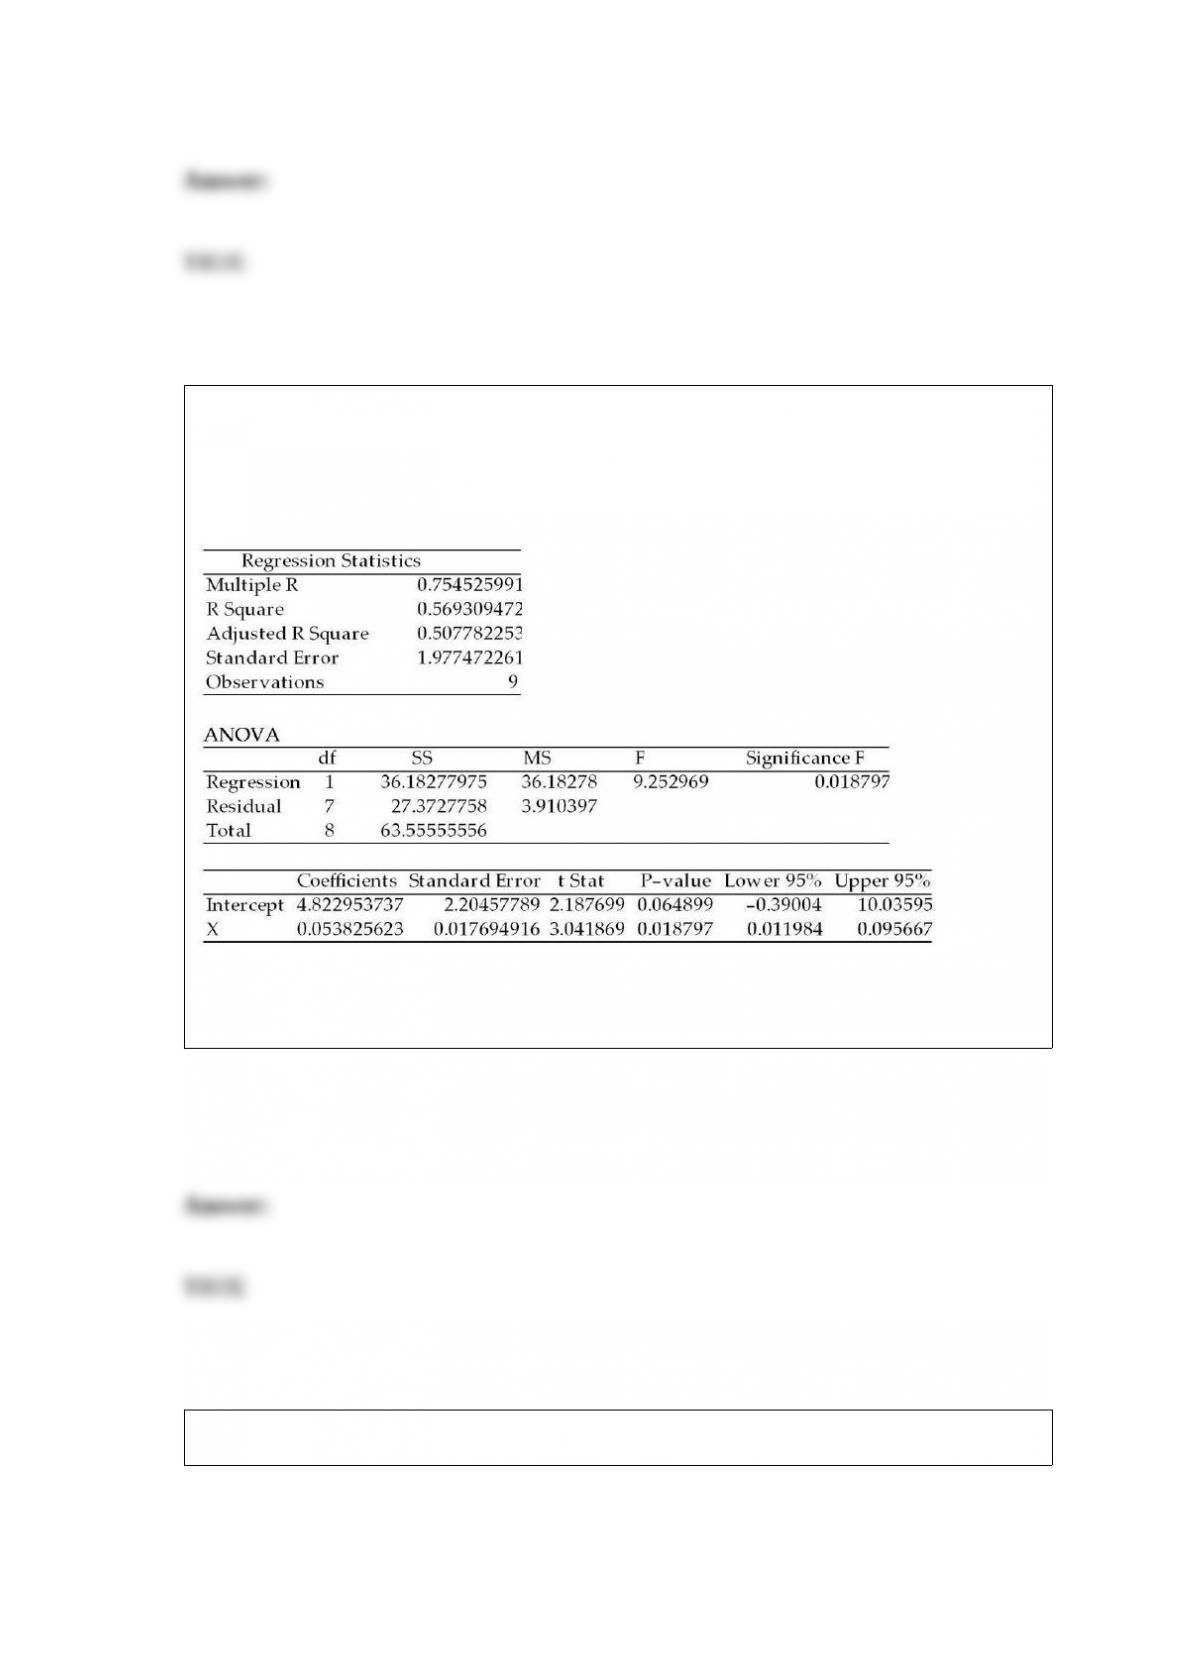
A study was recently done in which the following regression output was generated
using Excel.
SUMMARY OUTPUT
Given this output, we would reject the null hypothesis that the population regression
slope coefficient is equal to zero at the alpha = 0.05 level.
A sample proportion can be assumed normally distributed if n ≥ 30.
A university computer lab manager wishes to estimate the mean time that students stay
in the lab per visit. She believes that the population standard deviation would be no
larger than 10 minutes. Further, she wishes to have a confidence level of 90 percent and
a margin of error of 2.00 minutes. Given this, the sample size that she uses is
approximately 60 students.
When stratified random sampling is employed, the population is divided into
homogeneous subgroups called strata.
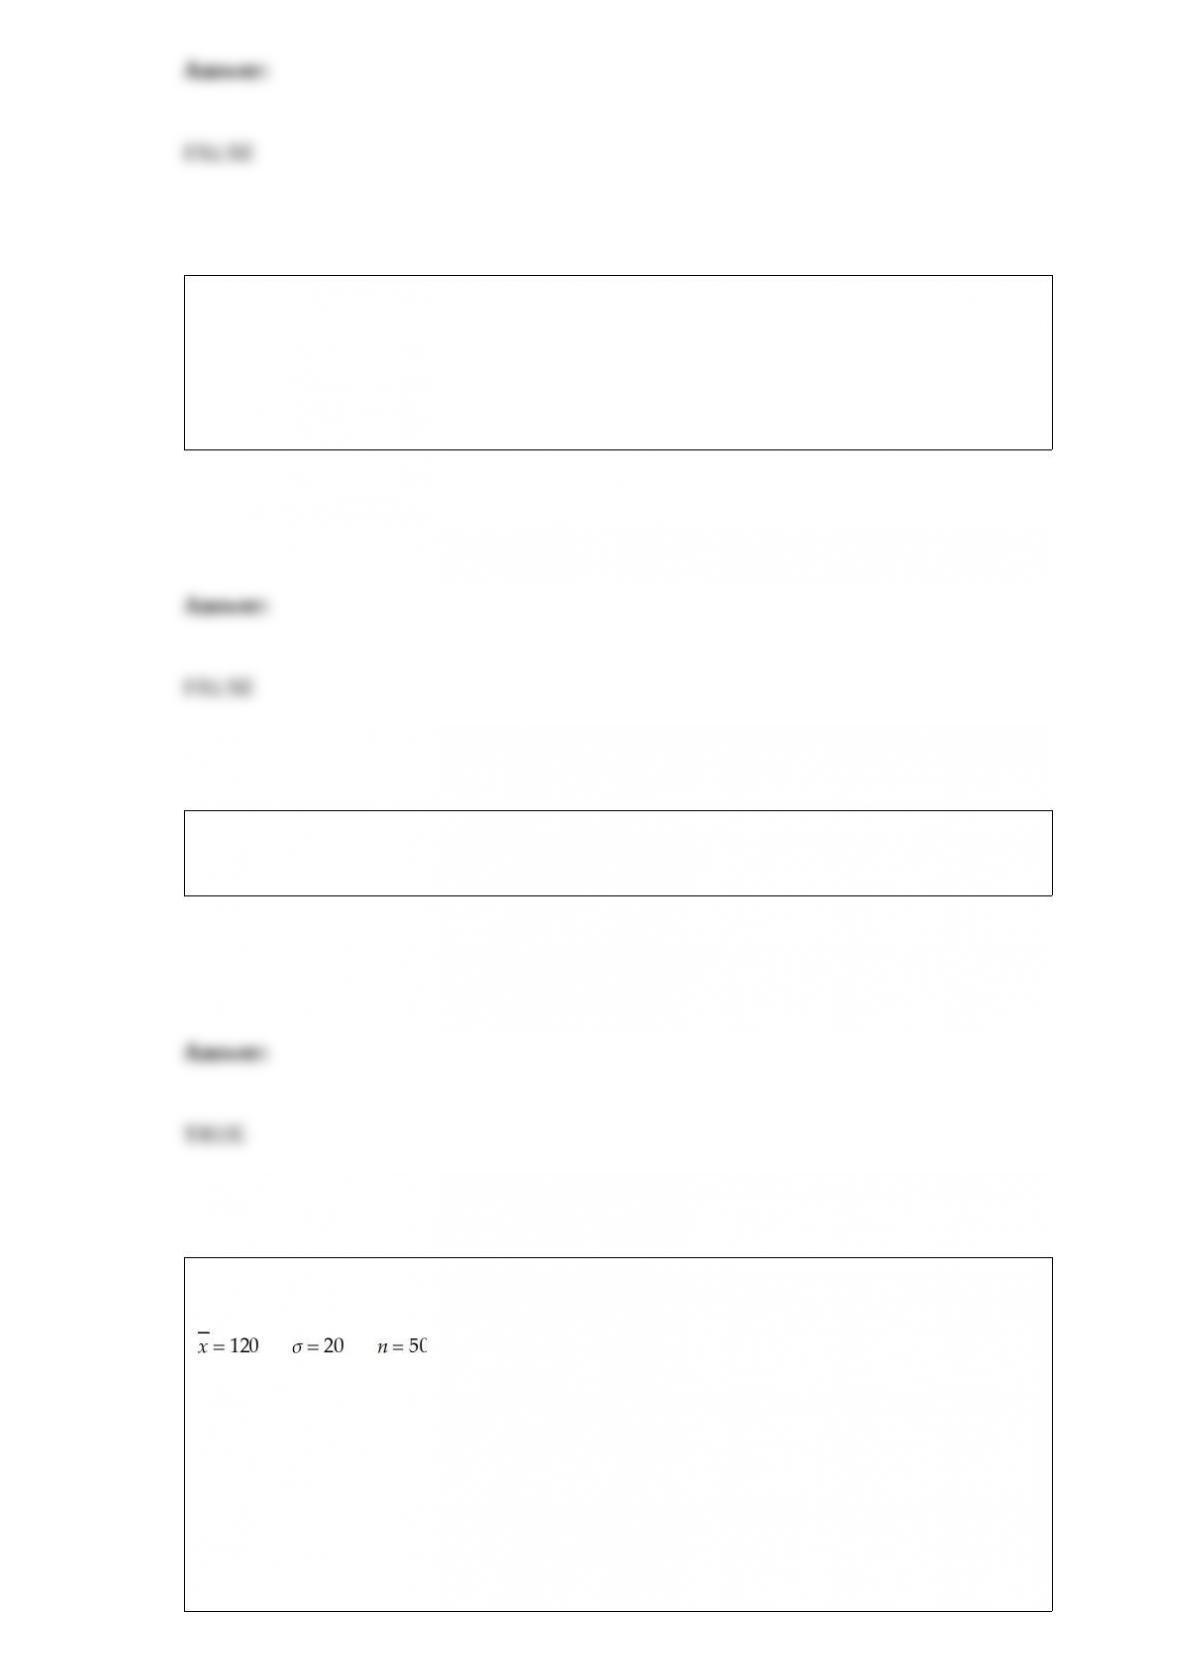
Construct a 98% confidence interval estimate for the population mean given the
following values:
A) (113.41, 126.59)
B) (117.46, 122.54)
C) (113.67, 126.33)
D) (113.13, 126.87)

Which of the following measures is not affected by extreme values in the data?
A) The mean
B) The median
C) The range
D) The standard deviation
The National Association of Realtors released a survey indicating that a surprising 43%
of first-time home buyers purchased their homes with no-money-down loans during
2005. The fear is that house prices will decline and leave homeowners owing more than
their homes are worth. PMI Mortgage Insurance estimated that there existed a 50% risk
that prices would decline within two years in major metro areas such as San Diego,
Boston, Long Island, New York City, Los Angeles, and San Francisco. A survey taken
by realtors in the San Francisco area found that 12 out of the 20 first-time home buyers
sampled purchased their home with no-money-down loans. Calculate the probability
that at least 12 in a sample of 20 first-time buyers would take out no-money-down loans
if San Francisco’s proportion is the same as the nationwide proportion of
no-money-down loans.
A) 0.0618
B) 0.0124
C) 0.0512

D) 0.0441
Recently, a bank manager pulled a sample of customer accounts and recorded data for
two variables, checking account balance and total number of transactions during the
previous 30 days. The data collected would be considered time-series data.
The number of customers who enter a bank is thought to be Poisson distributed with a
mean equal to 10 per hour. What are the chances that no customers will arrive in a
15-minute period?
A) Approximately zero
B) 0.0067
C) 0.0821
D) 0.0250

The makers of Sweet-Things candy sell their candy by the box. Based on company
policy, the mean target weight of all boxes is 2.0 pounds. To make sure that they are not
putting too much in the boxes, the manager wants no more than 3 percent of all boxes
to contain more than 2.10 pounds of candy. In order to do this, with a mean weight of 2
pounds, what must the standard deviation be? Assume that the box weights are
normally distributed.
A) Approximately 0.05 pounds
B) -0.133 pounds
C) 1.144 pounds
D) None of the above
Most major airlines allow passengers to carry two pieces of luggage (of a certain
maximum size) onto the plane. However, their studies show that the more carry-on
baggage passengers have, the longer it takes to unload and load passengers. One
regional airline is considering changing its policy to allow only one carry-on per
passenger. Before doing so, it decided to collect some data. Specifically, a random
sample of 1,000 passengers was selected. The passengers were observed, and the
number of bags carried on the plane was noted. Out of the 1,000 passengers, 345 had
more than one bag.
The domestic version of Boeing’s 747 has a capacity for 568 passengers. Determine an
interval estimate of the number of passengers that you would expect to carry more than
one piece of luggage on the plane. Assume the plane is at its passenger capacity.
A) (171.651, 216.214)
B) (174.412, 217.218)
C) (181.514, 208.313)
D) (179.20, 212.716)

Suppose that a population is known to be normally distributed with mean = 2,000 and
standard deviation = 230. If a random sample of sizen = 8 is selected, calculate the
probability that the sample mean will exceed 2,100.
A) 0.2141
B) 0.1871
C) 0.0712
D) 0.1093
The Chamber of Commerce in a large Midwestern city has stated that 70 percent of all
business owners in the city favor increasing the downtown parking fees. The city
council has commissioned a random sample of n = 100 business owners. Of these, 63
said that they favor increasing the parking fees. What is the probability of 63 or fewer
favoring the idea if the Chamber’s claim is correct?
A) Approximately 0.0630
B) About 0.4370
C) Nearly 0.20
D) About 0.9370
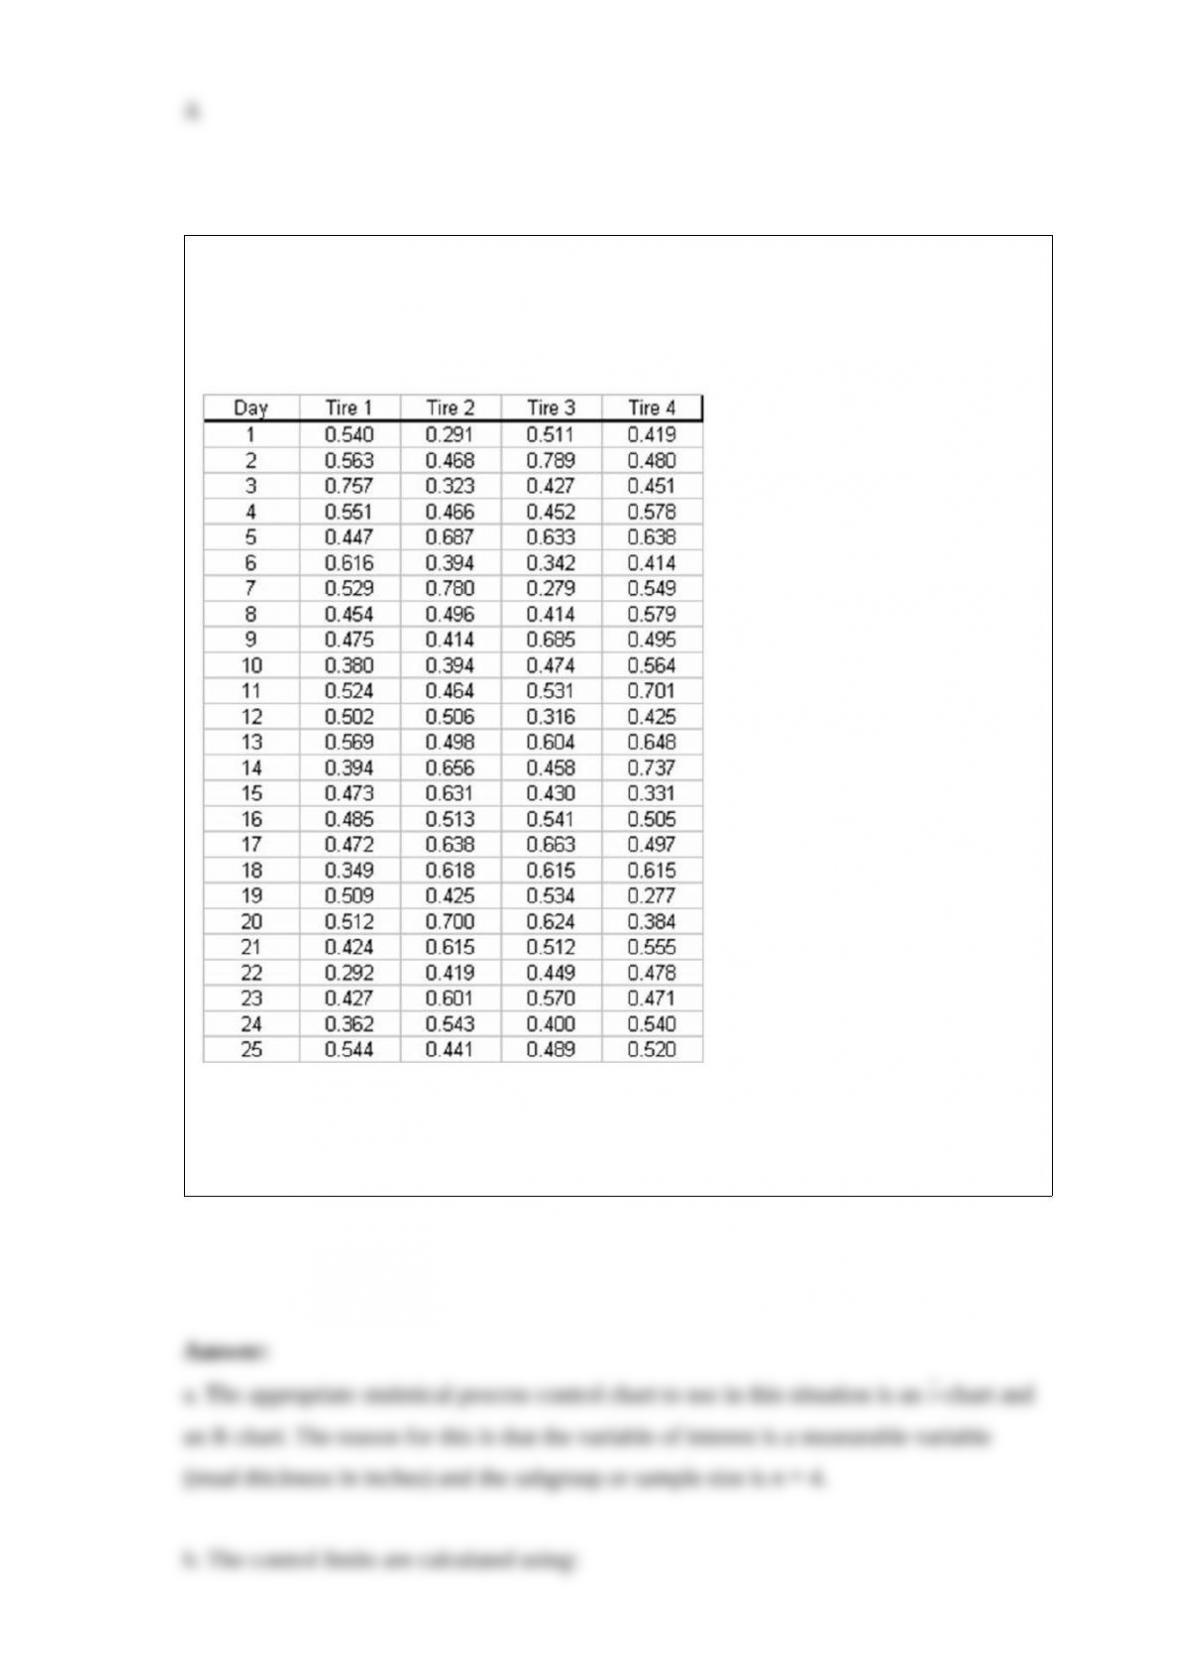
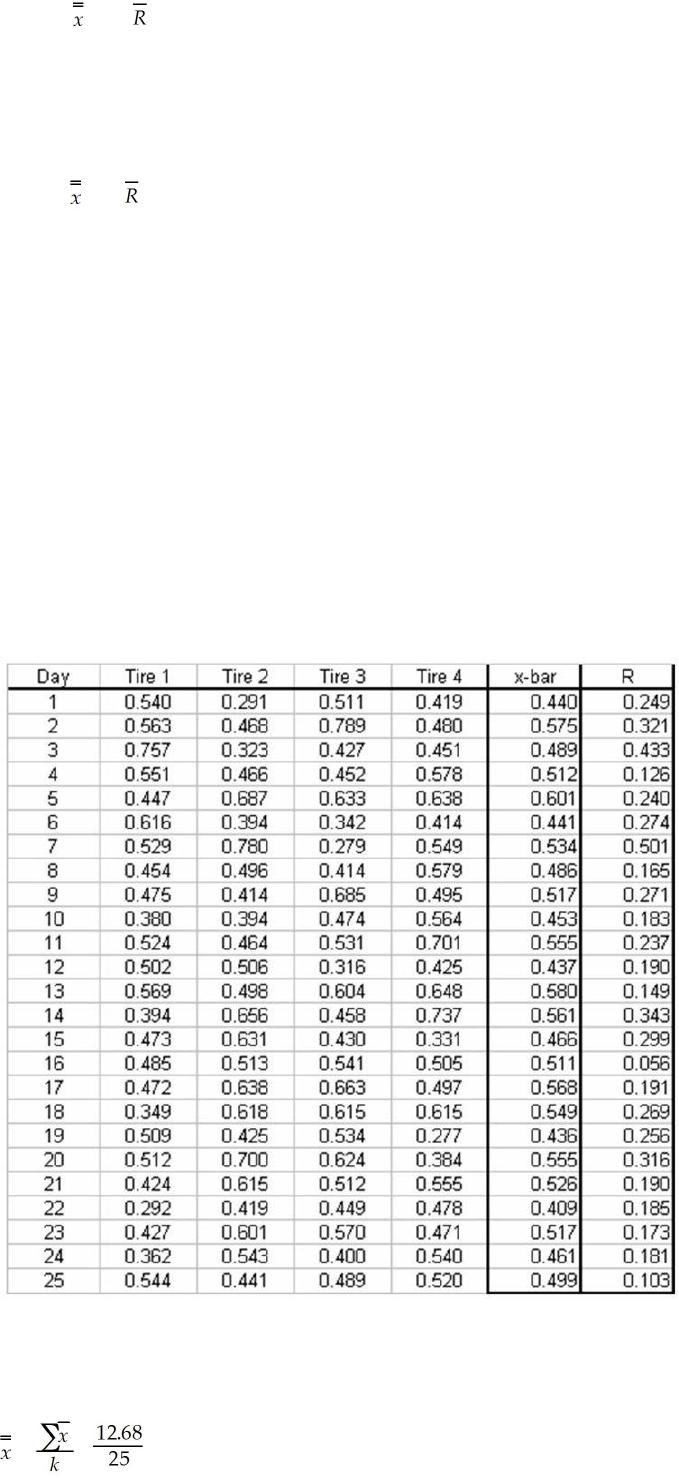
A tire company is interested in monitoring the process that produced tread thickness on
its tires. Every hour 4 tires are selected from production and the tread thickness is
measured. Data for the past 25 days is shown as follows:
a. What type of control chart would you recommend be used in this case?
b. Compute the upper and lower control limits for these data.

The following model:
y = β0 + β1x1 + β2x2 + β3x1x2 + ε
A) is a linear model with interaction.
B) is a second order polynomial model.
C) is a composite model.
D) is a convex model.
A traffic engineer plans to estimate the average number of cars that pass through an
intersection each day. Based on previous studies the standard deviation is believed to be
52 cars. She wants to estimate the mean to within 10 cars with 90 percent confidence.
The needed sample size for n is:
A) n = 104 days.
B) n = 74 days.
C) n = 10 days.
D) n = 9 days.
Which of the following is the minimum number of required replications per cell for a
two-factor ANOVA design if you plan to test for interactive effects between factors A
and B?

A) 3
B) 1
C) 2
D) 5
The U.S. Bureau of Labor Statistics (www.bls.gov) released its Consumer Expenditures
report in October 2008. Among its findings is that average annual household spending
on food at home was $3,624. Suppose a random sample of 137 households in Detroit
was taken to determine whether the average annual expenditure on food at home was
less for consumer units in Detroit than in the nation as a whole. The sample results are
in the file Detroit Eats. Based on the sample results, can it be concluded at the α = 0.02
level of significance that average consumer-unit spending for food at home in Detroit is
less than the national average?
A) Because t = -13.2314 is less than the critical t value of -1.4126, do not reject H0.
The annual average consumer unit spending for food at home in Detroit is not less than
the 2006 national consumer unit average
B) Because t = -13.2314 is less than the critical t value of -1.4126, reject H0.
The annual average consumer unit spending for food at home in Detroit is less than the
2006 national consumer unit average
C) Because t = -15.7648 is less than the critical t value of -2.0736, do not reject H0.
The annual average consumer unit spending for food at home in Detroit is not less than
the 2006 national consumer unit average.
D) Because t = -15.7648 is less than the critical t value of -2.0736, reject H0.
The annual average consumer unit spending for food at home in Detroit is less than the
2006 national consumer unit average.
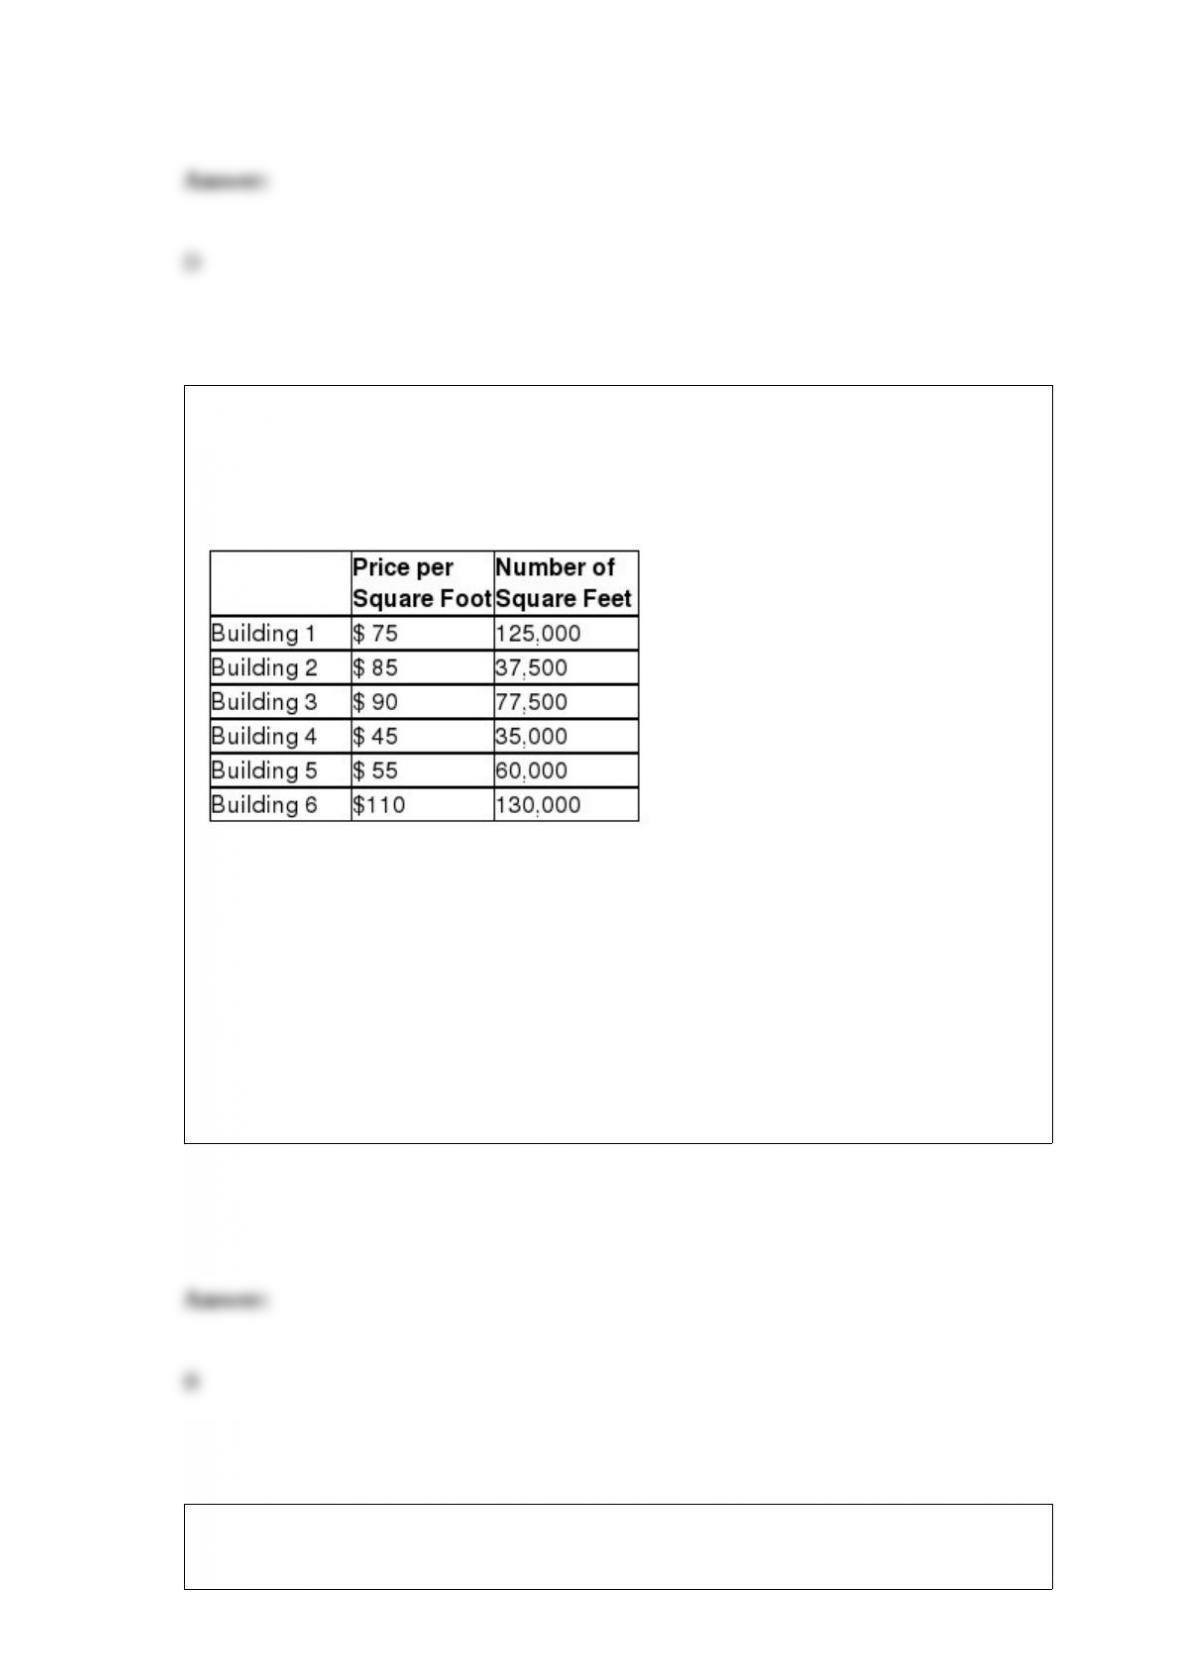
Todd Lindsey & Associates, a commercial real estate company located in Boston, owns
six office buildings in the Boston area that it leases to businesses. The lease price per
square foot differs by building due to location and building amenities. Currently, all six
buildings are fully leased at the prices shown here.
Compute the weighted average (mean) price per square foot for these buildings.
A) 86.25
B) 83.25
C) 80.15
D) 86.15
Which of the following is NOT one of the assumptions required by the randomized
block design?

A) The populations are normally distributed.
B) The populations have equal means.
C) The observations within samples are independent.
D) The data measurement must be interval or ratio level.
Which of the following tests would not be an example of nonparametric method?
A) Wilcoxon signed-rank test
B) Mann-Whitney U-Test
C) Kruskal-Wallis One-Way Analysis of Variance
D) χ2 test
Which of the following is not an indication of potential multicollinearity problems?
A) The sign on the standard error of the estimate is positive.
B) A sign on a regression slope coefficient is negative when the sign on the correlation
coefficient was positive.
C) The standard error of the estimate increases when a variable enters the model in the
presence of other independent variables.
D) An independent variable goes from being statistically significant to being
insignificant when a new variable is added to the model.
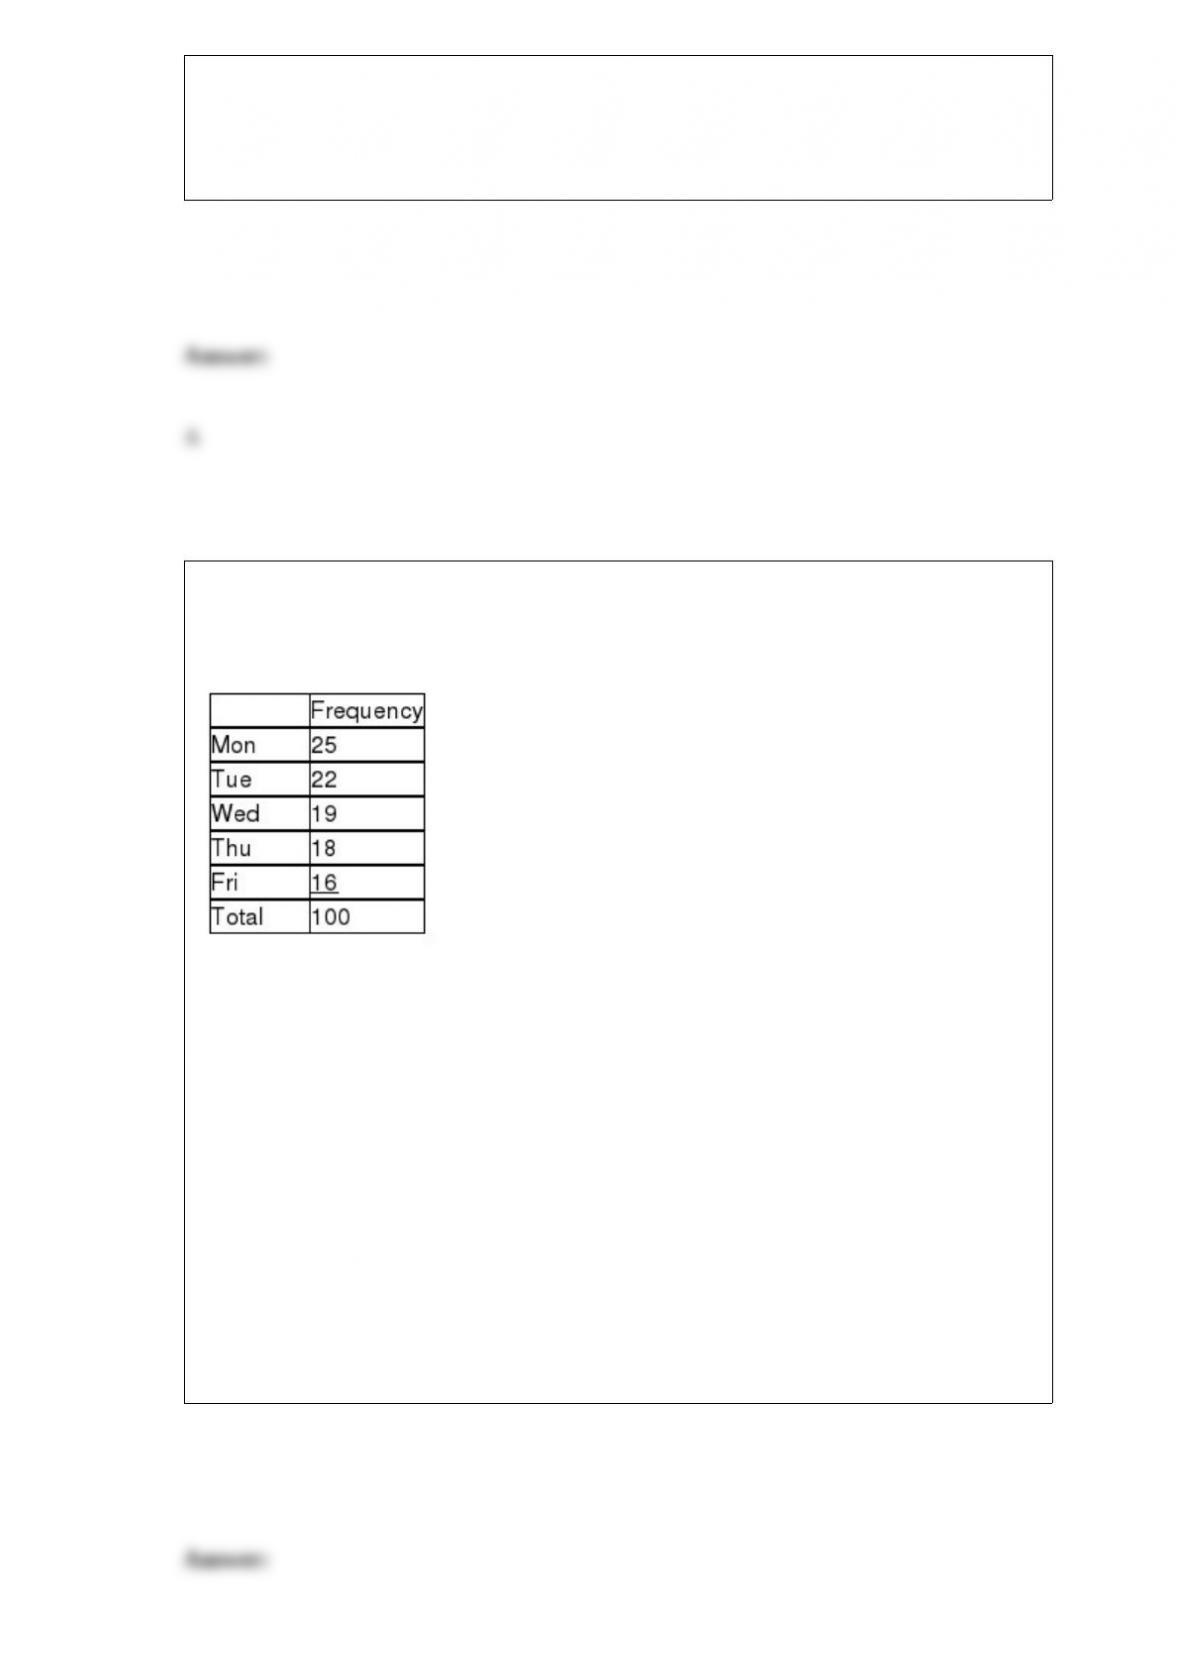
A walk-in medical clinic believes that arrivals are uniformly distributed over weekdays
(Monday through Friday). It has collected the following data based on a random sample
of 100 days.
Based on these data, conduct a goodness-of-fit test using a 0.10 level of significance.
Which conclusion is correct?
A) Arrivals are not uniformly distributed over the weekday because (test statistic) >
(critical value).
B) Arrivals are uniformly distributed over the weekday because (test statistic) > (critical
value).
C) Arrivals are not uniformly distributed over the weekday because (test statistic) <
(critical value).
D) Arrives are uniformly distributed over the weekday because (test statistic) < (critical
value).

Which one of the following is not a source of variation?
A) People
B) Measurement
C) Materials
D) Control
Hypothesis testing and estimation are two statistical tools that are used to draw
inferences about a large data set based on a subset of the data.
When the world’s largest retailer, Walmart, decided to enter the grocery marketplace in
a big way with its “Super Stores,” it changed the retail grocery landscape in a major
way. The other major chains such as Albertsons have struggled to stay competitive. In
addition, regional discounters such as WINCO in the western United States have made
it difficult for the traditional grocery chains. Recently, a study was conducted in which a
“market basket” of products was selected at random from those items offered in three
stores in Boise, Idaho: Walmart, Winco, and Albertsons. At issue was whether the mean
prices at the three stores are equal or whether there is a difference in prices. The sample

data are in the data file called Food Price Comparisons. Using an alpha level equal to
0.05, test to determine whether the three stores have equal population mean prices. If
you conclude that there are differences in the mean prices, perform the appropriate
posttest to determine which stores have different means.
A) There is no difference between the three mean prices.
B) Based on the sample data, we conclude that Winco is significantly different (higher)
than Albertsons and Walmart in terms of average prices. However, we can make no
conclusion about Albertsons and Walmart.
C) Based on the sample data, we conclude that Walmart is significantly different
(higher) than Albertsons and Winco in terms of average prices. However, we can make
no conclusion about Albertsons and Winco.
D) Based on the sample data, we conclude that Albertsons is significantly different
(higher) than Walmart and Winco in terms of average prices. However, we can make no
conclusion about Walmart and Winco.
A report on spending by adults on recreation stated the following: At least 75 percent of
the people in the survey spend between $750 and $1,250 per year. The report also said
that at least 88 percent spend between $625 and $1,375 per year. Given this
information, which of the following is most apt to be true?
A) The standard deviation is approximately $125.
B) The distribution of spending on recreation can be assumed to be bell-shaped.
C) The standard deviation is approximately $187.5.
D) The standard deviation is approximately $250.

In a situation where the population standard deviation is known and we wish to estimate
the population mean with 90 percent confidence, what is the appropriate critical value
to use?
A) z = 1.96
B) z = 2.33
C) z = 1.645
D) Can’t be determined without knowing the degrees of freedom.
The chamber of commerce in a beach resort town wants to estimate the proportion of
visitors who are repeat visitors. Suppose that they have estimated that they need a
sample size of n=16,577 people to achieve a margin of error of .01 percentage points
with 99 percent confidence, but this is too large a sample size to be practical. How can
they reduce the sample size?
A) Use a higher level of confidence
B) Use a smaller margin or error
C) Use a lower level of confidence
D) Conduct a census

The URS construction company has submitted two bids, one to build a large hotel in
London and the other to build a commercial office building in New York City. The
company believes it has a 40% chance of winning the hotel bid and a 25% chance of
winning the office building bid. The company also believes that winning the hotel bid is
independent of winning the office building bid.
What is the probability the company will win at least one contract?
A) 0.55
B) 0.45
C) 0.10
D) 0.75
Suppose that a group of 10 people join a weight loss program for 3 months. Each
person’s weight is recorded at the beginning and at the end of the 3-month program. To
test whether the weight loss program is effective, the data should be treated as:
A) independent samples using the normal distribution.
B) paired samples using the t-distribution.
C) independent samples using the t-distribution.
D) independent proportions.

One of the key differences between a bar chart and histogram is:
A) the histogram contains gaps between the bars and the bar chart does not.
B) a bar chart is used to display a categorical variable and a histogram is used to display
the distribution of a quantitative variable.
C) the histogram shows relative frequency while the bar chart shows frequency.
D) the bar chart must be vertical while the histogram must be horizontal.
According to USA Today, customers are not settling for automobiles straight off the
production lines. As an example, those who purchase a $355,000 Rolls-Royce typically
add $25,000 in accessories. One of the affordable automobiles to receive additions is
BMW’s Mini Cooper. A sample of 179 recent Mini purchasers yielded a sample mean of
$5,000 above the $20,200 base sticker price. Suppose the cost of accessories purchased
for all Mini Coopers has a standard deviation of $1,500.
Calculate a 95% confidence interval for the average cost of accessories on Mini
Coopers.
A) (4850.33, 5149.67)
B) (4878.82, 5121.18)
C) (4788.86, 5211.14)
D) (4780.25, 5219.75)

An event is:
A) the list of possible outcomes that can occur from a selection or decision.
B) a collection of elementary events.
C) similar to an experiment but not controlled by the decision maker.
D) more frequently found in business than in other disciplines.
In a goodness-of-fit test about a population distribution, if one or more parameters are
left unspecified in H0, they must be estimated from the sample data. This will reduce
the degrees of freedom by ________ for each estimated parameter.
A) 1
B) 2
C) 3
D) None of the above