The following data represents the amount of money nine randomly selected people
spent on Father’s Day gifts.
$120 $74 $97 $136 $80 $112 $125 $105 $96
Describe the shape of this distribution as symmetrical, left-skewed, or right-skewed.
Hallmark would like to test the hypothesis that those celebrating Valentine’s Day will
spend more than an average of $125 on gifts. A random sample of 18 people celebrating
Valentine’s Day spent an average of $148.50 with a standard deviation of $34.90.
Hallmark would like to set α = 0.01. Use the p-value approach to test this hypothesis.
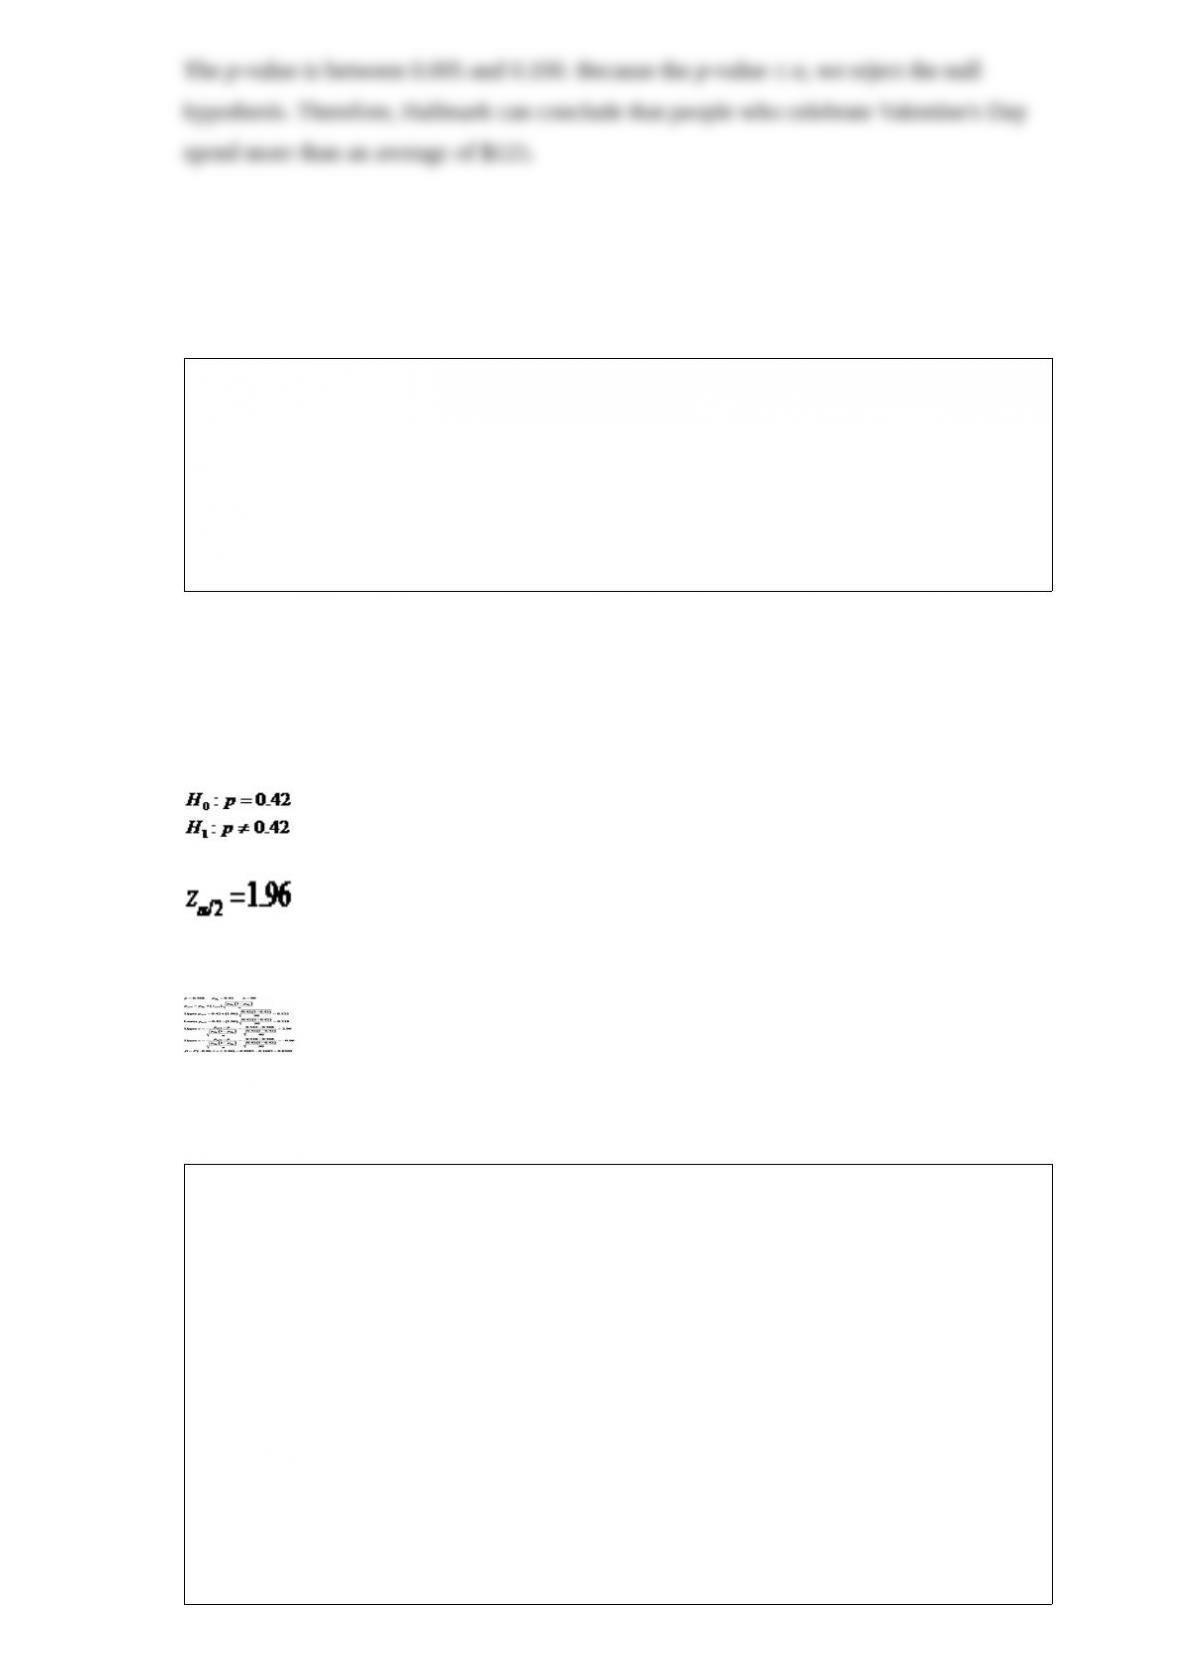
Hotels.com would like to test the hypothesis that the proportion of American travelers
in Europe that prefer an American-branded hotel equals 0.42. A random sample of 90
Americans found that 49 preferred American-branded hotels. Assume that the actual
proportion of American travelers in Europe who prefer American-branded hotels is
0.368. Hotels.com would like to set α = 0.05. Calculate the probability of a Type II
error.
Progressive Insurance would like to test the hypothesis that a difference exists in the
proportion of students in 12th grade who text while driving when compared to the
proportion of 11th grade drivers who text. A random sample of 160 12th grade students
found that 84 texted while driving. A random sample of 175 11th grade students found
that 70 texted while driving. If Population 1 is defined as 12th grade drivers and
Population 2 is defined as 11th grade drivers, the p-value for this hypothesis test is
________.
A) 0.0220
B) 0.0418
C) 0.1610
D) 0.1850
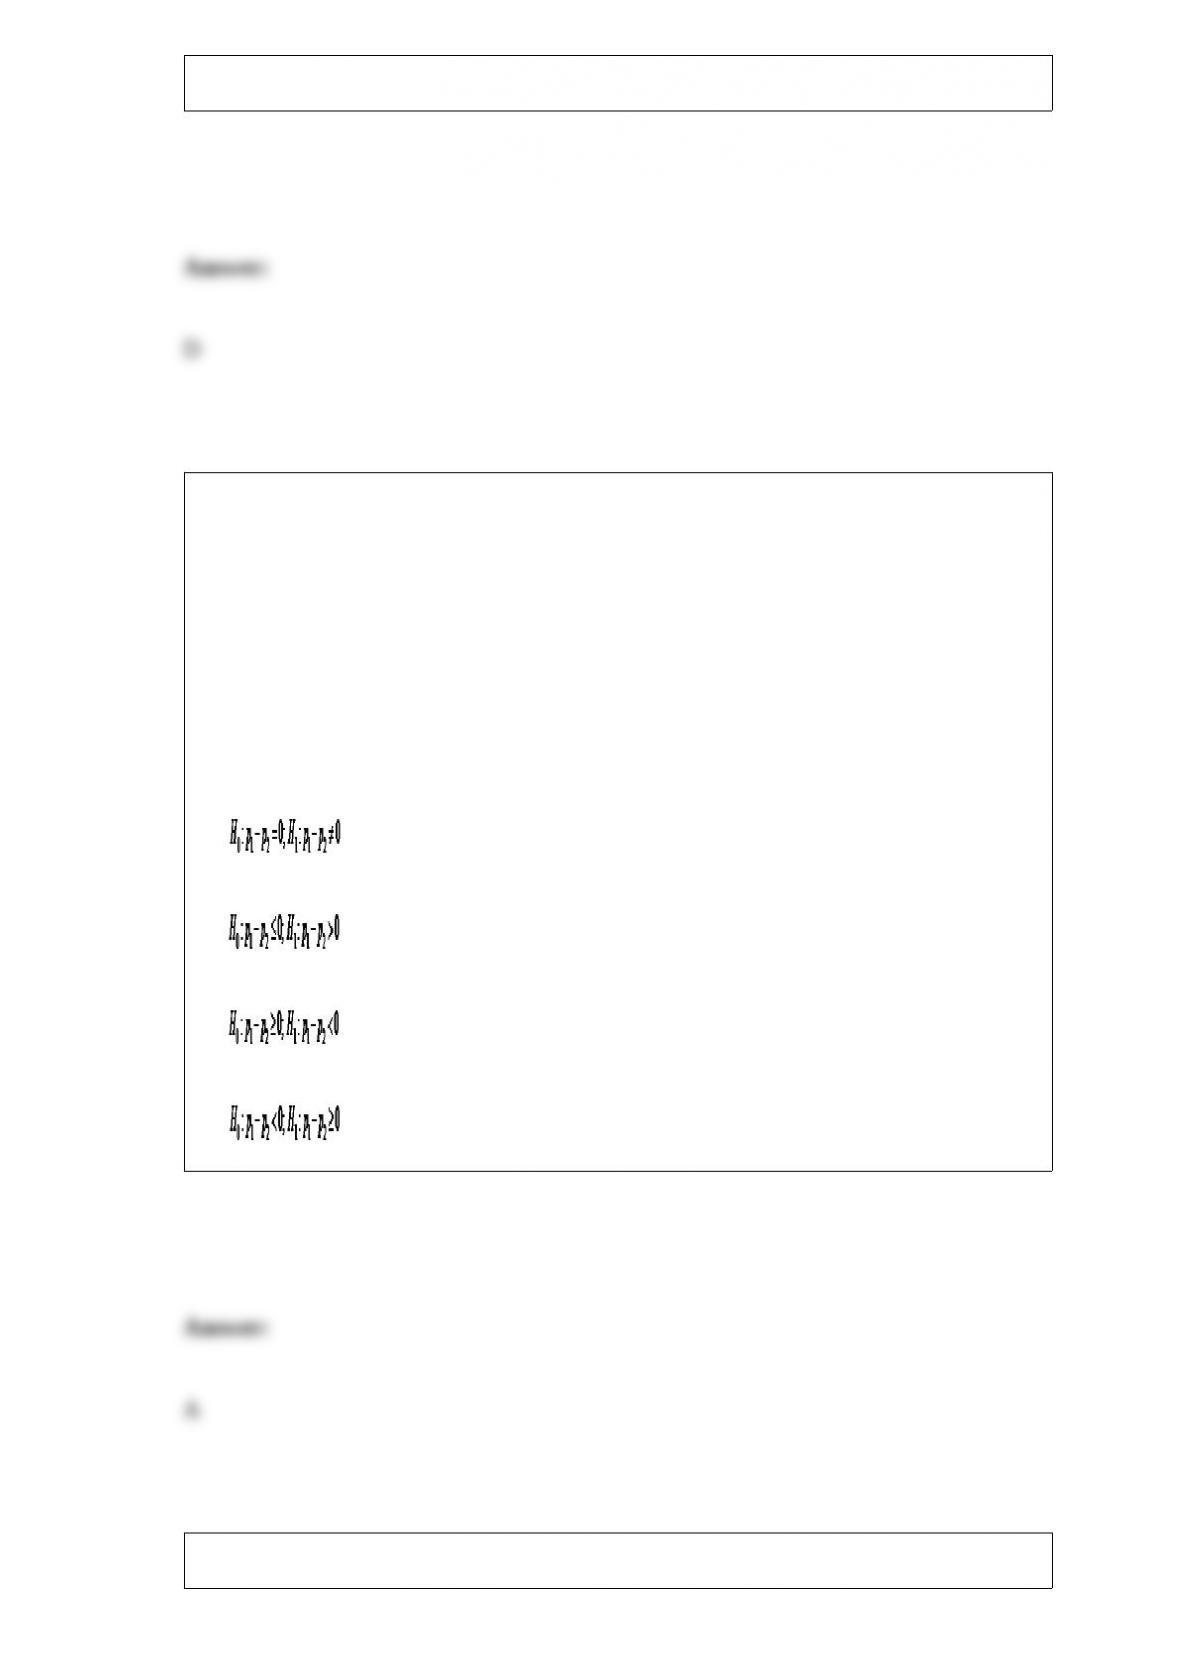
AT&T would like to test the hypothesis that the proportion of 18- to 34-year-old
Americans that own a cell phone is less than the proportion of 35- to 49-year-old
Americans. A random sample of 200 18- to 34-year-old Americans found that 126
owned a smartphone. A random sample of 175 35- to 49-year-old Americans found that
119 owned a smartphone. If Population 1 is defined as 18- to 34-year-old Americans
and Population 2 is defined as 35- to 49-year-old Americans, the correct hypothesis
statement for this hypothesis test would be _______________.
A)
B)
C)
D)
AT&T would like to test the hypothesis that the proportion of 18- to 34-year-old

Americans that own a cell phone is less than the proportion of 35- to 49-year-old
Americans. A random sample of 200 18- to 34-year-old Americans found that 126
owned a smartphone. A random sample of 175 35- to 49-year-old Americans found that
119 owned a smartphone. If Population 1 is defined as 18- to 34-year-old Americans
and Population 2 is defined as 35- to 49-year-old Americans, and using α = 0.01, the
conclusion for this hypothesis test would be that because the test statistic is
_______________________________________________________________.
A) less than the critical value, AT&T can conclude that the proportion of 18- to
34-year-old Americans that own a cell phone is less than the proportion of 35- to
49-year-old Americans
B) less than the critical value, AT&T cannot conclude that the proportion of 18- to
34-year-old Americans that own a cell phone is less than the proportion of 35- to
49-year-old Americans
C) more than the critical value, AT&T can conclude that the proportion of 18- to
34-year-old Americans that own a cell phone is less than the proportion of 35- to
49-year-old Americans
D) more than the critical value, AT&T cannot conclude that the proportion of 18- to
34-year-old Americans that own a cell phone is less than the proportion of 35- to
49-year-old Americans
AT&T would like to test the hypothesis that the proportion of 18- to 34-year-old
Americans that own a cell phone is less than the proportion of 35- to 49-year-old
Americans. A random sample of 200 18- to 34-year-old Americans found that 126
owned a smartphone. A random sample of 175 35- to 49-year-old Americans found that
119 owned a smartphone. If Population 1 is defined as 18- to 34-year-old Americans
and Population 2 is defined as 35- to 49-year-old Americans, and using α = 0.01, which
one of the following statements is true?
A) Because the p-value is less than α, AT&T cannot conclude that the proportion of 18-
to 34-year-old Americans that own a cell phone is less than the proportion of 35- to
49-year-old Americans.
B) Because the p-value is greater than α, AT&T cannot conclude that the proportion of
18- to 34-year-old Americans that own a cell phone is less than the proportion of 35- to

49-year-old Americans.
C) Because the p-value is less than α, AT&T can conclude that the proportion of 18- to
34-year-old Americans that own a cell phone is less than the proportion of 35- to
49-year-old Americans.
D) Because the p-value is greater than α, AT&T can conclude that the proportion of 18-
to 34-year-old Americans that own a cell phone is less than the proportion of 35- to
49-year-old Americans.
AT&T would like to test the hypothesis that the proportion of 18- to 34-year-old
Americans that own a cell phone is less than the proportion of 35- to 49-year-old
Americans. A random sample of 200 18- to 34-year-old Americans found that 126
owned a smartphone. A random sample of 175 35- to 49-year-old Americans found that
119 owned a smartphone. If Population 1 is defined as 18- to 34-year-old Americans
and Population 2 is defined as 35- to 49-year-old Americans, which one of the
following statements is true?
A) Because the 98% confidence interval does not include zero, AT&T can conclude that
the proportion of 18- to 34-year-old Americans that own a cell phone is less than the
proportion of 35- to 49-year-old Americans.
B) Because the 98% confidence interval does not include zero, AT&T cannot conclude
that the proportion of 18- to 34-year-old Americans that own a cell phone is less than
the proportion of 35- to 49-year-old Americans.
C) Because the 98% confidence interval includes zero, AT&T can conclude that the
proportion of 18- to 34-year-old Americans that own a cell phone is less than the
proportion of 35- to 49-year-old Americans.
D) Because the 98% confidence interval includes zero, AT&T cannot conclude that the
proportion of 18- to 34-year-old Americans that own a cell phone is less than the
proportion of 35- to 49-year-old Americans.

Experian would like to test the hypothesis that the average credit score for an adult in
Virginia is different from the average credit score for an adult in North Carolina. A
random sample of 40 adults in Virginia had an average credit score of 699 and a random
sample of 35 adults in North Carolina had an average credit score of 682. It is believed
that the population standard deviation for credit scores is 44 and 41 for Virginia and
North Carolina residents, respectively. Experian would like to set α = 0.05. Define
Population 1 as Virginia and Population 2 as North Carolina and use the p-value value
approach to test this hypothesis.
Experian would like to test the hypothesis that the average credit score for an adult in
Virginia is different from the average credit score for an adult in North Carolina. A
random sample of 40 adults in Virginia had an average credit score of 699 and a random
sample of 35 adults in North Carolina had an average credit score of 682. It is believed
that the population standard deviation for credit scores is 44 and 41 for Virginia and
North Carolina residents, respectively. Experian would like to set α = 0.05. Define
Population 1 as Virginia and Population 2 as North Carolina and use the p-value value
approach to test this hypothesis.
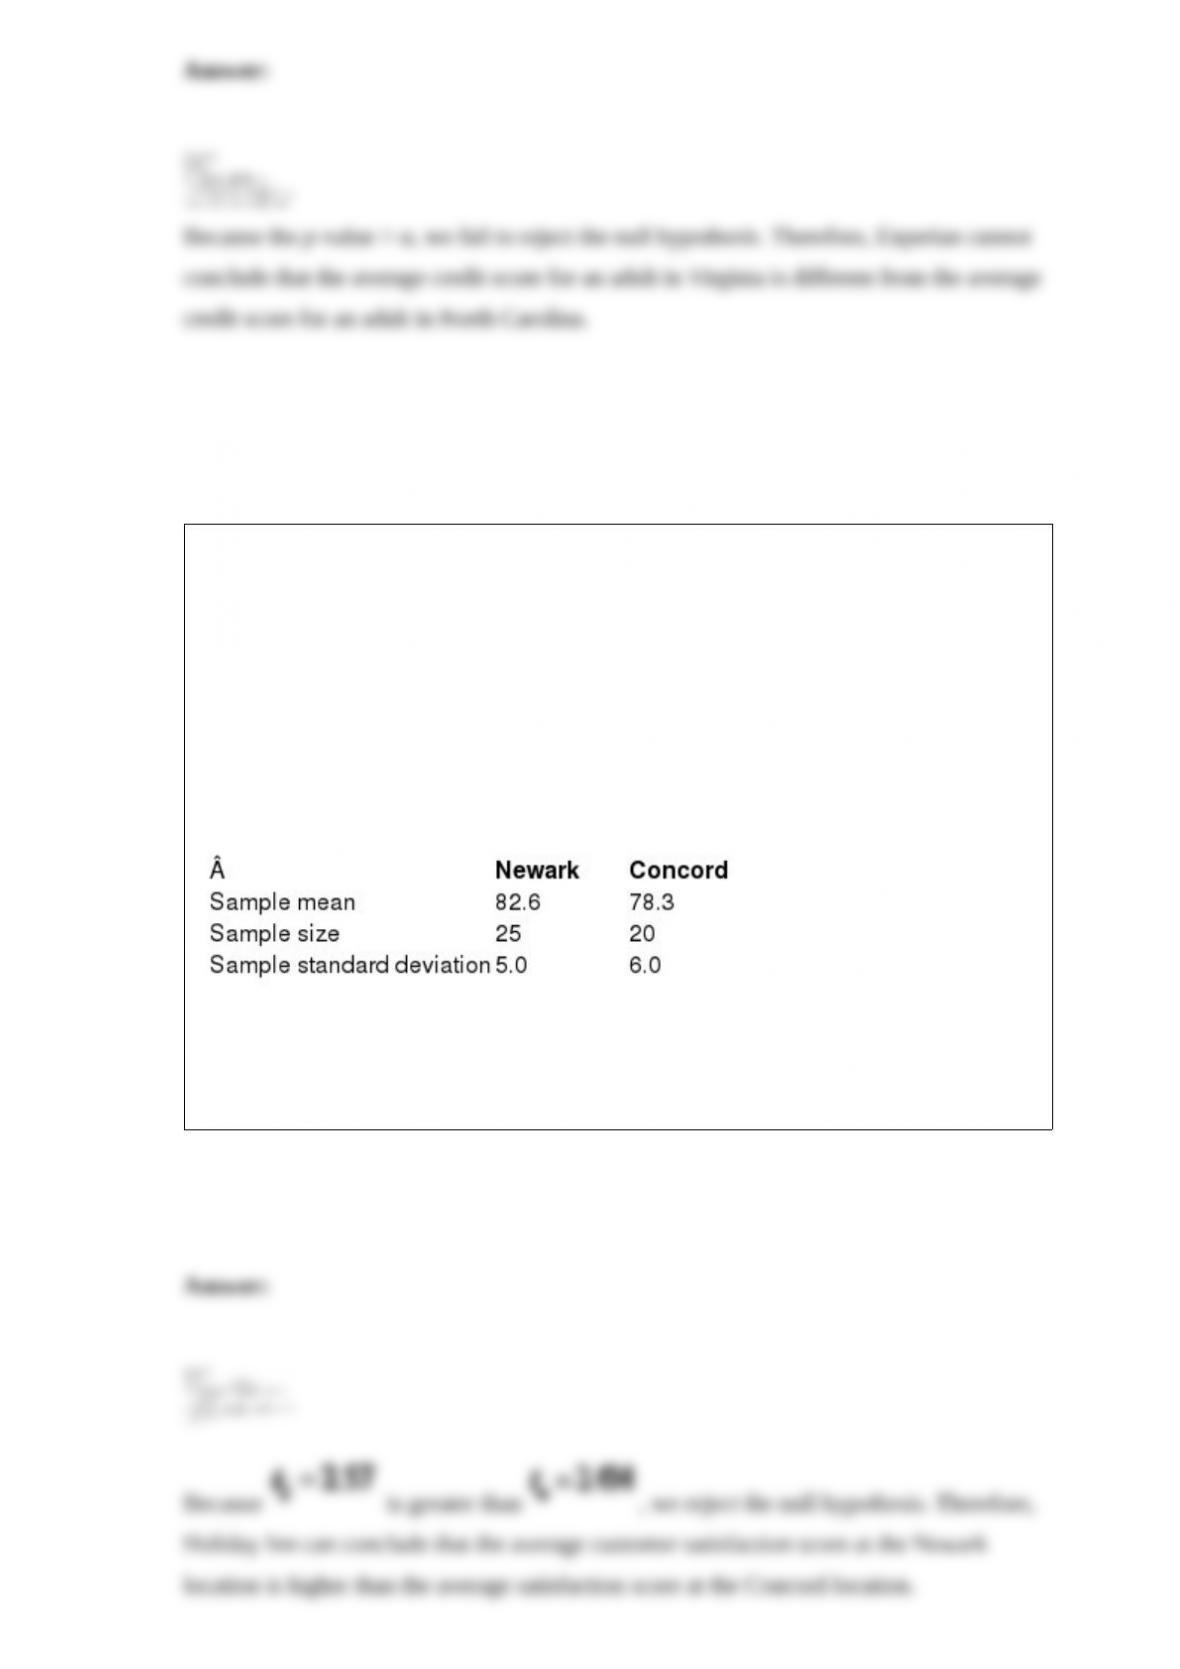
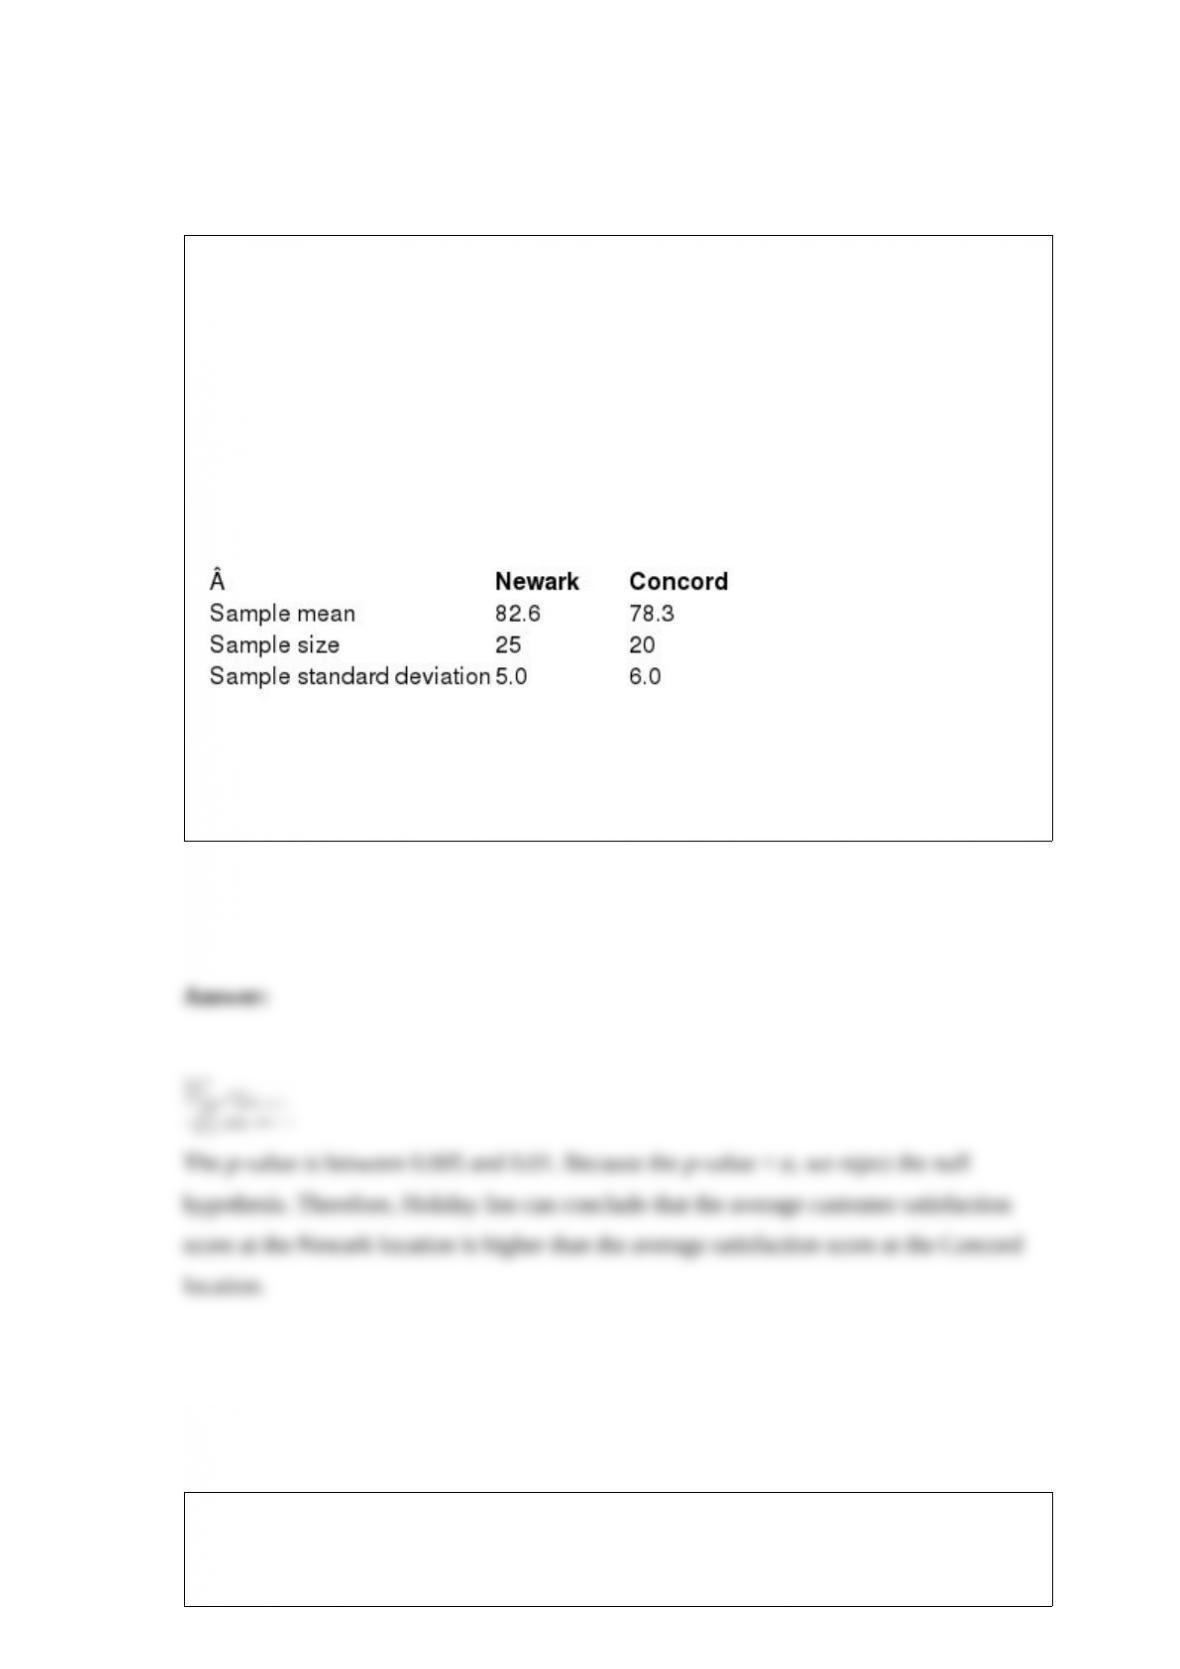
Suppose Holiday Inn has developed a new training program for hotel staff in an effort
to increase customer satisfaction. The employees at the Newark location completed the
training while the employees at the Concord location did not. Holiday Inn would like to
test the hypothesis that the average customer satisfaction score at the Newark location is
higher than the average satisfaction score at the Concord location. The following data
summarizes the sample statistics for customer satisfaction, on a scale of 1 to 100, for
each location. Assume that the population variances are unequal.
Define Population 1 as the Newark location and Population 2 as Newark location and
use the critical value approach to test this hypothesis with α = 0.01.
Suppose Holiday Inn has developed a new training program for hotel staff in an effort
to increase customer satisfaction. The employees at the Newark location completed the
training while the employees at the Concord location did not. Holiday Inn would like to
test the hypothesis that the average customer satisfaction score at the Newark location is
higher than the average satisfaction score at the Concord location. The following data
summarizes the sample statistics for customer satisfaction, on a scale of 1 to 100, for
each location. Assume that the population variances are unequal.
Define Population 1 as the Newark location and Population 2 as Newark location and
use the p-value approach to test this hypothesis with α = 0.01.
American Greetings would like to test the hypothesis that the average amount of money
spent per person on Mother’s Day increased by more than $10 this year when compared
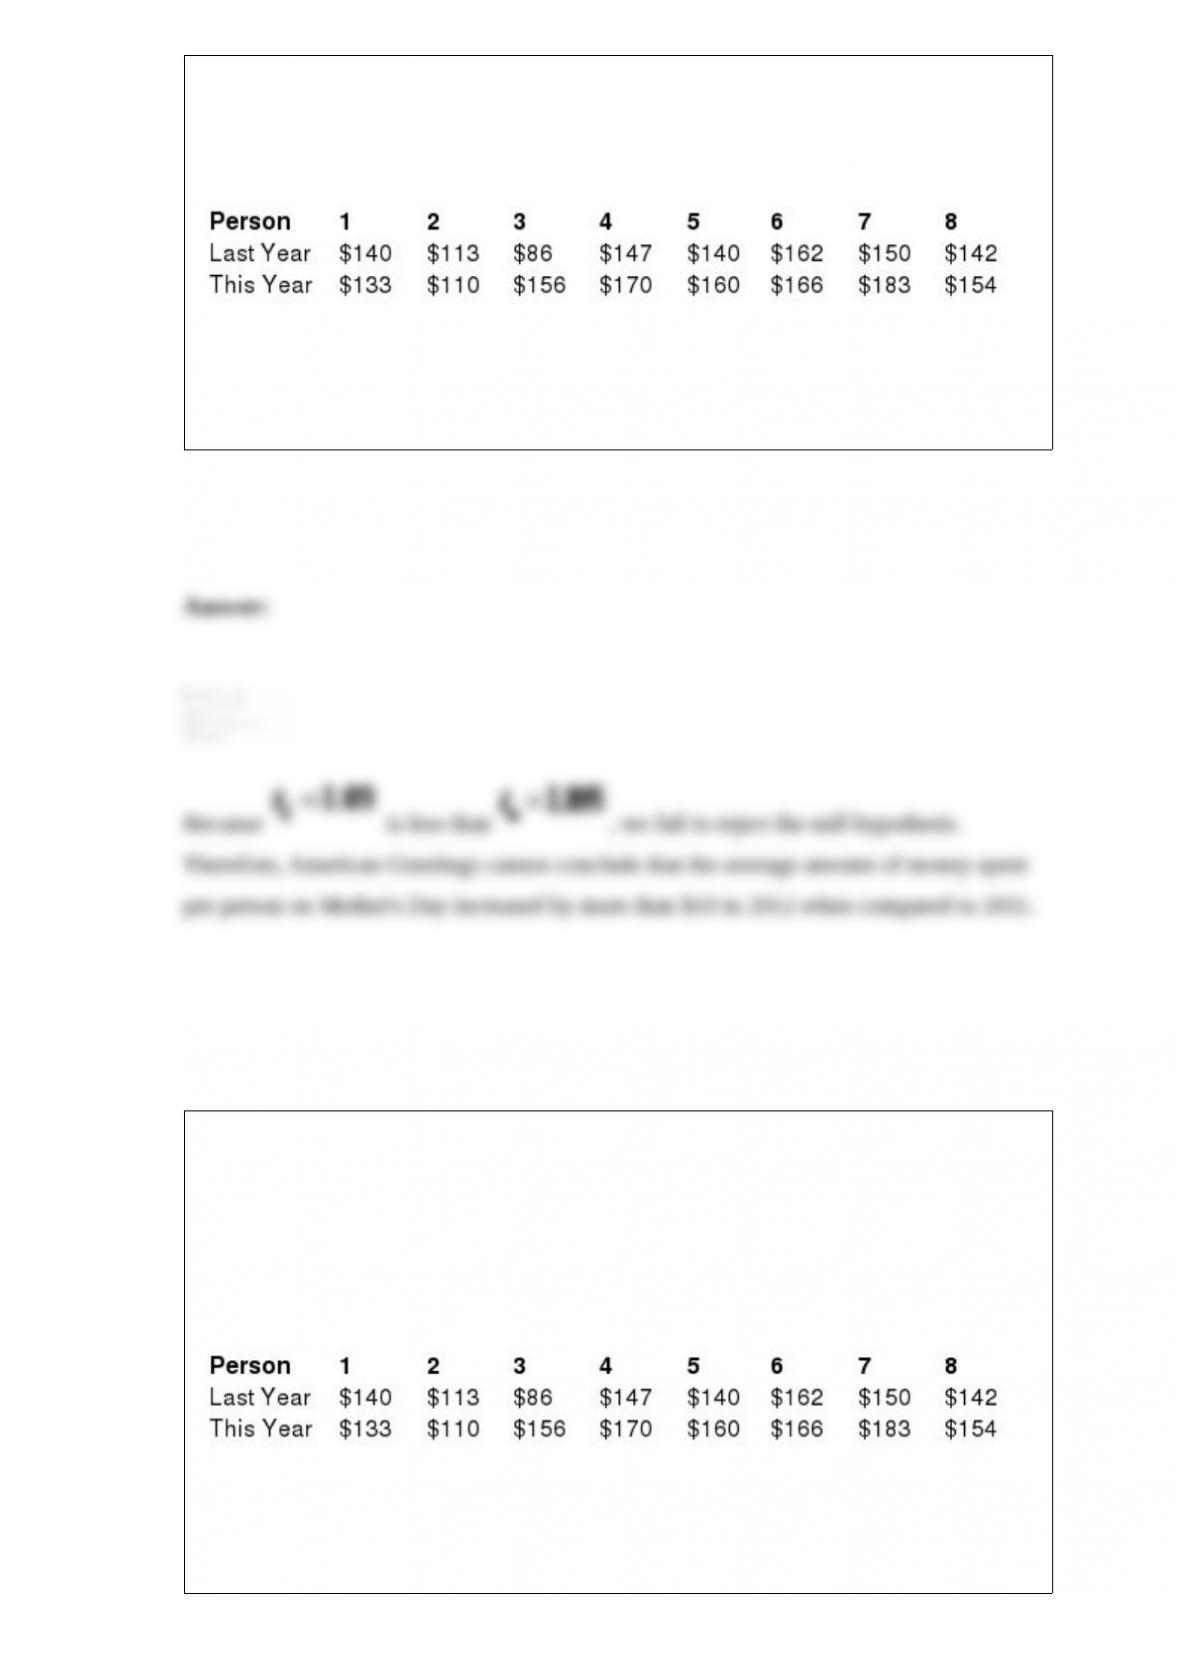
to last year. The following data represents the amount of money that the same eight
individuals spent on Mother’s Day during the past two holidays.
Define Population 1 as this year and Population 2 as last year and use the critical value
approach to test this hypothesis with α = 0.05.
American Greetings would like to test the hypothesis that the average amount of money
spent per person on Mother’s Day increased by more than $10 this year when compared
to last year. The following data represents the amount of money that the same eight
individuals spent on Mother’s Day during the past two holidays.
Define Population 1 as this year and Population 2 as last year and use the p-value
approach to test this hypothesis with α = 0.05.
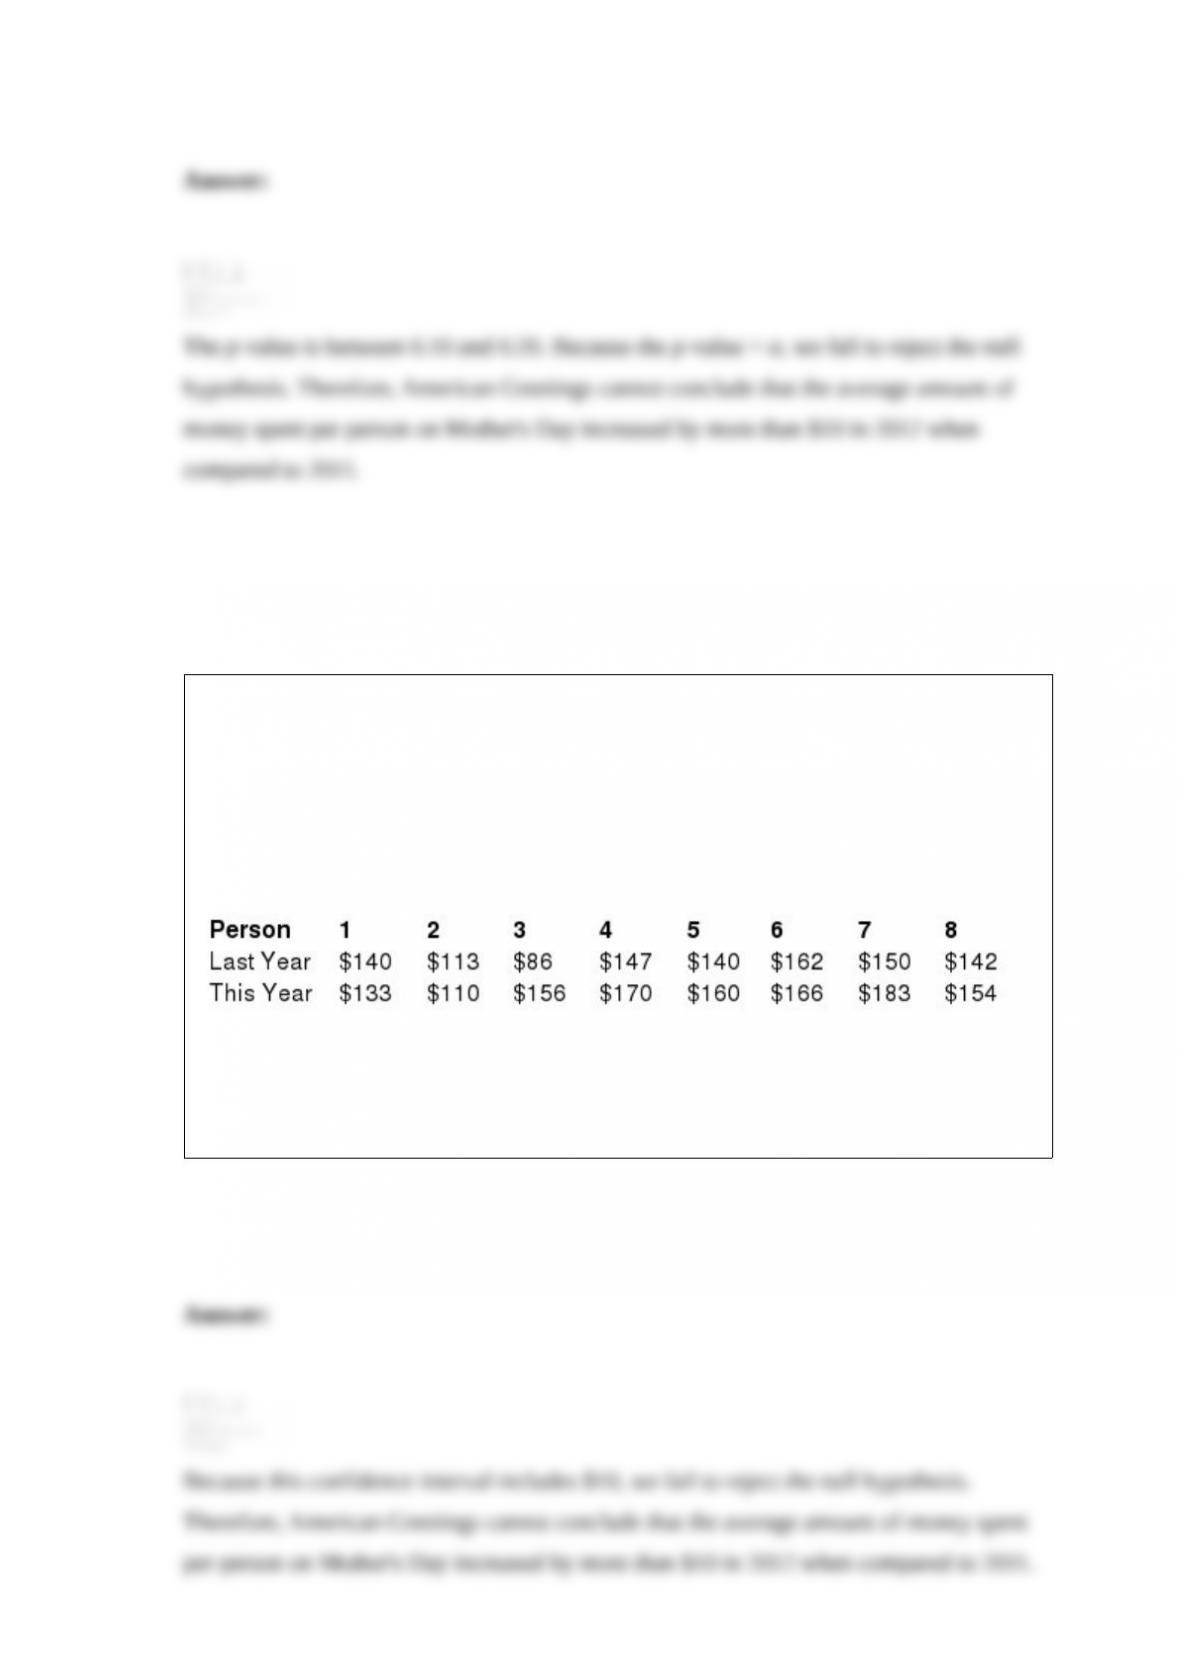
American Greetings would like to test the hypothesis that the average amount of money
spent per person on Mother’s Day increased by more than $10 this year when compared
to last year. The following data represents the amount of money that the same eight
individuals spent on Mother’s Day during the past two holidays.
Define Population 1 as this year and Population 2 as last year. Construct a 90%
confidence interval for the difference in population mean and interpret the results.
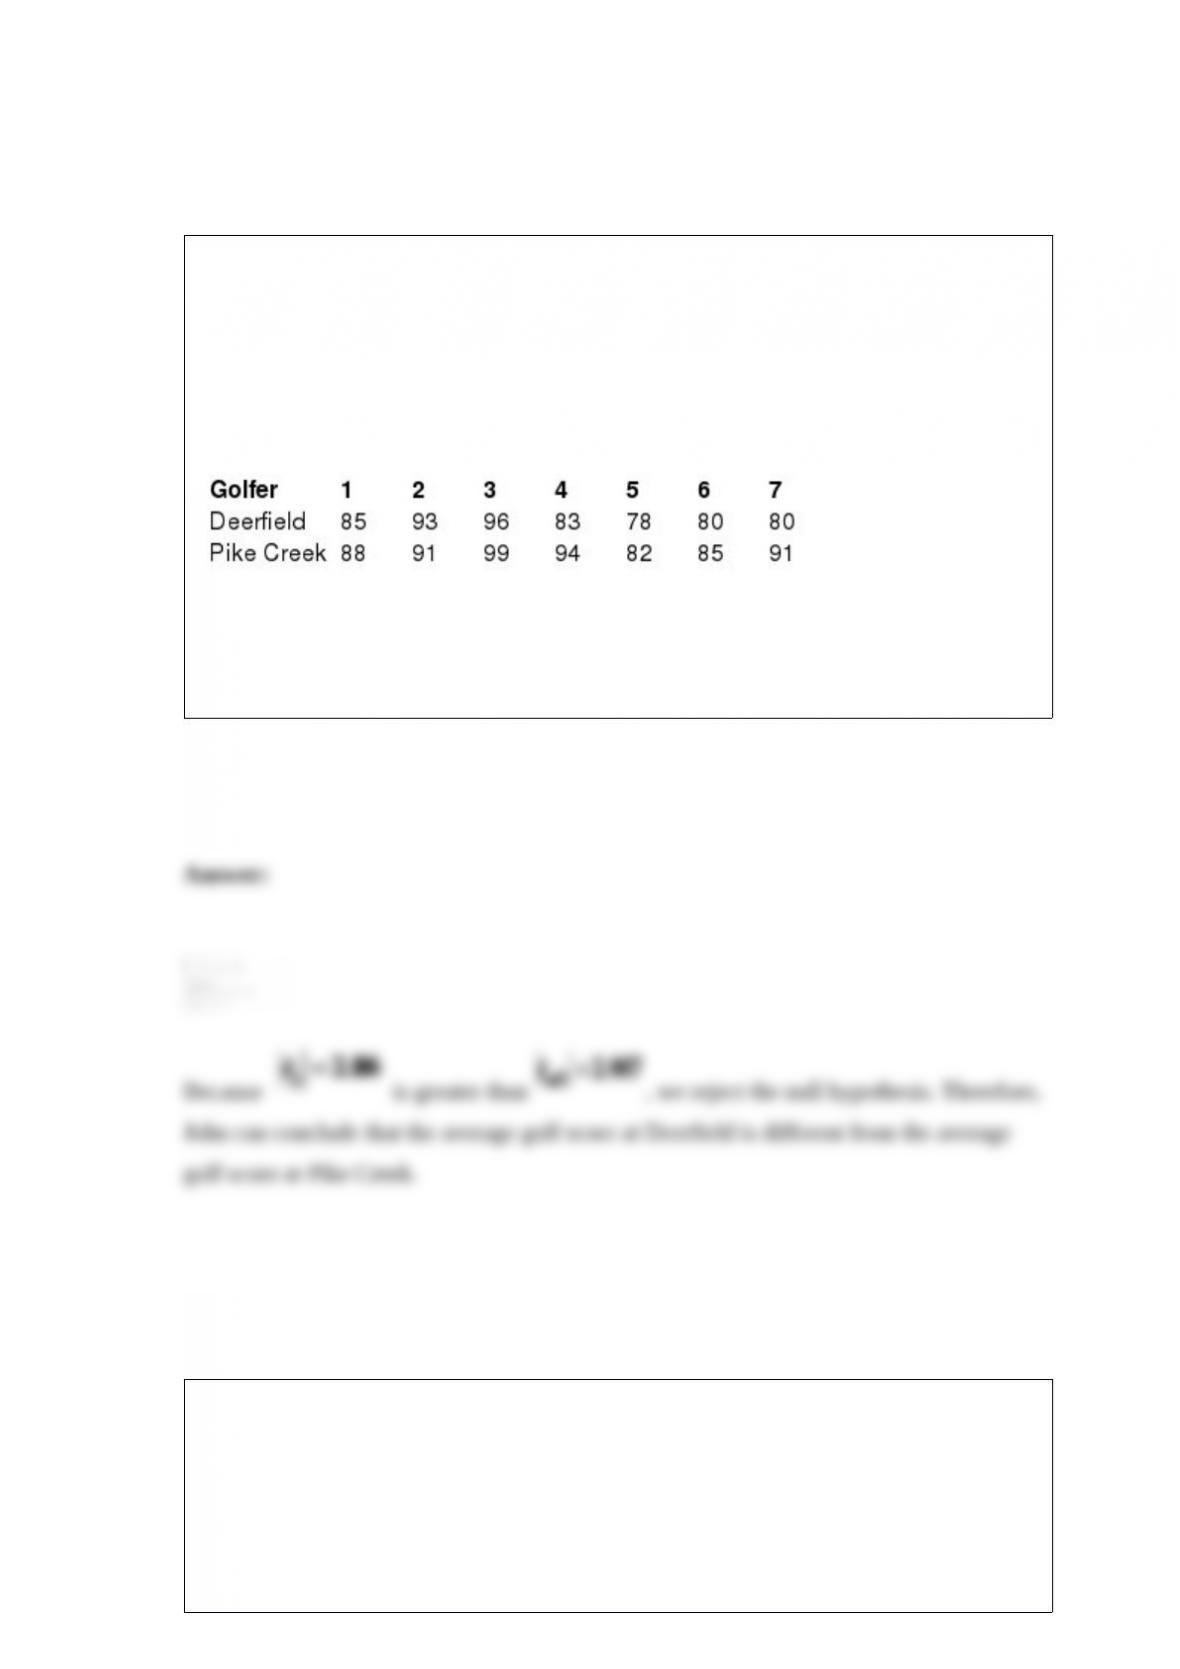
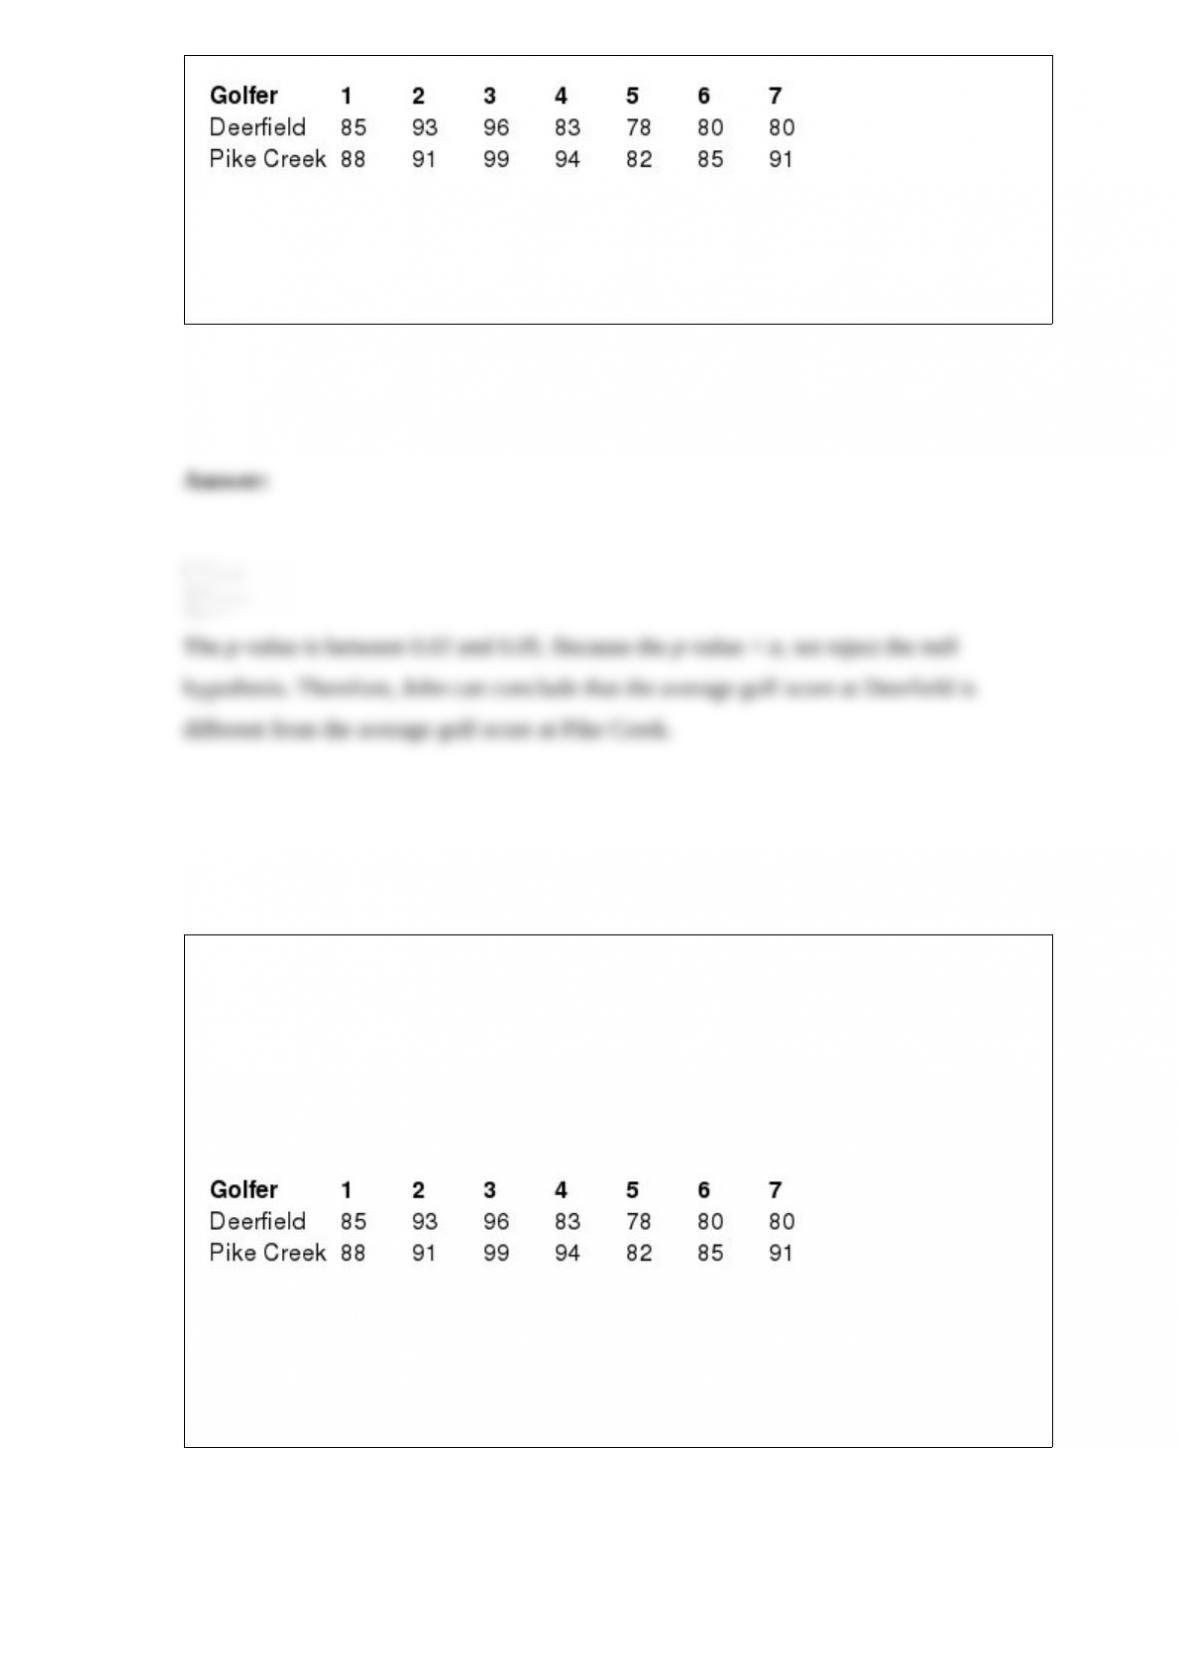
John is the manager at the Deerfield Golf Course and would like to test the hypothesis
that the average golf score at his course is different from the average golf score at the
Pike Creek Golf Course, which is a competitor in the area. The following data
represents the golf scores for seven golfers who recently played at both courses.
Define Population 1 as the Deerfield course and Population 2 as the Pike Creek course
and use the critical value approach to test this hypothesis with α = 0.05.
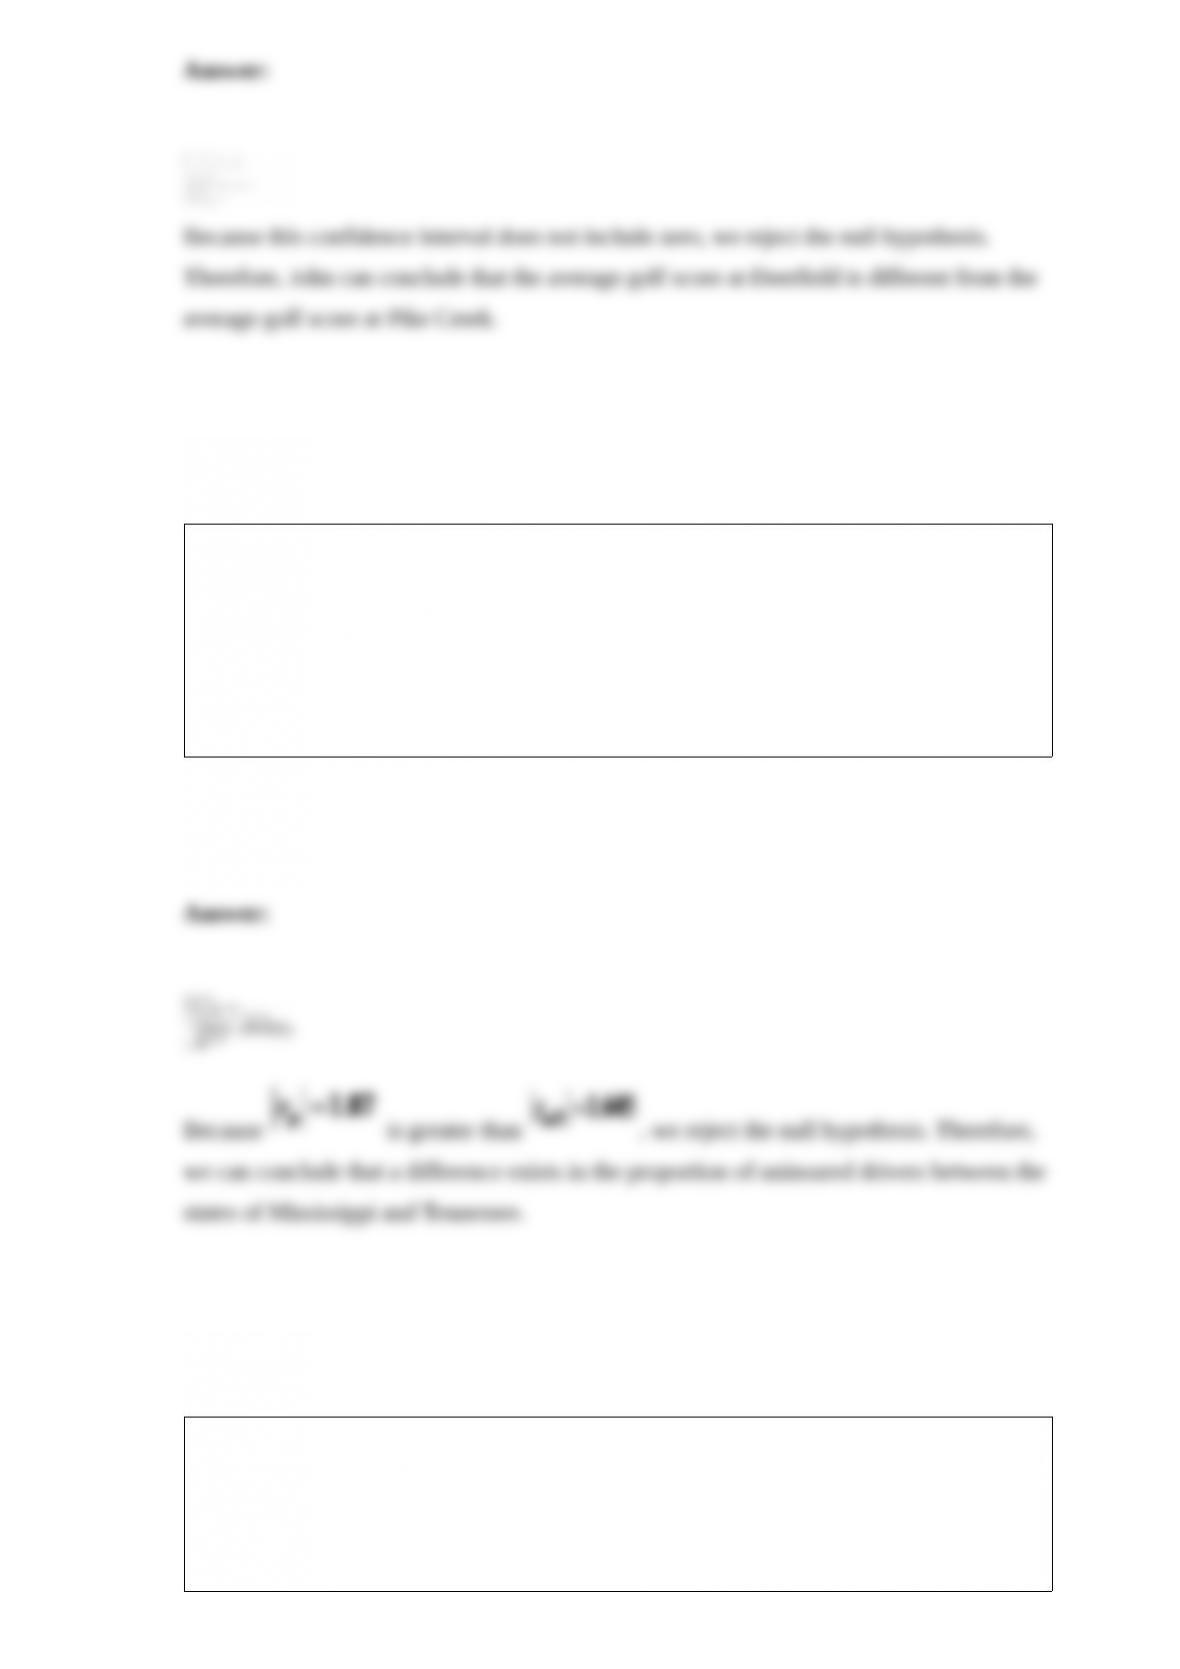
John is the manager at the Deerfield Golf Course and would like to test the hypothesis
that the average golf score at his course is different from the average golf score at the
Pike Creek Golf Course, which is a competitor in the area. The following data
represents the golf scores for seven golfers who recently played at both courses.
Define Population 1 as the Deerfield course and Population 2 as the Pike Creek course
and use the p-value approach to test this hypothesis with α = 0.05.
John is the manager at the Deerfield Golf Course and would like to test the hypothesis
that the average golf score at his course is different from the average golf score at the
Pike Creek Golf Course, which is a competitor in the area. The following data
represents the golf scores for seven golfers who recently played at both courses.
Define Population 1 as the Deerfield course and Population 2 as the Pike Creek course.
Construct a 95% confidence interval for the difference in population mean and interpret
the results.
Perform a hypothesis test to determine if a difference exists in the proportion of
uninsured drivers between the states of Mississippi and Tennessee. A random sample of
150 drivers from Mississippi found that 42 were uninsured. A random sample of 125
drivers from Tennessee found that 23 were uninsured. Define Population 1 as
Mississippi drivers and Population 2 as Tennessee drivers and use the critical value
approach to test this hypothesis with α = 0.10.
Perform a hypothesis test to determine if a difference exists in the proportion of
uninsured drivers between the states of Mississippi and Tennessee. A random sample of
150 drivers from Mississippi found that 42 were uninsured. A random sample of 125
drivers from Tennessee found that 23 were uninsured. Define Population 1 as

Mississippi drivers and Population 2 as Tennessee drivers and use the p-value approach
to test this hypothesis with α = 0.10.
Perform a hypothesis test to determine if a difference exists in the proportion of
uninsured drivers between the states of Mississippi and Tennessee. A random sample of
150 drivers from Mississippi found that 42 were uninsured. A random sample of 125
drivers from Tennessee found that 23 were uninsured. Define Population 1 as
Mississippi drivers and Population 2 as Tennessee drivers. Construct a 90% confidence
interval for the difference in population proportions and interpret the results.
A local school board would like to test the hypothesis that the proportion of Americans
who think unions have a positive effect on schools has decreased this year when
compared to last year. A random sample of 160 Americans last year found that 48 felt
unions have a positive effect on schools. A random sample of 140 Americans this year
found that 28 felt unions have a positive effect on schools. Define Population 1 as this
year and Population 2 as last year and use the critical value approach to test this
hypothesis with α = 0.05.
A local school board would like to test the hypothesis that the proportion of Americans
who think unions have a positive effect on schools has decreased this year when
compared to last year. A random sample of 160 Americans last year found that 48 felt
unions have a positive effect on schools. A random sample of 140 Americans this year
found that 28 felt unions have a positive effect on schools. Define Population 1 as this
year and Population 2 as last year and use the p-value approach to test this hypothesis
with α = 0.05.

A local school board would like to test the hypothesis that the proportion of Americans
who think unions have a positive effect on schools has decreased this year when
compared to last year. A random sample of 160 Americans last year found that 48 felt
unions have a positive effect on schools. A random sample of 140 Americans this year
found that 28 felt unions have a positive effect on schools. Define Population 1 as this
year and Population 2 as last year. Construct a 90% confidence interval for the
difference in population proportions and interpret the results.
A survey was conducted to determine attitudes about inheritance from adults of
different ages. A random sample of 100 adults age 72 or older found that 22 of them
agree that parents have a duty to leave an inheritance to their children. A random
sample of 125 baby boomers (ages 47-66) found that 20 of them agree that parents have
a duty to leave an inheritance to their children. Define Population 1 as adults age 72 or
older and Population 2 as baby boomers. Use the critical value approach to test the
hypothesis that a difference exists in the proportion of adults that agree with this
statement with α = 0.05.

A survey was conducted to determine attitudes about inheritance from adults of
different ages. A random sample of 100 adults age 72 or older found that 22 of them
agree that parents have a duty to leave an inheritance to their children. A random
sample of 125 baby boomers (ages 47-66) found that 20 of them agree that parents have
a duty to leave an inheritance to their children. Define Population 1 as adults age 72 or
older and Population 2 as baby boomers. Use the p-value approach to test the
hypothesis that a difference exists in the proportion of adults that agree with this
statement with α = 0.05.
A survey was conducted to determine attitudes about inheritance from adults of
different ages. A random sample of 100 adults age 72 or older found that 22 of them
agree that parents have a duty to leave an inheritance to their children. A random
sample of 125 baby boomers (ages 47-66) found that 20 of them agree that parents have
a duty to leave an inheritance to their children. Define Population 1 as adults age 72 or
older and Population 2 as baby boomers. Construct a 95% confidence interval for the
difference in population proportions and interpret the results.
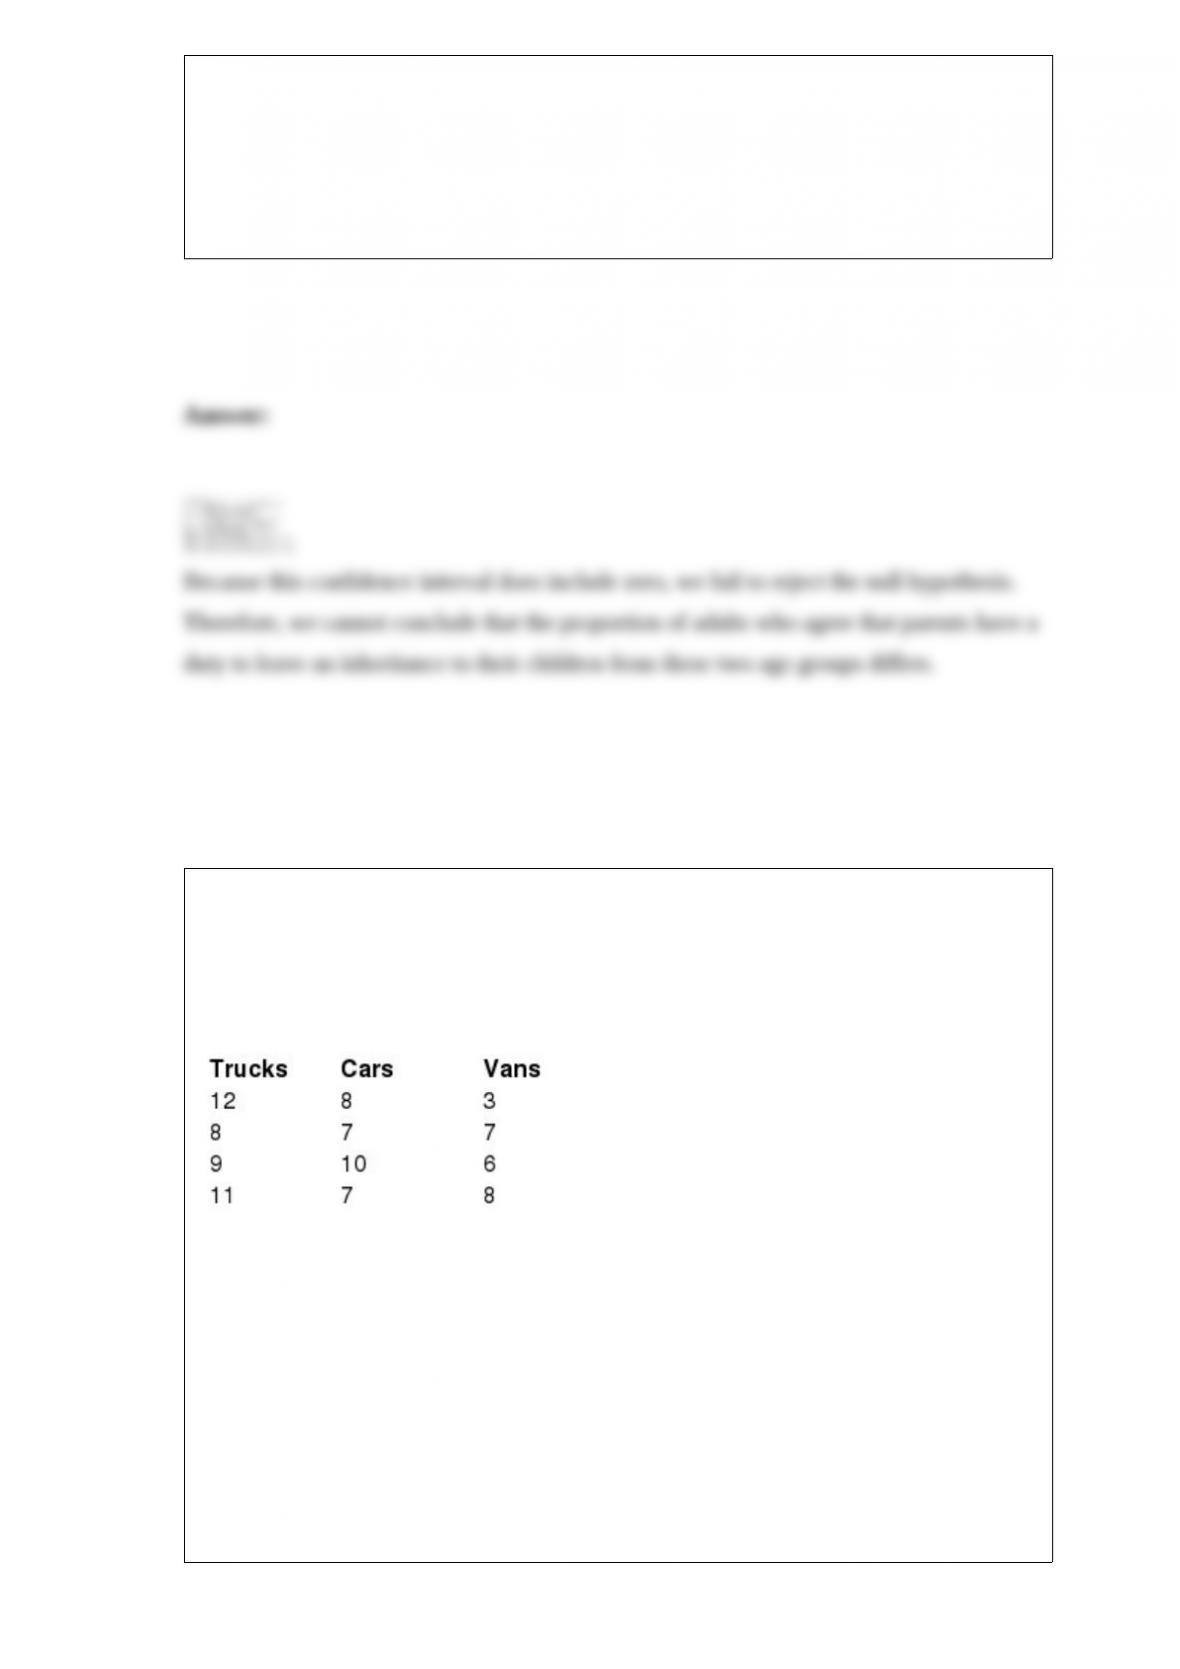
AutoTrader.com would like to test if a difference exists in the age of three different
types of vehicles currently on the road–trucks, cars, and vans. The following data
represent the age of a random sample of trucks, cars, and vans.
The test statistic for this hypothesis test would be ________.
A) 3.05
B) 3.44
C) 4.12
D) 4.80

AutoTrader.com would like to test if a difference exists in the age of three different
types of vehicles currently on the road–trucks, cars, and vans. The following data
represent the age of a random sample of trucks, cars, and vans.
Using α = 0.05, the conclusion for this hypothesis test would be that because the test
statistic is
______________________________________________________.
A) less than the critical value, we can conclude that there is a difference in the average
age of trucks, cars, and vans currently on the road
B) less than the critical value, we cannot conclude that there is a difference in the
average age of trucks, cars, and vans currently on the road
C) more than the critical value, we cannot conclude that there is a difference in the
average age of trucks, cars, and vans currently on the road
D) more than the critical value, we can conclude that there is a difference in the average
age of trucks, cars, and vans currently on the road

AutoTrader.com would like to test if a difference exists in the age of three different
types of vehicles currently on the road–trucks, cars, and vans. The following data
represent the age of a random sample of trucks, cars, and vans.
The Tukey-Kramer critical range using α = 0.05 is ________.
A) 2.56
B) 3.07
C) 3.61
D) 4.48
Sara is a regional manager for a restaurant chain that has locations in the towns of
Florence, Camden, and Columbia. A random sample of customers at all three locations
were asked to rate their satisfaction level on a scale of 1 to 20. A two-way ANOVA
procedure was performed on this data using α = 0.05 with Factor A representing each
location and Factor B representing the customer ‘s gender. The results are summarized
below in the ANOVA table.
The number of replications for this two-way ANOVA procedure is _____.
A) 2
B) 3
C) 4
D) 5
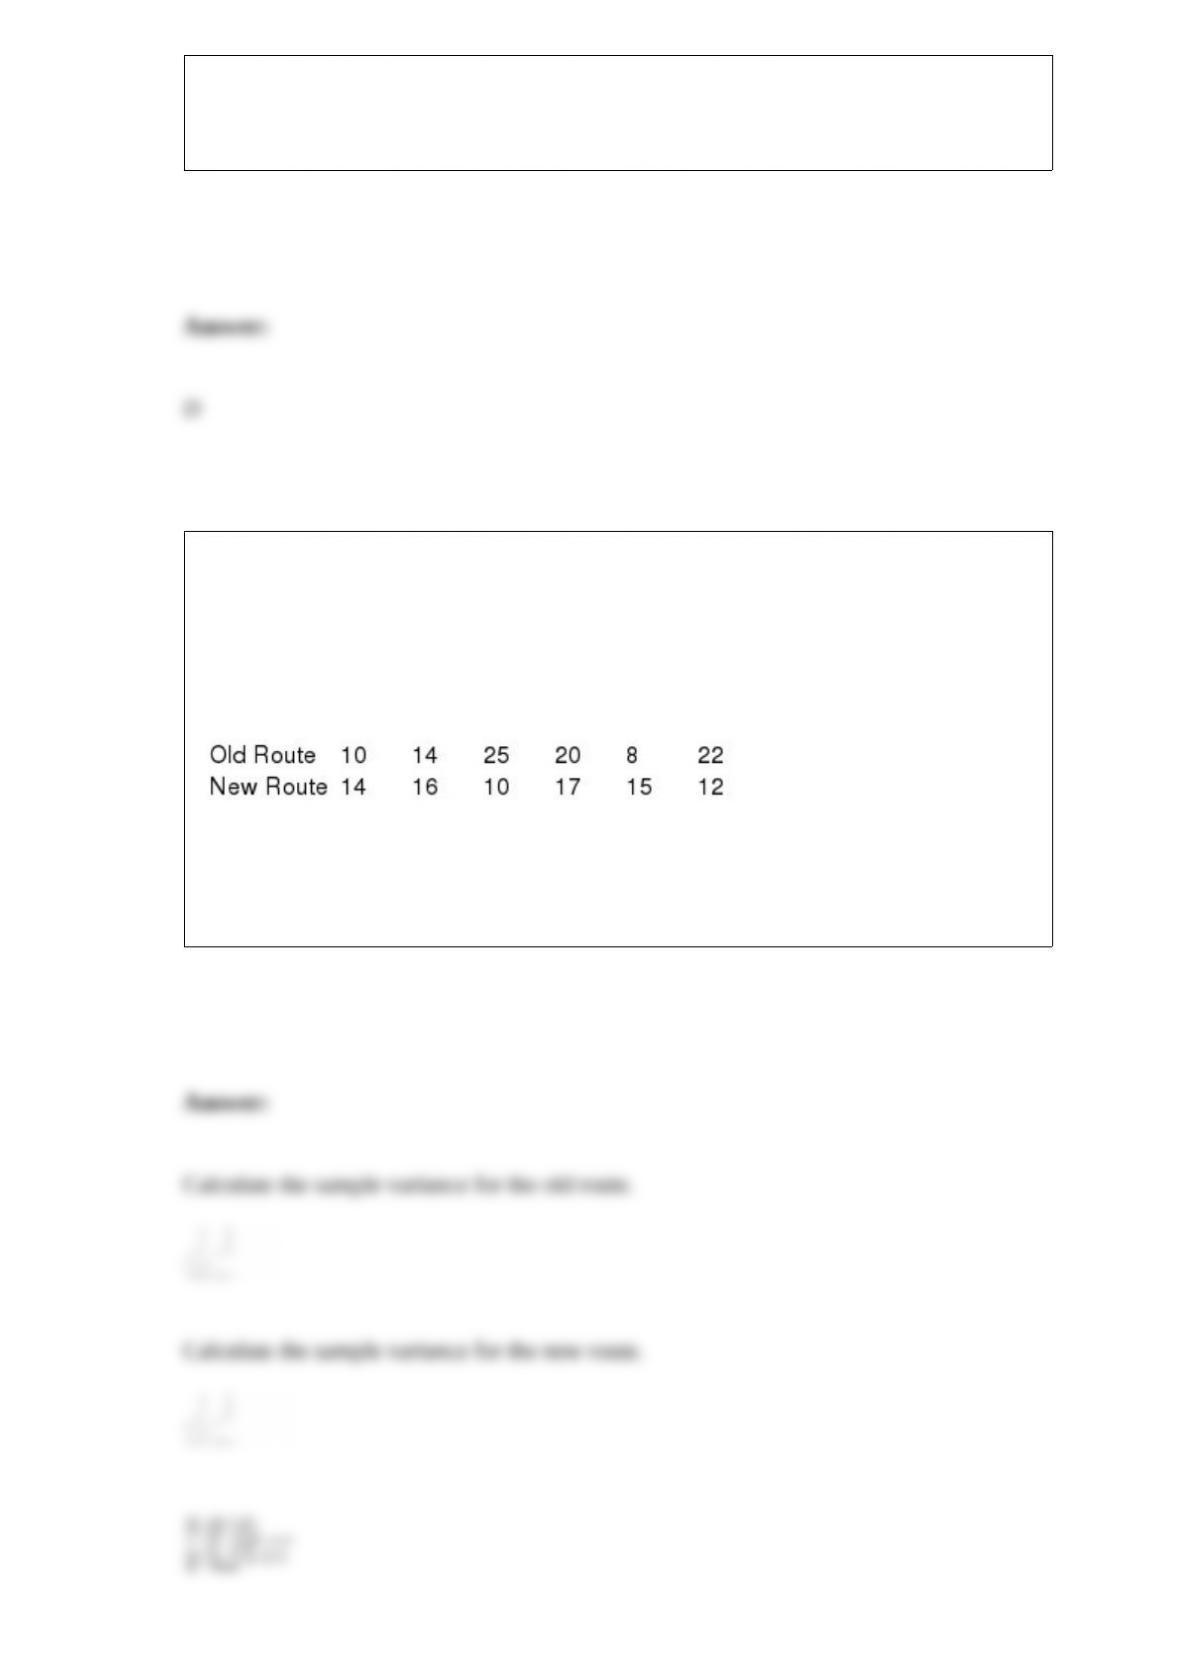
Bob has discovered a potential new route to work, and he suspects his old route has
more variability in the number of minutes that it takes him to commute. The following
data represent the number of minutes that each route required from a random sample of
commuting days.
Test the hypothesis that the old route has more variability when compared to the new
route using α = 0.05.

The sample size for the sign test is the total number of plus signs and minus signs.
The test statistic for the two-tail Wilcoxon signed-rank test is the larger of the sum of
the negative signed ranks (R-) and the sum of the positive signed ranks (R+).
The standard deviation of a data set can never be negative.

A frequency table indicates the number of occurrences of events that are classified
according to two categorical variables.
A normal probability distribution’s standard deviation (σ) completely describes its
shape.
The sample variance is a biased estimator of the population variance because we would
expect the average of many sample variances taken from a population would be equal
to the true population variance.
An employee records the number of customers that arrive at a retail store today. This is
an example of collecting information.

When the proportion of sample size to population size, n/N, is greater than 5%, the
finite population correction factor is used to adjust the standard error of the proportion.
The level of risk associated with the equally likely criterion lies somewhere between the
risks associated with the maximax and maximin approaches.
Two events cannot be both independent and mutually exclusive.

The chi-square test for independence is used to decide if observed frequencies follow a
known probability distribution.
When we use the t-distribution to calculate a confidence interval, we need to assume
that the population of interest follows the normal probability distribution.
The degrees of freedom are the number of values that are free to vary given that certain
information, such as the sample mean, is known.
Using best subsets regression will always result in a model in which all of the
independent variables are statistically significant.

If we are sampling from a normal distribution to conduct a hypothesis test, then our
sampling distribution will only be normally distributed if our sample size is 30 or more.
Decision tables can be used to evaluate a series of sequential decisions.
The sign test can be used to determine if consumers prefer one product or service over
another.

The simple moving average forecast is actually a variation of the weighted moving
average but with all of the weights being equal.
Deciding that a process that fills bottles with soda is functioning properly by checking
the weights for a sample of bottles is an example of inferential statistics.
The null hypothesis is also known as the research hypothesis because it represents the
position the researcher wants to establish.
Increasing the sample size will reduce the margin of error for a given confidence level.

Consider the following events:
Event A = The survey respondent is less than 40 years old.
Event B = The survey respondent is 40 years or older.
Events A and B are mutually exclusive and collectively exhaustive.
A larger sample size will always result in a smaller sampling error.
The sign test is a nonparametric procedure that assigns a plus sign or a minus sign to
each observation in a sample.

When sample means of two data sets are very different, comparing sample standard
deviations can be misleading.
Unlike the critical z-score and critical t-score, the critical F-score can only take on
positive values.
The values for an exponential random variable can be positive or negative.
Continuous data is often the result of measuring observations rather than counting them.

For a chi-square test of independence, the expected frequencies are permitted to be less
than 5.
The bootstrap method can be applied to estimate statistics such as the sample
proportion, mean, median, or variance.
If the null hypothesis is false, the mean square between is a good estimate for the
population variance.

The sample standard deviation for grouped data provides an exact value for the sample
standard deviation.
Clustered bar charts are preferred over stacked bar charts when you are displaying totals
in each category, such as what team scored the most points over the two-year period.
________ is used when we have probability information for each state of nature. in the
field of decision analysis.
A) Decision making under probability
B) Decision making under risk
C) Decision making under certainty
D) Decision making under uncertainty

Costco installs automobile tires on a first-come first-serve basis. The total time a
customer needs to wait for the installation to be completed follows the normal
distribution with a mean time of 106.3 minutes and a standard deviation of 18.5
minutes. What is the probability that a randomly selected customer will wait between
80 and 95 minutes for his or her tires to be installed?
A) 0.1245
B) 0.1931
C) 0.2960
D) 0.3455
The following table shows the number of employees at Diamond Corporation over the
past 16 years.
The trend projection slope for this data is ________.
A) 0.1270

B) 0.3219
C) 0.5544
D) 1.2554
Expedia would like to test the hypothesis that the proportion of Southwest Airline
flights that arrive on-time is less than 0.90. A random sample of 140 United Airline
flights found that 119 arrived on-time. Expedia would like to set α = 0.05. Which one of
the following statements is true?
A) Because the p-value is greater than α, we reject the null hypothesis and cannot
conclude that the proportion of United Airline flights that arrive on-time is less than
0.90.
B) Because the p-value is greater than α, we fail to reject the null hypothesis and cannot
conclude that the proportion of United Airline flights that arrive on-time is less than
0.90.
C) Because the p-value is less than α, we reject the null hypothesis and conclude that
the proportion of United Airline flights that arrive on-time is less than 0.90.
D) Because the p-value is less than α, we fail to reject the null hypothesis and cannot
conclude that the proportion of United Airline flights that arrive on-time is less than
0.90.
Porter Automotive is a car dealership that sells Buicks and Hondas. The following data
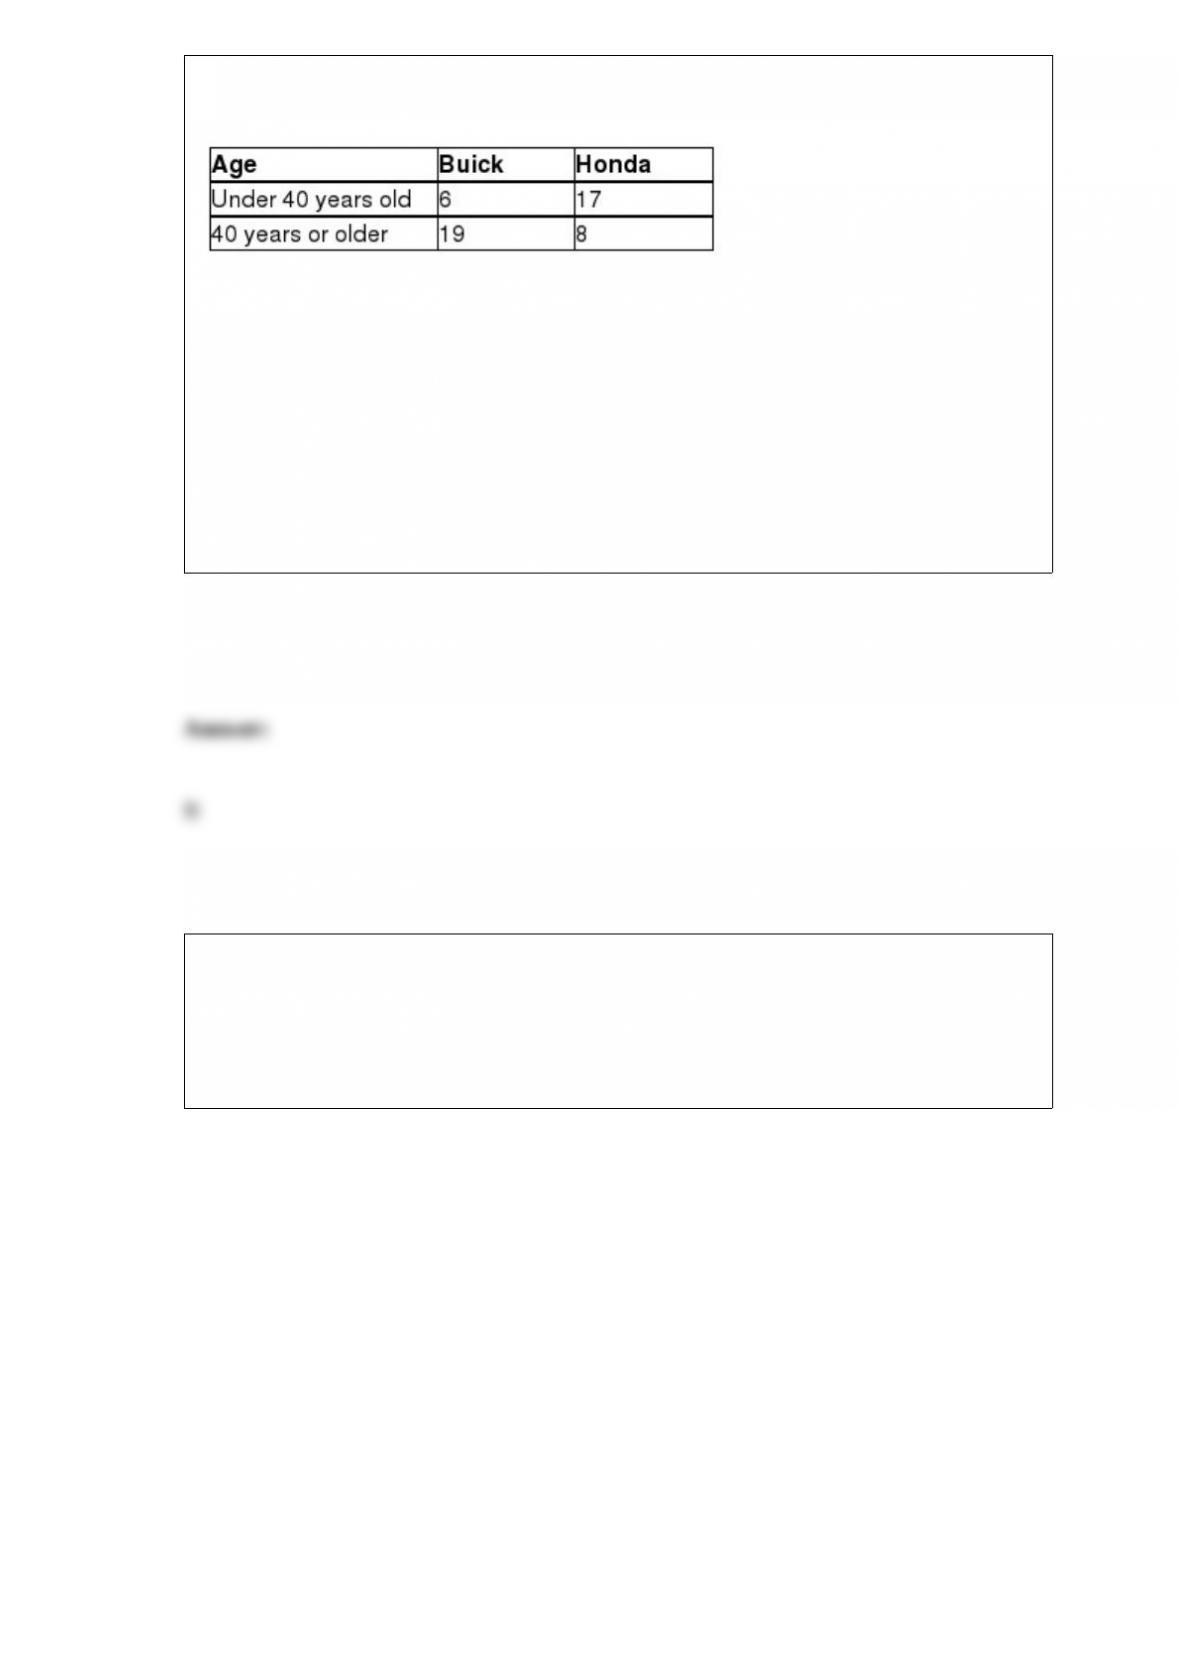
shows the number of buyers this month according to the brand of car they purchased as
well as their age group.
This data is an example of a _______________.
A) histogram
B) contingency table
C) relative frequency distribution
D) stem and leaf diagram
The Chamber of Commerce for a small city would like to test the hypothesis that the
median number of days that a residential home is listed on the real estate market for
Century 21 is different than the median number of days for a house listed by RE/MAX.
The following data shows the number of days a random sample of homes listed by each
realtor.
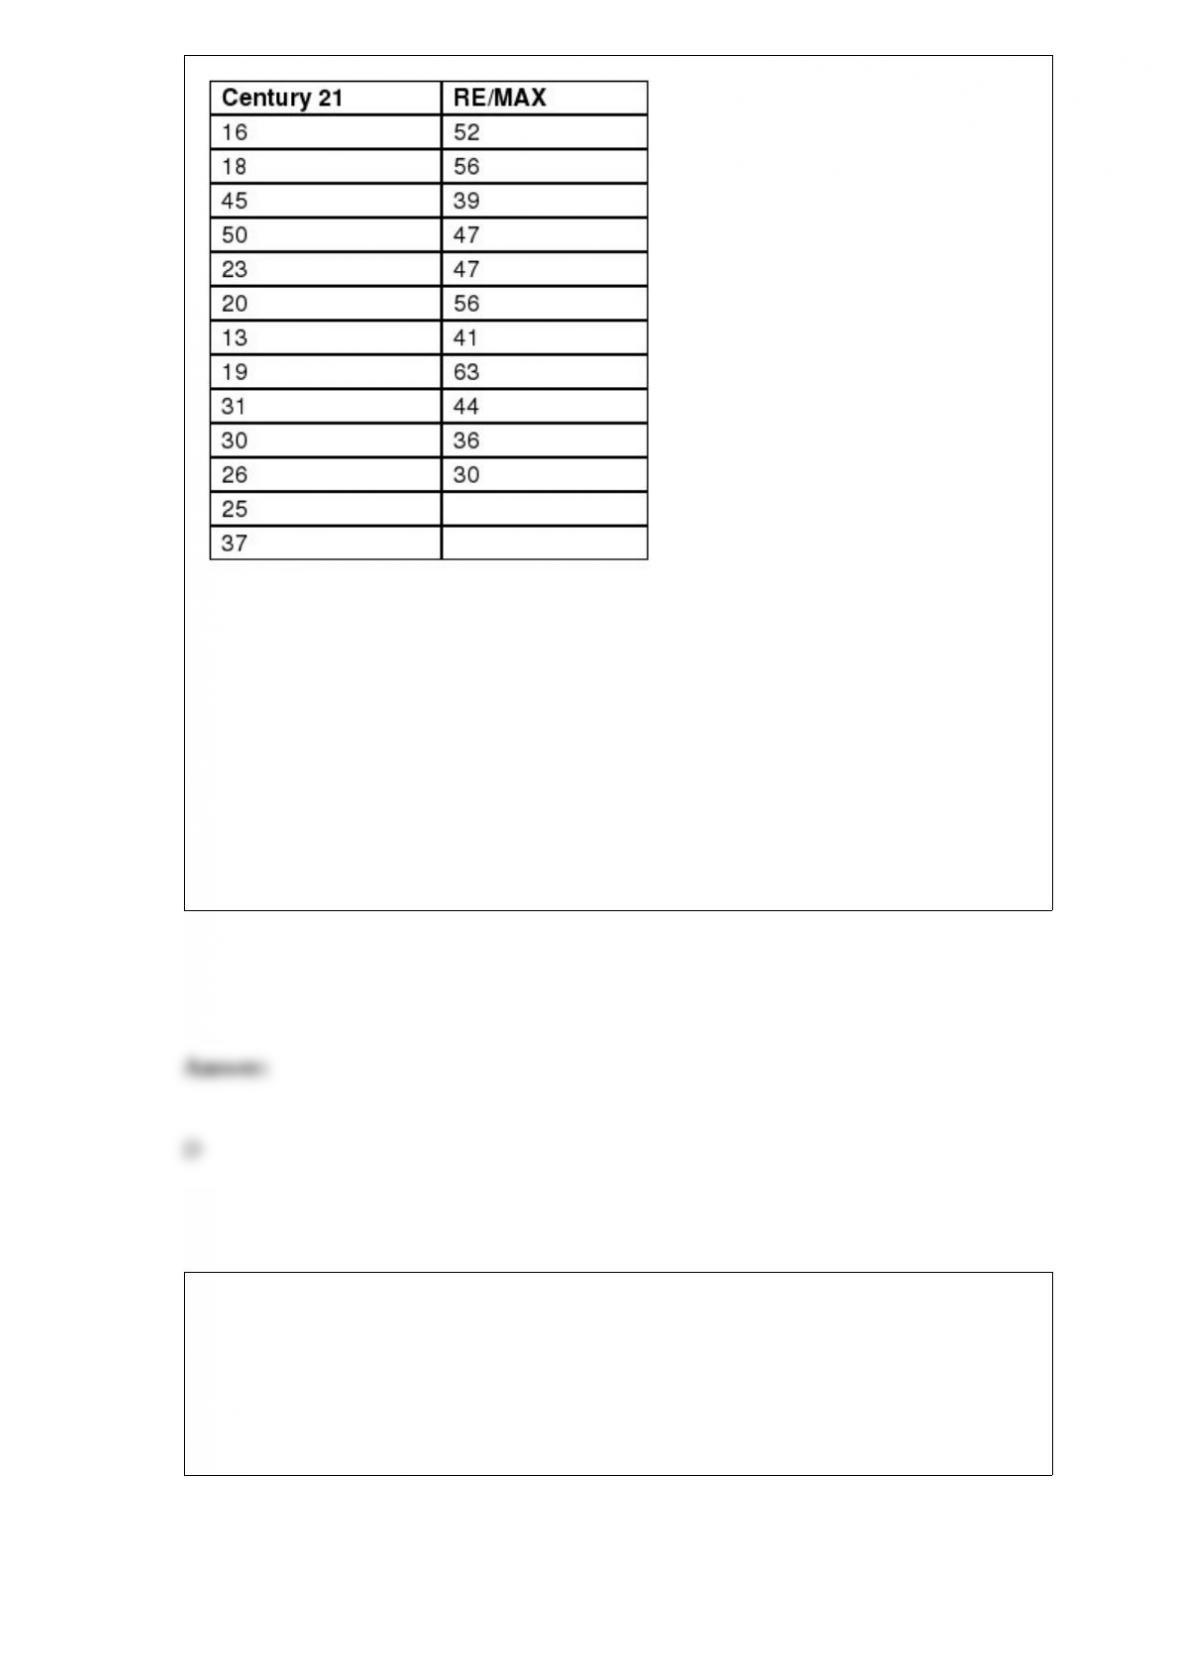
The appropriate nonparametric procedure for this analysis is the _________________
test.
A) sign
B) Wilcoxon signed-rank
C) Kruskal-Wallis
D) Wilcoxon rank-sum
Use the information below to answer the following question(s).
Cars.com would like to use simple regression to predict the selling price of a used car,
in thousands of dollars, based on the age of the car in years. A random sample of used
cars was selected and the result of the regression analysis is shown below.
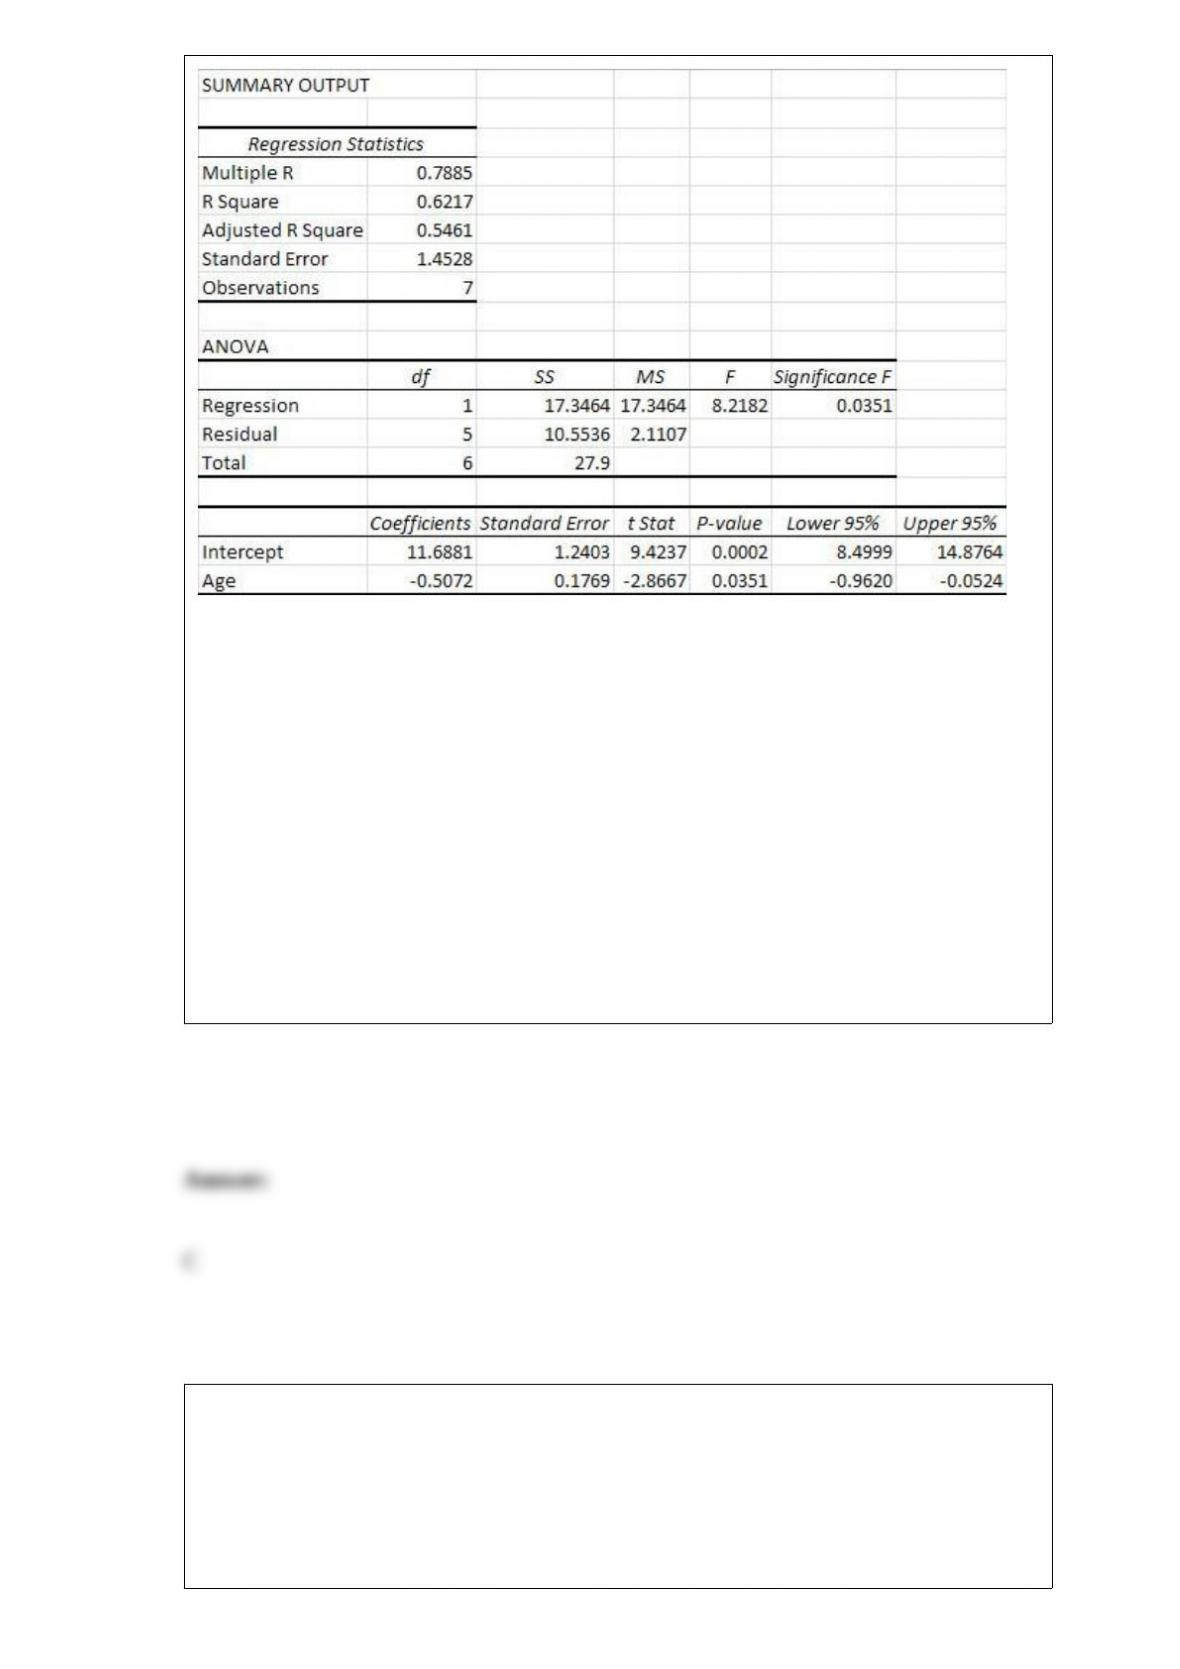
Which one of the following statements is true using α = 0.05?
A) Because the p-value for the slope is 0.0002, we can reject the null hypothesis and
conclude that there is a relationship between the age and selling price of a used car.
B) Because the p-value for the slope is 0.0002, we fail to reject the null hypothesis and
conclude that there is a relationship between the age and selling price of a used car.
C) Because the p-value for the slope is 0.0351, we can reject the null hypothesis and
conclude that there is a relationship between the age and selling price of a used car.
D) Because the p-value for the slope is 0.0351, we can reject the null hypothesis and
conclude that there is no relationship between the age and selling price of a used car.
An Epson inkjet printer ad advertises that the black ink cartridge will provide enough
ink for an average of 245 pages. Assume that this claim is accurate and that the standard
deviation for this population is 15 pages. A random sample of 33 customers was
surveyed about the number of pages they were able to print with their black ink
cartridges. What the probability that the sample mean will be 246 pages or less?

A) 0.6480
B) 0.8729
C) 0.3520
D) 0.1093
Under no circumstances should open-ended classes be used for a frequency distribution
using grouped quantitative data.
Entertainment Software Association would like to test if the median age of “gamers”
(those that routinely play video games) is more than 30 years old. The following table
summarizes the ages of a random sample of gamers.
The sample size, n, for this hypothesis test is ________.
A) 12
B) 30

C) 42
D) 46
Suppose the wait through immigration at JFK Airport in New York is thought to be
bell-shaped and symmetrical with a mean of 22 minutes. It is known that 68 percent of
travelers will spend between 16 and 28 minutes waiting to pass through immigration.
The standard deviation for the wait time through immigration is
A) 6 minutes.
B) 8 minutes.
C) 9 minutes.
D) 10 minutes.
A random sample of 150 mortgages in the state of Mississippi was randomly selected.
From this sample, 17 were found to be delinquent on their current payment. The margin
of error for an 80% confidence interval for the proportion based on this sample is
________.
A) 0.0258
B) 0.0330
C) 0.0522
D) 0.0695
Use the following information to answer the question(s) below.
Ford would like to develop a regression model that would predict the number of cars
sold per month by a dealership employee based on the employee’s number of years of
sales experience (Exp), the employee’s weekly base salary before commissions (Salary),
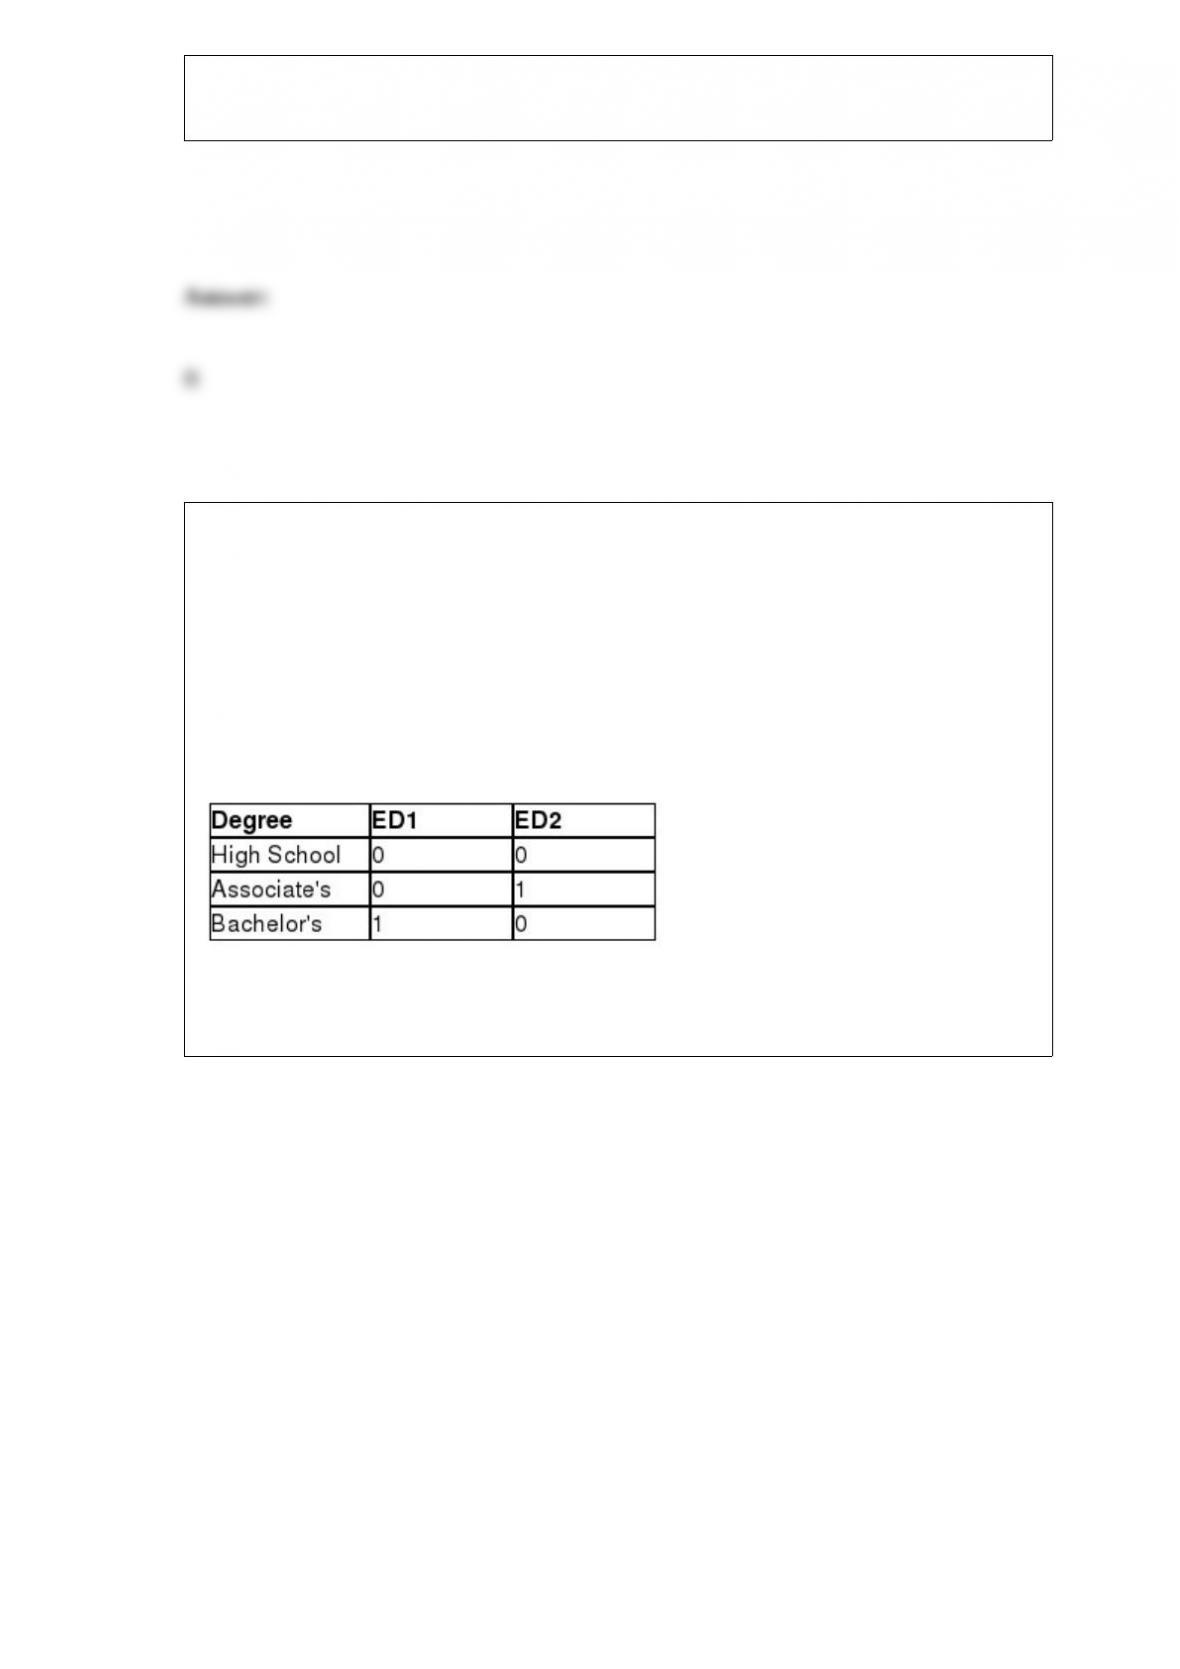
and the education level of the employee. There are three levels of education in the sales
forcehigh school degree, associate’s degree, and bachelor’s degree. The following
dummy variables have been defined.
The following Excel output shows the partially completed regression output from a
random sample of employees from the previous month.
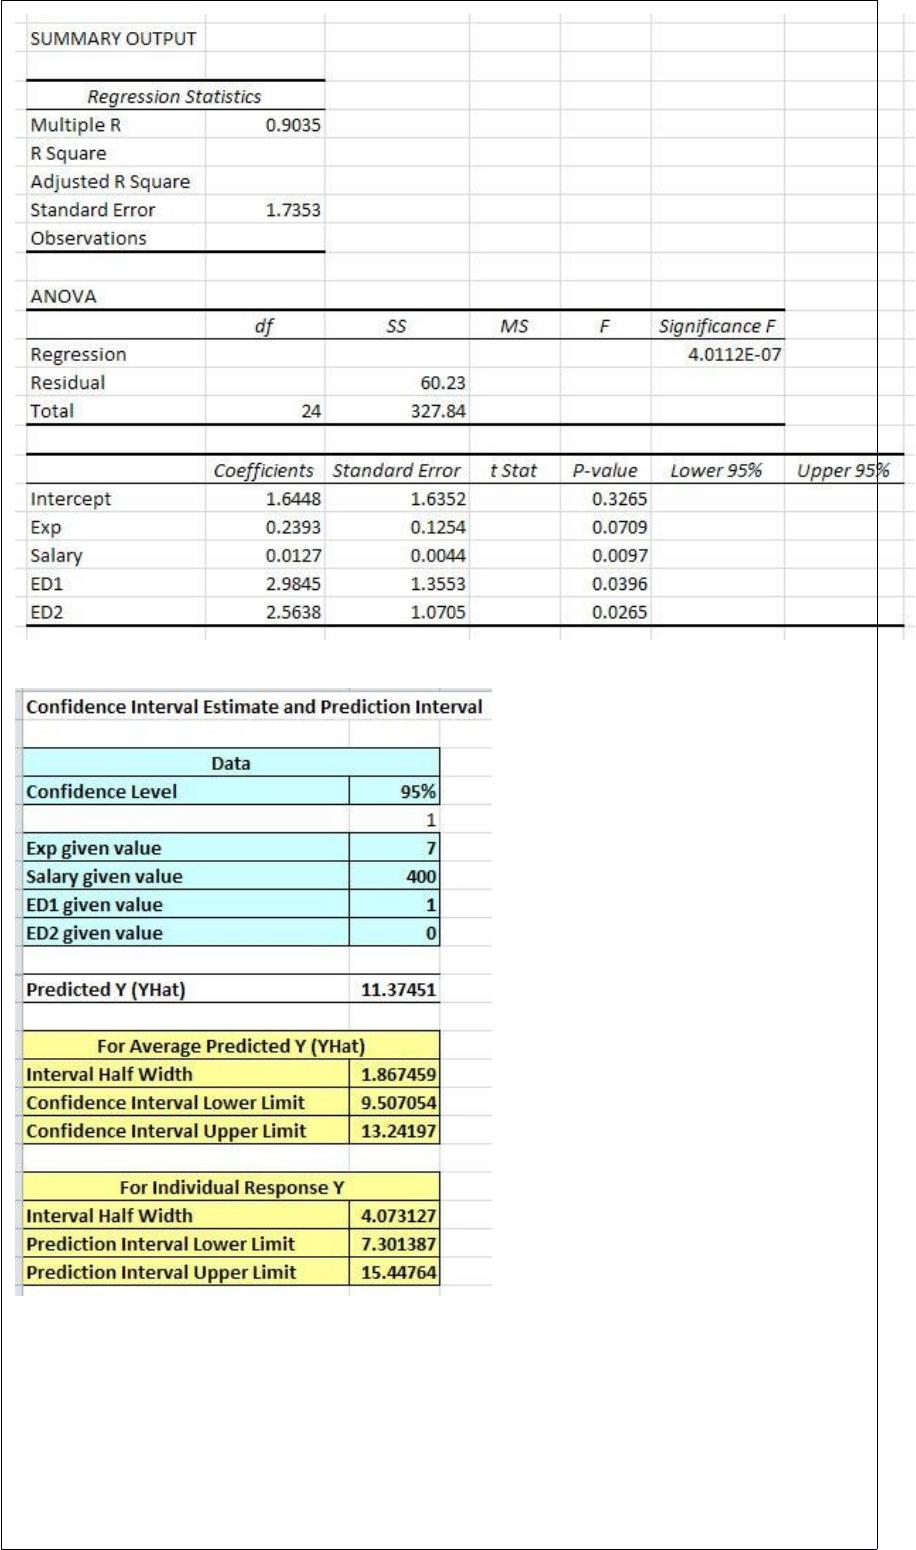
Which one of the following statements describes the results of the hypothesis test for
the overall regression model using α = 0.05?
A) Because the p-value is greater than alpha, we reject the null hypothesis and conclude
that there is a relationship between the dependent variable and the independent
variables.
B) Because the p-value is greater than alpha, we fail to reject the null hypothesis and
conclude that there is no relationship between the dependent variable and the
independent variables.
C) Because the p-value is less than alpha, we fail to reject the null hypothesis and
conclude that there is no relationship between the dependent variable and the
independent variables.
D) Because the p-value is less than alpha, we reject the null hypothesis and conclude
that there is a relationship between the dependent variable and the independent
variables.
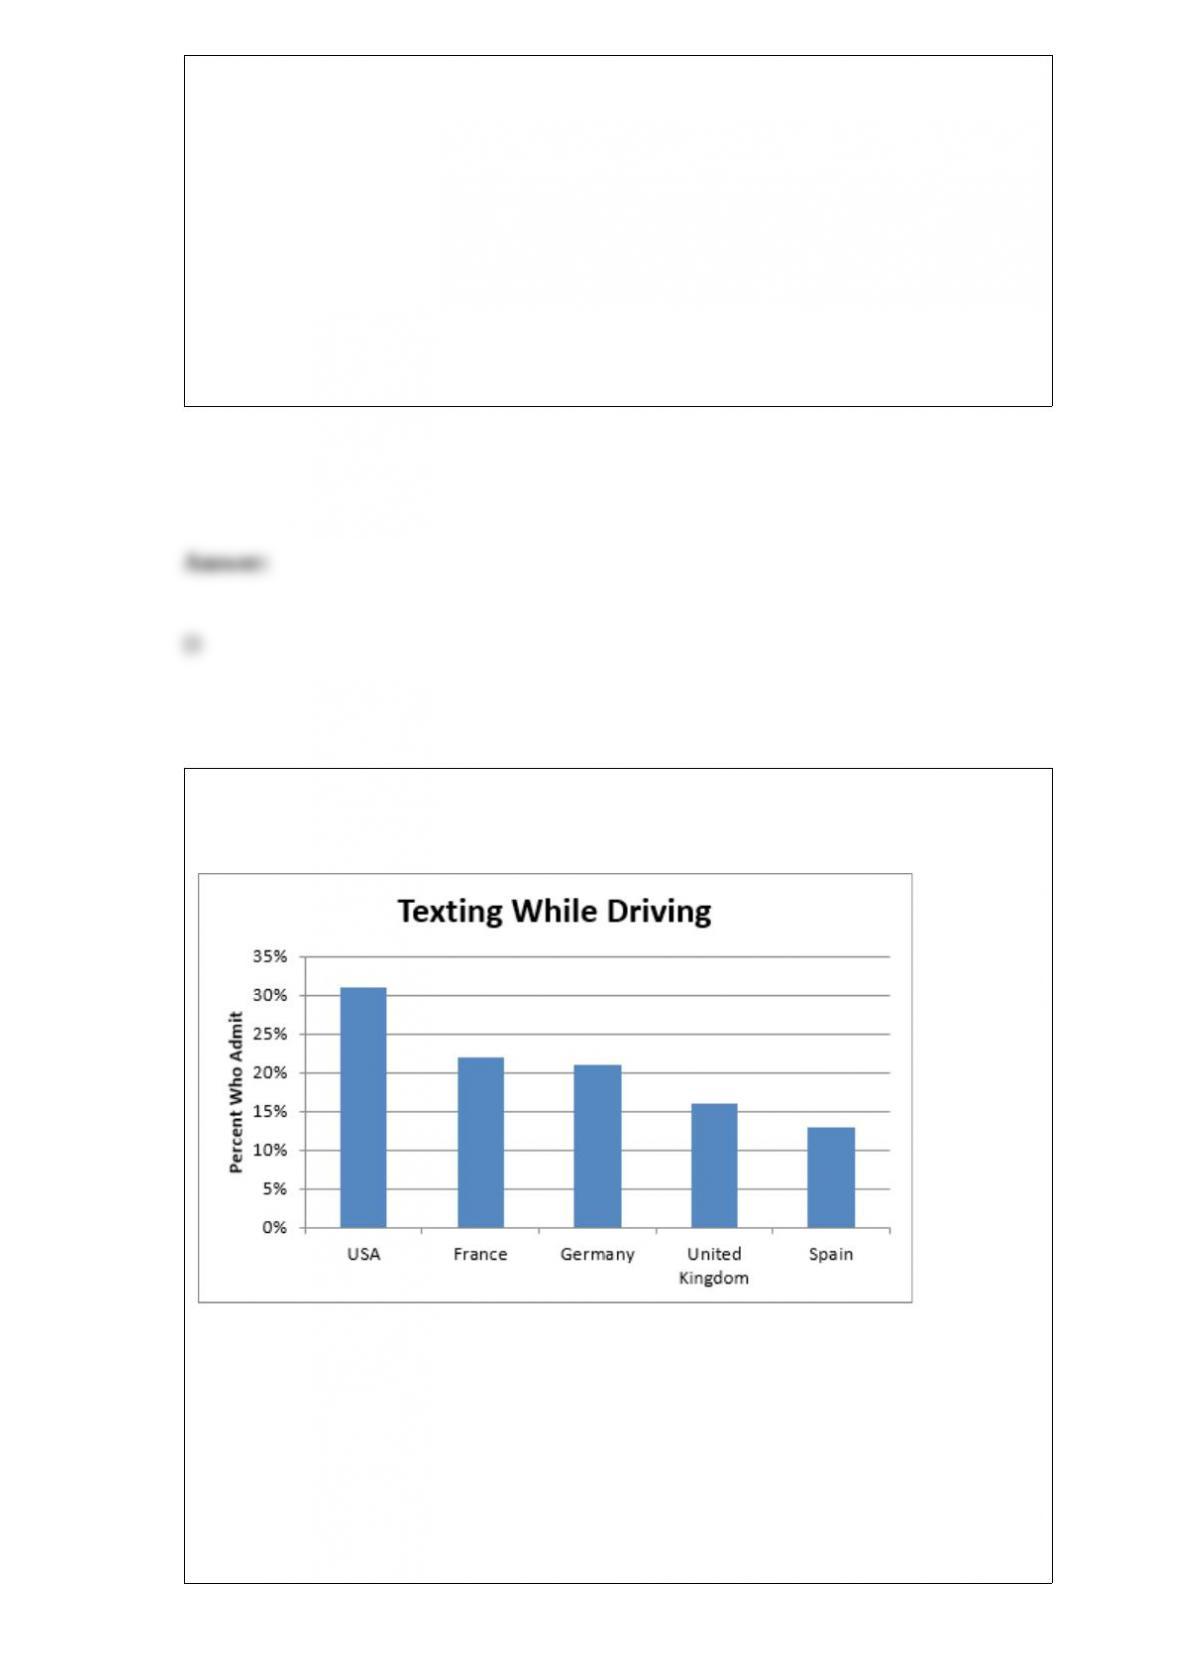
The following chart shows the percentage of adults from various countries who
admitted to texting while driving in a recent survey.
This chart is an example of a _________ bar chart.
A) horizontal
B) stacked
C) clustered
D) vertical
Progressive Insurance would like to test the hypothesis that a difference exists in the
proportion of students in 12th grade who text while driving when compared to the
proportion of 11th grade drivers who text. A random sample of 160 12th grade students
found that 84 texted while driving. A random sample of 175 11th grade students found
that 70 texted while driving. If Population 1 is defined as 12th grade drivers and
Population 2 is defined as 11th grade drivers, the correct hypothesis statement for this
hypothesis test would be
_______________________________.
A)
B)
C)
D)
A random sample of 17 hotels in Boston had an average nightly room rate of $165.40

with a sample standard deviation of $21.70. The critical value for a 98% confidence
interval around this sample mean is ________.
A) 2.921
B) 2.898
C) 2.567
D) 2.583
With the wide range of computer software available to generate forecasts from
time-series data, it is not necessary to construct an XY scatter plot of the data.
The percentile rank identifies the percentile of a particular value within a set of data.

A large statistics class meets on Monday, Wednesday, and Friday each week during the
semester. The following data shows the number of absent students for the last nine
classes.
The normalized seasonal factor for Friday is ________.
A) 0.6635
B) 0.9266
C) 1.2355
D) 1.4262
Which one of the following statements is true for a right-skewed distribution?
A) The mean is greater than the median.
B) The mean is less than the median.
C) The mean is greater than the mode.
D) The mean is roughly equal to the median.
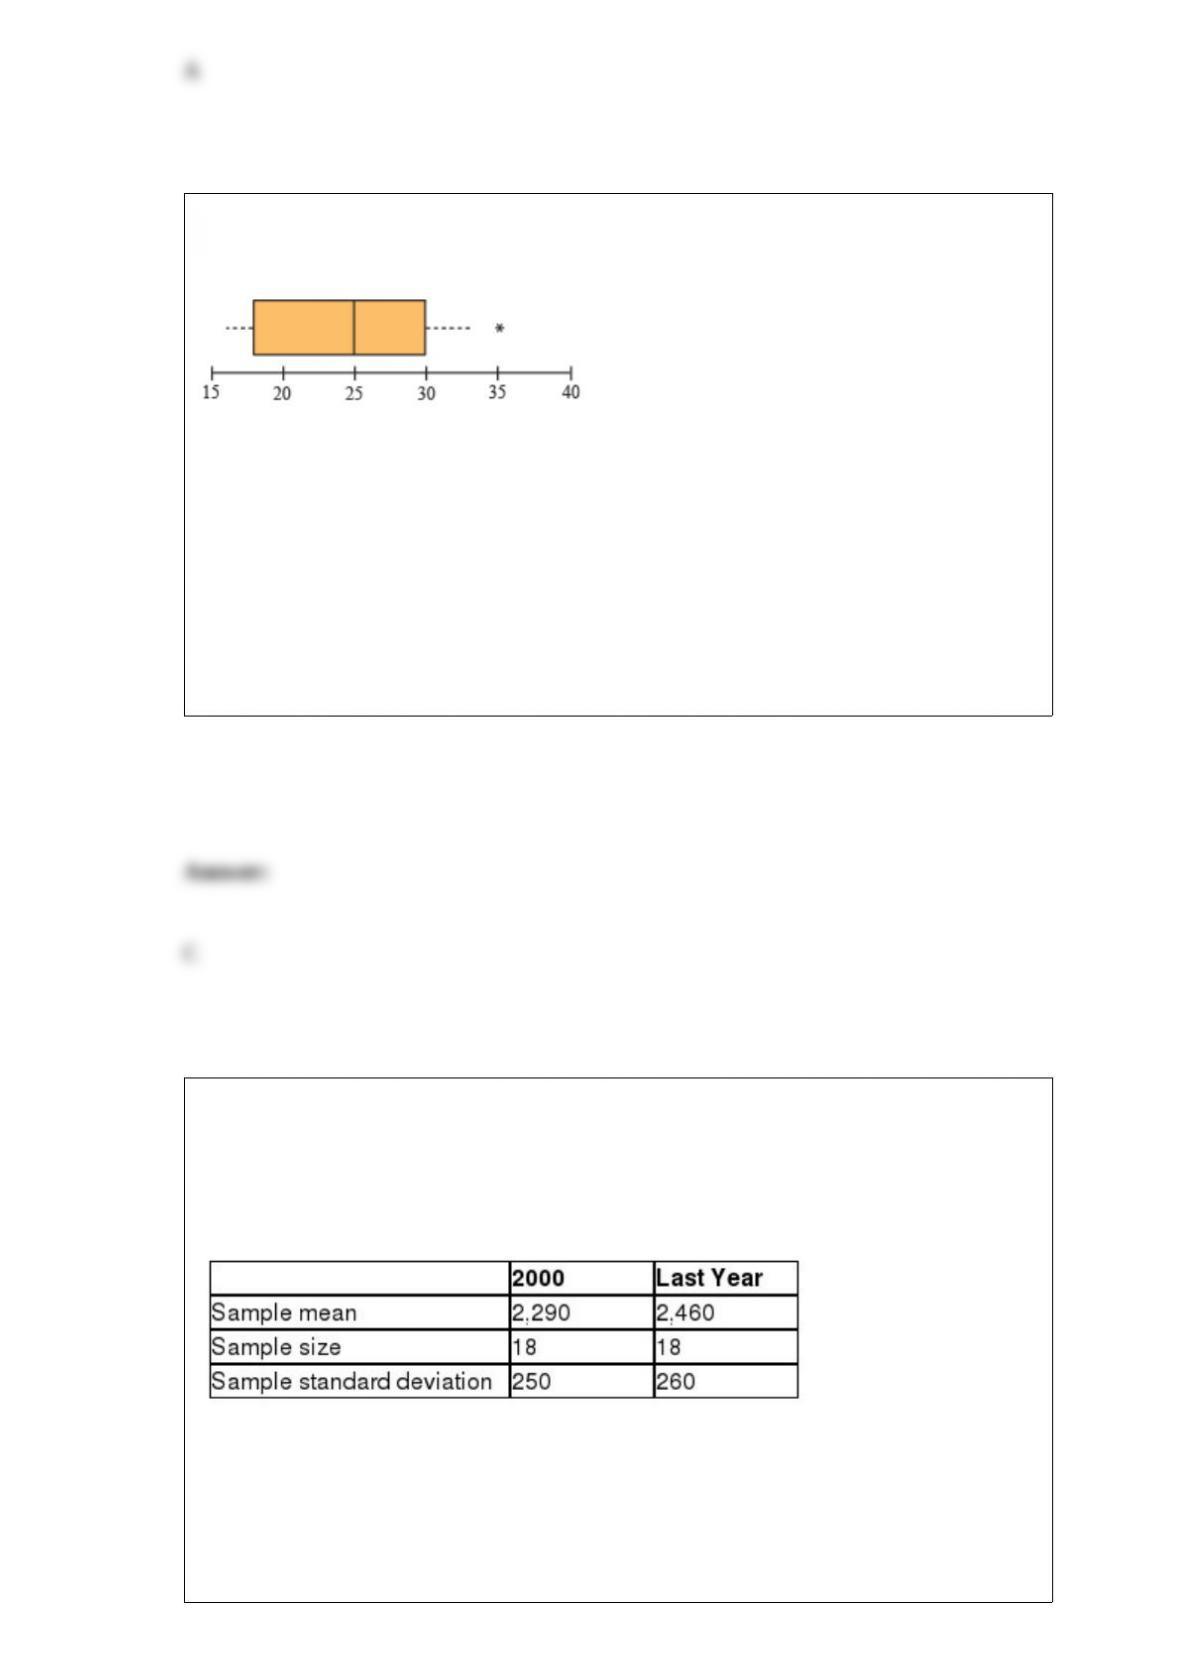
Season’s Pizza delivers food items to homes in their local area. The following
box-and-whisker plot describes the distribution for delivery times in minutes.
Based on this plot, which one of the following statements is correct?
A) The average delivery time is 25 minutes.
B) There are no outliers in this data set.
C) The 75th percentile in this data set is 30 minutes.
D) The second quartile is approximately 18 minutes.
The Department of Housing and Urban Development (HUD) would like to test the
hypothesis that the average size of a newly constructed house last year is different from
the average size of a newly constructed house in 2000. The following data summarizes
the sample statistics for house sizes, in square feet, for both years. Assume that the
population variances are equal.
If Population 1 is defined as homes built in 2000 and Population 2 is defined as homes
built last year, and using α = 0.10, which one of the following statements is true?
A) Because the p-value is greater than α, HUD can conclude that the average size of a
newly constructed house last year is different from the average size of a newly

constructed house in 2000.
B) Because the p-value is greater than α, HUD cannot conclude that the average size of
a newly constructed house last year is different from the average size of a newly
constructed house in 2000.
C) Because the p-value is less than α, HUD cannot conclude that the average size of a
newly constructed house last year is different from the average size of a newly
constructed house in 2000.
D) Because the p-value is less than α, HUD can conclude that the average size of a
newly constructed house last year is different from the average size of a newly
constructed house in 2000.
“Gamers” are described as people who regularly play video games. A random sample of
80 people was selected and 50 were found to be male. The margin of error for a 95%
confidence interval for the proportion based on this sample is ________.
A) 0.0527
B) 0.0618
C) 0.0756
D) 0.1060
Suppose Burger King has run a major advertising campaign in the hopes of increasing
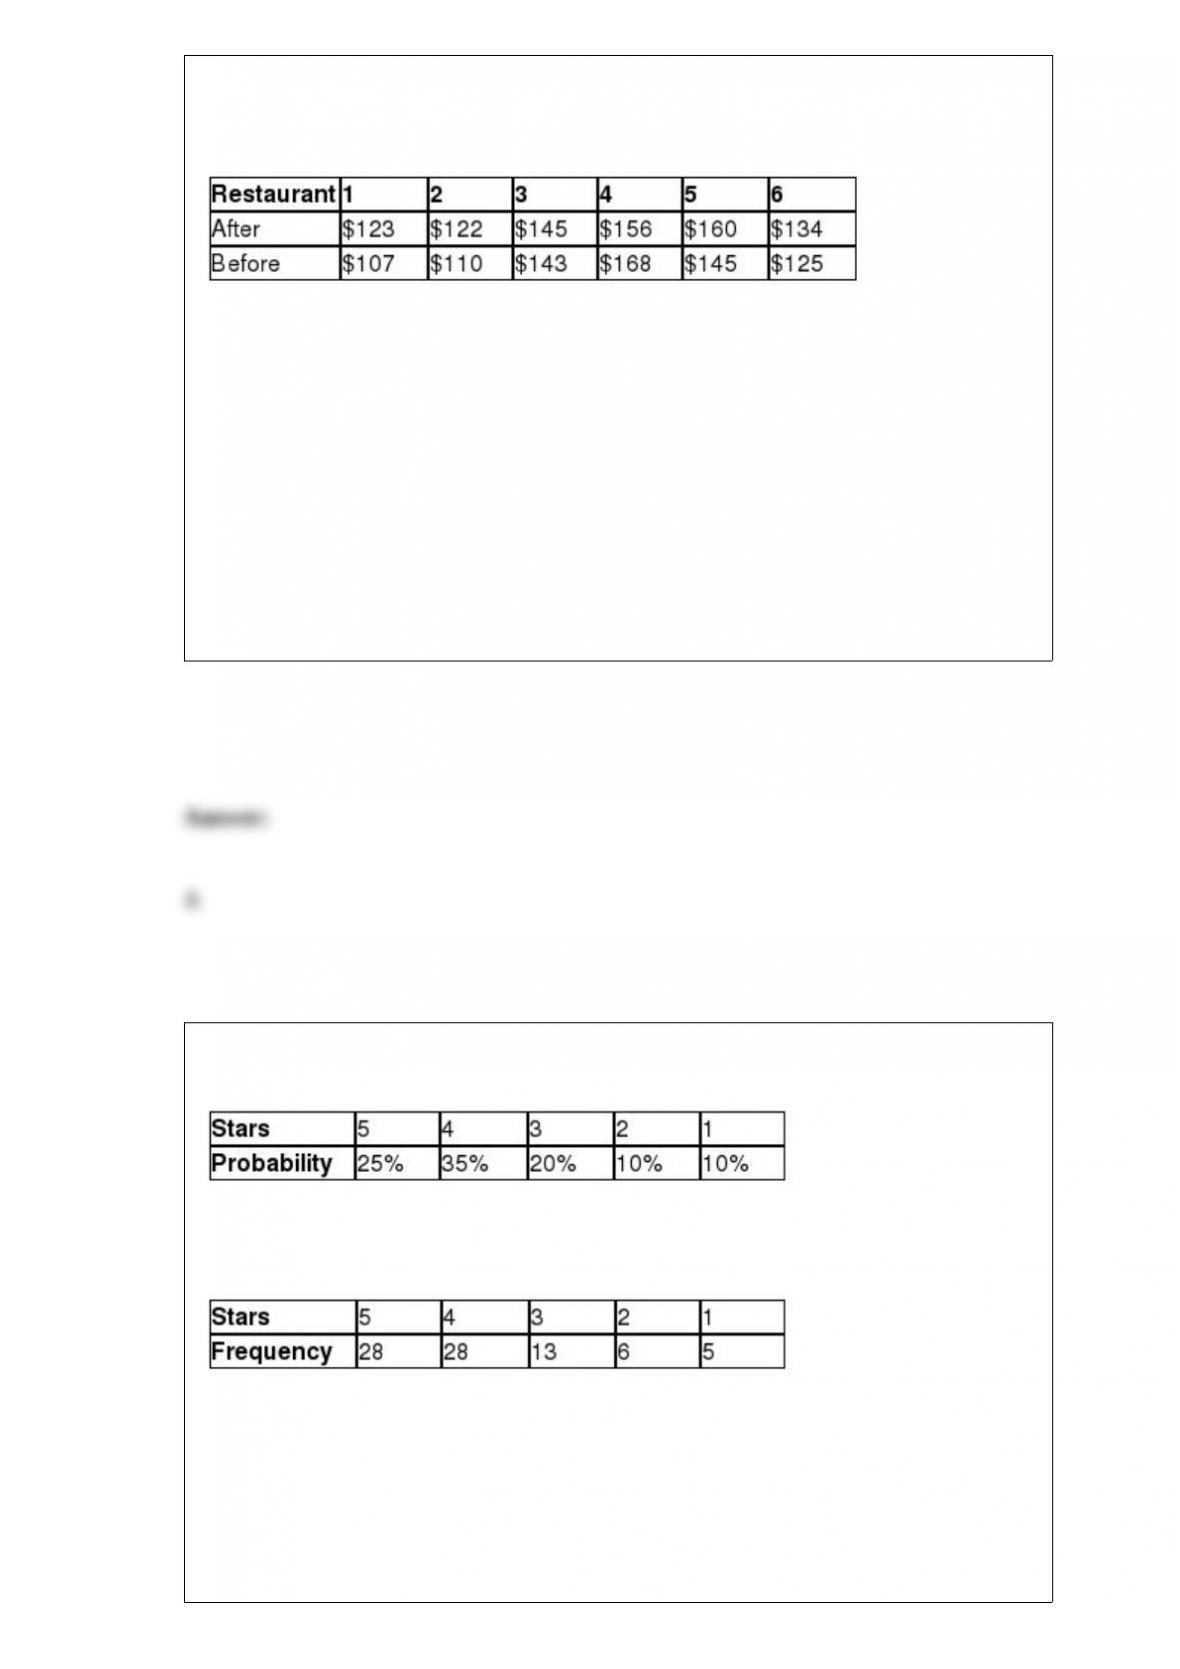
monthly sales. To investigate the effectiveness of this campaign, Burger King randomly
selected seven restaurants and recorded the monthly sales before and after the
advertising. The following data represents these sales figures in thousands of dollars.
If Population 1 is defined as sales after the advertising campaign and Population 2 is
defined as sales before the advertising campaign, the degrees of freedom for this
hypothesis test are ________.
A) 5
B) 6
C) 7
D) 8
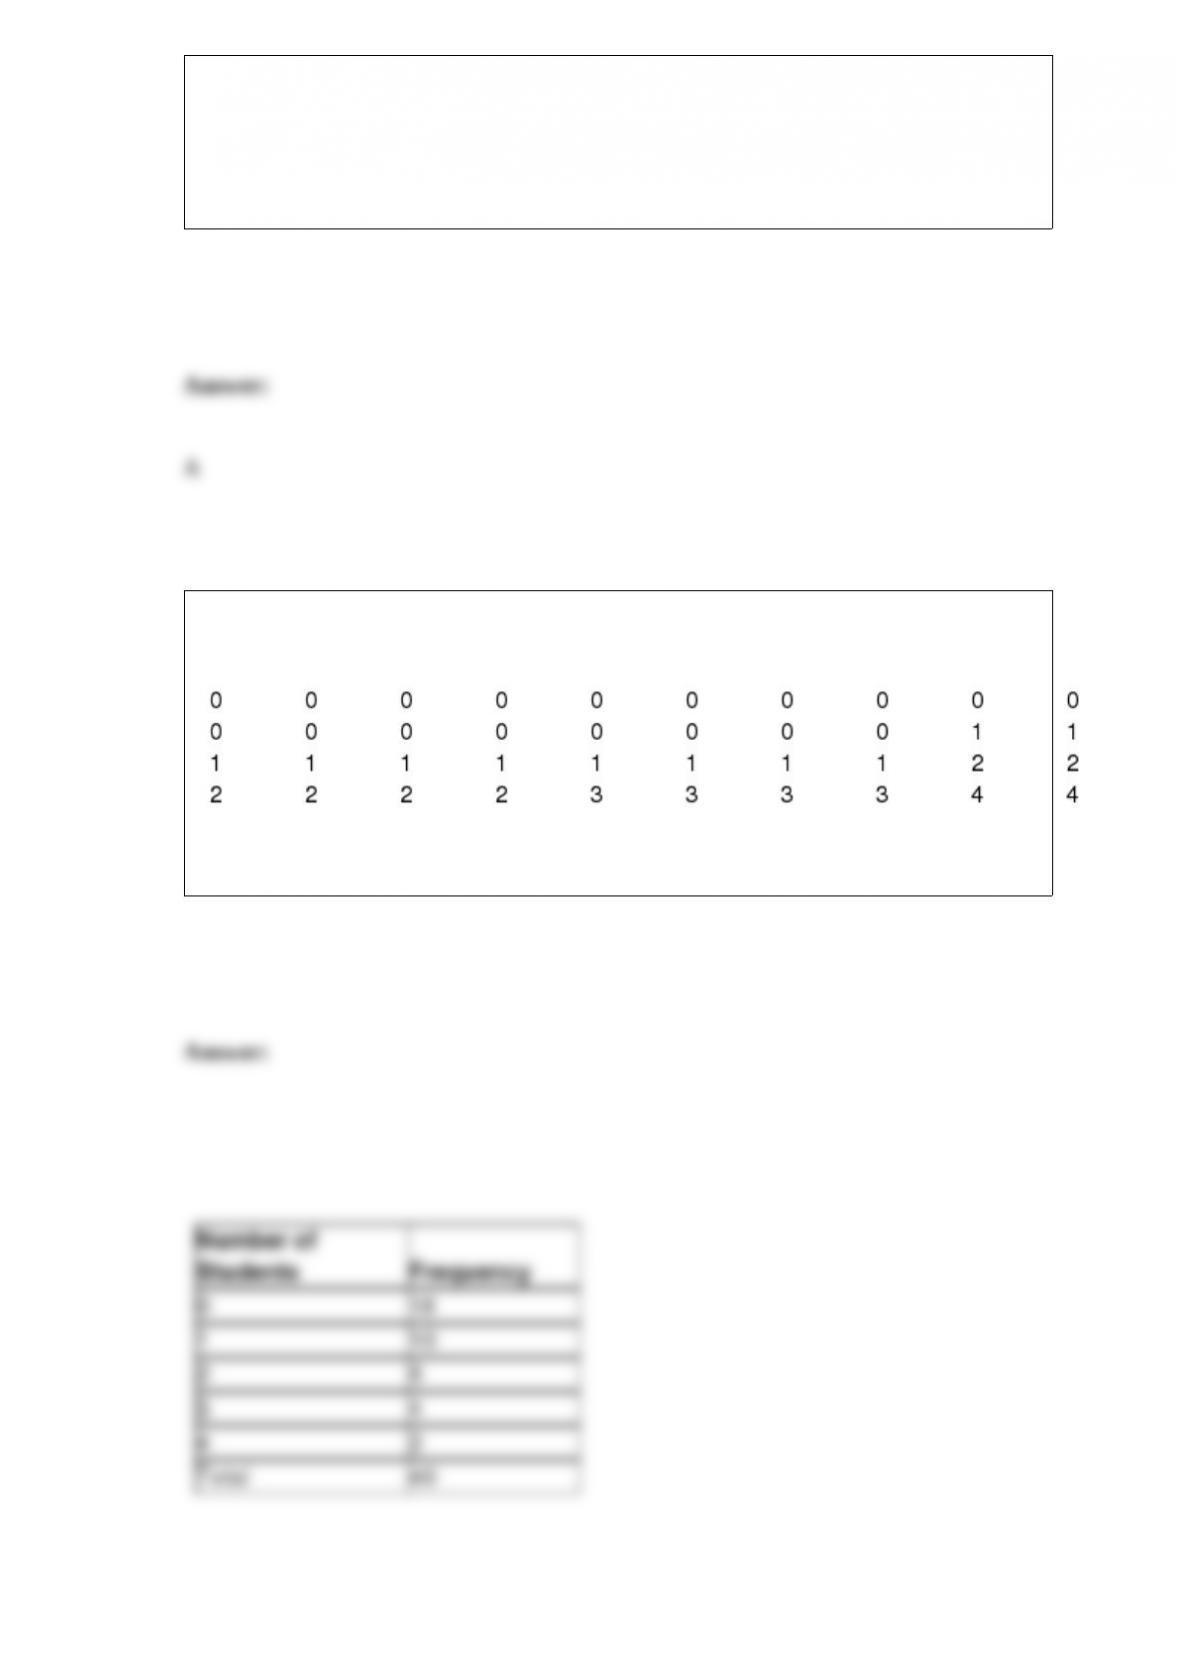
The following data represent the discrete probability distribution for the number of stars
that reviewers gave a first edition statistics reference book.
The second edition of this reference book has been released and a random sample of
people that have purchased the book has been collected with the following results.
The publisher would like to know if the probability distribution for reviews has changed
from the first edition to the second edition using α = 0.025. The expected frequency of
one-star reviews is ________.
A) 8
B) 12
C) 15
D) 21
The following data shows the number of students that came to office hours per day for a
particular faculty member.
Construct a histogram for this data.
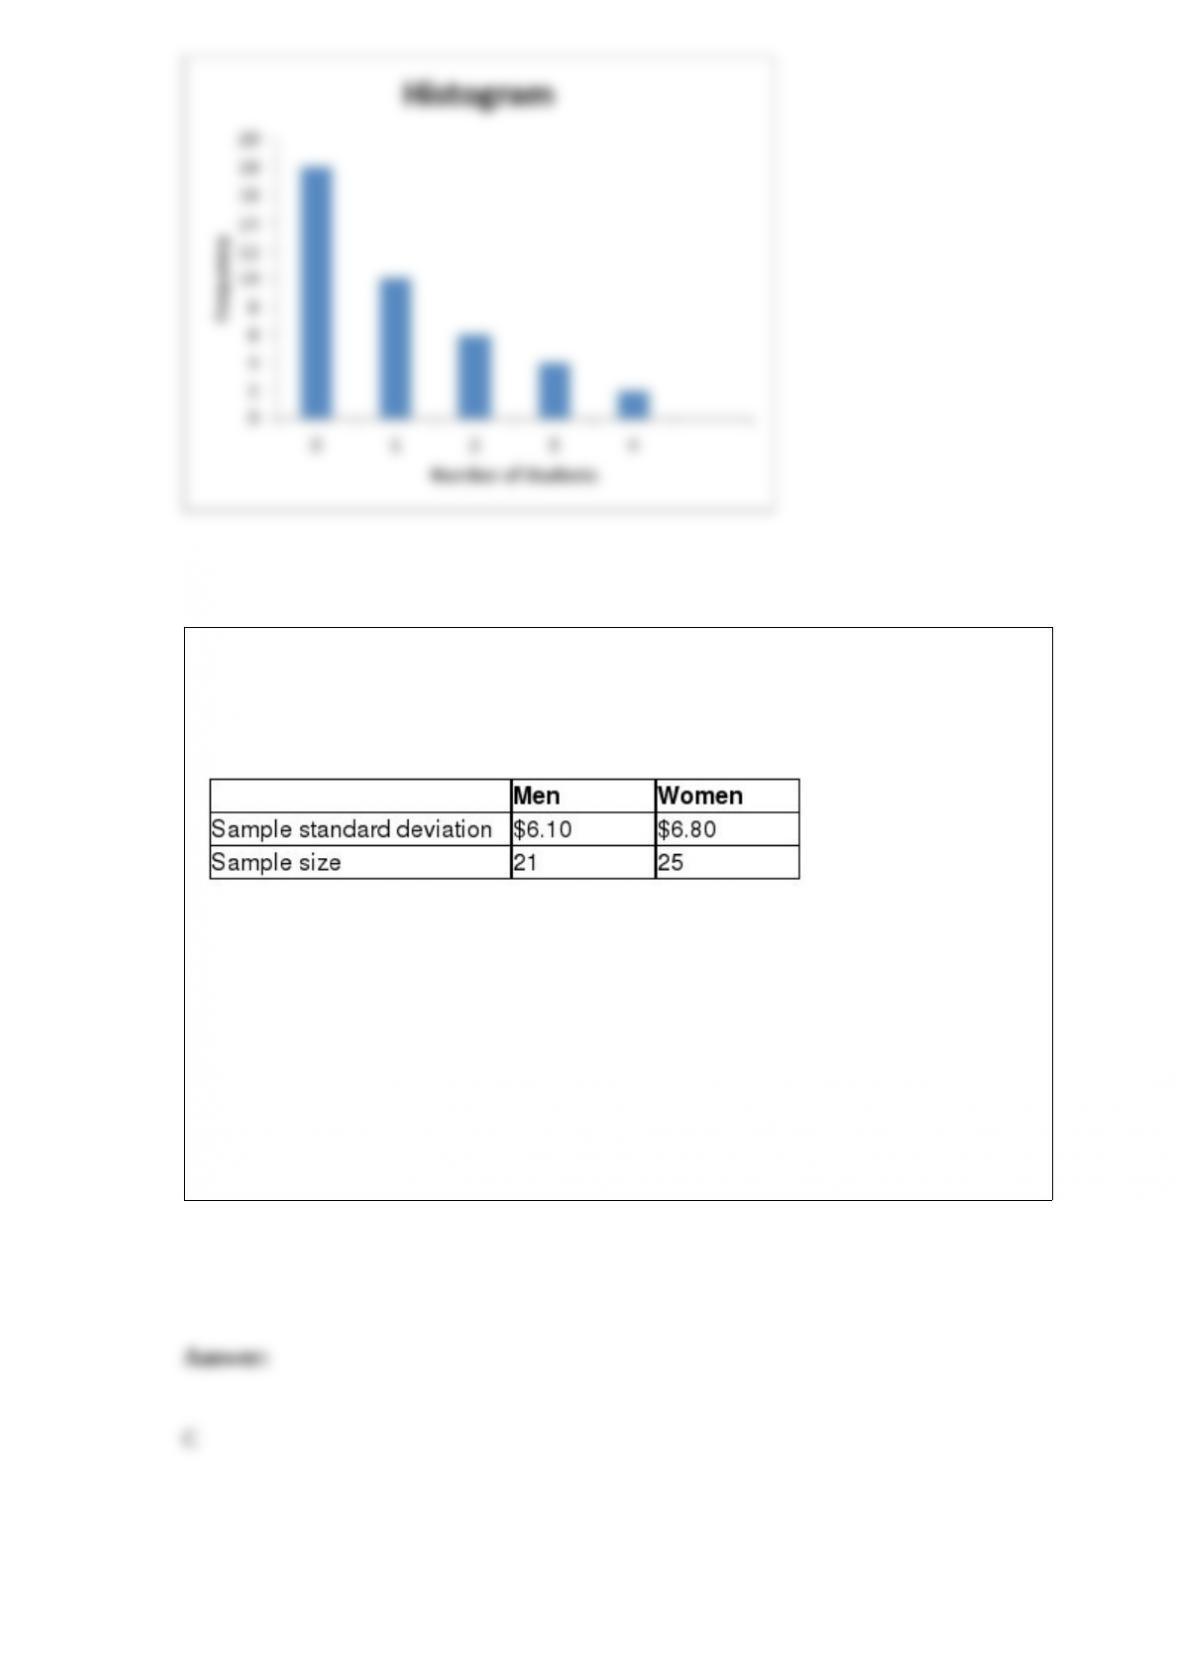
The Canadian government would like to test the hypothesis that the standard deviation
for the hourly wage for men is equal to the standard deviation for the hourly wage for
women. The following data summarizes the sample statistics for hourly wages for men
and women.
The degrees of freedom for the critical value for Population 2 would be ________.
A) 18
B) 19
C) 20
D) 21

Edmunds.com would like to test the hypothesis that the standard deviation for the age
of an imported car on the road is greater than the standard deviation for the age of a
domestic car. The following data shows the ages of a random sample of import and
domestic cars.
The correct hypothesis statement would be ________________.
A)
B)
C)
D)
Which of the following statements is not true concerning the attributes of z-scores?
A) z-scores are positive for data values above the mean of the distribution.
B) z-scores are negative for data values below the mean of the distribution.
C) z-scores can be positive or negative for data values above the mean of the
distribution.
D) z-scores are equal to zero for data values equal to the mean of the distribution.

________ data are values based on observations that can be counted and are typically
represented by whole numbers.
A) Discrete
B) Continuous
C) Nominal
D) Time series
The following data represents the credit scores of the last six people who have applied
for a mortgage at a local PNC Bank branch.
630 715 690 725 630 650
Calculate the median of this sample
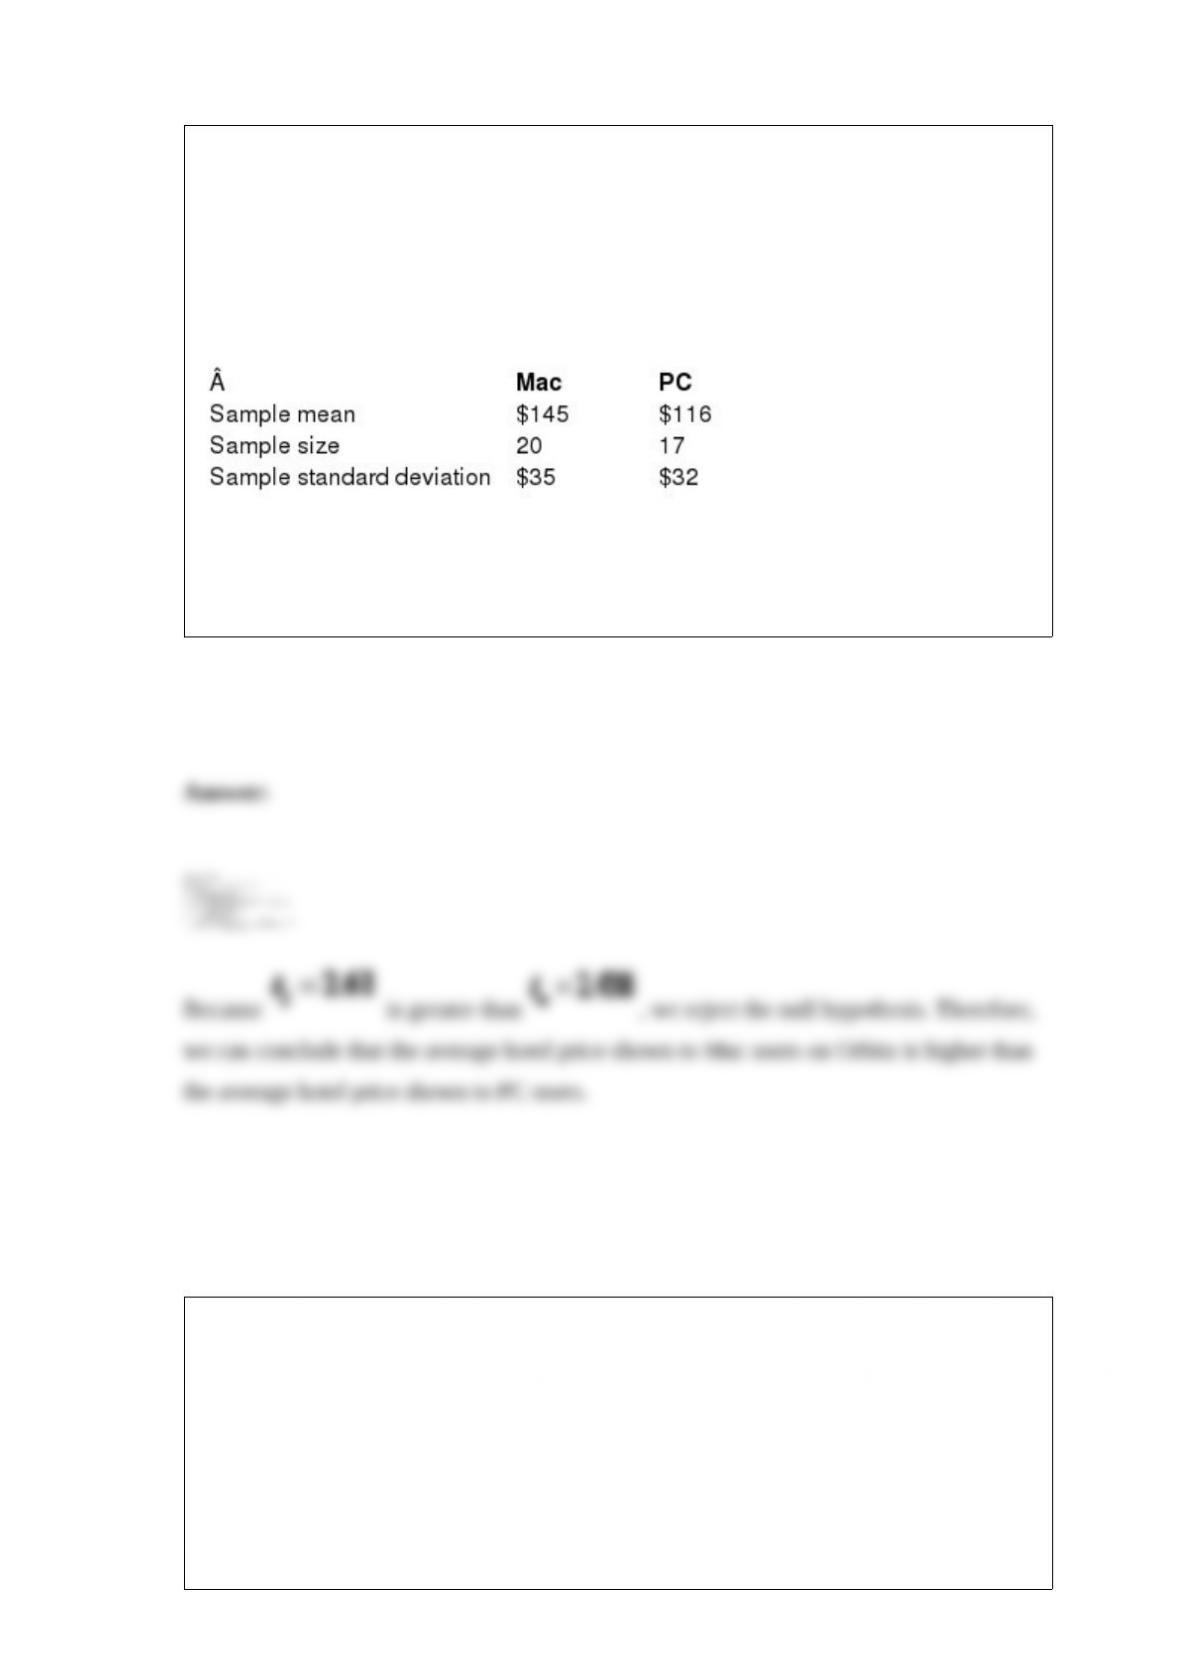
The Wall Street Journal reported that there is evidence that Mac users are shown more
expensive hotel prices when using Orbitz than PC users. Perform a hypothesis test to
determine if the average hotel price for Mac users on Orbitz is higher than for PC users.
The following data summarizes the sample statistics for hotel prices provided to each
type of user from Orbitz. Assume that the population variances are equal.
Define Population 1 as Mac users and Population 2 as PC users and use the critical
value approach to test this hypothesis with α = 0.01.
A soda producer conducts a taste test for two different cola formulations. Each
individual rates one of the formulations on a scale of 1-20. The taste test data is shown
below.
Cola 1:
14 10 11 13 9 15 8
Cola 2:
18 6 17 16 5 15 11
Which formulation provides the most consistent taste test results?
Use the information below to answer the following question(s).
Steve Taylor is the owner of Home Plus, which is a chain of home improvement stores.
He would like to investigate the relationship between month advertising and monthly
sales. The table below shows the amount spent on advertising, in millions of dollars,
over several months along with the corresponding sales, also in millions of dollars.
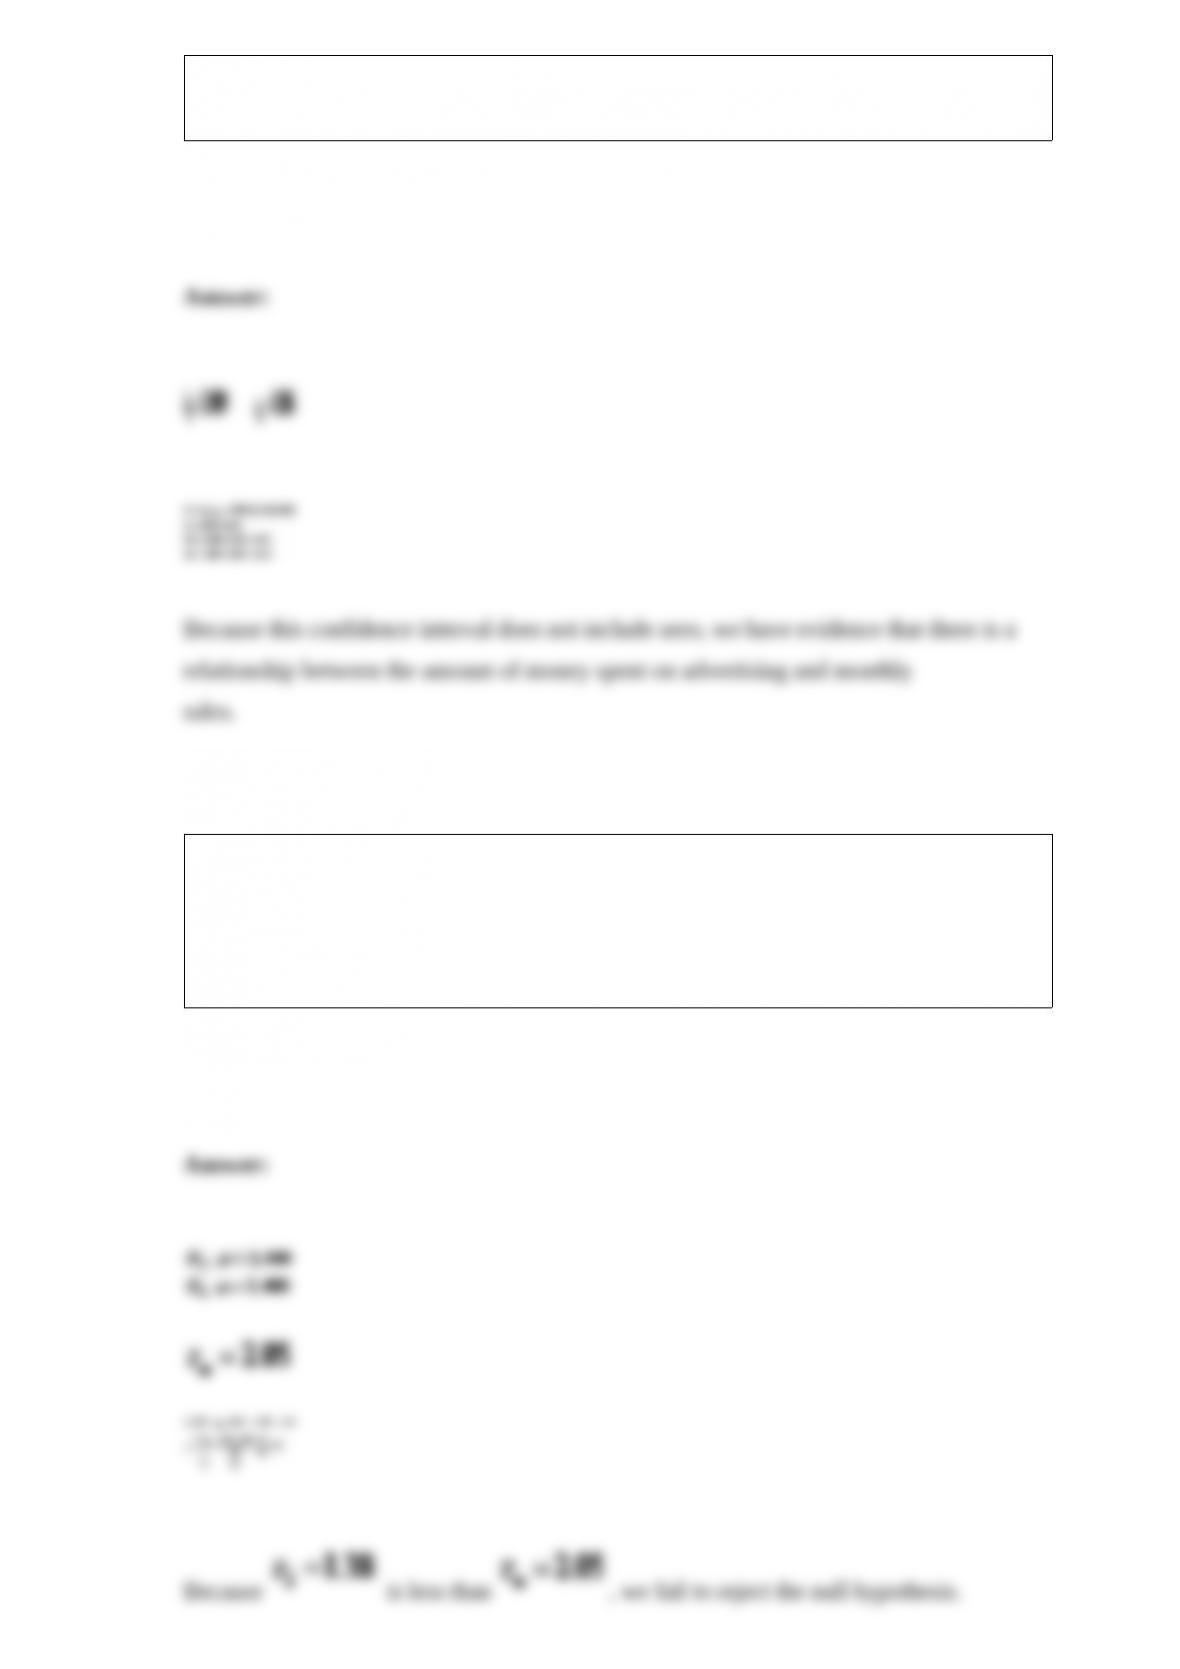
Use the Home Plus data to determine the 95% confidence interval for the slope and
interpret the results.
Toll Brothers is a luxury home builder that would like to test the hypothesis that the
average size of new homes exceeds 2,400 square feet. A random sample of 36 newly
constructed homes had an average of 2,510 square feet. Assume that the standard
deviation of the size for all newly constructed homes is 480 square feet. Toll Brothers
would like to set α = 0.02. Use the critical value approach to test this hypothesis.
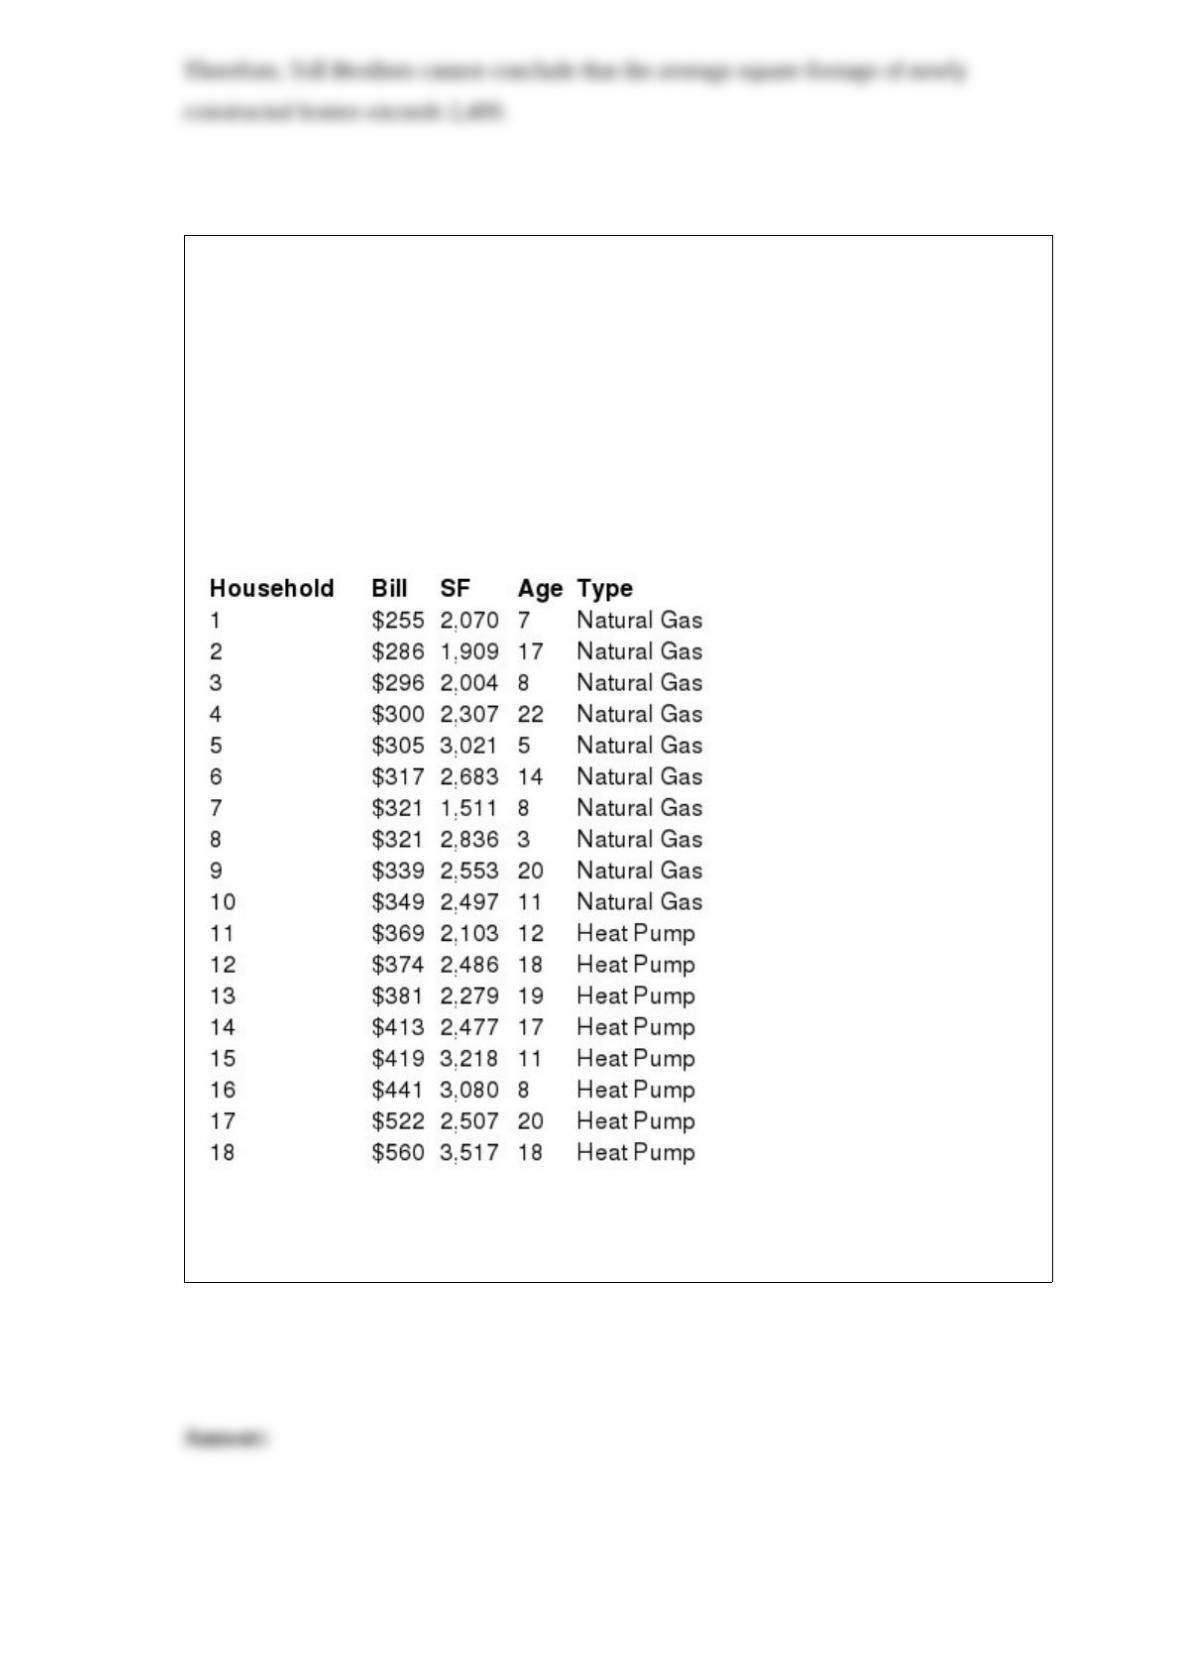
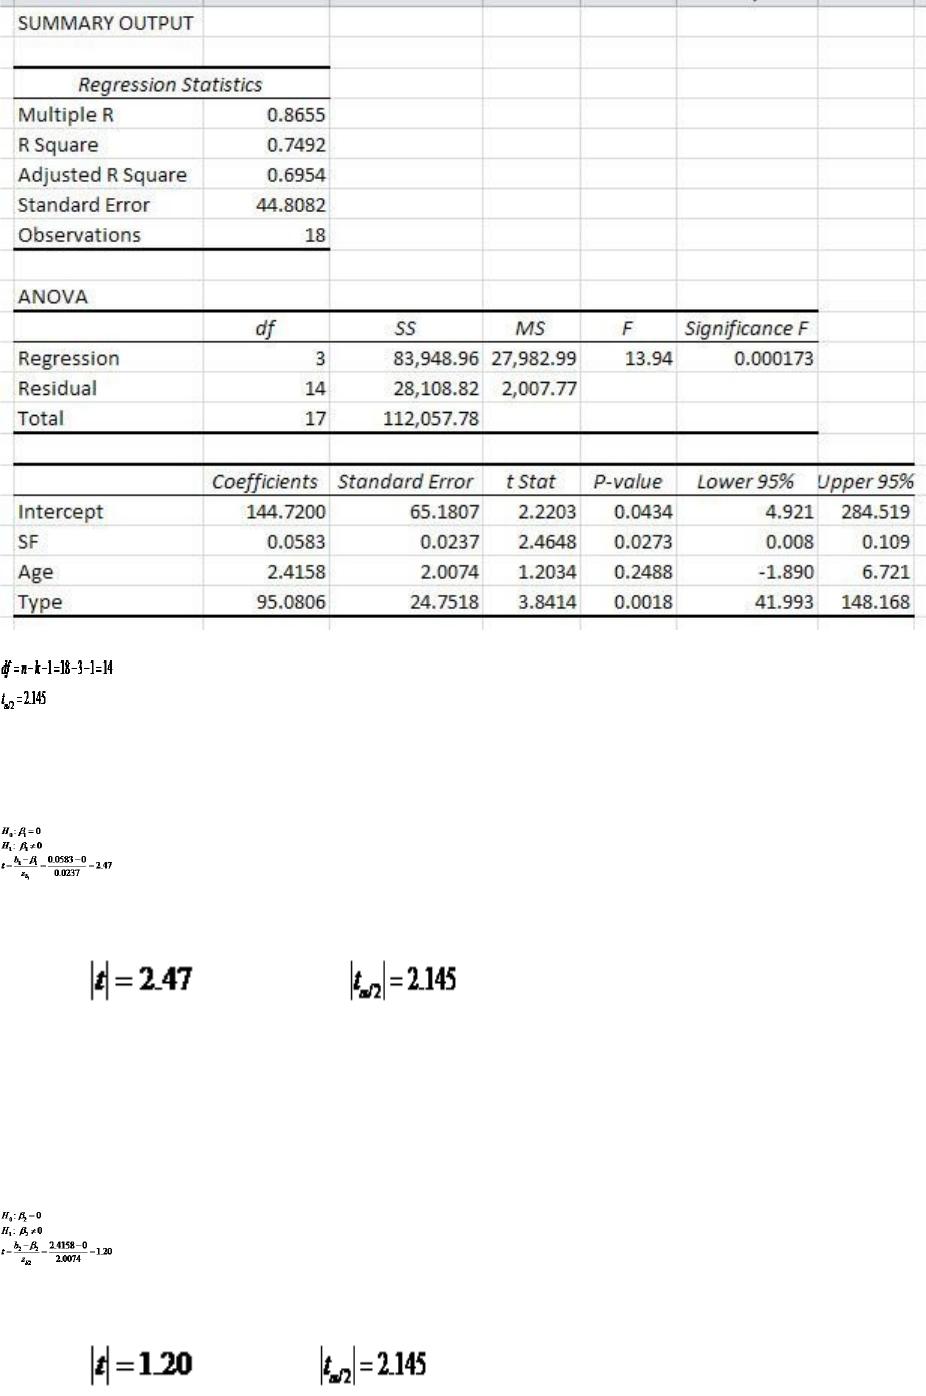
Use the following information to answer the question(s) below.
Delmarva Power is a utility company that would like to predict the monthly heating bill
for a household in Kent County during the month of January. A random sample of 18
households in the county were selected and their January heating bill recorded. This
data is shown in the table below along with the square footage of the house (SF), the
age of the heating system in years (Age,) and the type of heating system (heat pump = 1
or natural gas = 0).
Show the calculations for the test statistic for each regression coefficient for the heating
bill model using α = 0.05 and interpret the results.

The following data represent the number of students who went to the University
Walk-In Clinic for medical attention on campus during the past 15 days.
Test this time series for positive autocorrelation using α = 0.05.