
The three components of the regression model-building process are model specification,
model fitting, and model diagnosis.
A major airline has stated in an industry report that its mean onground time between
domestic flights is less than 18 minutes. To test this, the company plans to sample 36
randomly selected flights and use a significance level of .10. Assuming that the
population standard deviation is known to be 4.0 minutes, if the true population mean is
16 minutes, the decision maker could end up making either a Type I or a Type II error
depending on the sample result.
A cumulative frequency distribution shows the percentage of observations for the
variable of interest with values less than or equal to the upper limit of each class.
When using the Histogram tool in Excel to construct a frequency distribution and
histogram, the bins represent the upper class limits.

The probability of the outcome changes from trial to trial in a binomial experiment.
The multiple coefficient of determination is the average of all the squared correlations
of the independent variables.
In analyzing the sampling distribution of a proportion, doubling the sample size will cut
the standard deviation of the sampling distribution in half.

Three brands of running shoes are each tested by 10 different runners. The amount of
wear on the sole of the shoes is then measured. The objective is to determine if there is
any difference among the three brands of shoes based on how long the soles last. This
means that there is one factor with 10 levels and 3 blocks.
It is possible for a nonstatistical sample to yield statistics that have values closer to the
corresponding parameter than will a statistical sample.
The Sergio Lumber Company manufactures plywood. One step in the process is the one
where the veneer is dried by passing through a huge dryer (similar to an oven) where
much of the moisture in the veneer is extracted. At the end of this step, samples of
veneer are tested for moisture content. It is believed that pine veneer will be less moist
on average than will fir veneer. The following data were reported recently where the
values represent the percent moisture in the wood:
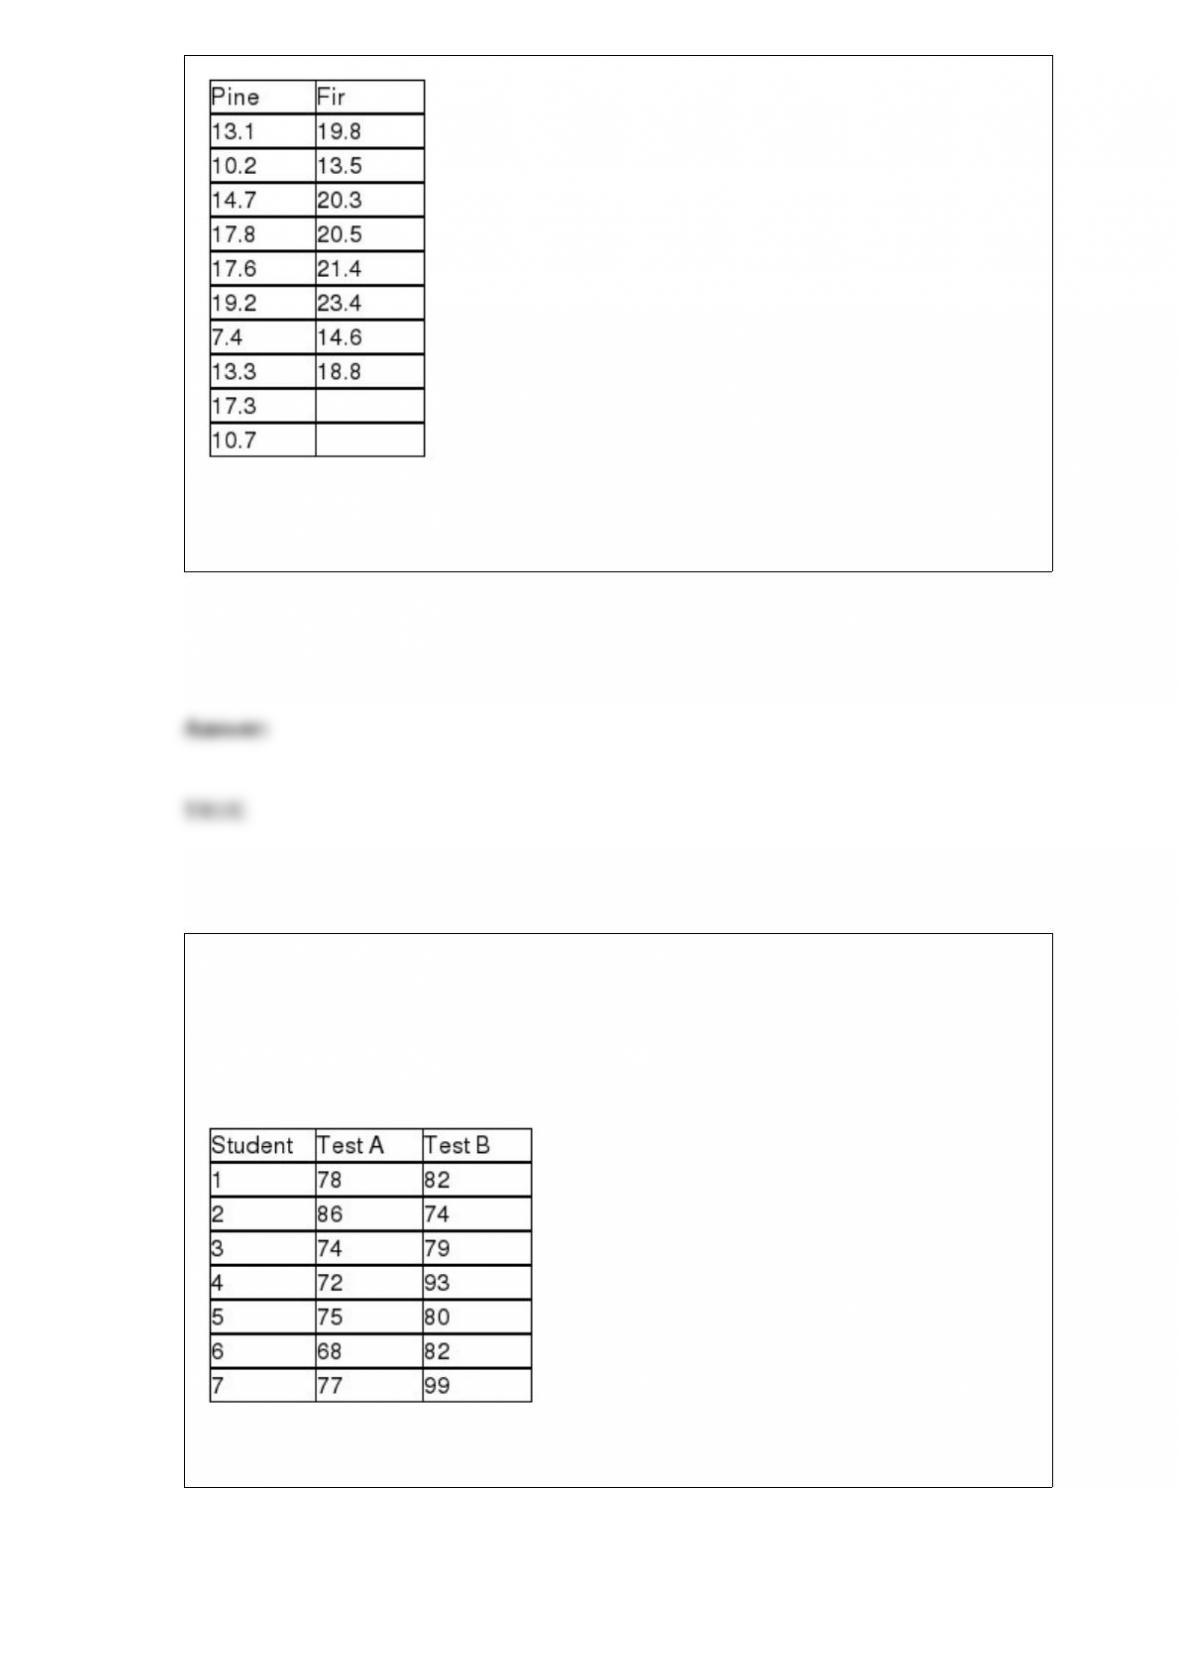
Based on these data, the critical t value from the t-distribution will be 1.7459 if the
significance level is set at 0.05 and variances are presumed equal.
Two placement exams are available that students can take to determine which math
class they should begin with in their freshman year. It is believed that there is no
difference in the mean scores that would be received for the two tests. To test this using
a 0.05 level of significance, a randomly selected group of students took both tests and
had their scores recorded. The following data were obtained:
Based on these data, the test statistic is approximately t = -1.892.

The values of the regression coefficients are found such the sum of the residuals is
minimized.
A stable process is one that has had all its variation removed through quality
improvement efforts on the part of the organization.
If the Viking Sales Company plans to display the sales for each of its six major products
for the year 2001, an effective chart to do this would be a histogram.

A census is an enumeration of the entire sample of items selected from the population
of interest.
If the Durbin-Watson test leads you to reject the null hypothesis, then you are
concluding that the forecast errors are positively autocorrelated.
Data collected on marital status (married, divorced, single, other) would be an ordinal
level variable.
If a decision maker has several potential independent variables to select from in
building a regression model, the variable that, by itself, will always be the most
effective in explaining the variation in the dependent variable will be the variable that
has a correlation closest to positive 1.00.

Acme Taxi has two taxi cabs. The manager tracks the daily revenue for each cab. Over
the past 20 days, Cab A has averaged $76.00 per night with a standard deviation equal
to $11.00. Cab B has averaged $200.00 per night with a standard deviation of $18.00.
Based on this information, the coefficient of variation for Cab B is 9 percent.
A major automobile maker has two models of sedans. The first model has been shown
to get an average of 27 mpg on the highway with a standard deviation equal to 5 mpg.
The second model gets 33 mpg on average with a standard deviation of 8 mpg. Based
on this information the first car model is relatively more variable than the second car
model.
In estimating a population mean, increasing the confidence level will result in a higher
margin of error for a given sample size.

If a process control chart has only one point outside the upper or lower control limits,
there is insufficient evidence to conclude that the process was out of control at the time
that the measurement was taken.
In order to determine whether the median distance for the X-Special golf ball exceeds
the median distance for the best-selling golf ball, six golfers were selected and asked to
hit each ball with their driver. The distance was recorded. The following data were
observed.
The appropriate null and alternative hypotheses are:
H0 : 1 ≤ 2
H0 : 1 > 2

Data gathered from a structured interview is generally easier to analyze than data
collected from an unstructured interview.
Regardless of population distribution, the sampling distribution for a random variable X
will be approximately normally distributed.
In constructing a histogram for a joint frequency distribution, the histogram will have
the most meaning for the decision maker if there are no gaps between the bars on the
histogram.

Recently an article in a newspaper stated that 75 percent of the households in the state
had incomes of $20,200 or below. Given this input, it is certain that mean household
income is less than $20,200.
The Cranston Hardware Company is interested in estimating the difference in the mean
purchase for men customers versus women customers. It wishes to estimate this
difference using a 95 percent confidence level. Assume that the variances are equal and
the populations normally distributed. The following data represent independent samples
from each population:
Based on these data, the company can conclude that there is a statistical difference
between men and women with regard to mean spending at the hardware store with men
tending to spend more on average than women.

If a company has the opportunity to bid on three contracts, A, B, and C, then the
number of these contracts that are awarded to the company would be considered an
elementary event.
Contingency analysis can be used when the level of data measurement is nominal or
ordinal.
Mike runs for the president of the student government and is interested to know
whether the proportion of the student body in favor of him is significantly more than 50
percent. A random sample of 100 students was taken. Fifty-five of them favored Mike.
At a 0.05 level of significance, it can be concluded that the proportion of the students in
favor of Mike
A) is significantly greater than 50 percent because 55 percent of the sample favored
him.
B) is not significantly greater than 50 percent.
C) is significantly greater than 55 percent.
D) is not significantly different from 55 percent.

A company conducted a survey of its employees to determine their level of satisfaction
with various company policies. The data collected from this survey are:
A) primary data.
B) secondary data.
C) experimental data.
D) census data.
If a study is set up in such a way that a sample of people is surveyed to determine
whether they have ever used a particular product, the likely probability distribution that
would describe the random variable, the number who say yes, is a:
A) binomial distribution.
B) Poisson distribution.
C) uniform distribution.
D) continuous distribution.

When using Excel’s Histogram option under the Data Analysis tool, the term bins refers
to:
A) the mid-point of each class.
B) the column where the data are located.
C) the upper limits of each class.
D) the lower limits of each class.
A consumer group plans to test whether a new passenger car that is advertised to have a
mean highway miles per gallon of at least 33 actually meets this level. They plan to test
the hypothesis using a significance level of 0.05 and a sample size of n = 100 cars. It is
believed that the population standard deviation is 3 mpg. Based upon this information,
if the “true” population mean is 32.0 mpg, what is the probability that the test will lead
the consumer group to reject the claimed mileage for this car?
A) About 0.075
B) Approximately 0.95
C) 0.05
D) None of the above

A random sample of two variables, x and y, produced the following observations:
Compute the correlation coefficient for these sample data.
A) -0.9707
B) -0.2141
C) 0.5133
D) 0.8612
Dell Computers receives large shipments of microprocessors from Intel Corp. It must
try to ensure the proportion of microprocessors that are defective is small. Suppose Dell
decides to test five microprocessors out of a shipment of thousands of these
microprocessors. Suppose that if at least one of the microprocessors is defective, the
shipment is returned.
Calculate the probability that the entire shipment will be kept by Dell even though the
shipment has 10% defective microprocessors.
A) 0.3995
B) 0.3979
C) 0.5905

D) 0.4550
A national car rental company recently conducted a study recently in which cars with
automatic and standard transmissions (factor A-Sample) were rented to male and female
customers (factor B-Columns). Three customers in each category were randomly
selected and the miles driven per day was recorded as follows:
Based on these sample data, and alpha = .05, which of the following statements is true?
A) The means for factor A are significantly different.
B) There is no significant interaction between factors A and B.
C) The means for factor B are significantly different.
D) All of the above statements are true.
The editors of a national automotive magazine recently studied 30 different automobiles
sold in the United States with the intent of seeing whether they could develop a multiple
regression model to explain the variation in highway miles per gallon. A number of

different independent variables were collected. The following regression output (with
some values missing) was recently presented to the editors by the magazine’s analysts:
Based on this output and your understanding of multiple regression analysis, what is the
adjusted R-square value for this model?
A) About 0.82
B) Approximately 0.90
C) Just under 0.48
D) None of the above
Given the following null and alternative hypotheses
H0 : μ1 – μ2 = 0
HA : μ1 – μ2 ≠ 0

Together with the following sample information
Test the null hypothesis and indicate whether the sample information leads you to reject
or fail to reject the null hypothesis, assuming a significance level of 0.05 is to be used.
Use the test statistic approach.
A) Since 0.812 < 1.9698 reject H0
B) Since 1.041 < 1.9698 reject H0
C) Since 5.652 > 1.9698 reject H0
D) Since 4.418 > 1.9698 reject H0
A manufacturer of industrial plywood has a contract to supply a boat maker with a large
amount of plywood. One of the specifications calls for the standard deviation in
thickness to not exceed .03 inch. A sample of n = 30 sheets was sampled randomly from
a recent production run. The mean thickness was right at the 3/4 inch target thickness
and the sample standard deviation was .05 inch. Testing at the 0.05 level of
significance, which of the following is true?
A) The test statistic is approximately 80.56.
B) The critical value is approximately χ2 = 43.773.
C) The test statistic is approximately 48.333.
D) Based on the sample data, there is no evidence to suggest that the plywood is not
meeting the specifications.
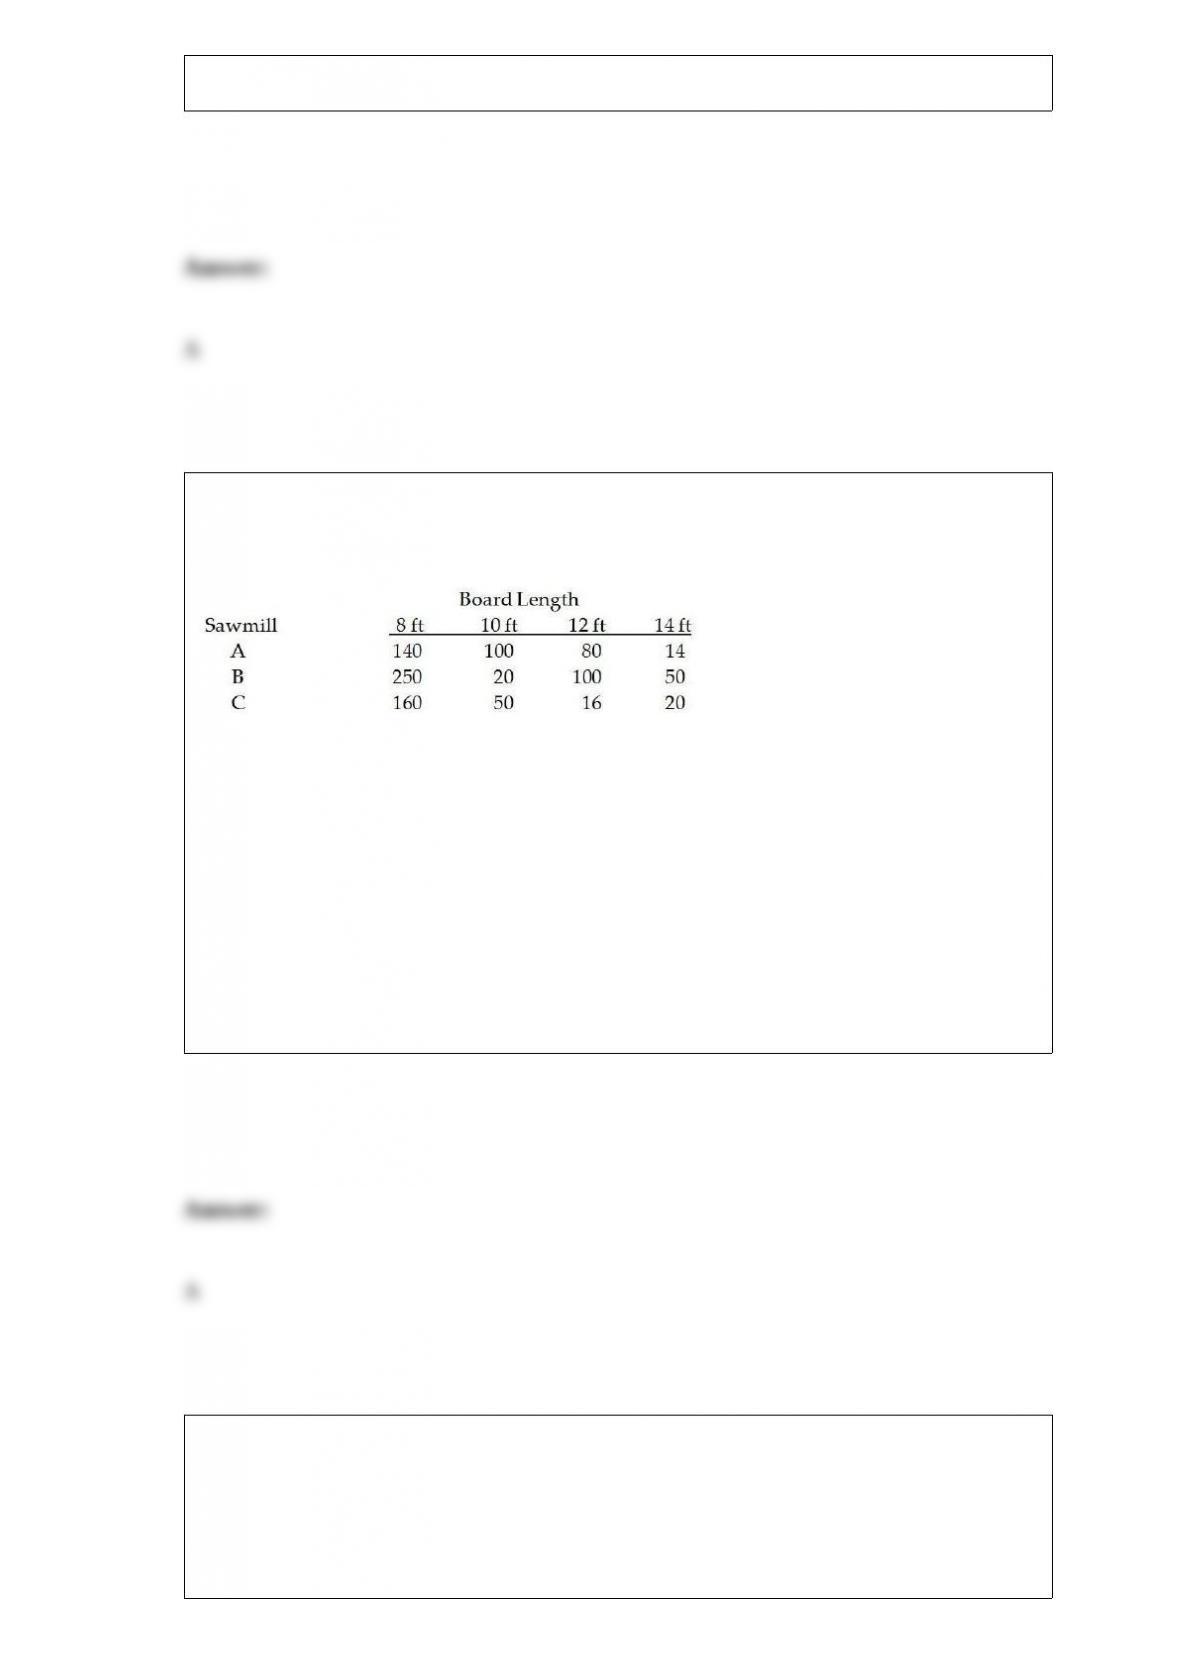
The Anderson Lumber Company has three sawmills that produce boards of different
lengths. The following table is a joint frequency distribution based on a random sample
of 1000 boards selected from the lumber inventory.
Based on these data, if three boards are selected at random, the probability that all three
were made at sawmill A is:
A) 0.037
B) 0.334
C) 1.00
D) 0.556
If a data set has 740 values that have been sorted from low to high, which value in the
data set will be the 20th percentile?
A) The average of the 148th and 149th values

B) The 20th value
C) The 148th value
D) None of the above
A consumer products company is considering introducing a new product nationally. To
help make the decision, it first conducts a test market by selling the product for a few
months in one city. This is an example of:
A) descriptive statistics.
B) charts and graphs.
C) estimation.
D) hypothesis testing.
A cell phone company wants to determine if the use of text messaging is independent of
age. The following data has been collected from a random sample of customers.

To conduct a contingency analysis, the number of degrees of freedom is:
A) 6
B) 5
C) 3
D) 2
Applebee’s International, Inc., is a U.S. company that develops, franchises, and operates
the Applebee’s Neighborhood Grill and Bar restaurant chain. It is the largest chain of
casual dining restaurants in the country, with over 1,500 restaurants across the United
States. The headquarters is located in Overland Park, Kansas. The company is
interested in determining if mean weekly revenue differs among three restaurants in a
particular city. The file entitled Applebees contains revenue data for a sample of weeks
for each of the three locations.
If you did conclude that there was a difference in the average revenue, use Fisher’s LSD
approach to determine which restaurant has the lowest mean sales.
A) There is no difference between the average revenues.
B) Restaurant 1 has the highest average revenue while there is no evidence of a
difference between Restaurant 2’s and 3’s average revenues.
C) Restaurant 3 has the highest average revenue while there is no evidence of a
difference between Restaurant 1’s and 2’s average revenues.
D) Restaurant 2 has the highest average revenue while there is no evidence of a
difference between Restaurant 1’s and 3’s average revenues.

The margin of error is:
A) the largest possible sampling error at a specified level of confidence.
B) the critical value multiplied by the standard error of the sampling distribution.
C) Both A and B
D) the difference between the point estimate and the parameter.
Which of the following is NOT true of a bar chart?
A) It is used for numerical data.
B) The bars can be either horizontal or vertical.
C) It can show either frequency or relative frequency.
D) It is used for categorical data.

When the park ranger at Yellowstone National Park reports the average length of time
that visitors spend in the park, he is using:
A) graphical tools.
B) numerical measures.
C) statistical charts.
D) histograms or bar charts.
A consulting report that was recently submitted to a company indicated that a
hypothesis test for a single population variance was conducted. The report indicated
that the test statistic was 34.79, the hypothesized variance was 345 and the sample
variance 600. However, the report did not indicate what the sample size was. What was
it?
A) n = 100
B) Approximately n = 18
C) Approximately 21
D) Can’t be determined without knowing what alpha is.
A major retail store has studied customer behavior and found that the distribution of
time customers spend in a store per visit is symmetric with a mean equal to 17.3
minutes. Based on this information, which of the following is true?
A) The distribution is right-skewed.
B) The median is to the right of the mean.
C) The median is approximately 17.3 minutes.
D) The median is to the left of the mean.
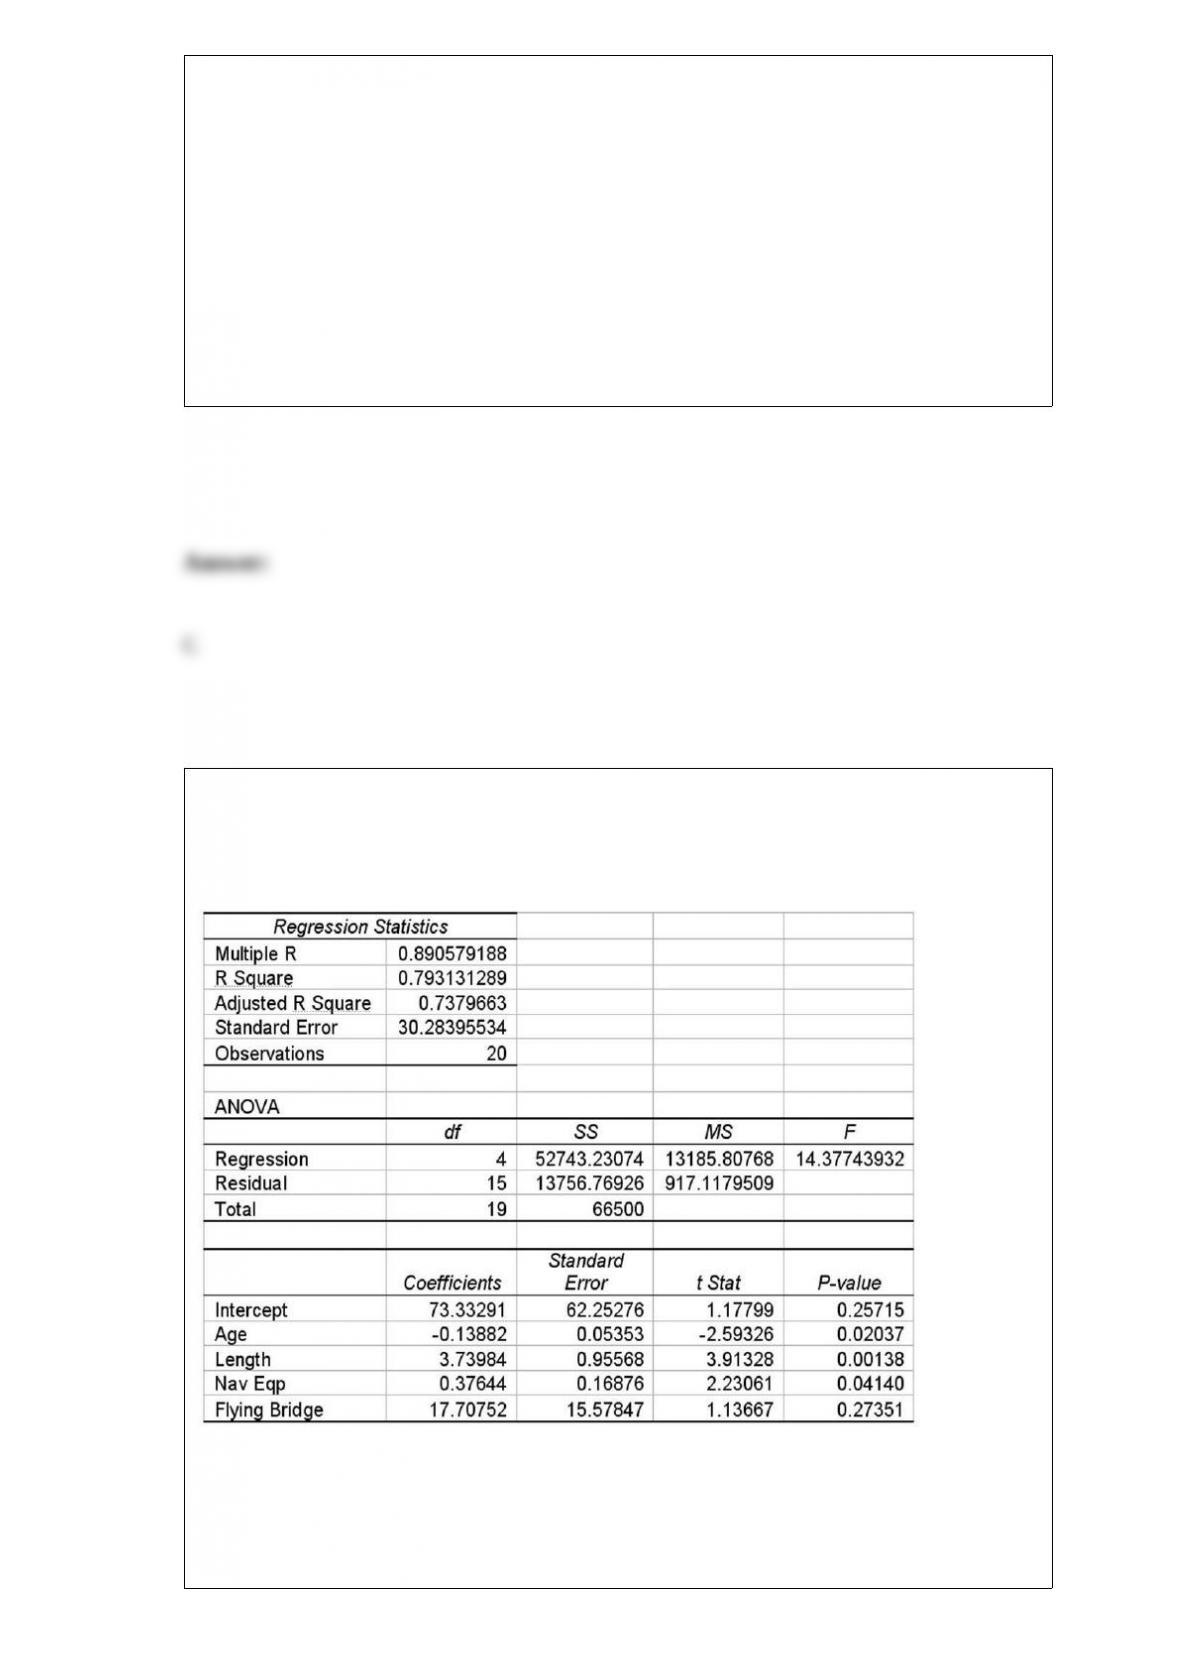
A multiple regression was conducted to predict the price of yachts in thousands of
dollars. A dummy variable was included to indicate whether or not the yacht has a
flying bridge, where 0 means “no” and 1 means “yes.”
Which of the following statements is correct using the 0.10 level of significance?
A) Having a flying bridge significantly increases the price of a yacht by an average of
$17.7, given the other variables present.

B) Having a flying bridge significantly increases the price of a yacht by an average of
$17,708, given the other variables present.
C) We can tell that 17 out of 20 yachts have a flying bridge.
D) Whether or not the yacht has a flying bridge does not significantly affect the price of
a yacht, given the other variables present.
The Boxer Company has been in business since 1998. The following sales data are
recorded by quarter for the years 2010-2012.
The managers at the company wish to determine the seasonal indexes for each quarter
during the year. The first step in the process is to remove the seasonal and random
components. To do this, they will begin by computing a four-period moving average.
They then compute the centered moving average. What is the next step in applying the
multiplicative model?
A) Compute the grand mean
B) Divide the centered moving average by the forecasted value

C) Compute the ratio-to-moving average value
D) Normalize the data
A random variable is normally distributed with a mean of 25 and a standard deviation of
5. If an observation is randomly selected from the distribution, what value will be
exceeded 10% of the time?
A) 31.40
B) 28.60
C) 66.23
D) 14.56
The impact on sampling of increasing the sample size is:
A) the potential for extreme sampling error is reduced.
B) the amount of sampling error is always reduced.
C) the sample mean will always be closer to the population mean.
D) There is no specific relationship between sample size and sampling error.

Allante Pizza delivers pizzas throughout its local market area at no charge to the
customer. However, customers often tip the driver. The owner is interested in estimating
the mean tip income per delivery. To do this, she has selected a simple random sample
of 12 deliveries and has recorded the tips that were received by the drivers. These data
are:
Suppose the owner is interested in developing a 90% confidence interval estimate.
Given the fact that the population standard deviation is unknown, what distribution will
be used to obtain the critical value?
A) s-distribution
B) t-distribution
C) z-distribution
D) k-distribution
Most major airlines allow passengers to carry two pieces of luggage (of a certain
maximum size) onto the plane. However, their studies show that the more carry-on
baggage passengers have, the longer it takes to unload and load passengers. One
regional airline is considering changing its policy to allow only one carry-on per
passenger. Before doing so, it decided to collect some data. Specifically, a random
sample of 1,000 passengers was selected. The passengers were observed, and the
number of bags carried on the plane was noted. Out of the 1,000 passengers, 345 had
more than one bag.

The domestic version of Boeing’s 747 has a capacity for 568 passengers. Determine an
interval estimate of the number of passengers that you would expect to carry more than
one piece of luggage on the plane. Assume the plane is at its passenger capacity.
A) (171.651, 216.214)
B) (174.412, 217.218)
C) (181.514, 208.313)
D) (179.20, 212.716)
A study was recently done in which the brand preference for breakfast cereal was
analyzed against the gender of the shopper. The study consisted of 200 male shoppers
and 300 female shoppers. Three different cereal brands were considered: A, B, and C. A
total of 250 female shoppers preferred brand A, 25 female shoppers preferred brand C.
The number of female shoppers that preferred brand B was:
A) 25.
B) 100.
C) 75.
D) 50.
Which of the following statements is true with respect to the t-distribution?

A) The t-distribution is symmetrical.
B) The exact shape of the t-distribution depends on the number of degrees of freedom.
C) The t-distribution is more spread out than the standard normal distribution.
D) All of the above are true.
An advertising company has developed a new ad for one of the national car
manufacturing companies. The ad agency is interested in testing whether the proportion
of favorable responses to the ad is the same between male adults versus female adults.
It plans on conducting the test using an alpha level equal to 0.05. A sample of 100
adults of each gender will be used in the study. Each person will be asked to view the ad
and indicate whether they find the ad to be “pleasing” or not. Given this, what is the
appropriate null hypothesis?
A) H0 : μ1 = μ2
B) H0 : p1 ≠ p2
C) H0 : 1 = 2
D) H0 : p1 = p2
In a multiple regression analysis involving 15 independent variables and 200
observations, SST = 800 and SSE = 240. The adjusted coefficient of determination is
A) 0.15
B) 0.50
C) 0.66
D) 0.70
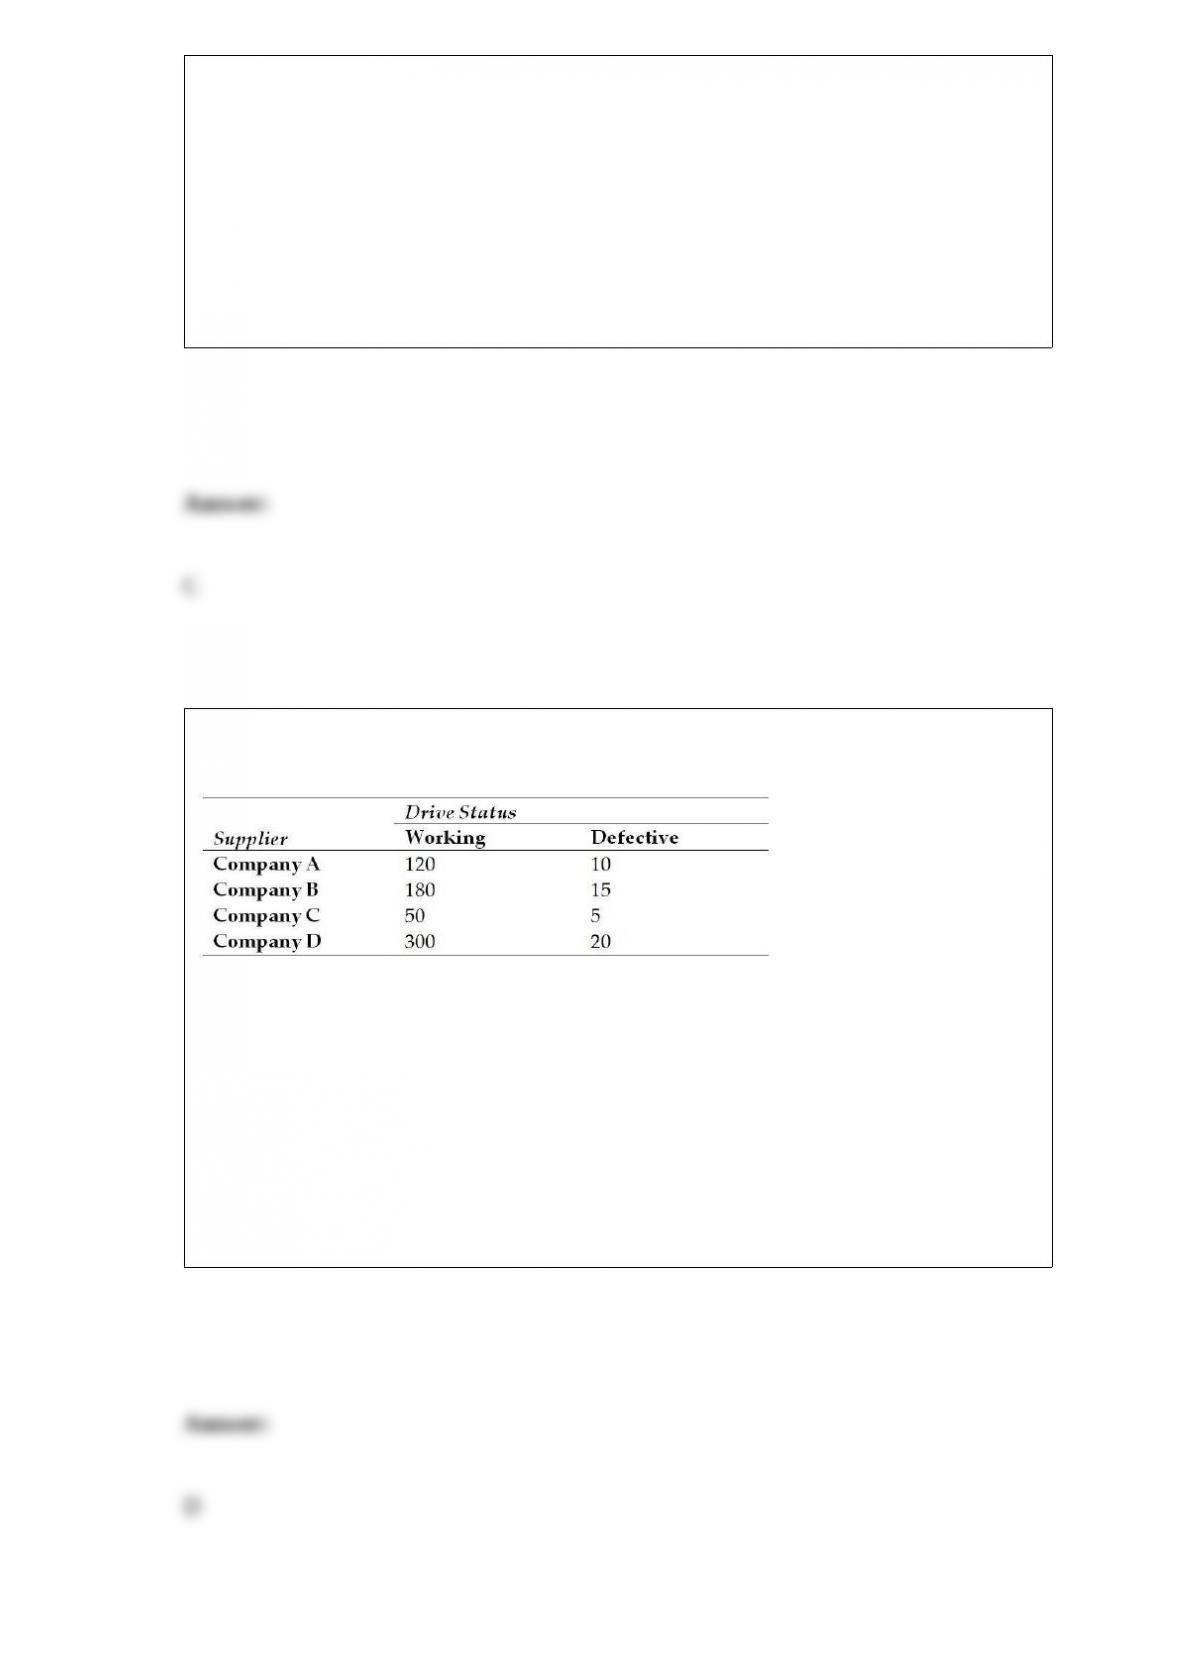
Suppose a quality manager for Dell Computers has collected the following data on the
quality status of disk drives by supplier. She inspected a total of 700 disk drives.
What is the probability of a defect given that company B supplied the disk drive?
A) 0.077
B) 0.28
C) 0.021
D) 0.76

Which of the following is NOT an assumption for the simple linear regression model?
A) The individual error terms are statistically independent.
B) The distribution of the error terms will be skewed left or right depending on the
shape of the dependent variable.
C) The error terms have equal variances for all values of the independent variable.
D) The mean of the dependent variable value for all levels of x can be connected by a
straight line.