
Which one of the following tools is not used to check the normality of residuals
assumption for a multiple regression model?
A. histogram
B. stem-and-leaf display
C. scatter diagram
D. normal plot
A control chart on which the proportions of nonconforming units in subgroups of size n
are plotted versus time is a(n) _____ chart.
A.
B. R
C. p
D. C
A cholesterol test was given to 10 heart patients with high cholesterol levels. The same
10 heart patients are then given a new cholesterol-reducing drug for six months. Before
the patients begin taking the drug, they are told to maintain their current diets and
eating habits so that the effect of the drug can be more effectively determined. After
taking the drug for six months, the same patients are given a cholesterol test again. The
pharmaceutical company manufacturing the medicine wants to know if the drug is
effective in reducing the cholesterol levels of the patients. The cholesterol levels before
and after taking the drug are recorded for each patient. The population of cholesterol

levels is not normally distributed. Which one of the following nonparametric tests is
appropriate for this problem?
A. Wilcoxon signed ranks test
B. Wilcoxon rank sum test
C. sign test
D. Kruskal-Wallis test
E. Spearman’s rank correlation test
When testing the difference between two population proportions, the _______ test
statistic is used.
A. z
B. t
C. F
D. t2
A random variable

A. is the result of a measurement.
B. can only be discrete.
C. assigns one and only one numeric value to each experimental outcome.
D. is a binomial, Poisson, or hypergeometric variable.
A confidence interval for the population mean is an interval constructed around the
____________.
A. sample mean
B. population mean
C. z test statistic
D. t test statistic
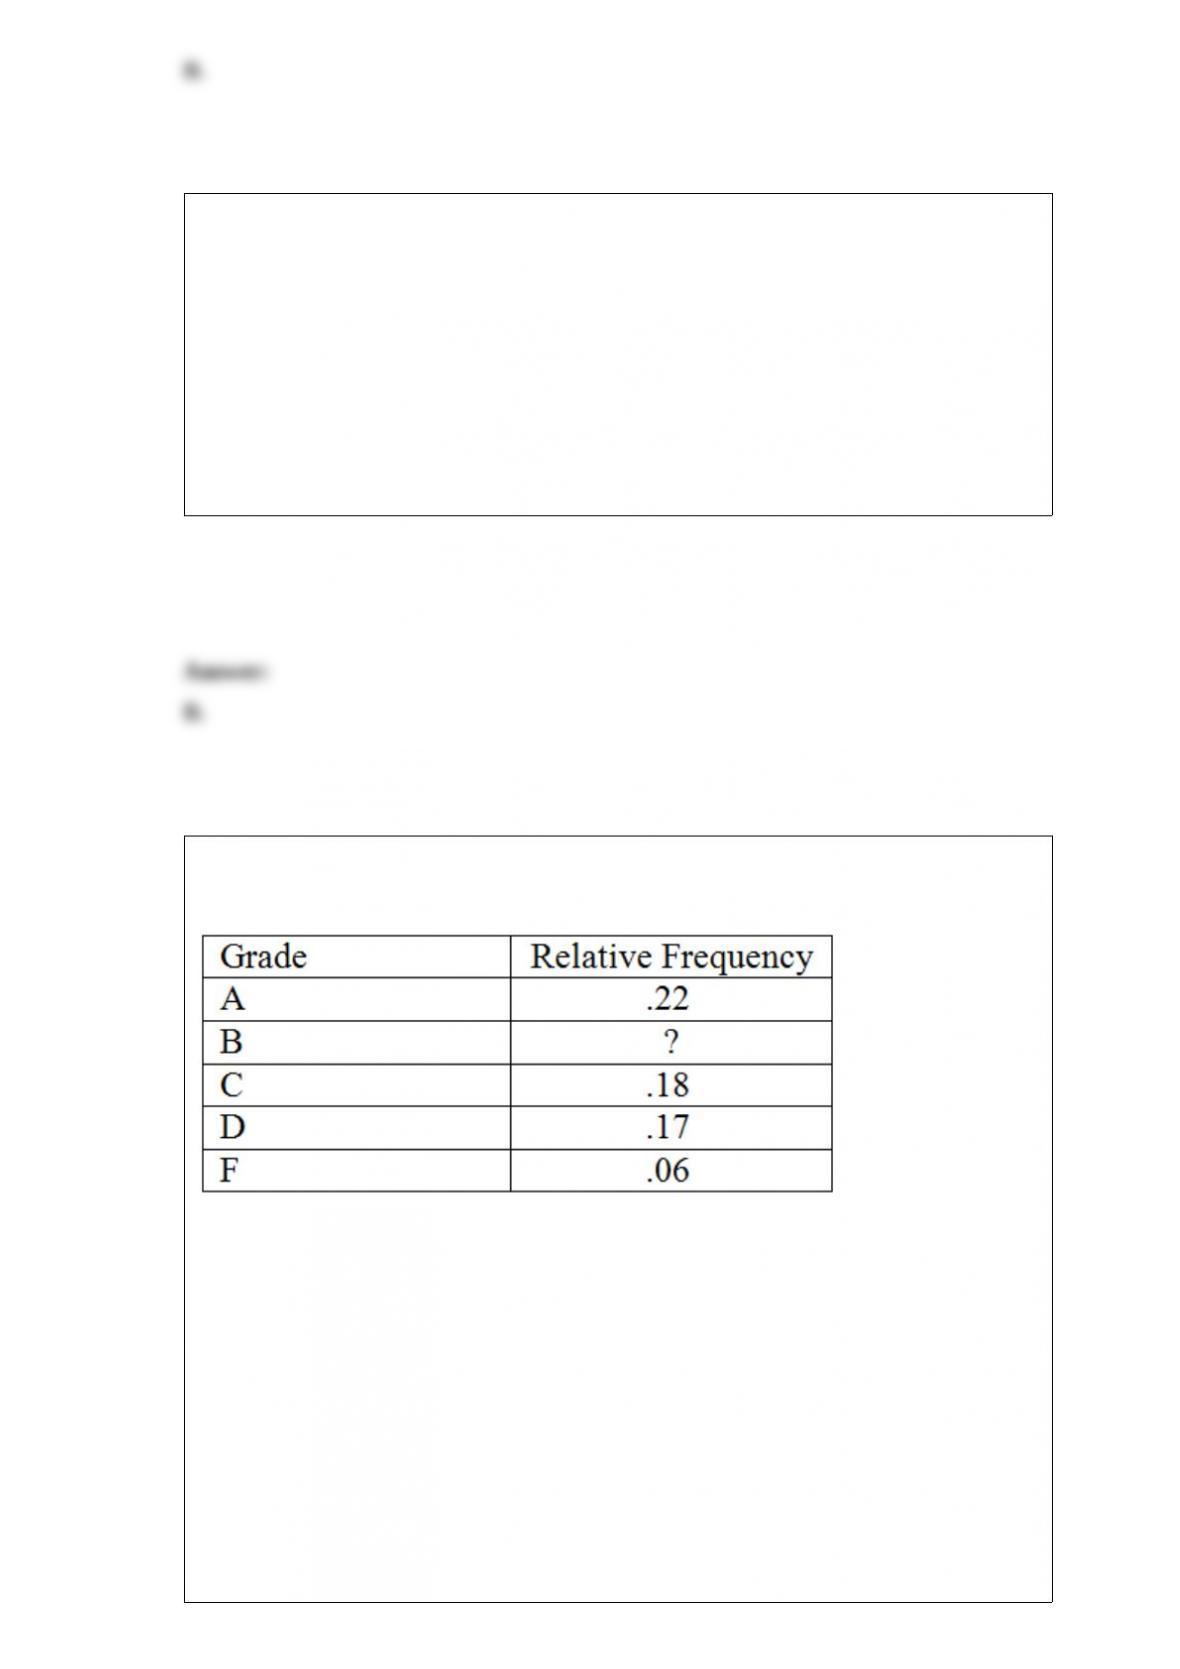
The following is a partial relative frequency distribution of grades in an introductory
statistics course.

Find the relative frequency for the B grade.
A. .78
B. .27
C. .65
D. .37
E. .47
Which, if any, of the following statements about the chi-square test of independence is
false?
A. If ri is the row total for row i and cj is the column total for column j, then the
estimated expected cell frequency corresponding to row i and column j equals (ri)(cj)/n.
B. The test is valid if all of the estimated cell frequencies are at least five.
C. The chi-square statistic is based on (r − 1)(c − 1) degrees of freedom, where r and c
denote, respectively, the number of rows and columns in the contingency table.
D. The alternative hypothesis states that the two classifications are statistically
independent.
E. All of the other statements about the chi-square test of independence are true.

The t distribution approaches the _______________ distribution as the sample size
___________.
A. binomial, increases
B. binomial, decreases
C. z, decreases
D. z, increases
At a college, 70 percent of the students are women, and 50 percent of the students
receive a grade of C. 25 percent of the students are neither female nor C students. Use
this contingency table.
If a student is male, what is the probability he is a C student?
A. 0.05
B. 0.10
C. 0.30

D. 0.17
E. 0.50
A random sample of size 1,000 is taken from a population where p = .20. Find P( < .
22).
A. .2643
B. .9429
C. .9207
D. .0571
In a data set of information on college business students, an example of an element is
their cumulative GPA.

Quality control is an important issue at ACME Company, which manufactures light
bulbs. To test the life hours of their light bulbs, they randomly sampled nine light bulbs
and measured how many hours they lasted (mean = 346.6).
378, 361, 350, 375, 200, 391, 375, 368, 321
What is the variance?
A. 342.43
B. 3424.3
C. 58.5
D. 191
E. 10,609
If p = .5 and n = 4, then the corresponding binomial distribution is ____________.
A. right skewed
B. left skewed
C. symmetric
D. bimodal

The number of defectives in 10 different samples of 100 observations each is the
following: 1, 2, 1, 0, 2, 3, 1, 4, 2, 1. What is the estimate of the population proportion of
defectives?
A. .017
B. .17
C. .016
D. .16
A ___________ is a display of individual measurements versus time.
A. runs plot
B. statistical analysis
C. random sample
D. measurement
Assume that the following data set is not normally distributed.
(21, 18, 4, 9, 14, 16, 17, 12, 15, 8, 7, 5)
If Ha: Md > 6, then the p value is

A. .0161.
B. .0029.
C. .0537.
D. .0322.
E. .0192.
Which one of the following is not an assumption about the residuals in a regression
model?
A. constant variance
B. independence
C. normality
D. variance of zero
E. mean of zero
Using the following data, describe the shape of the data distribution.

A. skewed to the left
B. bimodal
C. normal
D. skewed to the right
A large disaster cleaning company estimates that 30 percent of the jobs it bids on are
finished within the bid time. Looking at a random sample of 8 jobs that it has
contracted, calculate the probability that exactly 4 of the jobs were not completed
within the bid time.
A. .0081
B. .2401
C. .0113
D. .1361
As we increase the number of independent variables in a multiple regression model, the
F statistic will __________ increase.
A. always
B. sometimes
C. never
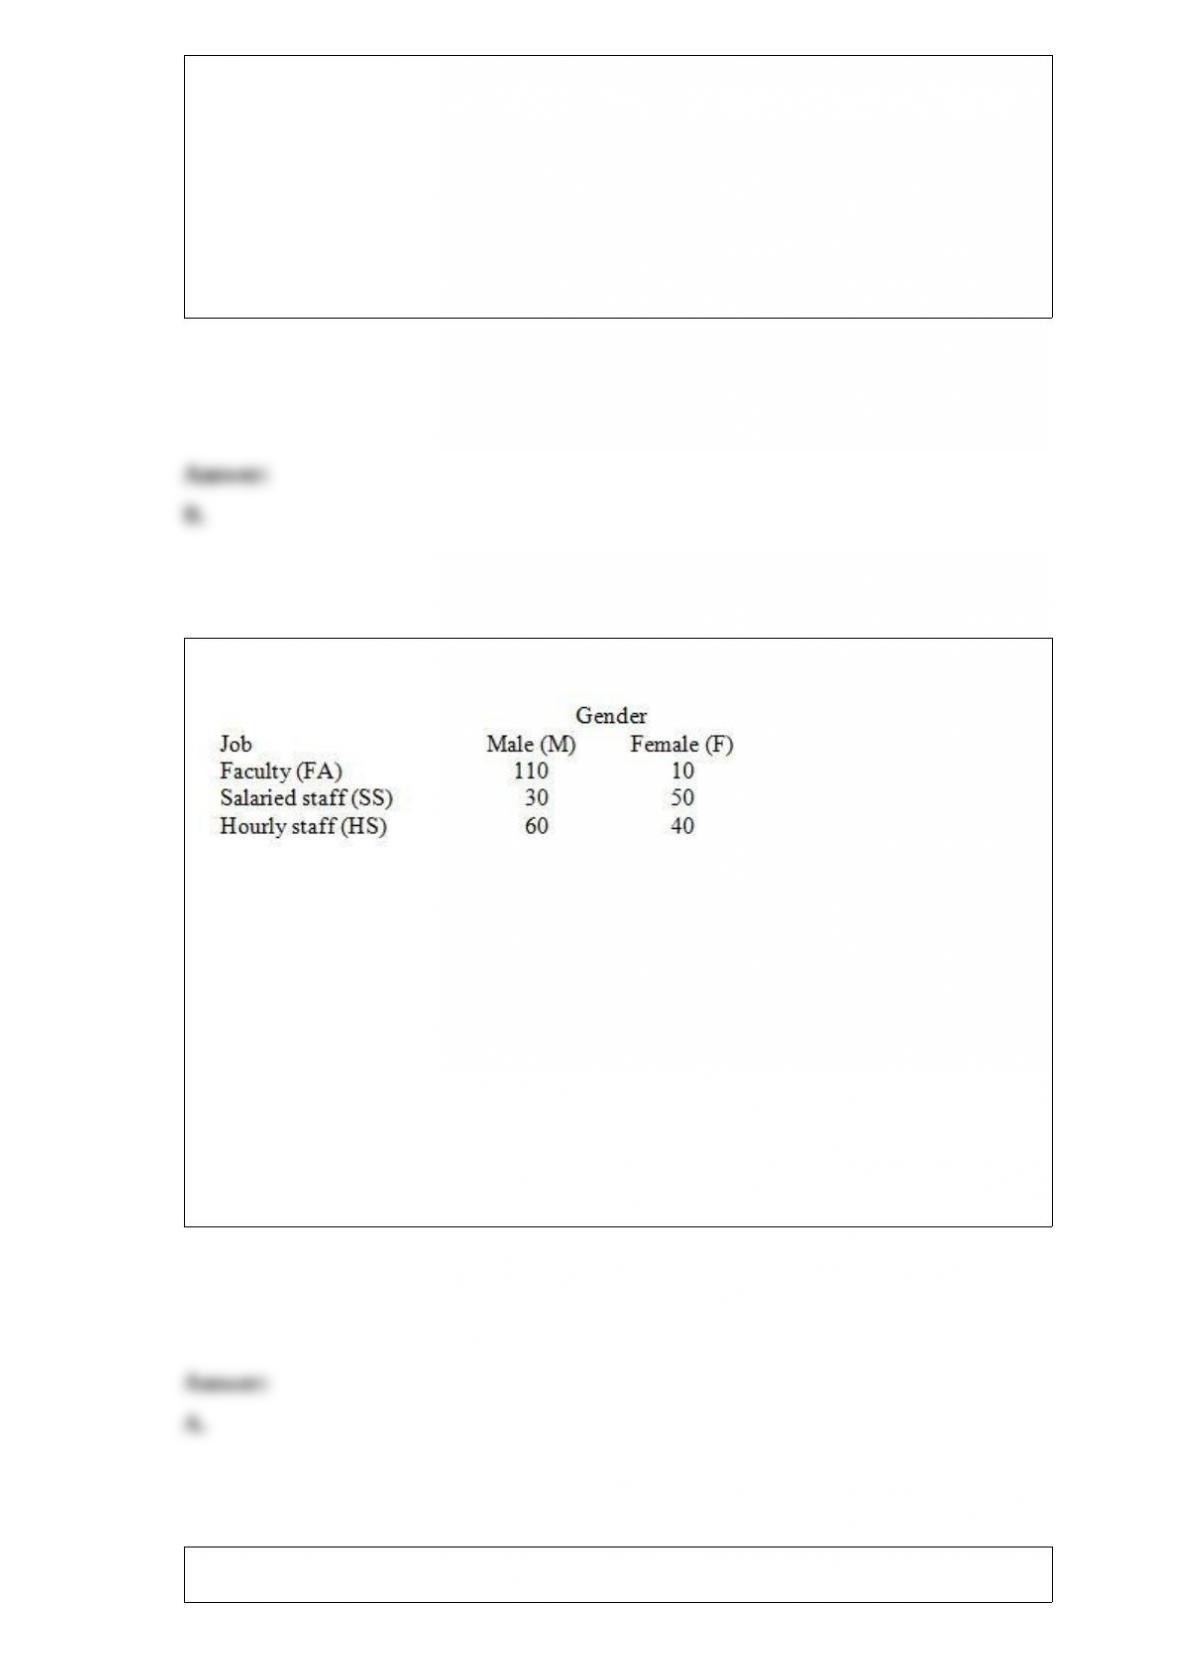
Employees of a local university have been classified according to gender and job type.
If an employee is selected at random, what is the probability that the employee is male?
A. .667
B. .367
C. .333
D. .500
E. .917
The average lateness for one of the top airline companies is 10 minutes. The variance of

the lateness measure is calculated as 9. An airplane arrived 13 minutes after the stated
arrival time. Calculate the z-score for the lateness of this particular airplane.
A. 0.33
B. 0.58
C. 1.33
D. 0.44
E. 1.00
In a hearing test, subjects estimate the loudness (in decibels) of a sound, and the results
are: 68, 67, 70, 71, 68, 75, 68, 62, 80, 73, 68.
What is the mode?
A. 70
B. 75
C. 68
D. 71
E. 80
The test of means for two related populations matches the observations (matched pairs)
in order to reduce the ________________ attributable to the difference between

individual observations and other factors.
A. means
B. test statistic
C. degrees of freedom
D. variation
Probabilities must be assigned to sample space outcomes so that the probability
assigned to each sample space outcome must be between ____________, inclusive.
A. 0 and 100
B. -100 and 100
C. 0 and 1
D. -1 and 1
Two NFL scouts are in the process of recruiting seven college senior football players
(receivers). After a careful review and evaluation, both scouts ranked the seven
receivers in terms of their professional career prospects. If we want to determine
whether the two scouts have similar opinions about the professional football career
prospects of the seven players, state the null hypothesis.
A. H0: ρs ≠ 0

B. H0: ρs ≥ 0
C. H0: ρs ≤ 0
D. H0: ρs = 0
In a one way ANOVA table, the ___________ the value of MSE, the higher the
probability of rejecting the hypothesis that all treatment means are equal.
A. closer to 1
B. closer to 0
C. larger
D. smaller
What is the probability of winning four games in a row, if the probability of winning
each game individually is 1/2?
A. 1/4
B. 1/8
C. 1/2
D. 3/16
E. 1/16

When comparing two independent population means by using samples selected from
two independent, normally distributed populations with equal variances, the correct test
statistic to use is ______.
A. z
B. t
C. F
D. t2
In multiple regression analysis, the mean square regression divided by mean square
error yields the _________.
A. standard error
B. F statistic
C.
D. adjusted or
E. t statistic
The Holt-Winters double exponential smoothing method is used to forecast time series
data with ___________.
A. autocorrelation
B. a linear trend
C. cyclical patterns
D. moving averages
The following is a relative frequency distribution of grades in an introductory statistics
course.
If we wish to depict these data using a pie chart, find how many degrees should be
assigned to the highest grade of A.
A. 61.1
B. 22.0
C. 79.2
D. 90.0
E. 212.40
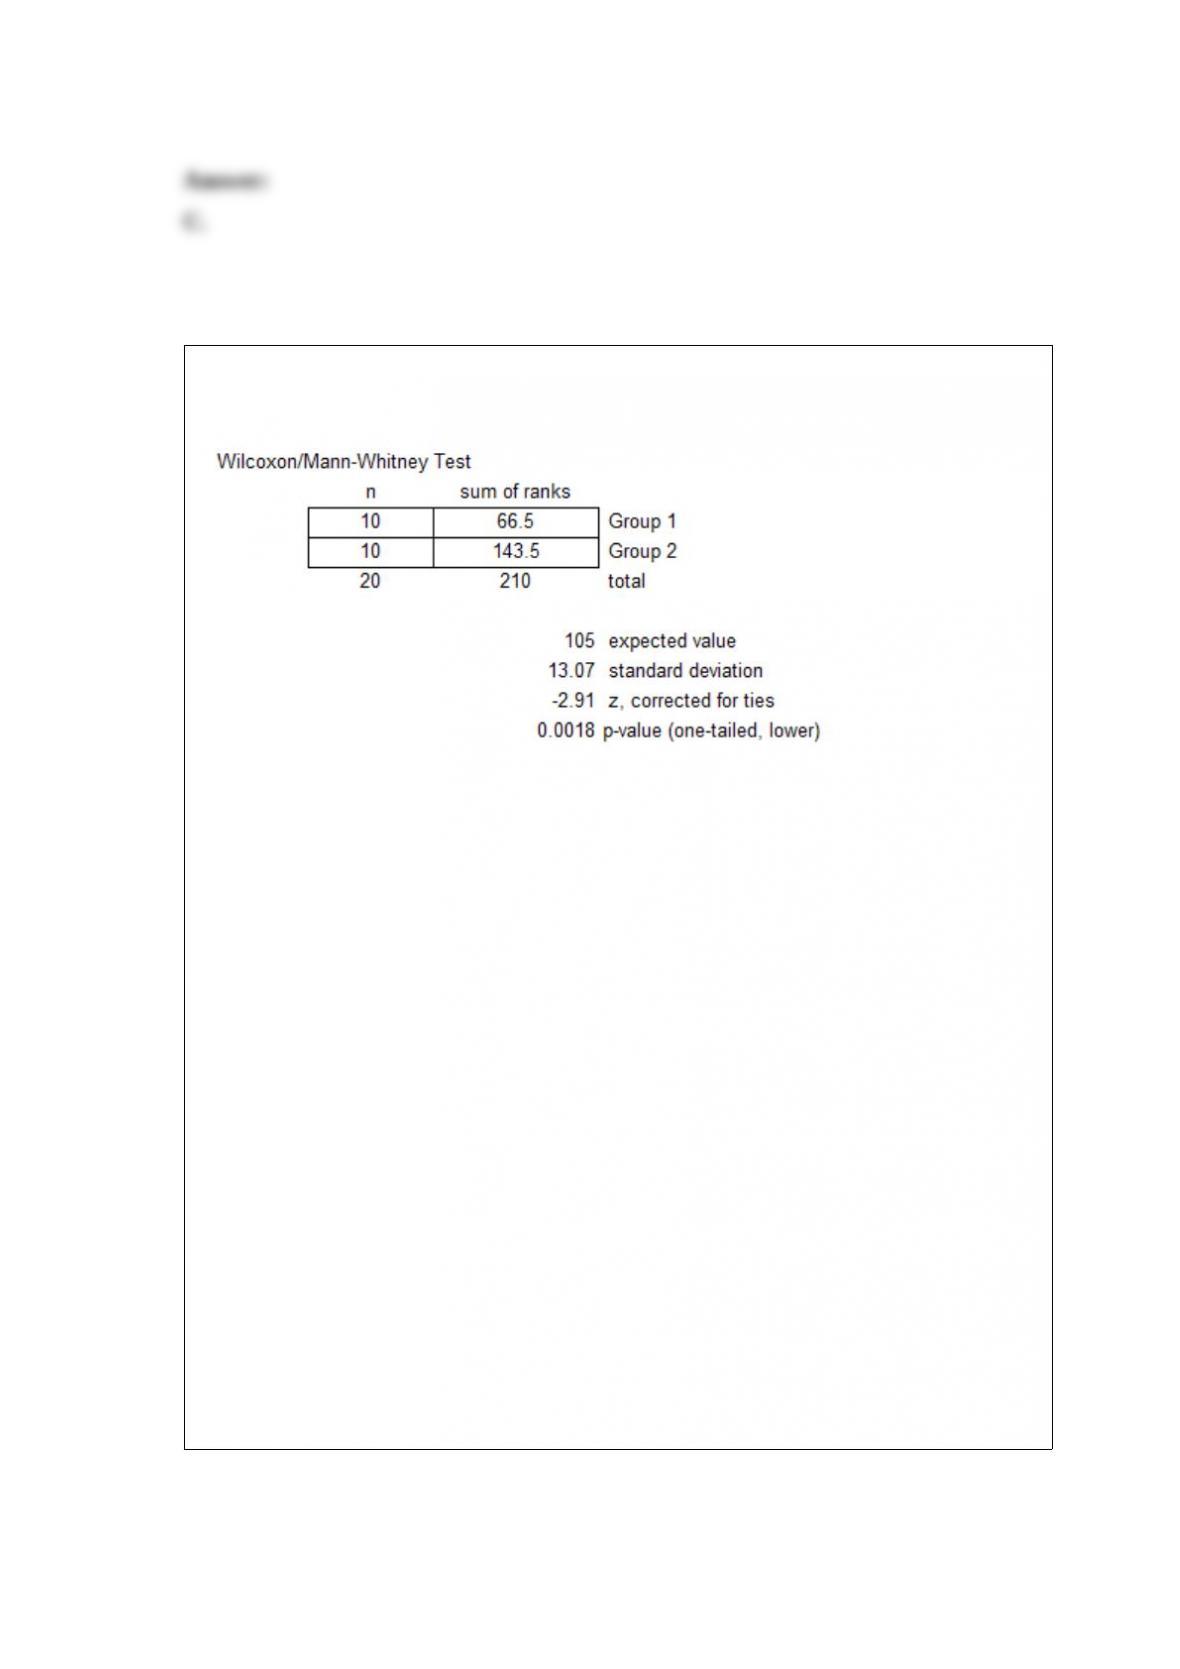
Refer to the MegaStat/Excel output for the Wilcoxon rank sum test given in the table
below.
At a significance level of .05, which one of the following rejection point conditions is
correct regarding the null hypothesis, H0: D1 and D2 are identical probability
distributions, and the alternative hypothesis of Ha: D1 is shifted to the left of D2.
A. We reject H0 and conclude that there is very strong evidence that the median value
of the first sample significantly differs from the median value of the second sample.
B. We reject H0 and conclude that there is very strong evidence that the median value of
the first sample is significantly less than the median value of the second sample.
C. We do not reject H0 and conclude there is not sufficient evidence that the median
value of the first sample is significantly less than the median value of the second
sample.
D. We do not reject H0 and conclude there is not sufficient evidence to conclude that the
median value of the first sample is not significantly different than the median value of
the second sample.
E. We do not reject H0 and conclude there is very strong evidence that the median value
of the first sample is significantly less than the median value of the second sample.

A null hypothesis H0: μ ≥ 2.4 is not rejected at a significance level of 0.04 (α = 0.04).
The standard deviation for the normally distributed population is known to be 0.40.
Determine the probability of a Type II error, if we assume that the actual mean is 2.125
based on a sample size of 16.
Five years ago, the average starting salary of a new college graduate with a major in
marketing was $34,000. A random sample of 10 graduates from this year’s graduating
class of a local university yielded the following starting salaries in thousands of dollars:
28, 36, 25, 37, 35, 24, 38, 45, 39, 36. The local university wants to determine if the
median starting salary for marketing graduates has increased in the last five years.
Assume that the population of starting salaries in marketing is not normally distributed.
The p value is found to be .0547. Using α = .10, can we conclude that the starting
salaries increased in the last five years?
A. Yes
B. No

The binomial random variable x consists of n = 60 trials and has the probability of
failure q = 0.4. Using the normal approximation, compute the probability of 32
successes.
According to a national survey, the average commuting time for people living in a city
with a population of 1 to 3 million is 19.0 minutes. Suppose a researcher lives in a city
with a population of 2.4 million and wants to test this claim for her city. Taking a
random sample of 20 commuters, she calculates a mean time of 19.346 minutes and a
standard deviation of 2.842 minutes. Test the hypotheses at α = .10 using the critical
value rule.

In an early study, researchers at Ivy University found that 33 percent of the freshmen
had received at least one A in their first semester. Administrators are concerned that
grade inflation has caused this percentage to increase. In a more recent study, of a
random sample of 500 freshmen, 185 had at least one A in their first semester. Calculate
the appropriate test statistic to test the hypotheses.
In testing H0: p ≥.33; versus HA: p < .33 using the critical value rule, with = .20 and n
= 100, what is the value of the test statistic?
In 1930, the average size of a public restroom was 172 square feet. By 1990, due to
federal disability laws, the average size had increased to 471 square feet. Suppose that a
design team believes that this standard has increased from the 1990 level. They
randomly sample 23 public restrooms in a major midwestern city and obtain a mean
square footage of 498.78 with a standard deviation of 46.94. Calculate the appropriate
test statistic to test the hypotheses.

Determine the 95 percent confidence interval for the difference between two population
means, where sample 1 has data: 16, 14, 19, 18, 19, 20, 15, 18, 17, 18; and sample 2 has
data: 13, 19, 14, 17, 21, 14, 15, 10, 13, 15. (Assume equal population variances.)
Three companies produce all the potato chips used by vending machines in public areas
in a midwestern state. Company A accounts for 70 percent of the chips, Company B 19
percent, and Company C 11 percent. The probability of the vending company getting an
unfilled bag is 2 percent for Company A, 2 percent for Company B, and 4 percent for
Company C. Suppose an unfilled bag is found. What is the probability that it came from
Company B?

A television program director has 14 shows available for Monday night but can choose
only 5 shows. How many different possible combinations are there?
What is the value of the F statistic for H0: σ12 ≤ σ12, HA: σ12> σ12, where s1 = 3.3 and
s2 = 2.1?
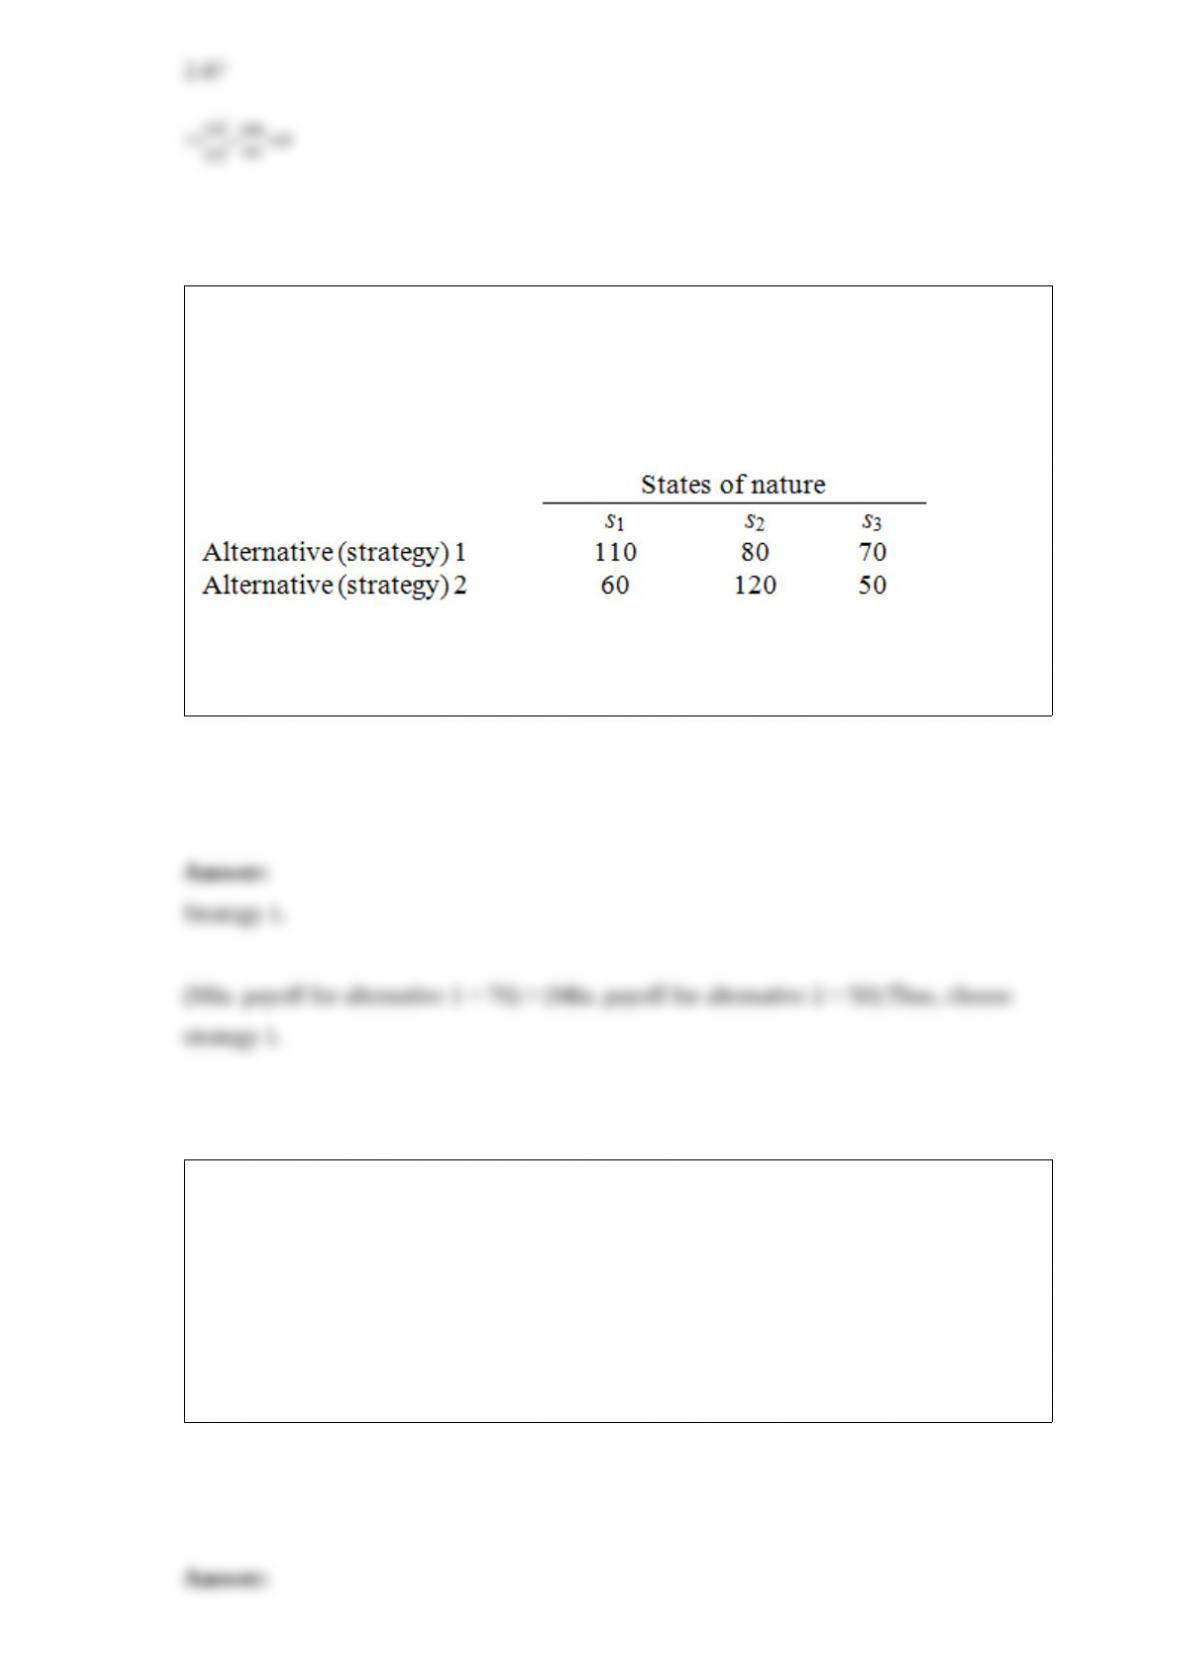
Alternatives 1 and 2 in the following payoff table represent the two possible
manufacturing strategies that the EKA manufacturing company can adopt. The level of
demand affects the success of both strategies. The states of nature (SI) represent the
levels of demand for the company products. S1, S2, and S3 characterize high, medium,
and low demand, respectively. The payoff values are in thousands of dollars.
Determine the best alternative (course of action) for the EKA manufacturing company
using the maximin criterion.
A pharmaceutical company manufacturing flu test kits wants to determine the
probability of a teenager not having the flu when the test results indicate that they do. It
is estimated that the probability of positive test for flu among potential users of the kit
is 10 percent. According to the company laboratory test results, 1 out of 100
noninfected teenagers tested as having the flu (false positive). On the other hand, 1 out
of 200 teenagers with the flu tested as not having the active virus (false negative). A
teenager has just used the flu test kit manufactured by the company and the results
showed she does not have the flu. What is the probability that she has the flu?
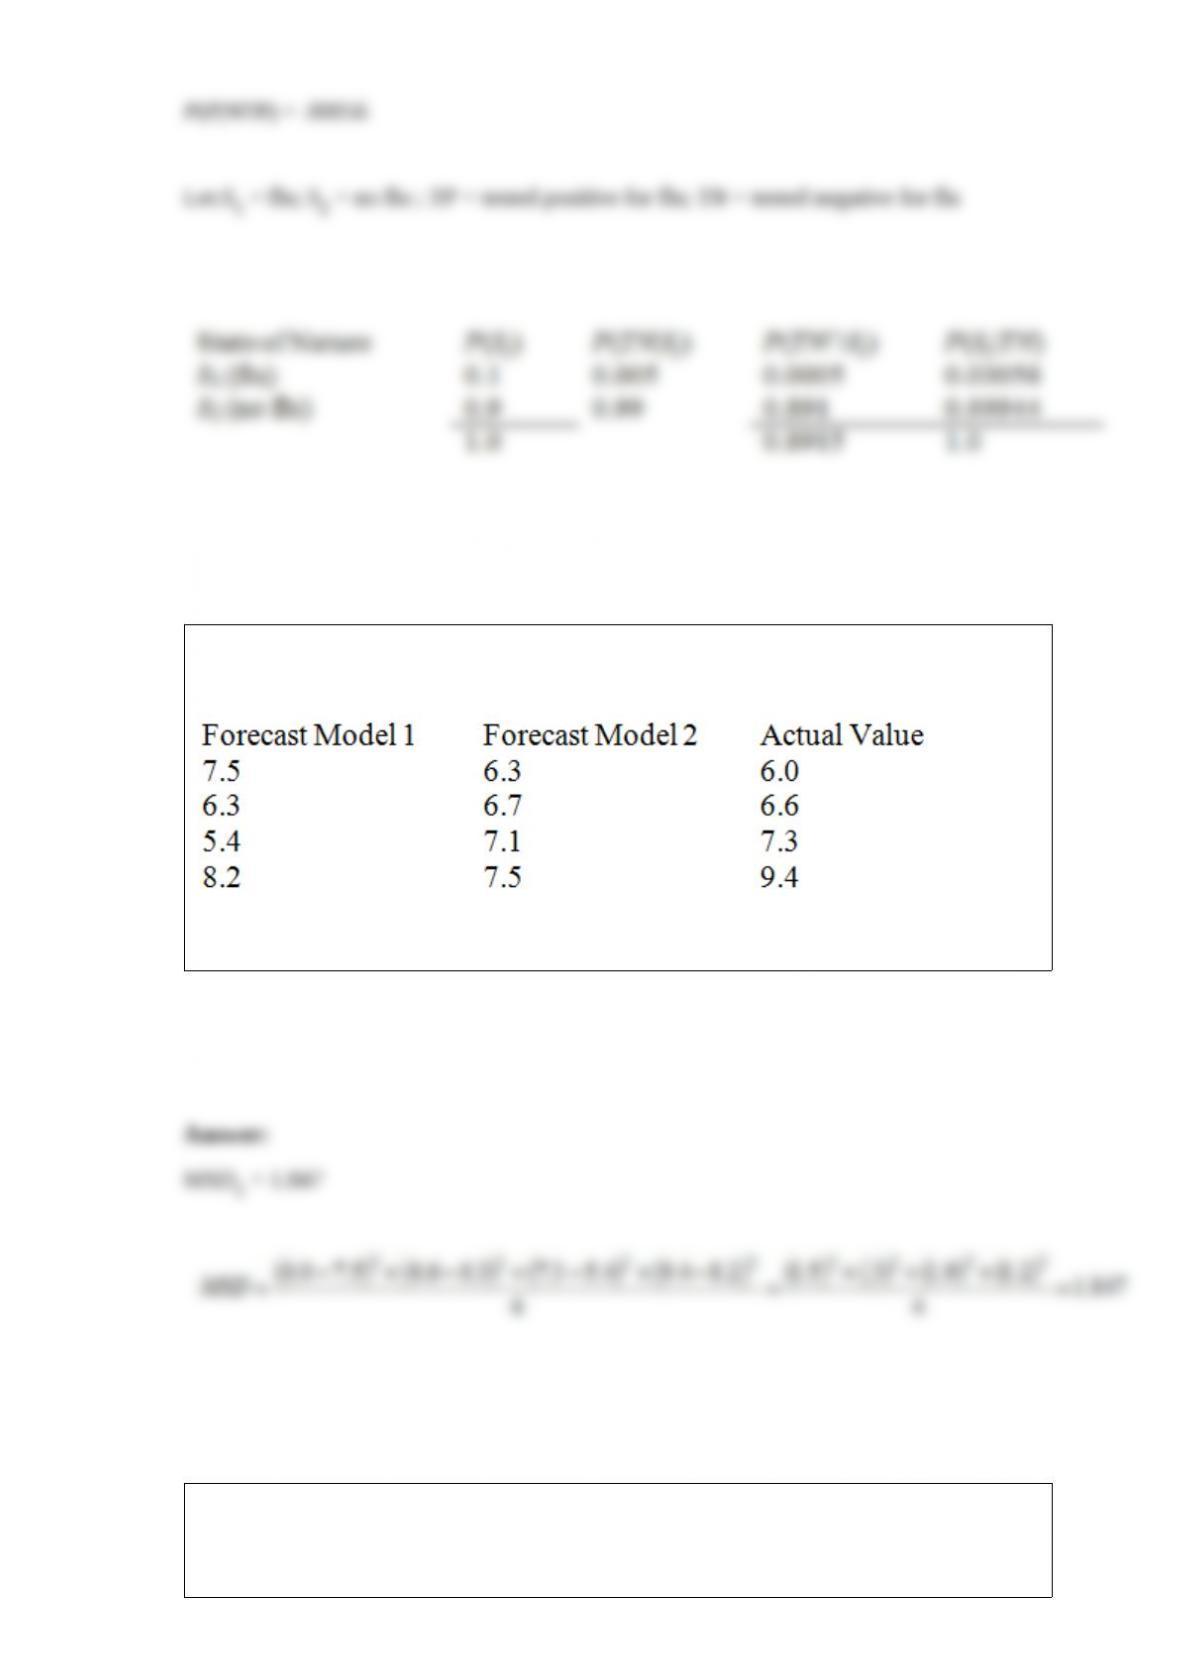
Two forecasting models were used to predict the future values of a time series. The
forecasts are shown below with the actual values.
Calculate the mean squared deviation (MSD) for Model 1.
Consider a two-way analysis of variance experiment with treatment factors A and B.
The results are summarized below.
Source of Variation df SS

Factor A 4 86
Factor B 5 75
Interaction 20 75
Error 90 300
Total 119 536
Compute the mean square and F, and test the null hypothesis that no interaction exists
between factors A and B at α = .05.
A marketing research company surveyed grocery shoppers on the East Coast and West
Coast to find the percentage of the customers who prefer chicken to other meat. The
data are given below.
Determine the 95 percent confidence interval for the difference between the proportion
of customers on the West Coast who prefer chicken and the proportion of customers on
the East Coast who prefer chicken.

Use the least squares regression equation = 12.36 + 4.745X and determine the
predicted value of y when x = 3.25.
What is the value of the computed F statistic for testing equality of population
variances where s12 = .004 and s22 = .002? Consider HA: σ12> σ22.