
A large sample Mann-Whitney U test should be used when the sample sizes exceed 20.
In conducting the Wilcoxon Matched-Pairs Signed Rank test, the difference between
each pair of values must be found prior to conducting any ranking.
A goodness-of-fit test can be used to determine whether a set of sample data comes
from a specific hypothesized population distribution.
The Wilcoxon Matched-Pairs Signed rank test is an alternative to the paired sample
t-test when we are unwilling to assume that the populations are normally distributed.
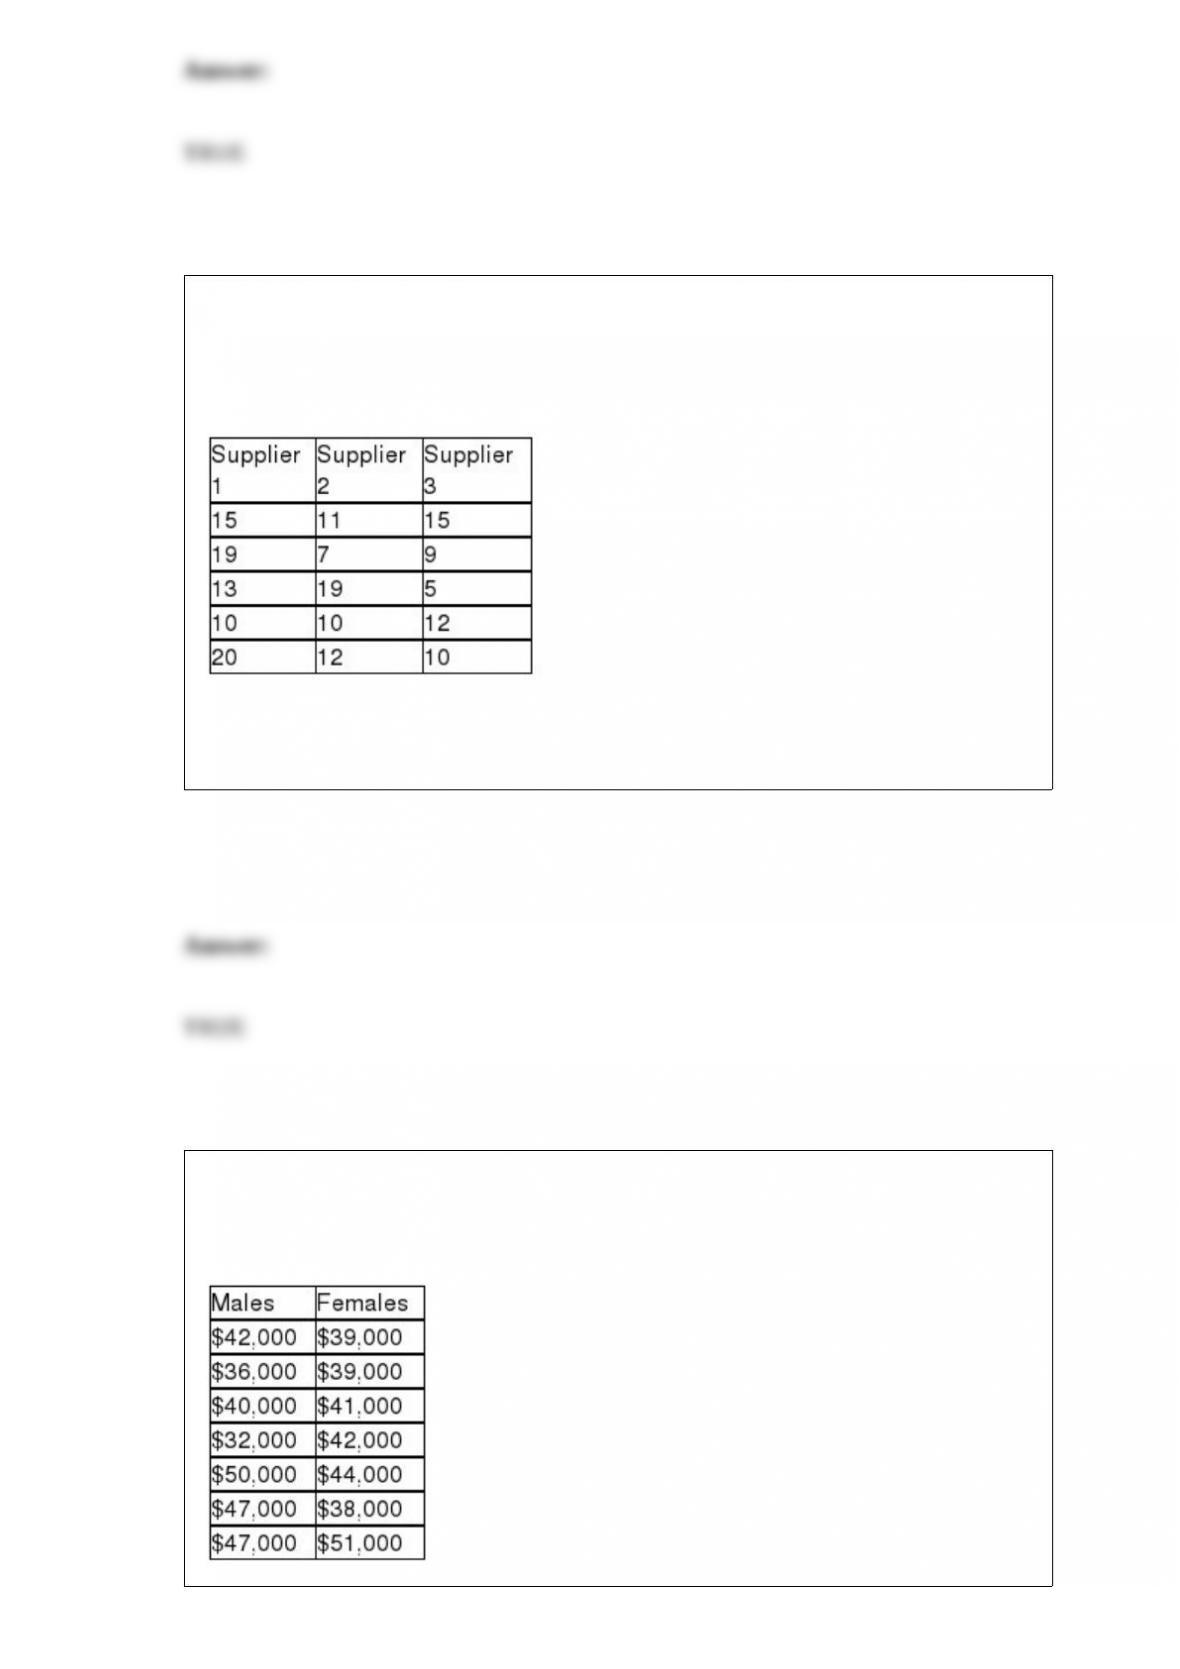
A recent study was conducted to determine if any of three suppliers of electronic
components has a different median delivery time on special orders. To test this, five
orders were given to each supplier and the delivery days were recorded. These data are
shown as follows:
If a Kruskal-Wallis test is to be performed, the number of degrees of freedom for
determining the critical value is 2.
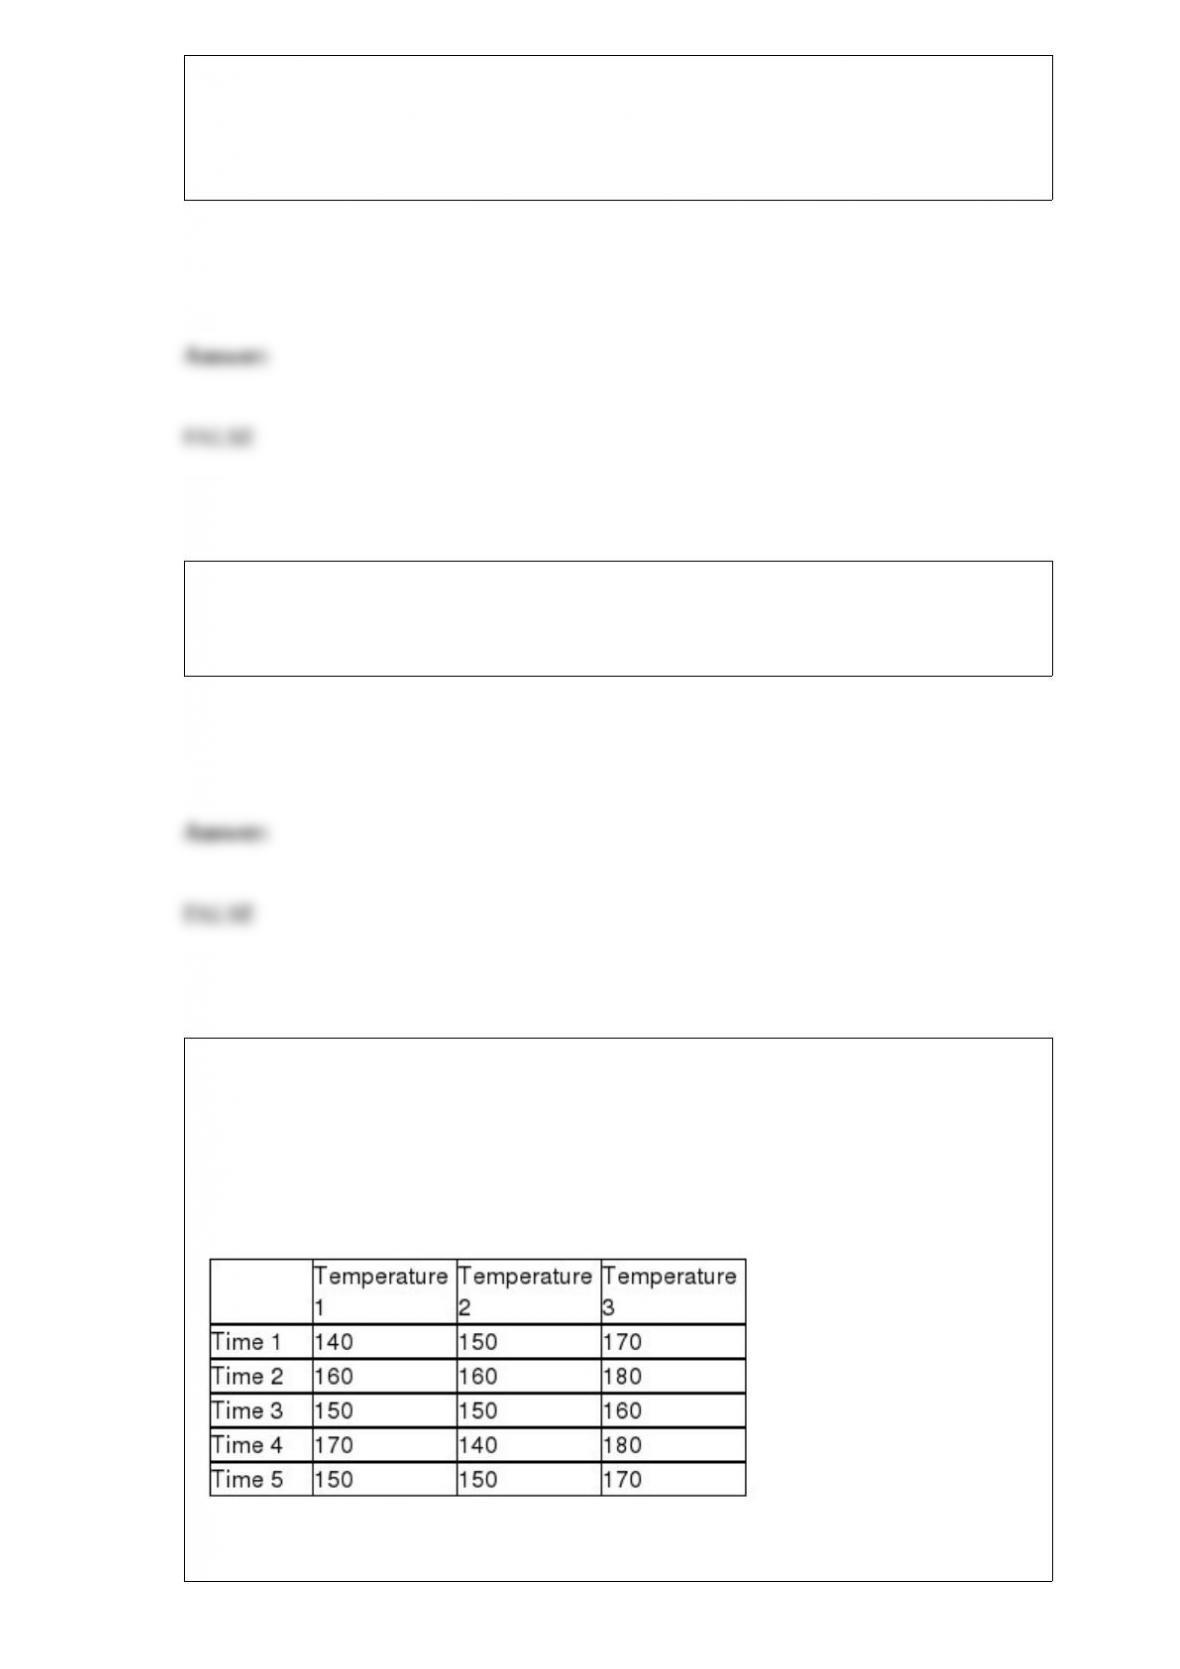
A claim was recently made that stated that the median income for male and female
graduates is the same for those graduating with a degree in operations management. The
following sample data were collected:

In employing the Mann-Whitney U test, the U test statistic for the males is 43.5
A cellular phone service provider believes that there is negative correlation between the
minutes used by its customers and the age of the customer. To test this, the following
would be the appropriate null and alternative hypotheses:
H0 : ρ = 0.0
Ha : ρ ≠ 0.0
In developing a simple linear regression model it is assumed that the distribution of
error terms will be normally distributed for all levels of x.
For testing a research hypothesis, the burden of proof that a new product is no better
than the original is placed on the new product, and the research hypothesis is

formulated as the null hypothesis.
The control limits in the x-bar chart are set so that 95 percent of the values will fall
inside the control limits when there is only common cause variation.
Consider a situation involving two populations where population 1 is known to have a
higher coefficient of variation than population 2. In this situation, we know that
population 1 has a higher standard deviation than population 2.
Recently, a report in a financial journal indicated that the 90 percent confidence interval
estimate for the proportion of investors who own one or more mutual funds is between
0.88 and 0.92. Given this information, the sample size that was used in this study was
approximately 609 investors.

A correlation coefficient computed from a sample of data values selected from a
population is called a statistic and is subject to sampling error.
When someone has been accused of a crime the null hypothesis is:
H0 : innocent.
In this case, a Type I error would be convicting an innocent person.
If the probability of one event occurring is .40 and the probability of a second event
occurring is 0.60, then the probability that both events will occur must be 1.0 since that
is the maximum value a probability can be.

Hypothesis testing and confidence interval estimation are essentially two totally
different statistical procedures and share little in common with each other.
A study was recently conducted by Major League Baseball to determine whether there
is a correlation between attendance at games and the record of home team’s opponent.
In this study, the dependent variable would be the record of the home team’s opponent.
If you wish to construct a graph of a relative frequency distribution, you would most
likely construct an ogive.
The State Transportation Department wishes to estimate the mean speed of vehicles on
a certain stretch of highway. They wish to estimate the mean within 0.75 mph and they
wish to have a confidence level equal to 99 percent. Based on this information only,
they can determine that the required sample size is 320 vehicles.
Suppose a single die (a 6-sided cube with sides numbered 1 through 6) is rolled once.
The event of interest is defined as rolling an even number. This can be said to be an
elementary event.
A company has established an experiment with its production process in which three
temperature settings are used and five elapsed times are used for each setting. The
company then produces one product under each and measures the resulting strength of
the product. The managers are mainly interested in determining whether the mean
strength is the same at all temperature settings, but they know that controlling for
process time is important. The following data were observed from the experiment:
Based on these data and experimental design, the primary null hypothesis to be tested is
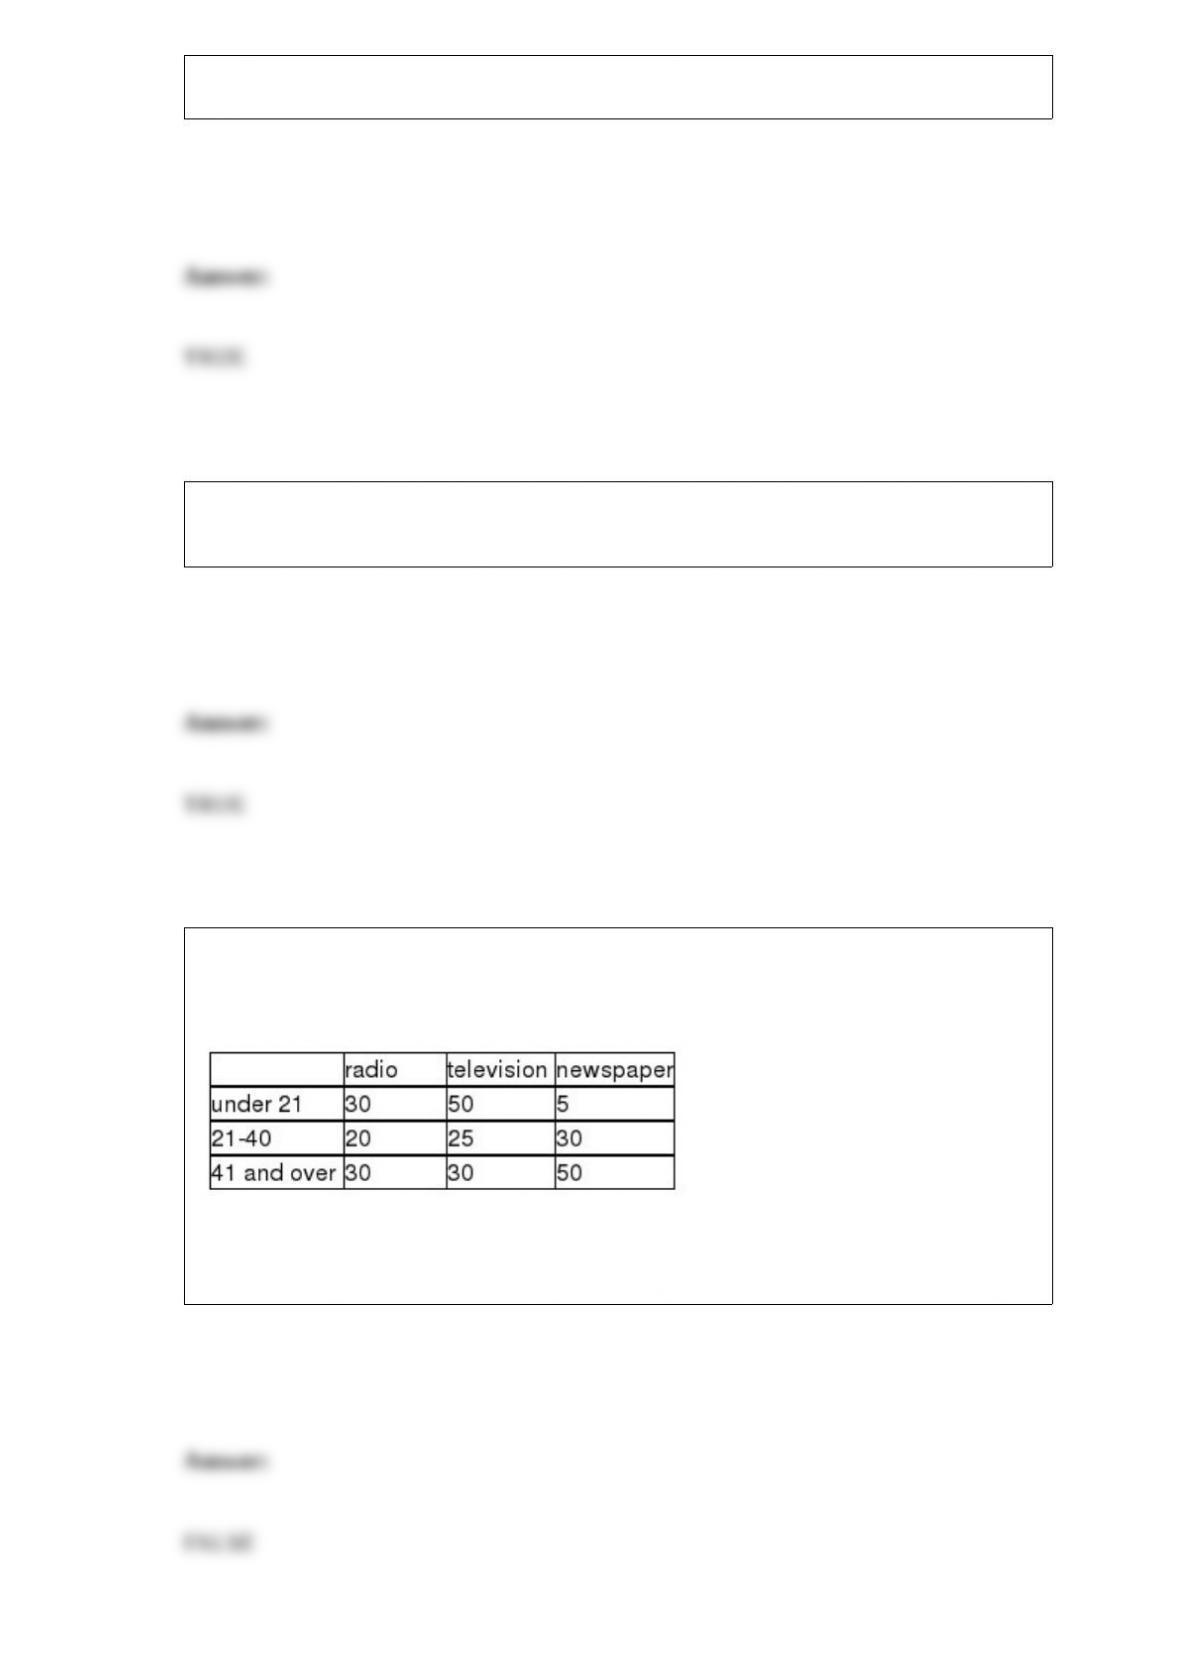
H0 : μ1 = μ2 = μ3.
The Mann-Whitney U test can be used to test whether two independent populations
have the same median so long as the data are measured on at least an ordinal scale.
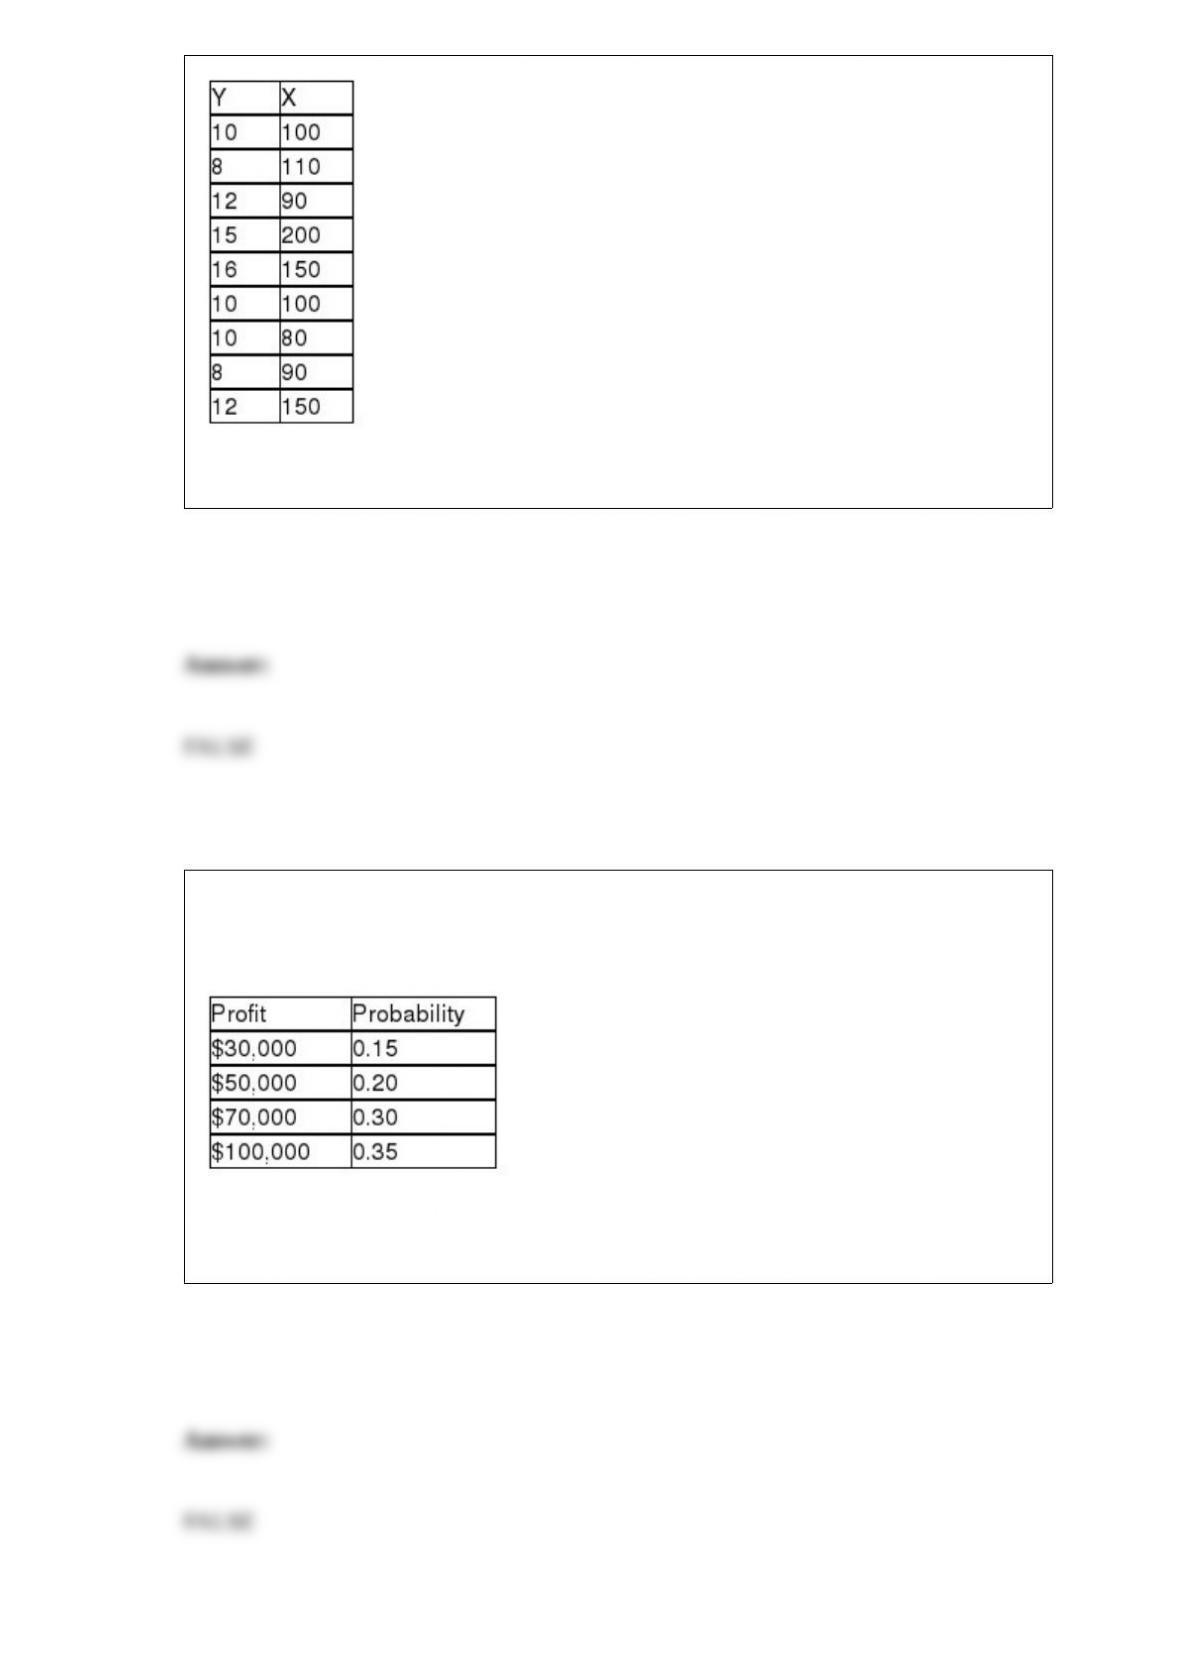
A study was recently conducted in which people were asked to indicate which new
medium was their preferred choice for national news. The following data were
observed:
Given this data, if we wish to test whether the preferred news source is independent of
age, the expected frequency in the cell, radiounder 21 cell is 30.

Standard stepwise regression combines attributes of both forward selection and
backward elimination.
A direct marketing company believes that the probability of making a sale when a call
is made to an individual’s home is .02. The probability of making 2 or 3 sales in a
sample of 20 calls is .0593.
In estimating a population proportion, the factors that are needed to determine the
required sample size are the confidence level, the margin of error and some idea of what
the population proportion is.
You are given the following sample data for two variables:
The sample correlation coefficient for these data is approximately r = 0.755.
The Cromwell Construction Company has the opportunity to enter into a contract to
build a mountain road. The following table shows the probability distribution for the
profit that could occur if it takes the contract:
Based on this information, the expected profit for the company if it takes the contract is
$60,000.

A grocery store manager is interested in estimating the mean weight of apples received
in a shipment. If she wishes to have the estimate be within .05 pound with 90 percent
confidence, the sample size should be 103 apples if she believes that the standard
deviation is .08 pound.
A scatter diagram is a line graph without the points connected by a line.
The F test statistic for testing whether the variances of two populations are the same is
always positive.
You are given the following linear trend model: Ft = 345.60 – 200.5(t). This model
implies that in year 1, the dependent variable had a value of 145.1.

When a population is not normally distributed, the Central Limit Theorem states that a
sufficiently large sample will result in the sample mean being normally distributed.
A city newspaper has stated that the average time required to sell a used car advertised
in the paper is less than 5 days. Assuming that the population standard deviation is 2.1
days, if the “true” population mean is 4.1 days and a sample size of n = 49 is used with
an alpha equal to 0.05, the probability that the hypothesis test will lead to a Type II
error is approximately .0869.
Roscoe and Associates makes computer software for use in the telecommunications
industry. Recently, managers at the company collected data for the year 2001 on three
variables: total dollars spent on research and development, total sales dollars, and total
employee salaries. To graphically present these three variables, the managers would be
justified in using a line chart with all three variables plotted.

The manager of a computer help desk operation has collected enough data to conclude
that the distribution of time per call is normally distributed with a mean equal to 8.21
minutes and a standard deviation of 2.14 minutes. Based on this, what is the probability
that a call will last longer than 13 minutes?
A) About 0.0125
B) Approximately 0.4875
C) About 0.5125
D) About 0.9875
The transportation manager for the State of New Jersey has determined that the time
between arrivals at a toll booth on the state’s turnpike is exponentially distributed with λ
= 4 cars per minute. Based on this, the average time between arrivals is:
A) 15 seconds.
B) 12 seconds.
C) 25 seconds.
D) 4 minutes.

A large Midwestern university is interested in estimating the mean time that students
spend at the student recreation center per week. A previous study indicated that the
standard deviation in time is about 40 minutes per week. If the officials wish to estimate
the mean time within 10 minutes with a 90 percent confidence, what should the sample
size be?
A) 44
B) 62
C) 302
D) Can’t be determined without knowing how many students there are at the university.
Which one of the following is NOT statistical sampling?
A) Simple random sample
B) Stratified random sampling
C) Cluster sampling
D) Convenience sampling

In performing chi-square contingency analysis, to overcome a small expected cell
frequency problem, we:
A) combine the categories of the row and/or column variables.
B) increase the sample size.
C) Both A and B
D) None of the above
For the following hypothesis test:
With n = 80, σ = 9, and = 47.1, state the conclusion.
A) Because the computed value of z = 3.012 is greater than 2.05, accept the null
hypothesis and conclude the mean is greater than 45. Also because the p-value is less
than 0.02
B) Because the computed value of z = 3.012 is greater than 2.05, reject the null
hypothesis and conclude the mean is greater than 45. Also because the p-value is less
than 0.02
C) Because the computed value of z = 2.087 is greater than 2.05, accept the null
hypothesis and conclude the mean is greater than 45. Also because the p-value is less
than 0.02
D) Because the computed value of z = 2.087 is greater than 2.05, reject the null
hypothesis and conclude the mean is greater than 45. Also because the p-value is less
than 0.02

Which of the following is not a step involved in the Wilcoxon signed rank test?
A) Find the deviations from the hypothesized median
B) Rank the deviations
C) Convert the deviations to absolute values
D) Find the deviations from the sample median
A package delivery service claims that no more than 5 percent of all packages arrive at
the address late. Assuming that the conditions for the binomial hold, if a sample of size
10 packages is randomly selected, and the 5 percent rate holds, what is the probability
that exactly 2 packages in the sample arrive late?
A) 0.0746
B) 0.9884
C) 0.2347
D) 0.0439

Woof Chow Dog Food Company believes that it has a market share of 25 percent. It
surveys n = 100 dog owners and ask whether or not Woof Chow is their regular brand
of dog food, and 23 people say yes. Based upon this information, what is the critical
value if the hypothesis is to be tested at the 0.05 level of significance?
A) 1.28
B) 1.645
C) 1.96
D) 2.575
Past experience indicates that the variance in the time it takes for a “fast lube” operation
to actually complete the lube and oil change for customers is 9.00 minutes. The
manager wishes to estimate the mean time with 99 percent confidence and a margin of
error of 0.50 minutes. Given this, what must the sample size be?
A) n = 239
B) n = 2149
C) n = 139
D) n = 1245
A time series is shown below. Perform single exponential smoothing for this data set

using α = 0.2
What is the value of the forecast for period 6?
A) 40
B) 36
C) 31.5
D) 33.2
For ordinal data, ________ is the preferred measure of central location.
A) the mean
B) the median
C) the percentile
D) the quartile

Under what conditions can the t-distribution be correctly employed to test the difference
between two population means?
A) When the samples from the two populations are small and the population variances
are unknown
B) When the two populations of interest are assumed to be normally distributed
C) When the population variances are assumed to be equal
D) All of the above
Jennings Assembly in Hartford, Connecticut, uses a component supplied by a company
in Brazil. The component is expensive to carry in inventory and consequently is not
always available in stock when requested. Furthermore, shipping schedules are such
that the lead time for transportation of the component is not a constant. Using historical
records, the manufacturing firm has developed the following probability distribution for
the product’s lead time. The distribution is shown here, where the random variable is the
number of days between the placement of the replenishment order and the receipt of the
item.
What is the coefficient of variation for delivery lead time?
A) 38.461%
B) 27.065%
C) 27.891%
D) 31.772%
A company that fills soft drinks into bottles has established an -chart and an R-chart to
monitor the average fill level in the bottles. To do this, the company has taken a series
of samples of size n = 4 bottles. The overall average fill is 12.03 ounces. The average
range for the subgroups has been .06 ounces. Suppose, after developing the control
chart, a subgroup of size 4 yields a sample mean of 12.09 ounces and a range of .08,
which of the following statements is true?
A) The process is in control on both the -chart and the R-chart.
B) The process is out of control on the R-chart but in control on the -chart.
C) The process is out of control on the -chart but in control on the R-chart.
D) The process is out of control on both the -chart and the R-chart.
If you suspect that your trend forecasting model may have autocorrelated forecast
errors, which the following should you compute?
A) The MAD
B) The standard error of the estimate
C) The Durbin-Watson test statistic

D) The correlation coefficient
The range is an ideal measure of variation since it is not sensitive to extreme values in
the data.
Recently a shipping company took 30 samples, each of size n = 100, of packages that it
was responsible for delivering. Out of the 3,000 total packages, 300 were delivered late.
In setting up an appropriate process control chart, what would be the correct 3-sigma
upper control limit value?
A) 0.03
B) 0.13
C) 0.19
D) 0.07
A corporation has 11 manufacturing plants. Of these, 7 are domestic and 4 are located
outside the United States. Each year a performance evaluation is conducted for 4
randomly selected plants.
What is the probability that a performance evaluation will include exactly 1 plant
outside the United States?
A) 0.4242
B) 0.3776
C) 0.3523
D) 0.4696
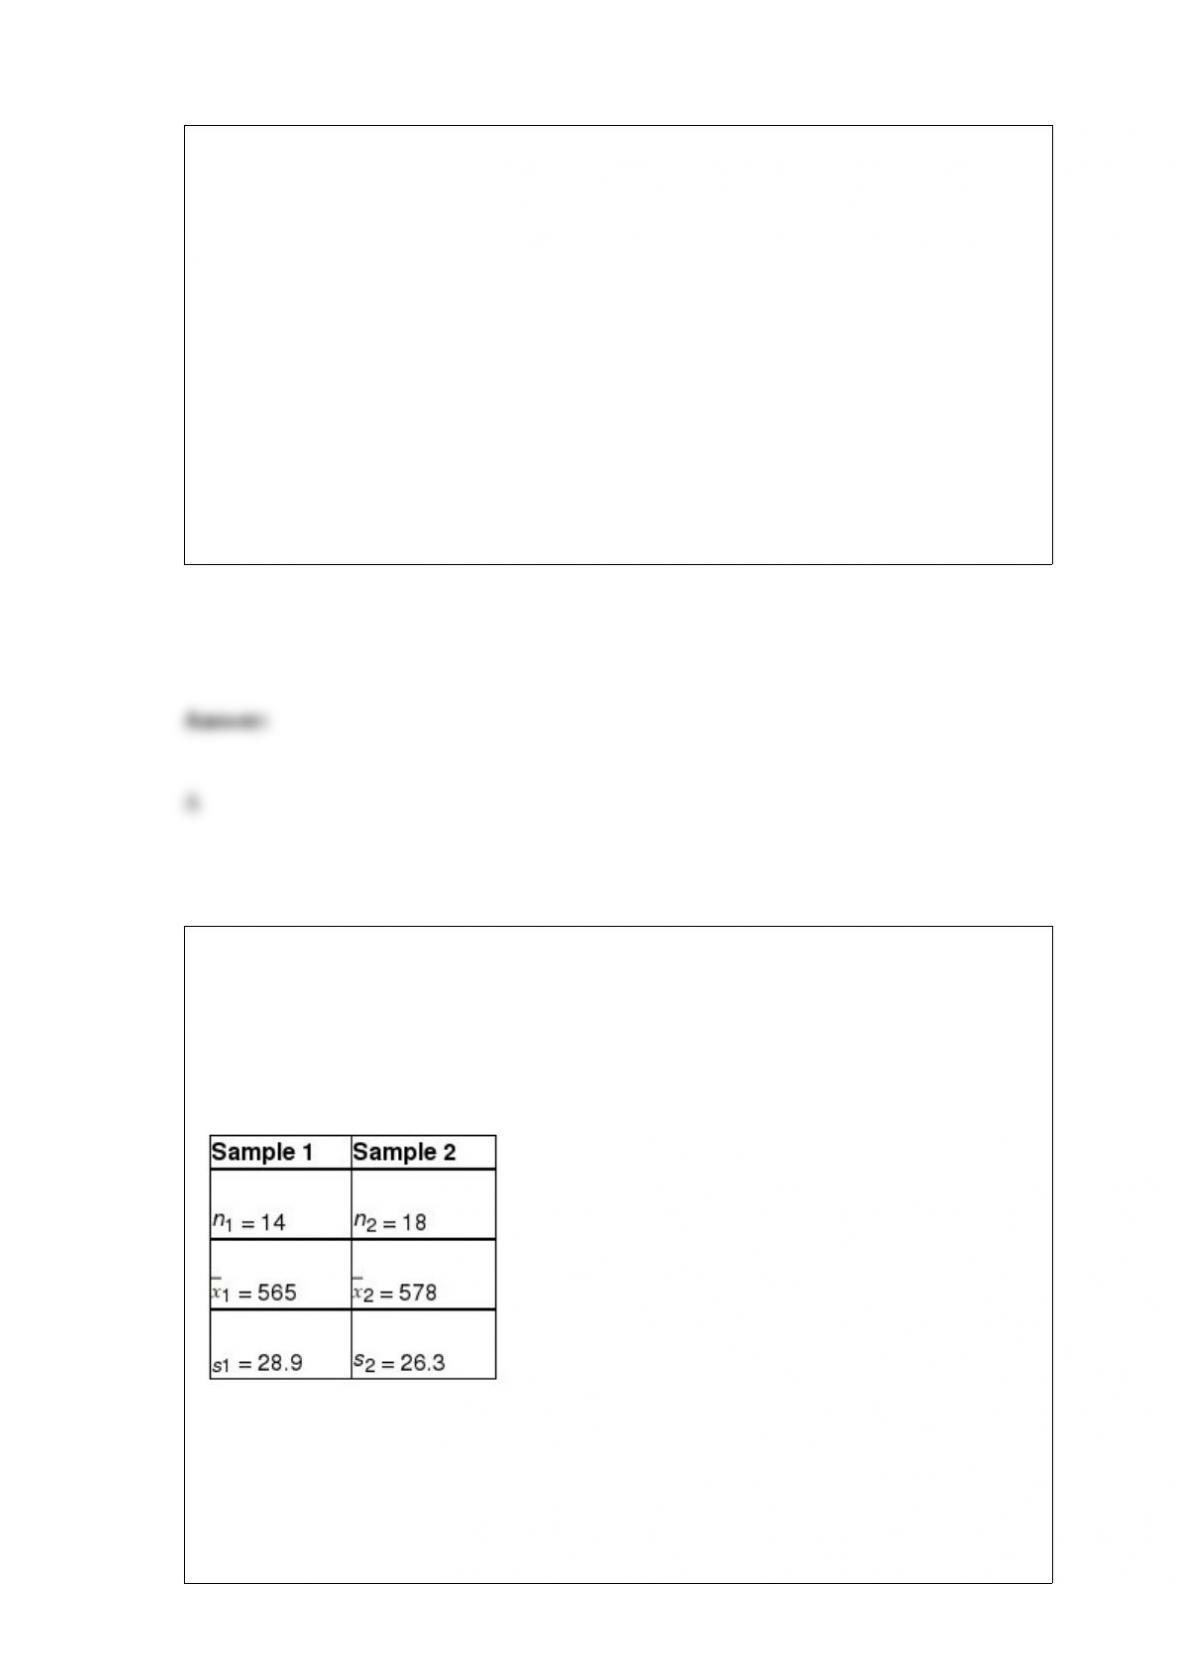
Given the following null and alternative hypotheses
H0 : μ1 ≥ μ2
HA : μ1 < μ2
Together with the following sample information
Assuming that the populations are normally distributed with equal variances, test at the
0.10 level of significance whether you would reject the null hypothesis based on the
sample information. Use the test statistic approach.
A) Because the calculated value of t = -1.415 is less than the critical value of t=-1.3104,
reject the null hypothesis. Based on these sample data, at the α = 0.10 level of
significance there is sufficient evidence to conclude that the mean for population 1 is
less than the mean for population 2.
B) Because the calculated value of t = -1.329 is less than the critical value of t=-1.3104,
reject the null hypothesis. Based on these sample data, at the α = 0.10 level of
significance there is sufficient evidence to conclude that the mean for population 1 is
less than the mean for population 2.
C) Because the calculated value of t = -0.429 is not less than the critical value of
t=-1.3104, do not reject the null hypothesis. Based on these sample data, at the α = 0.10
level of significance there is not sufficient evidence to conclude that the mean for
population 1 is less than the mean for population 2.
D) Because the calculated value of t = -0.021 is not less than the critical value of
t=-1.3104, do not reject the null hypothesis. Based on these sample data, at the α = 0.10
level of significance there is not sufficient evidence to conclude that the mean for
population 1 is less than the mean for population 2.
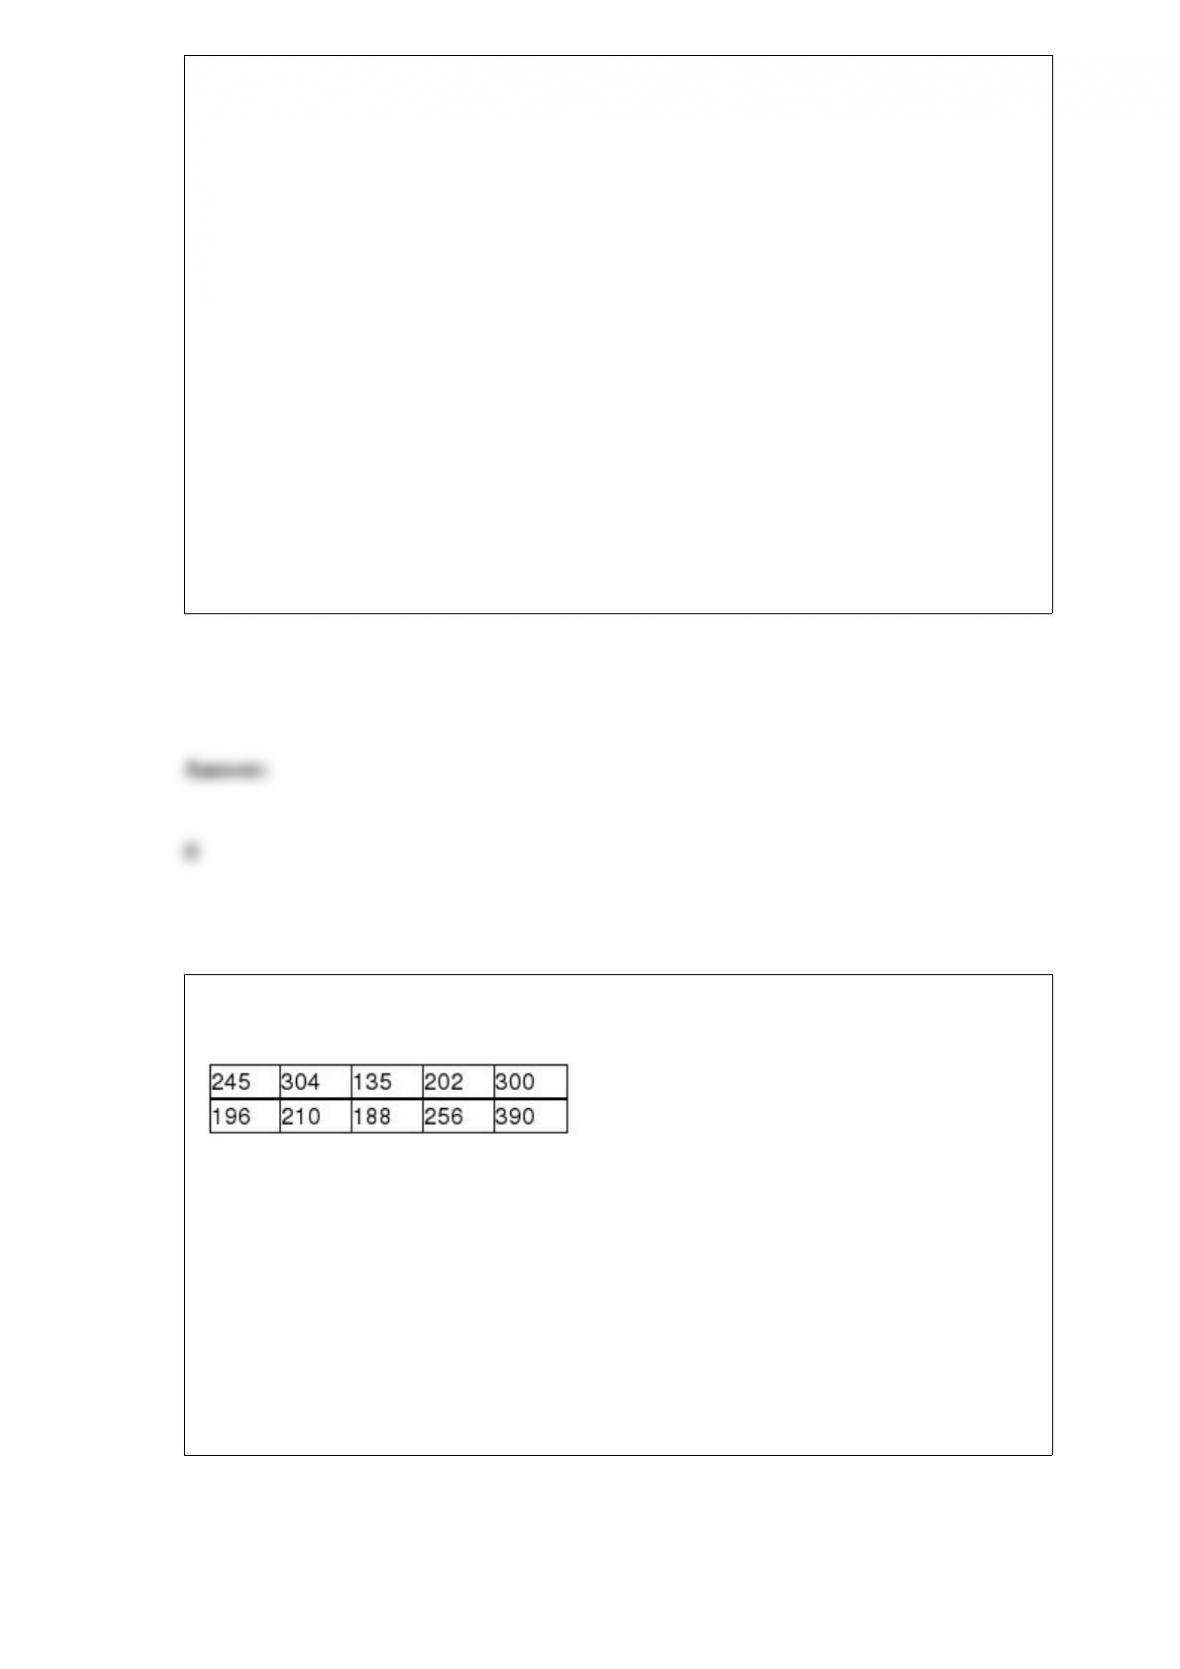
A study was recently conducted to estimate the mean cholesterol for adult males over
the age of 55 years. The following random sample data were observed:
Given this information, what is the point estimate for the population mean?
A) About 73.35
B) 102
C) About 242.6
D) Can’t be determined without knowing the confidence level.

According to the most recent Labor Department data, 10.5% of engineers (electrical,
mechanical, civil, and industrial) were women. Suppose a random sample of 50
engineers is selected. How likely is it that the random sample of 50 engineers will
contain 8 or more women in these positions?
A) 0.1612
B) 0.0821
C) 0.1020
D) 0.0314
When an administrator at a local hospital prepares a series of charts and graphs
pertaining to the patients that have stayed at the hospital during the past month, she is
using which general category of statistical analysis?
A) Quantitative statistics
B) Inferential statistics
C) Descriptive statistics
D) Random sampling

Another term used for statistical sampling is:
A) probability sampling.
B) convenience sampling.
C) ratio sampling.
D) numerical sampling.
If we are testing for the difference between the means of two independent populations
with samples of n1 = 20 and n2 = 20, the number of degrees of freedom is equal to:
A) 39
B) 38
C) 19
D) 18
A sample of 250 people resulted in a confidence interval estimate for the proportion of

people who believe that the federal government’s proposed tax increase is justified is
between 0.14 and 0.20. Based on this information, what was the confidence level used
in this estimation?
A) Approximately 1.59
B) 95 percent
C) Approximately 79 percent
D) Can’t be determined without knowing σ.
A p-chart is useful for:
A) analyzing whether a process for a measurable variable is in or out of control.
B) analyzing processes which yield attribute data.
C) determining what the most likely cause of defects is.
D) All of the above
The following regression output is the result of a multiple regression application in
which we are interested in explaining the variation in retail price of personal computers
based on three independent variables, CPU speed, RAM, hard drive capacity,
and-monitor included (1=Yes, 0=No).
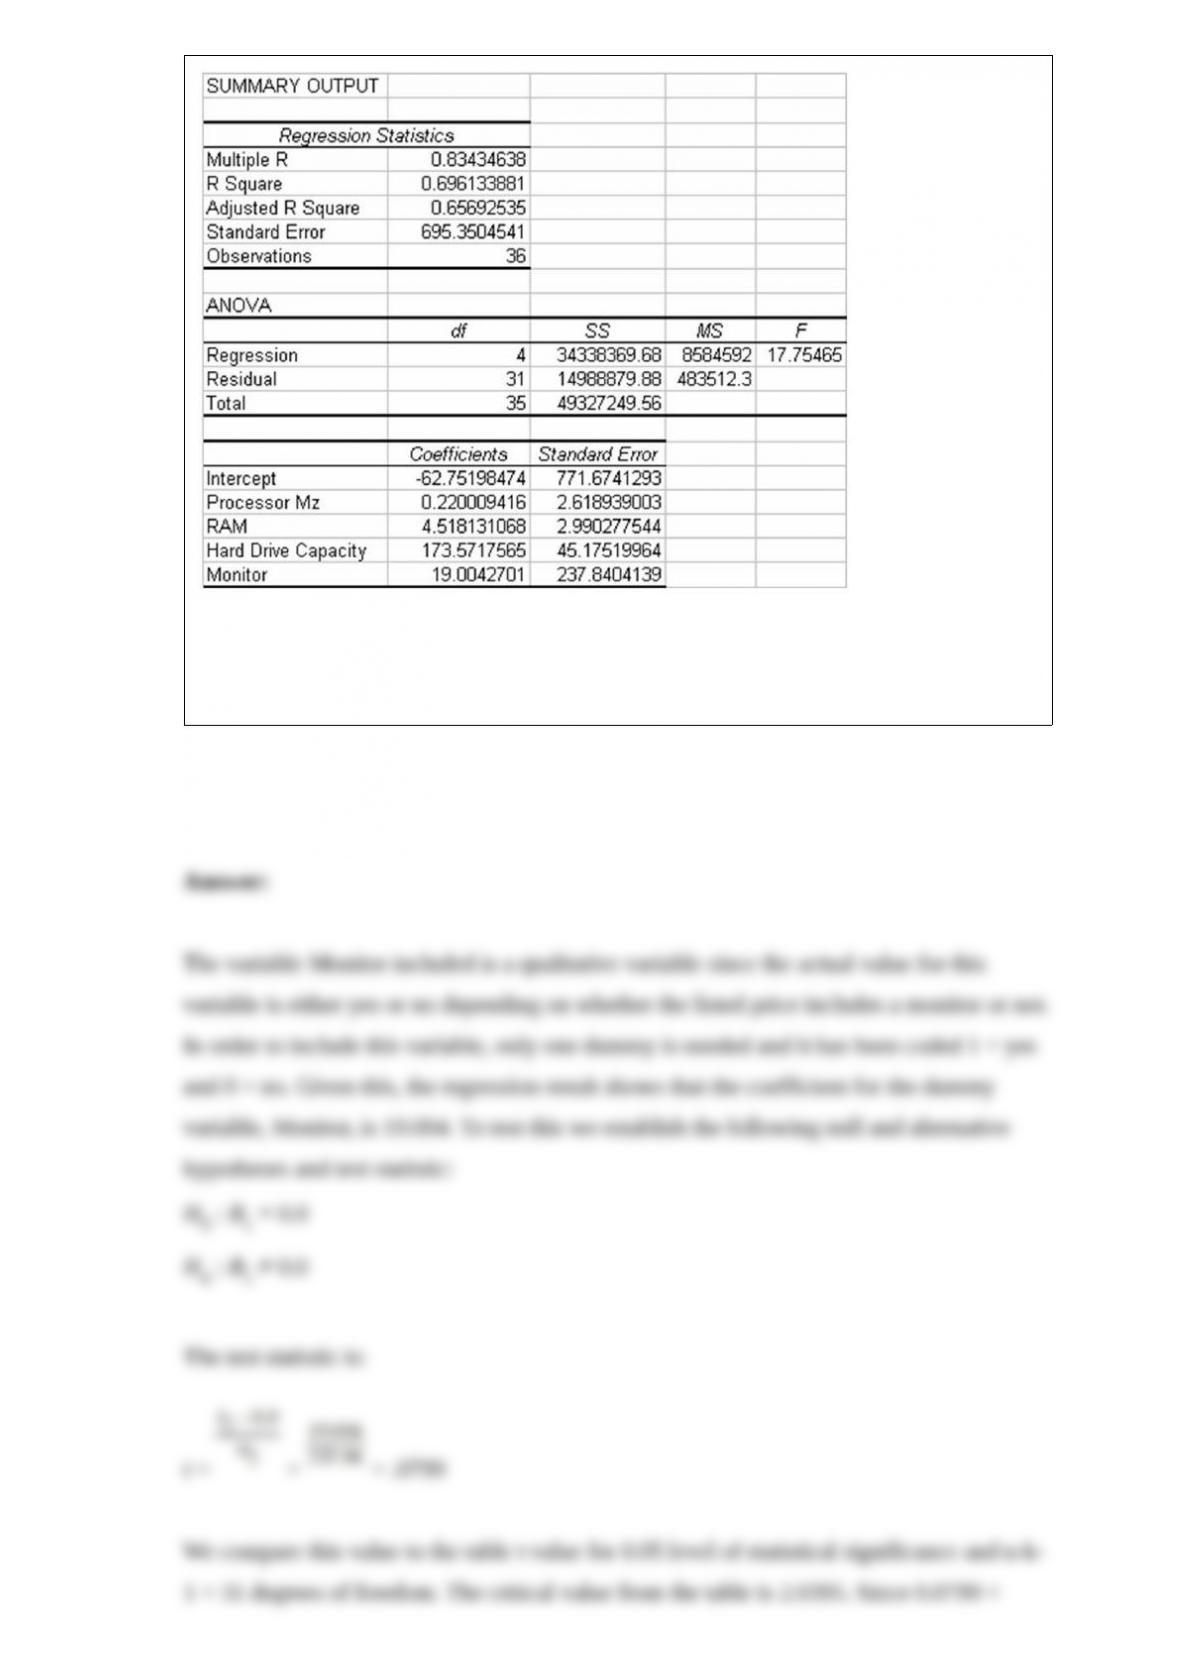
Given this output, what is the variable, Monitor, called? Also, given the other variables
in the model, is Monitor significant in explaining the variation in the dependent
variable? Test using a .05 level of alpha.
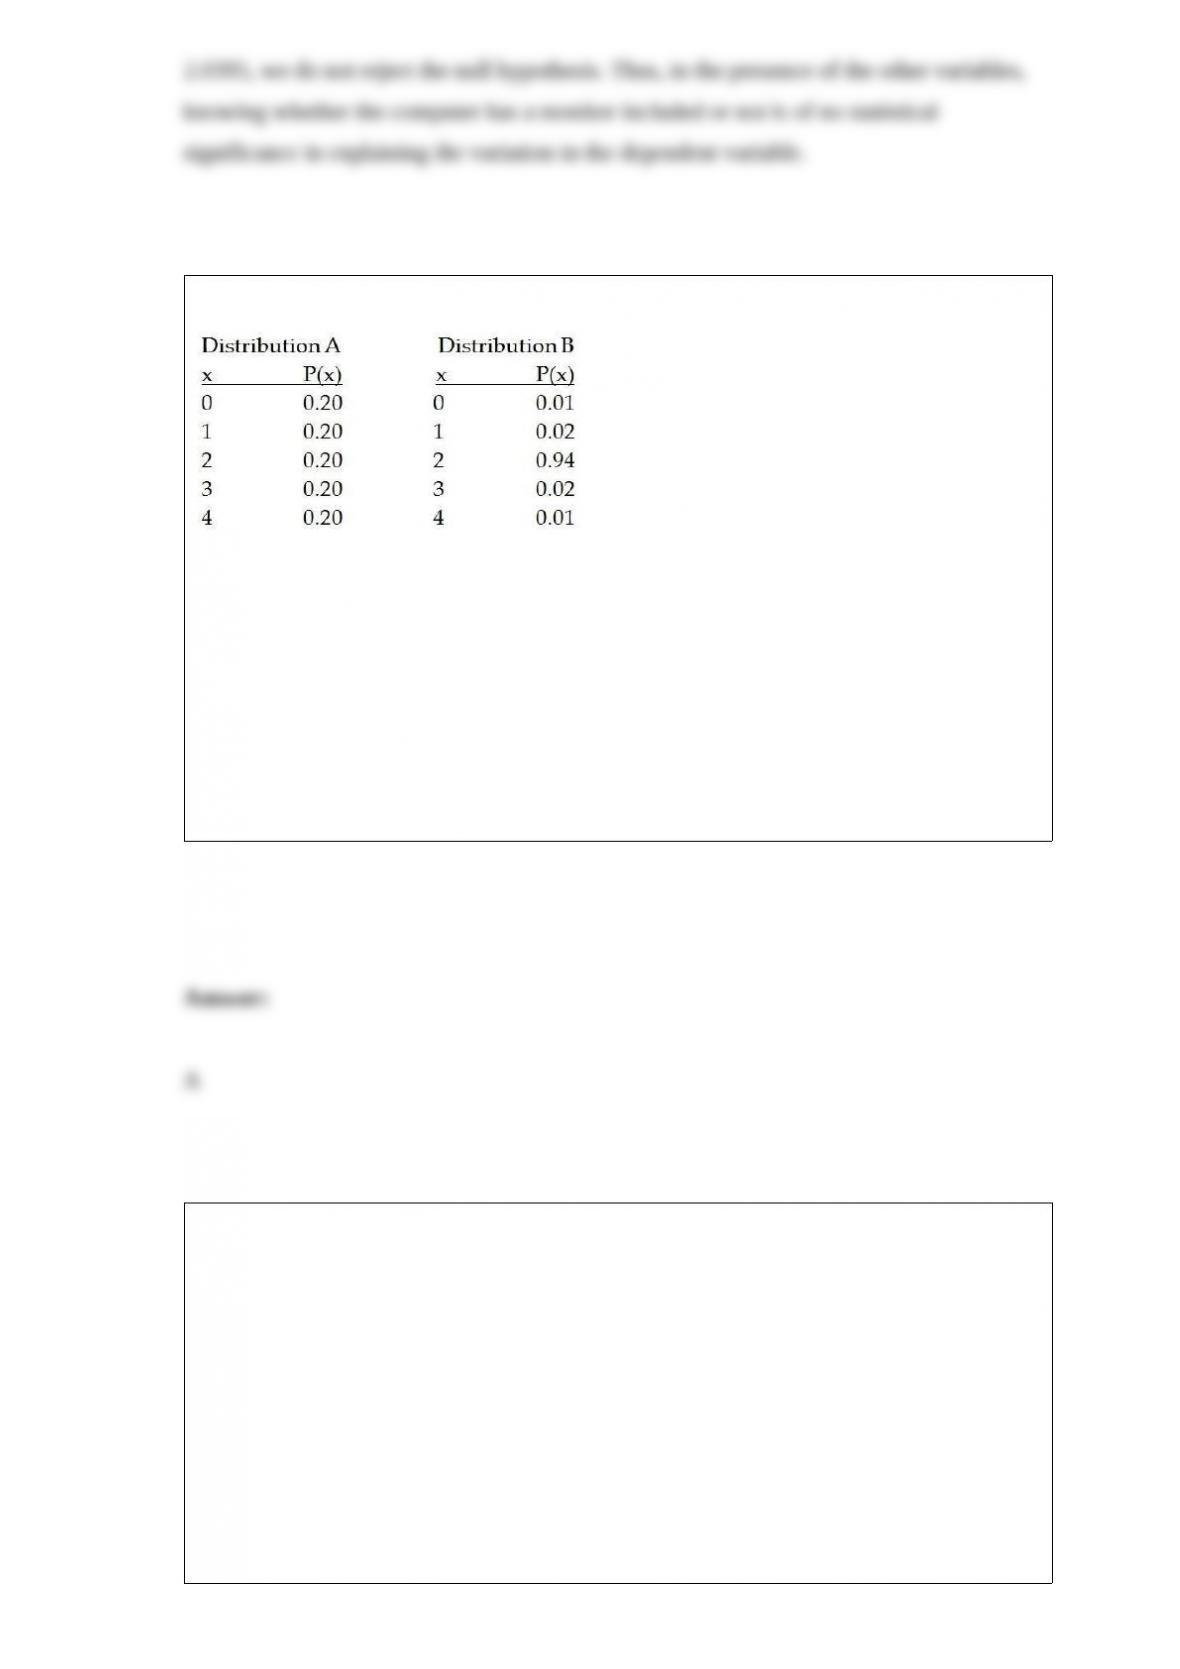
Consider the following two probability distributions:
Which of the following is an accurate statement regarding these two distributions?
A) Distribution A has a higher variance.
B) Distribution B has a higher variance.
C) Both distributions are positively skewed.
D) Both distributions are uniform.
The manager of a movie theater has determined that the distribution of customers
arriving at the concession stand is Poisson distributed with a standard deviation equal to
2 people per 10 minutes. What is the probability that 0 customers arrive during a
10-minute period?
A) 0.1353
B) 0.0183
C) 0.9817
D) Essentially 0
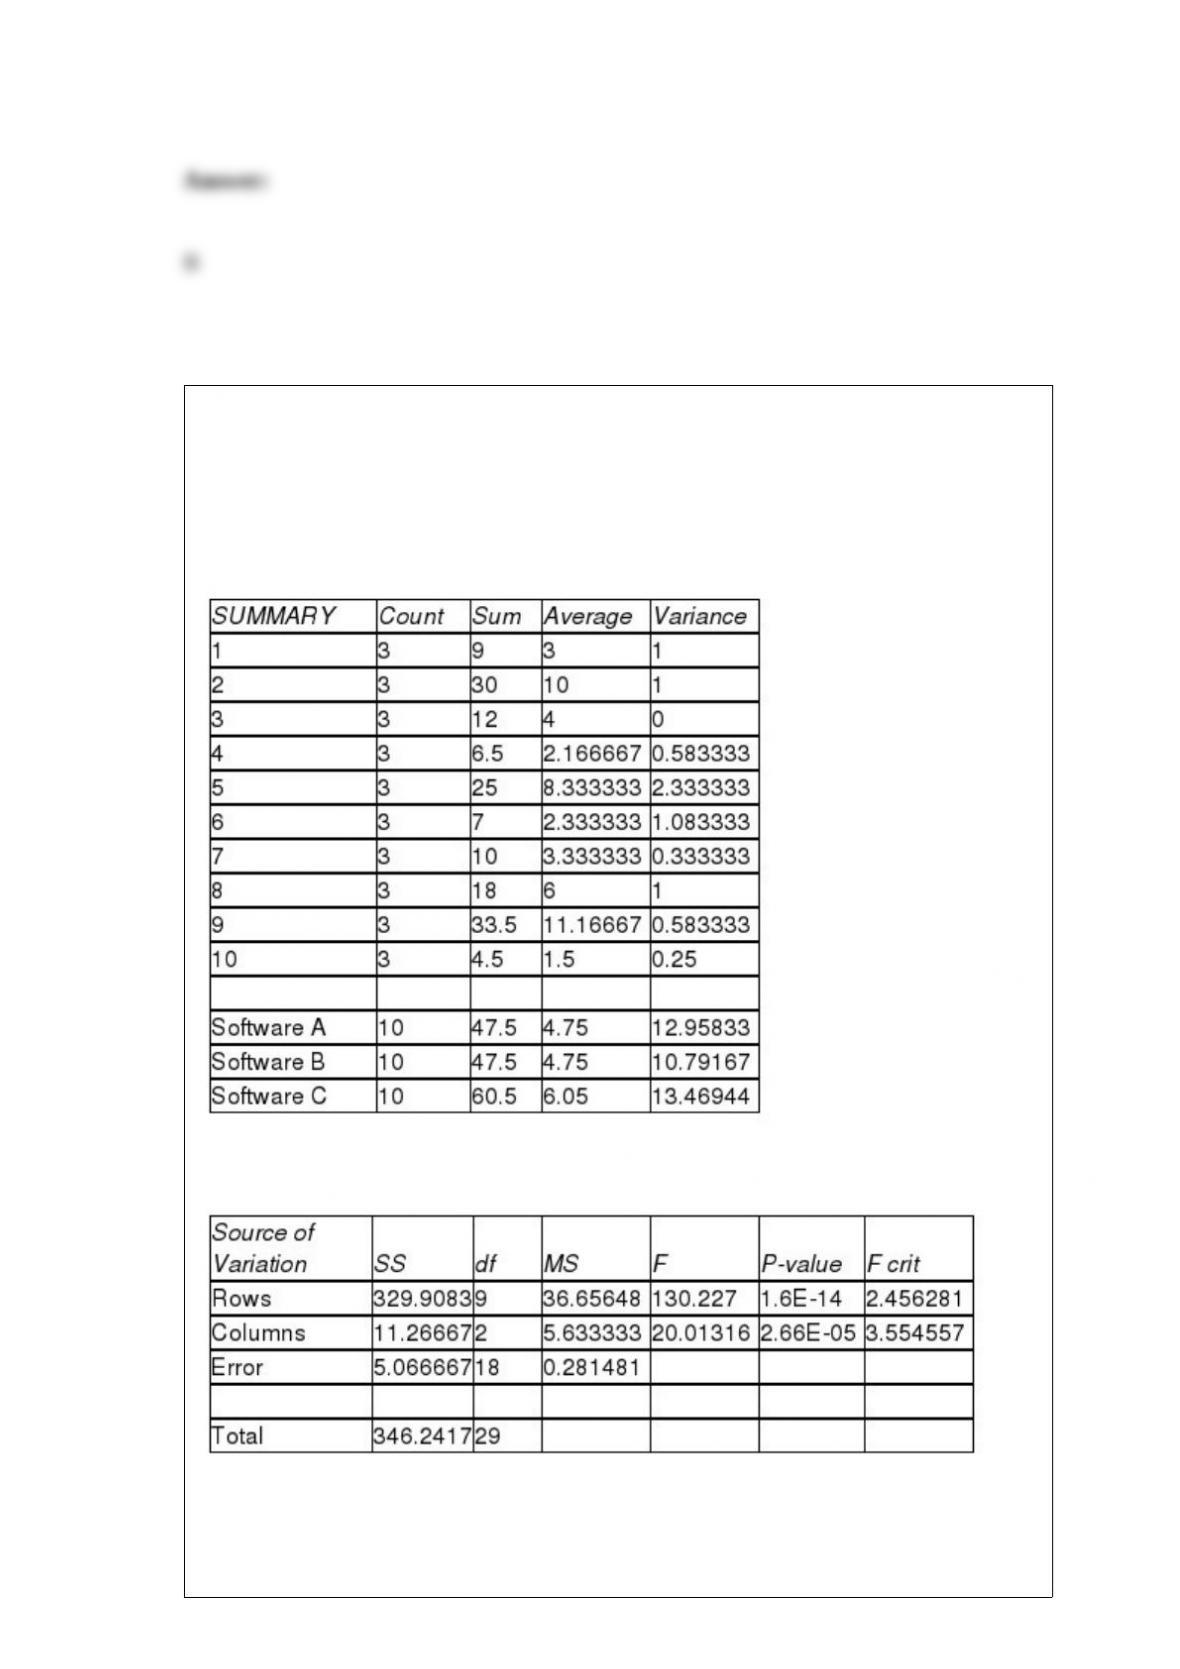
A test is conducted to compare three different income tax software packages to
determine whether there is any difference in the average time it takes to prepare income
tax returns using the three different software packages. Ten different persons’ income
tax returns are done by each of the three software packages and the time is recorded for
each. The computer results are shown below.
ANOVA
Based on these results and using a 0.05 level of significance which is correct regarding
blocking?

A) Blocking was not effective because p-value = 2.66 is greater than 0.05.
B) Blocking was effective because p-value = 2.66E – 5 is less than 0.05.
C) Blocking was not effective because p-value = 1.6 is greater than 0.05.
D) Blocking was effective because p-value = 1.6E-14 is less than 0.05.
For the following z-test statistic, compute the p-value assuming that the hypothesis test
is a one-tailed test: z = 2.09.
A) 0.0172
B) 0.0183
C) 0.0415
D) 0.0611
Each evening, a nationwide retail chain randomly calls 100 of the customers who came
to their store that day to ask whether they were satisfied with the service they had
received. The customers respond yes or no. Suppose the company has found over time
that 8 percent of the customers are not satisfied (“no” answers), what is the 3-sigma
upper and lower control limits for the appropriate control chart?
A) About .053 and .107
B) 0 to about .16
C) -.0.14 to about .16
D) About -1.96 to 1.96
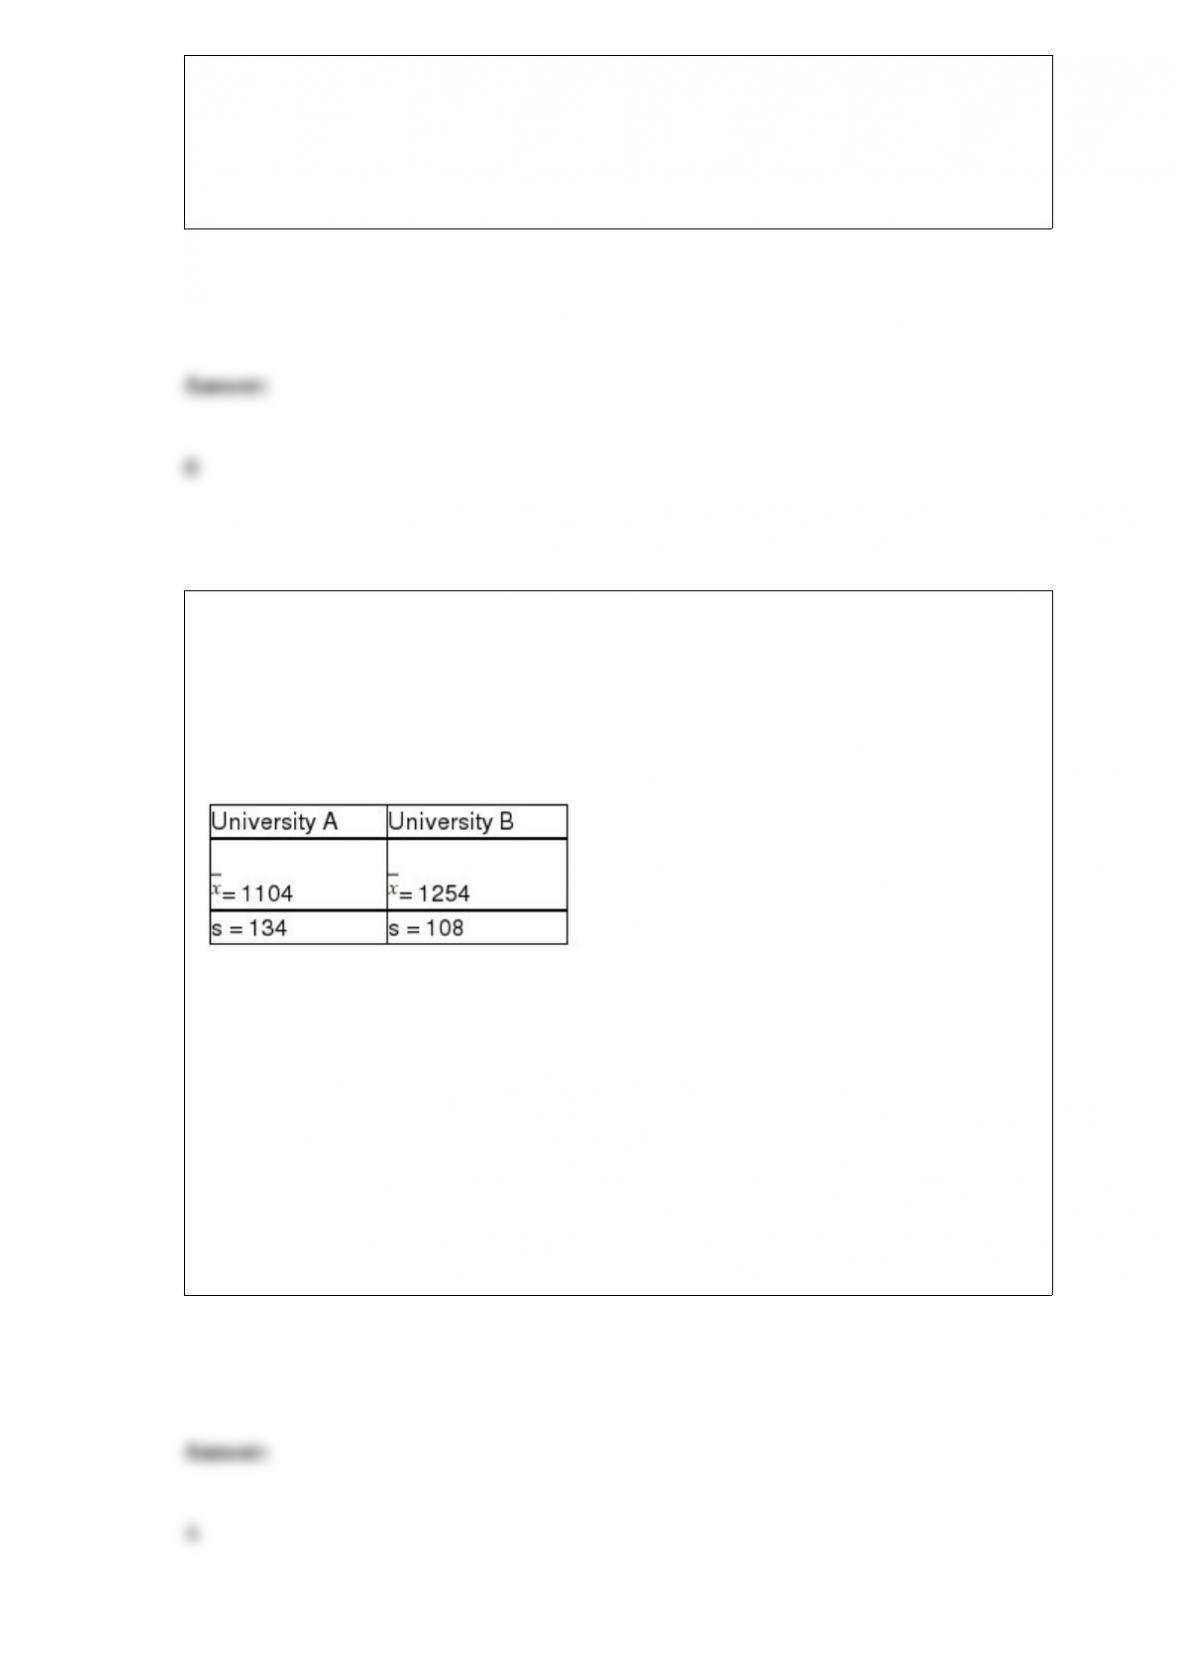
It is believed that the SAT scores for students entering two state universities may have
different standard deviations. Specifically, it is believed that the standard deviation at
University A is greater than the standard deviation at University B. To test this using an
alpha = 0.05 level, a sample of 14 student SAT scores from University A was selected
and a sample of 8 SAT scores from University B was selected. The following sample
results were observed:
Based on this information, what is the critical value that will be used to test the
hypothesis?
A) = 3.55
B) = 2.832
C) z = 1.645
D) = 3.237

The most useful tool to identify the trend component of a time series is
A) moving averages.
B) exponential smoothing.
C) regression analysis.
D) the MAD approach.