In constructing a stem and leaf diagram, there is a hard-and-fast rule for defining the
stem and the leaves.
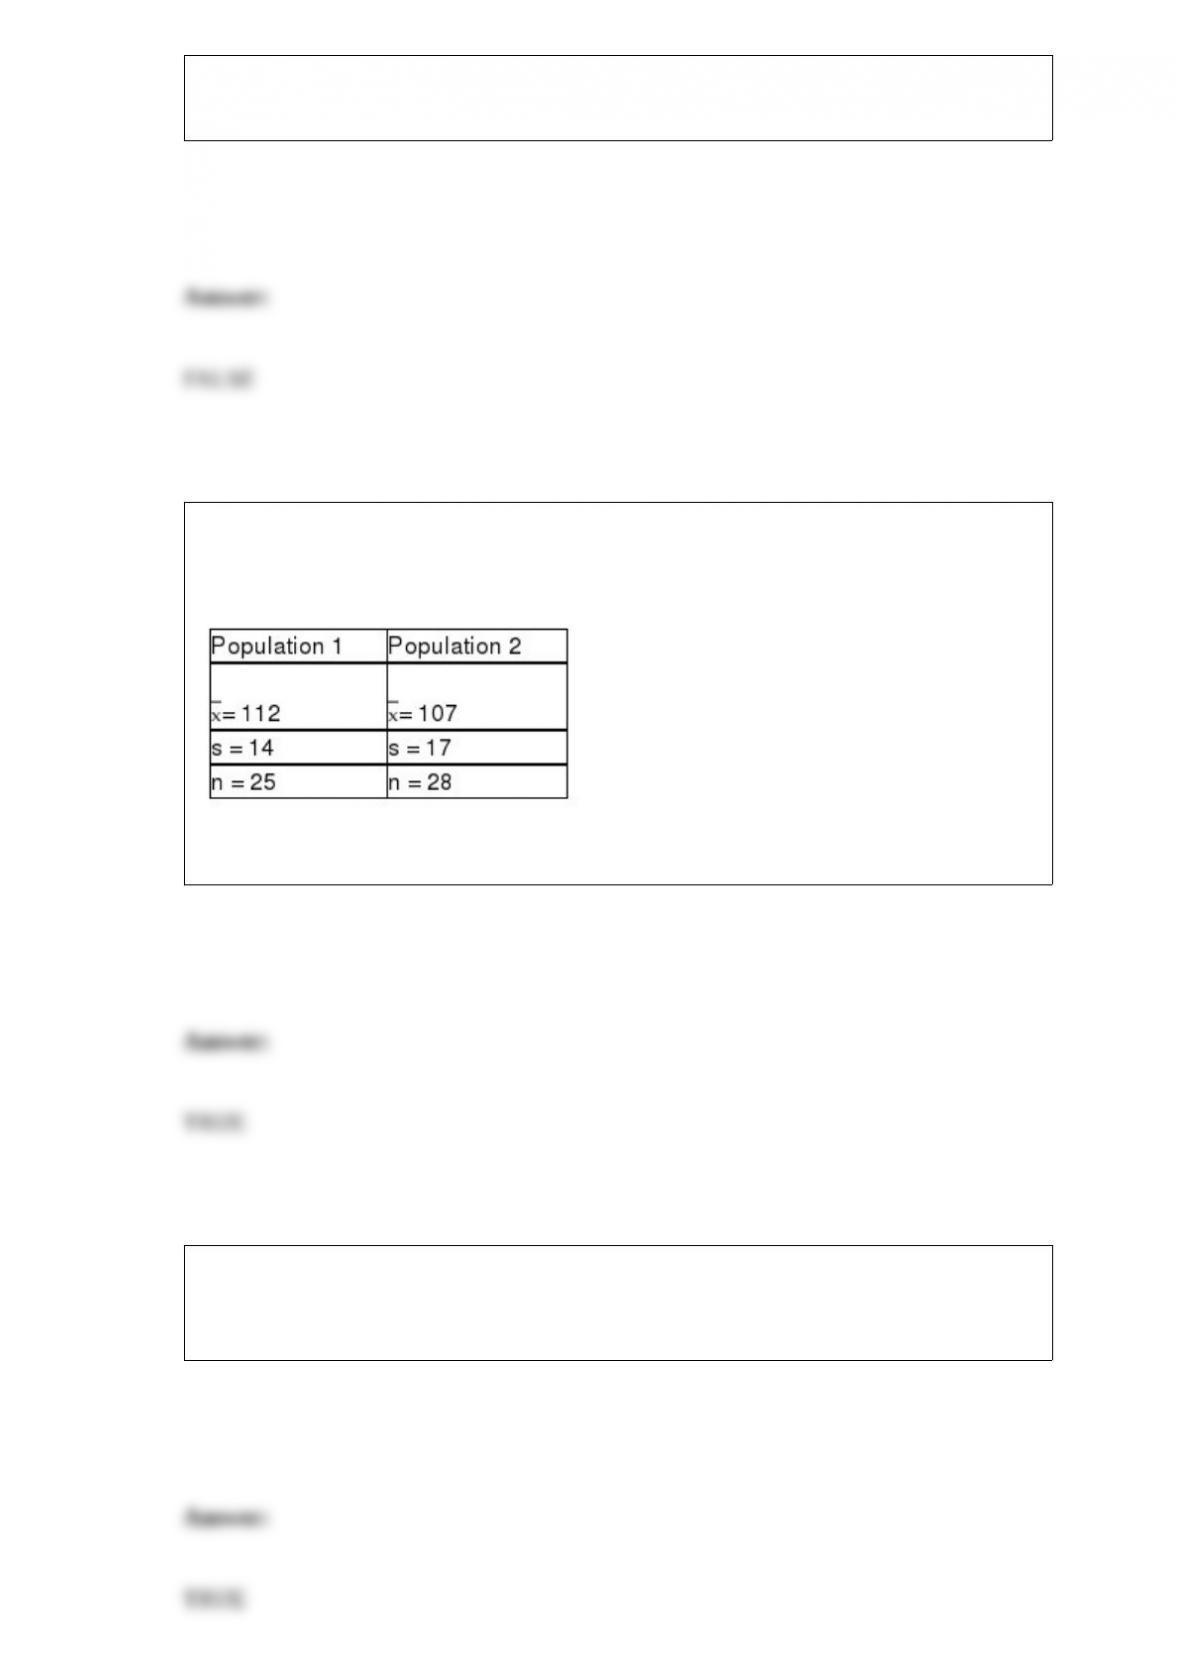
In order to test the difference in populations means, samples were collected for two
independent populations where the variances are assumed equal and the population
normally distributed. The following data resulted:
The value of the pooled standard deviation is 15.66.
A sampling distribution for a sample of n = 4 is normally distributed with a standard
deviation equal to 5. Based on this information, the population standard deviation, σ, is
equal to 10 mph.

Suppose a distribution has a mean of 80 and standard deviation of 10. It is found that 84
percent of the values in the data set lie between 70 and 90. This implies that the
distribution is not bell-shaped.
A larger sample size reduces the potential for large sampling error.
A chain of fast food restaurants wants to compare the average service times at four
different restaurants. They want to conduct a hypothesis test to determine if all four
means are the same or not. If
n = 10 observations are taken at each of the four restaurants, then the degrees of
freedom are D1 = 39 and D2 = 3.

In a one-way analysis of variance test, the following null and alternative hypotheses are
appropriate:
H0 : μ1 = μ2 = μ3
Hα : μ1 ≠ μ2 ≠ μ3
Typically, it is possible to include a larger number of questions in a phone survey than
in a mail survey since it takes less time to complete the survey over the phone.
If a manager is interested in analyzing the relationship between the age of customers
and the dollar volume of business that is done in the store, a relative frequency
distribution would be most appropriate.
A pilot sample is one that is used when a decision maker wishes to get an advance idea
of what the mean of the population might be.

If a set of data has 1,500 values, the 30th percentile value will correspond to the 450th
value in the data when the data have been arranged in numerical order.
When comparing experiments, surveys, and direct observation as methods of data
collection, the method that would typically be the least expensive is surveys.
In a multiple regression model, it is assumed that the errors or residuals are normally
distributed.

Service time for customers at a drive-through coffee shop has been shown to be
uniformly distributed between 2 and 10 minutes. Customers will complain when service
time exceeds 7.5 minutes. Based on this information, the probability of getting a
complaint based on service time is 0.3125.
Acme Taxi has two taxi cabs. The manager tracks the daily revenue for each cab. Over
the past 20 days, Cab A has averaged $76.00 per night with a standard deviation equal
to $11.00. Cab B has averaged $200.00 per night with a standard deviation of $18.00.
Based on this information, Cab B has the greatest relative variation.
Process control charts are used to provide signals to indicate when the output of a
process is out of control.

In a test for determining whether two population variances are the same or different, the
larger the sample sizes from the two populations, the lower will be the chance of
making a Type I statistical error.
In a single exponential smoothing model, a large value for the smoothing constant will
result in greater smoothing of the data than will a smoothing constant close to zero.
Recently, a company tested three different machine types to see if there was a difference
in the mean thickness of products produced by the three. A random sample of ten
products was selected from the output from each machine. Given this information, the
proper design to test whether the means are equal is a one-way ANOVA balanced
design.
A set of data is considered to be symmetric if the 3rd quartile is three times larger than
the 1st quartile.

The critical value for a Kruskal Wallis test is an F value from the F-distribution.
Both a scatter plot and the correlation coefficient can distinguish between a curvilinear
and a linear relationship.
If a decision maker wishes to test to determine whether the medians are equal for two
populations the Mann-Whitney U test is appropriate for either independent or
dependent sampling situations.

A contingency table and a cross-tabulation table are two separate things and should not
be used for the same purpose.
The loan manager for State Bank and Trust has claimed that the mean loan balance on
outstanding loans at the bank is over $14,500. To test this at a significance level of 0.05,
a random sample of n = 100 loan accounts is selected. Assuming that the population
standard deviation is known to be $3,000, the value of that corresponds to the critical
value is approximately $14,993.50.
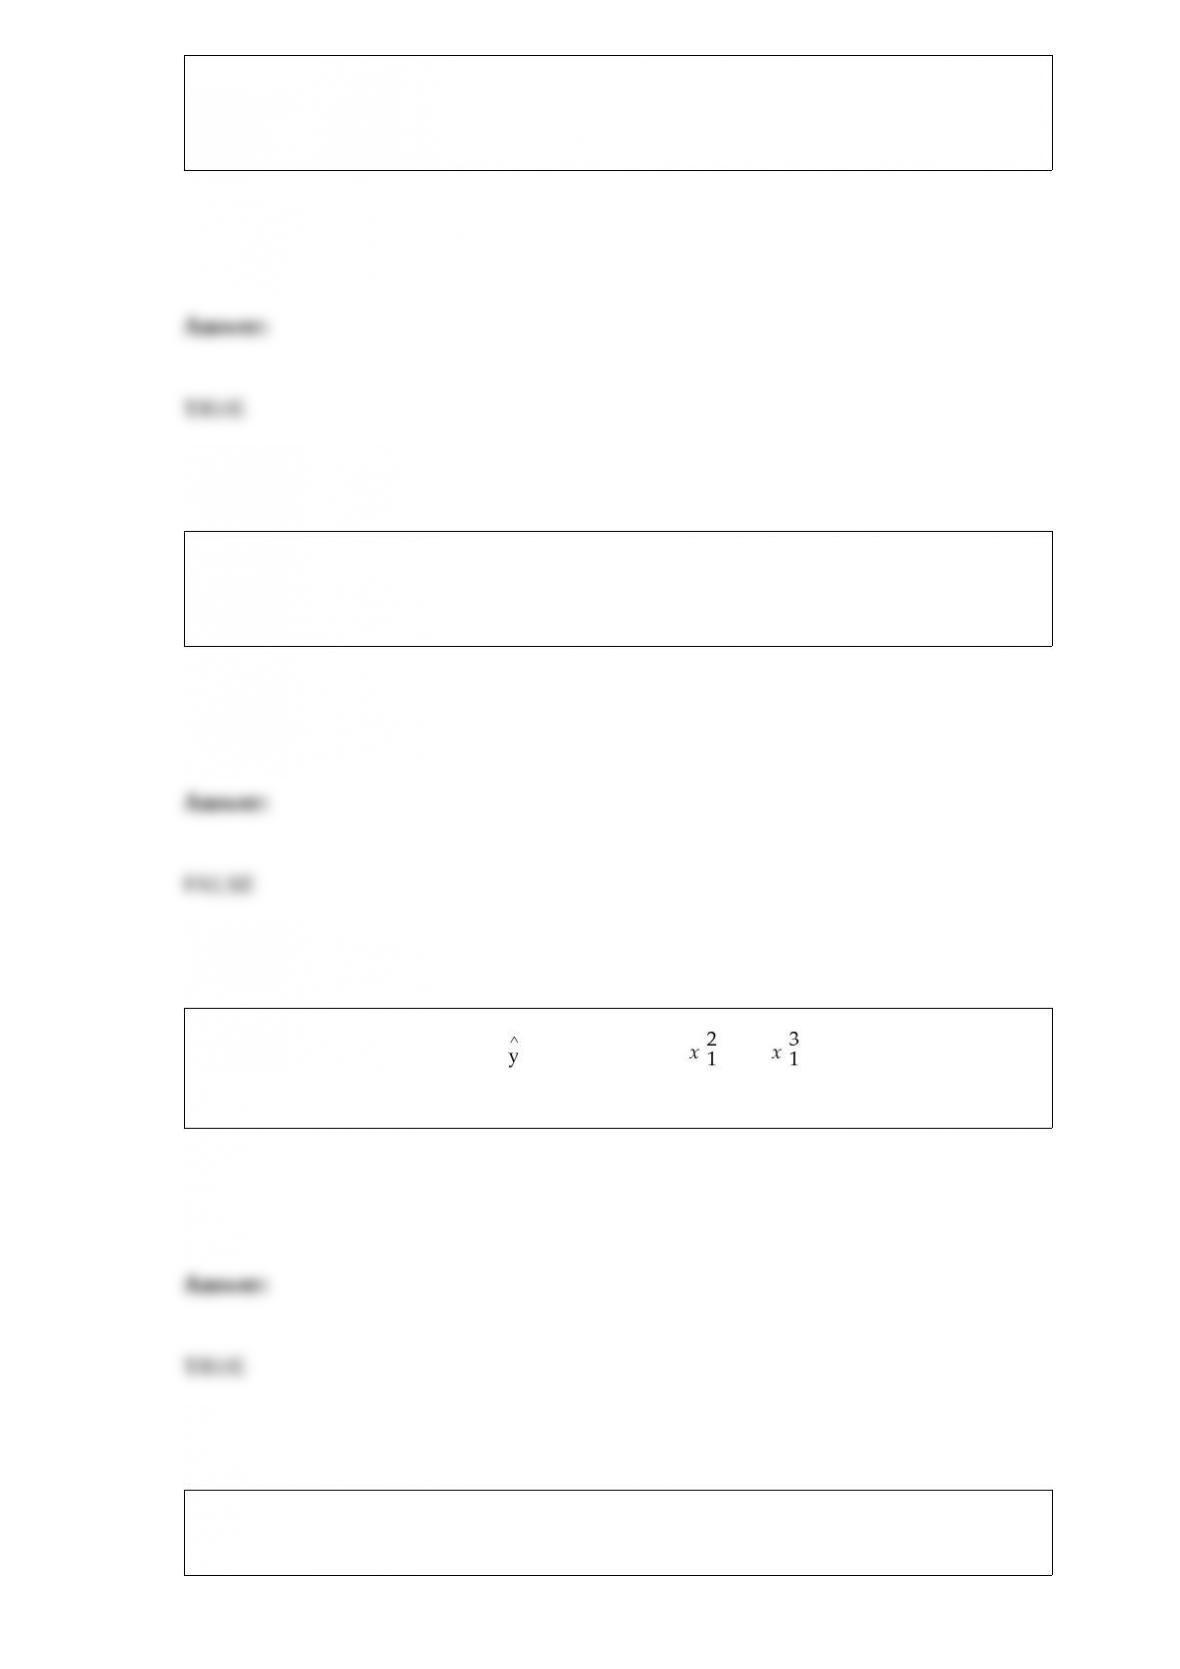
Residuals are calculated by e = y – .

Although the concept of sampling distributions is an important concept in statistics, it is
very unlikely that a decision maker will actually construct a sampling distribution in
any practical business situation.
A study recently conducted by a marketing firm analyzed three different advertising
designs and four different income levels of potential customers. At each combination of
factor A and factor B, 5 customers are observed and the number of products produced
are recorded. The degrees of freedom for the MSE in this two-factor ANOVA design is
48.
A major package delivery company claims that at least 95 percent of the packages it
delivers reach the destination on time. As part of the evidence in a lawsuit against the
package company, a random sample of n = 200 packages was selected. A total of 188 of
these packages were delivered on time. Using a significance level of 0.05, the critical
value for this hypothesis test is approximately 0.90.
One of the disadvantages of a regression-based linear trend forecasting model is that the
forecast errors are computed for time periods that were used in developing the
forecasting model and thus do not truly measure the forecasting ability of the model.
To test whether Model A and Model B cars have the same MPG, the first step is to
select two independent random samples of drivers and assign one of them to drive
Model A and the other Model B.
A regression model of the form: = B0 + B1x1 + B2 + B3+ ε is called a 3rd order
polynomial model.
The Tukey-Kramer method for multiple comparisons can only be used when the
analysis of variance design is balanced.

Recently, a department store chain was interested in determining if there was a
difference in the mean number of customers who enter the three stores in Seattle. The
analysts set up a study in which the number of people entering the stores was counted
depending on whether the day of the week was Saturday, Sunday, or a weekday. The
following data were collected:
Given this format, which of the following is true?
A) The day of the week would be considered the blocking factor in the study.
B) There are six treatments.
C) This is a balanced design since the number of rows and columns is equal.
D) All of the above are true.
If the age distribution of customers at a major retail chain is thought to be bell-shaped
with a mean equal to 43 years and a standard deviation equal to 7 years, the percentage
of customers between the ages of 29 and 57 years is:
A) approximately 81.5.

B) approximately 68.
C) at least 75.
D) approximately 95.
In a Kruskal-Wallis test when ties occur, each observation is given the ________ for
which it is tied.
A) highest rank
B) lowest rank
C) mean rank
D) median rank
A cell phone service provider has 14,000 customers. Recently, the sales department
selected a random sample of 400 customer accounts and recorded the number of
minutes of long distance time used during the previous billing period. The company
analyst used Excel to sort these values in order from high to low. She then assigned the
highest value a rank of 1, the next highest value a rank of 2, and so forth. These ranks
would be considered to be ordinal data.

If two events are independent, then
A) they must be mutually exclusive.
B) the sum of their probabilities must be equal to one.
C) their intersection must be zero.
D) None of the above
The random variable x is the number of customers arriving at the service desk of a local
car dealership over an interval of 10 minutes. It is known that the average number of
arrivals in 10 minutes is 5.3. The probability that there are less than 3 arrivals in any 10
minutes is:
A) .0659
B) .0948
C) .1016
D) .1239

Estimation and hypothesis testing are categories of:
A) inferential statistics.
B) descriptive statistics.
C) numerical measurement.
D) statistical charts.
As a step in establishing its rates, an automobile insurance company is interested in
determining whether there is a difference in the mean highway speeds that drivers of
different age groups drive. To help answer this question, it has selected a random
sample of drivers in three age categories: under 21, 21-50, and over 50. The engineers
then recorded the drivers’ speeds at a designated point on a highway in the state. The
subjects were unaware that their speed was being recorded. The following one-way
ANOVA output was generated from the sample data. Based upon this output, if the
significance level is 0.05, the engineers should conclude that the mean speeds may all
be equal since the p-value is less than alpha.
ANOVA: Single Factor

The city counsel has just voted to pass the city’s budget for next year. If you were
writing a report describing the budget so the citizens could understand how the total tax
dollars will be spent, which of the following graphs might be most appropriate?
A) Pie chart
B) Scatter diagram
C) Histogram
D) Ogive
The U.S. Golf Association provides a number of services for its members. One of these
is the evaluation of golf equipment to make sure that the equipment satisfies the rules of
golf. For example, they regularly test the golf balls made by the various companies that
sell balls in the United States. Recently they undertook a study of two brands of golf
balls with the objective to see whether there is a difference in the mean distance that the
two golf ball brands will fly off the tee. To conduct the test, the U.S.G.A. uses a robot
named “Iron Byron,” which swings the club at the same speed and with the same swing
pattern each time it is used. The following data reflect sample data for a random sample
of balls of each brand.
Given this information, what is the test statistic for testing whether the two population
means are equal?
A) t = 1.115
B) t = 1.96

C) t = -4.04
D) t = -2.58
For the following hypothesis test
With n = 100 and p = 0.66, state the calculated value of the test statistic.
A) 2.7299
B) -2.0785
C) 1.4919
D) -0.3421
State University recently randomly sampled ten students and analyzed grade point
average (GPA) and number of hours worked off-campus per week. The following data
were observed:
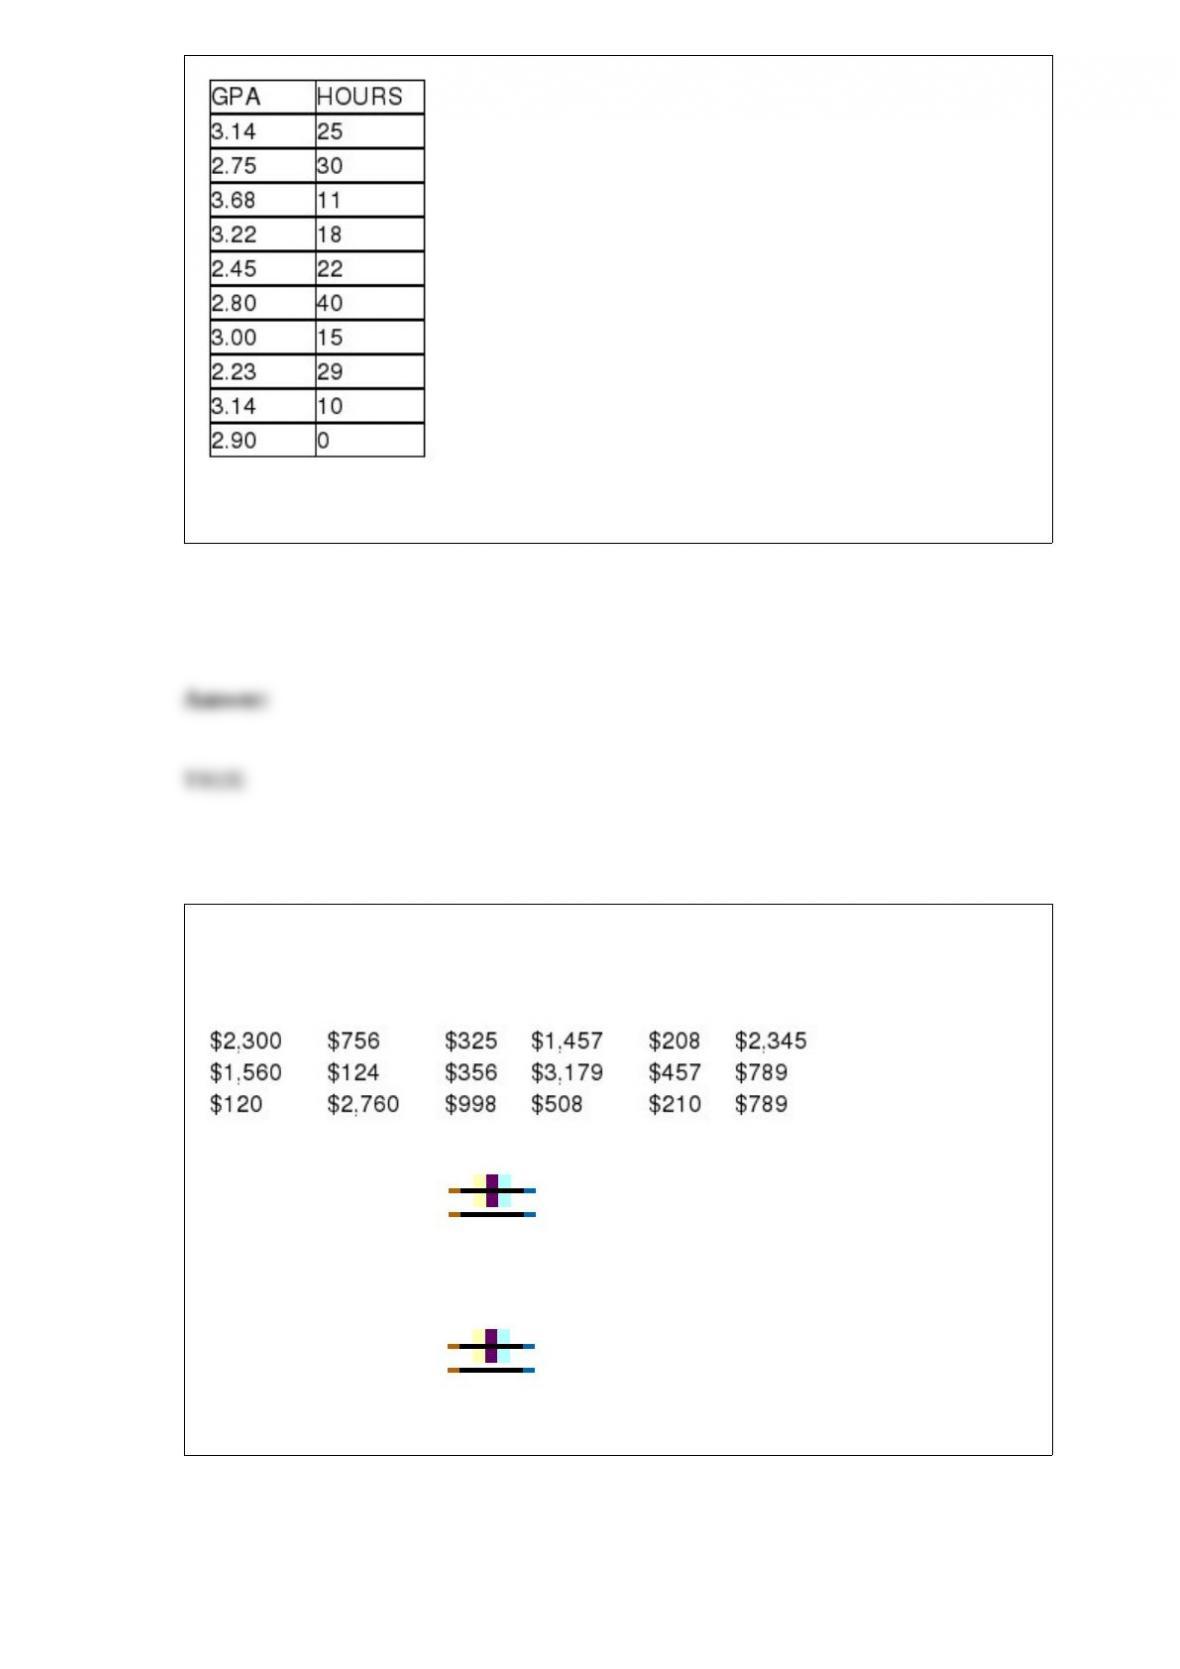
The correlation between these two variables is approximately -.461
The following data represent a random sample of bank balances for a population of
checking account customers at a large eastern bank. Based on these data, what is the 95
percent confidence interval estimate for the true population mean?
A) Approximately $1,069 $484.41
B) About $839.40 to $1,298.60
C) Approximately $1,069 2.1098
D) None of the above

A test is conducted to compare three different income tax software packages to
determine whether there is any difference in the average time it takes to prepare income
tax returns using the three different software packages. Ten different person’s income
tax returns are done by each of the three software packages and the time is recorded for
each. Assuming that results show that blocking was effective, this means that:
A) there are significant differences in the average times needed by the 3 different
software packages.
B) there are significant differences in the average times needed for the 10 different
person’s tax returns.
C) the analysis should be redone using a one-way analysis of variance.
D) the randomized complete block was the wrong method to use.
A sampling plan that requires a person to interview 100 people as they exit a
department store would most likely be:
A) a simple random sample.
B) a convenience sample.
C) a systematic random sample.
D) a stratified sample.

John Thurgood founded a company that translates Chinese books into English. His
company is currently testing a computer-based translation service. Since Chinese
symbols are difficult to translate, John assumes the computer program will make some
errors, but then so do human translators. The computer error rate is supposed to be an
average of 3 per 400 words of translation. Suppose John randomly selects a 1,200-word
passage. Assuming that the Poisson distribution applies, if the computer error rate is
actually 3 errors per 400 words, find the probability that fewer than 9 errors will be
found.
A) 0.000123
B) 0.0141
C) 0.0415
D) 0.4557
A stock portfolio contains 20 stocks. Of these stocks, 10 are considered “large-cap”
stocks, 5 are “mid-cap,” and 5 are ‘small cap.” The portfolio manager has been asked by
his client to develop a report that highlights 7 randomly selected stocks. When she
presents her report to the client, all 7 of the stocks are large-cap stocks. The client is
very suspicious that the manager has not randomly selected the stocks. She believes that
the chances of all 7 of the stocks being large cap must be very low. Compute the
probability of all 7 being large cap.
A) 0.0015
B) 0.0008
C) 0.0121
D) 0.0309

For the following hypothesis:
With n = 20, = 71.2, s = 6.9, and α = 0.1, state the calculated value of the test statistic
t.
A) 1.58
B) 0.78
C) 1.14
D) 0.41
A consumer products company is planning to introduce a new product. The method that
is least likely to be used to assess the probability of the product being successful is:
A) classical probability assessment.
B) subjective assessment.
C) relative frequency of occurrence.
D) elementary events.

At a sawmill in Oregon, a process improvement team measured the diameters for a
sample of 1,500 logs. The following summary statistics were computed:
Given this information, for a box and whisker plot which of the following statements is
appropriate?
A) Seventy-five percent of the trees in the sample have values between 8.9 in. and 15.6
in.
B) Virtually all of the data should fall between 0 in. and 25.65 in.
C) No tree will have a diameter of more than 22.3 in.
D) Fifty percent of the trees will have diameters between 13.5 in. and 15.6 in.
If a hypothesis test for a single population variance is to be conducted, which of the
following statements is true?
A) The null hypothesis must be stated in terms of the population variance.
B) The chi-square distribution is used.
C) If the sample size is increased, the critical value is also increased for a given level of
statistical significance.
D) All of the above are true.
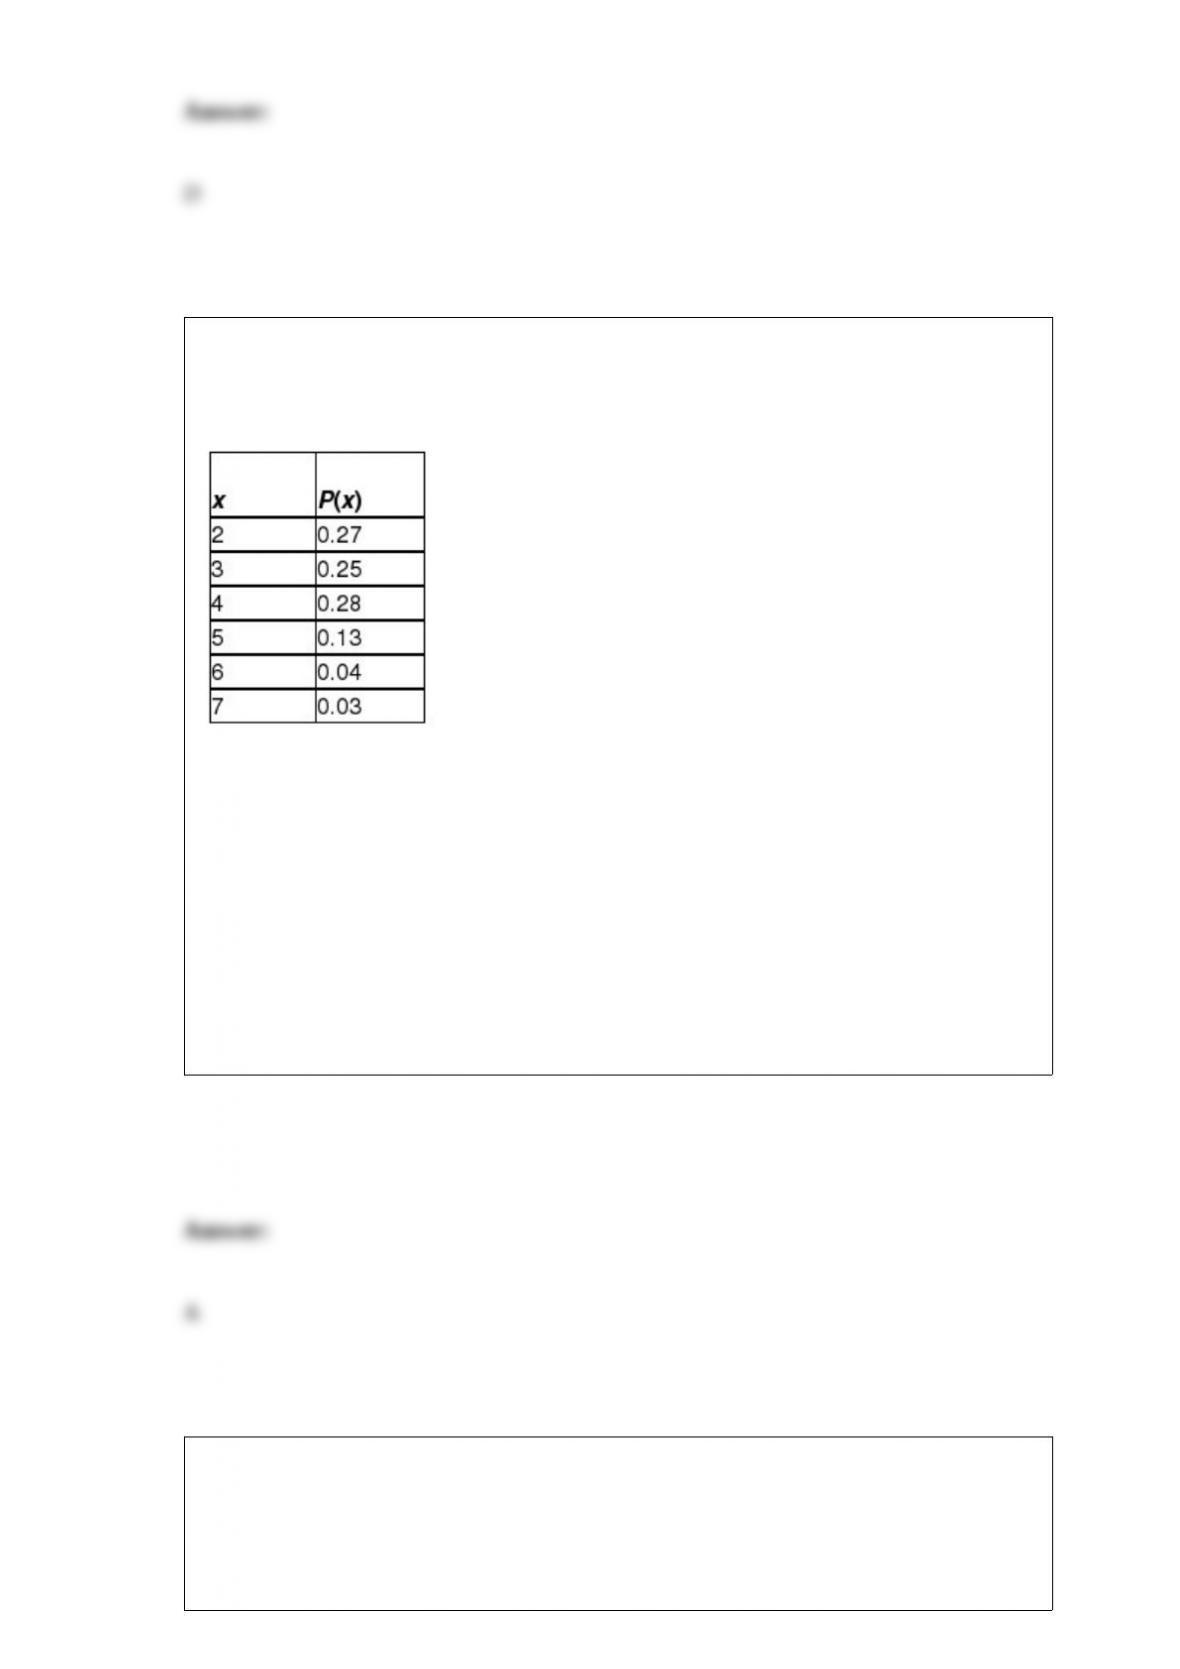
The U.S. Census Bureau (Annual Social & Economic Supplement) collects
demographics concerning the number of people in families per household. Assume the
distribution of the number of people per household is shown in the following table:
Compute the variance and standard deviation of the number of people in families per
household.
A) Variance=1.6499, standard deviation=1.2845
B) Variance=1.2845, standard deviation=1.6499
C) Variance=6.7182, standard deviation=2.5919
D) Variance=2.5919, standard deviation=6.7182
A paint manufacturer is interested in determining whether there is a difference in the
median time it takes for two different brands of paint to dry once they have been
applied to a wall surface. To test this, the company has selected a random sample of 5
walls and applied brand 1 and another 5 walls and applied brand 2. The following data
reflect the actual drying time in hours:
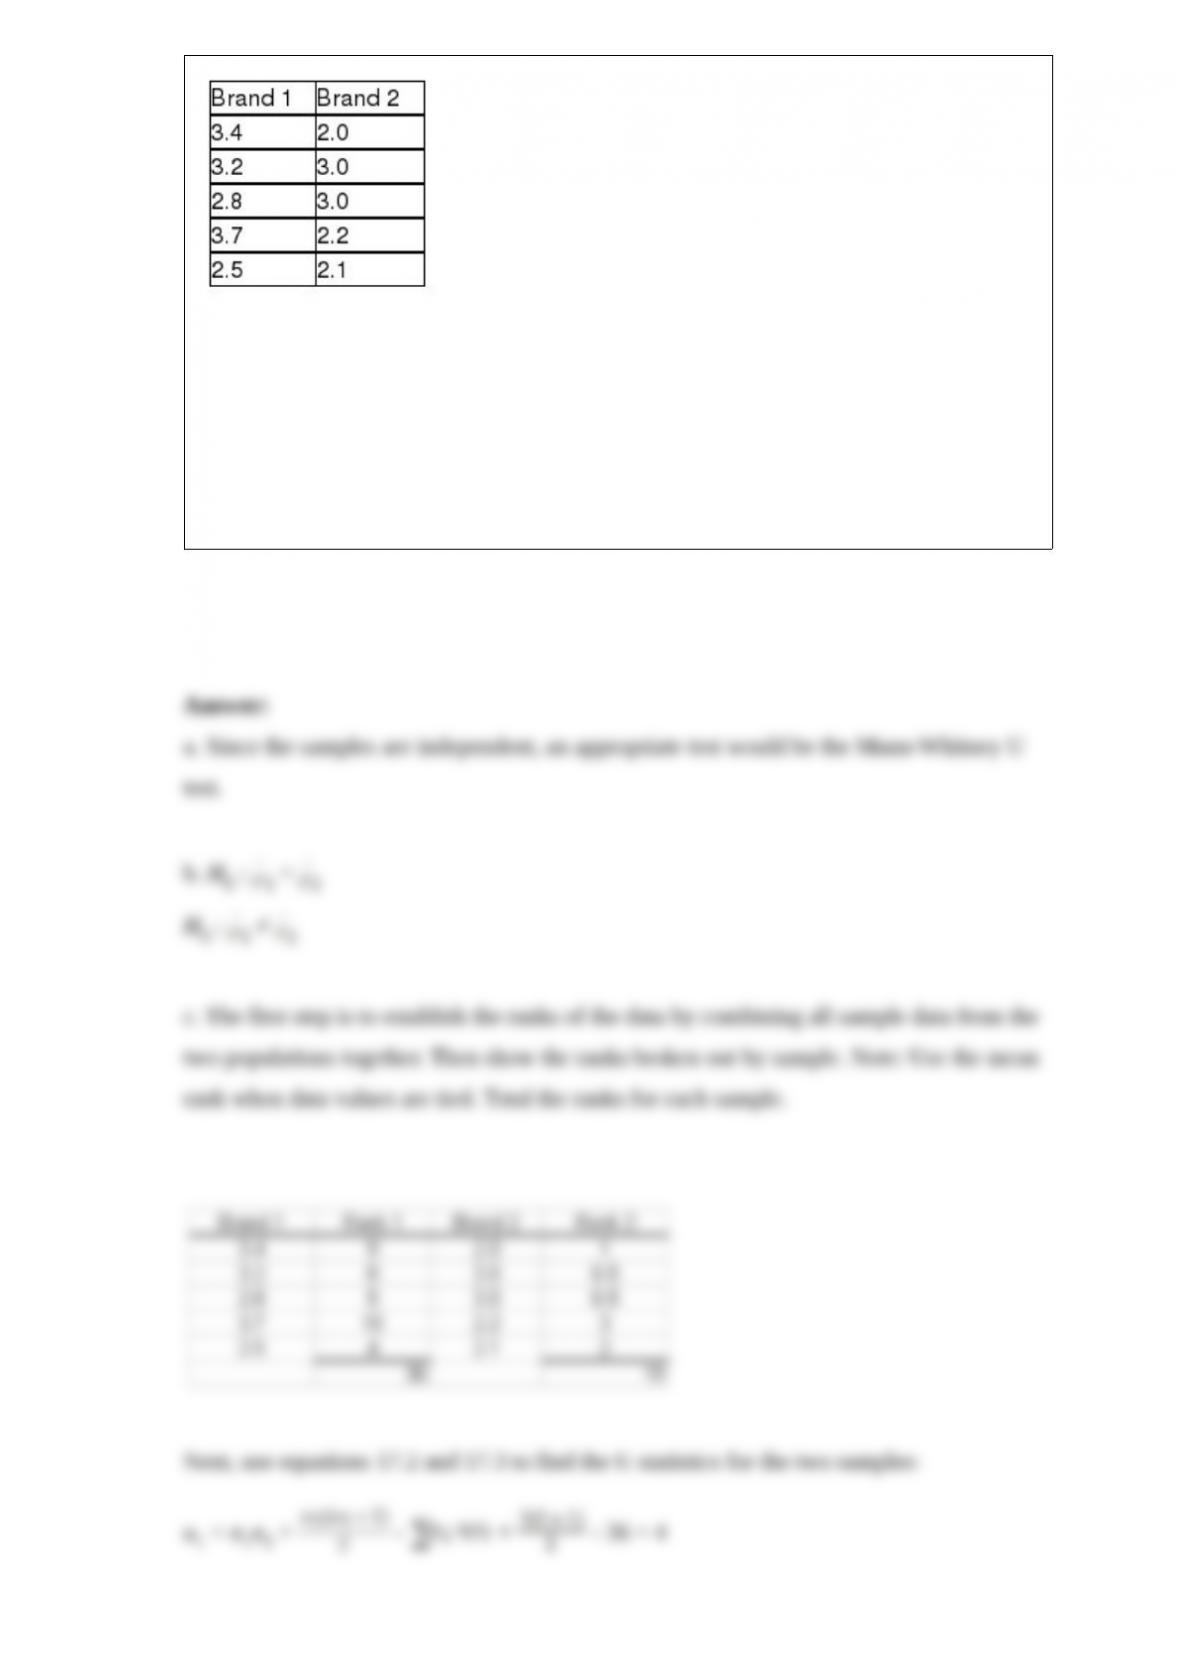
a. If you are unwilling to make the assumptions necessary to use a t-test, what test
would you recommend in this situation?
b. What would be the appropriate null and alternative hypothesis?
c. Using an alpha level equal to .05, conduct the hypothesis test and state the
conclusion.
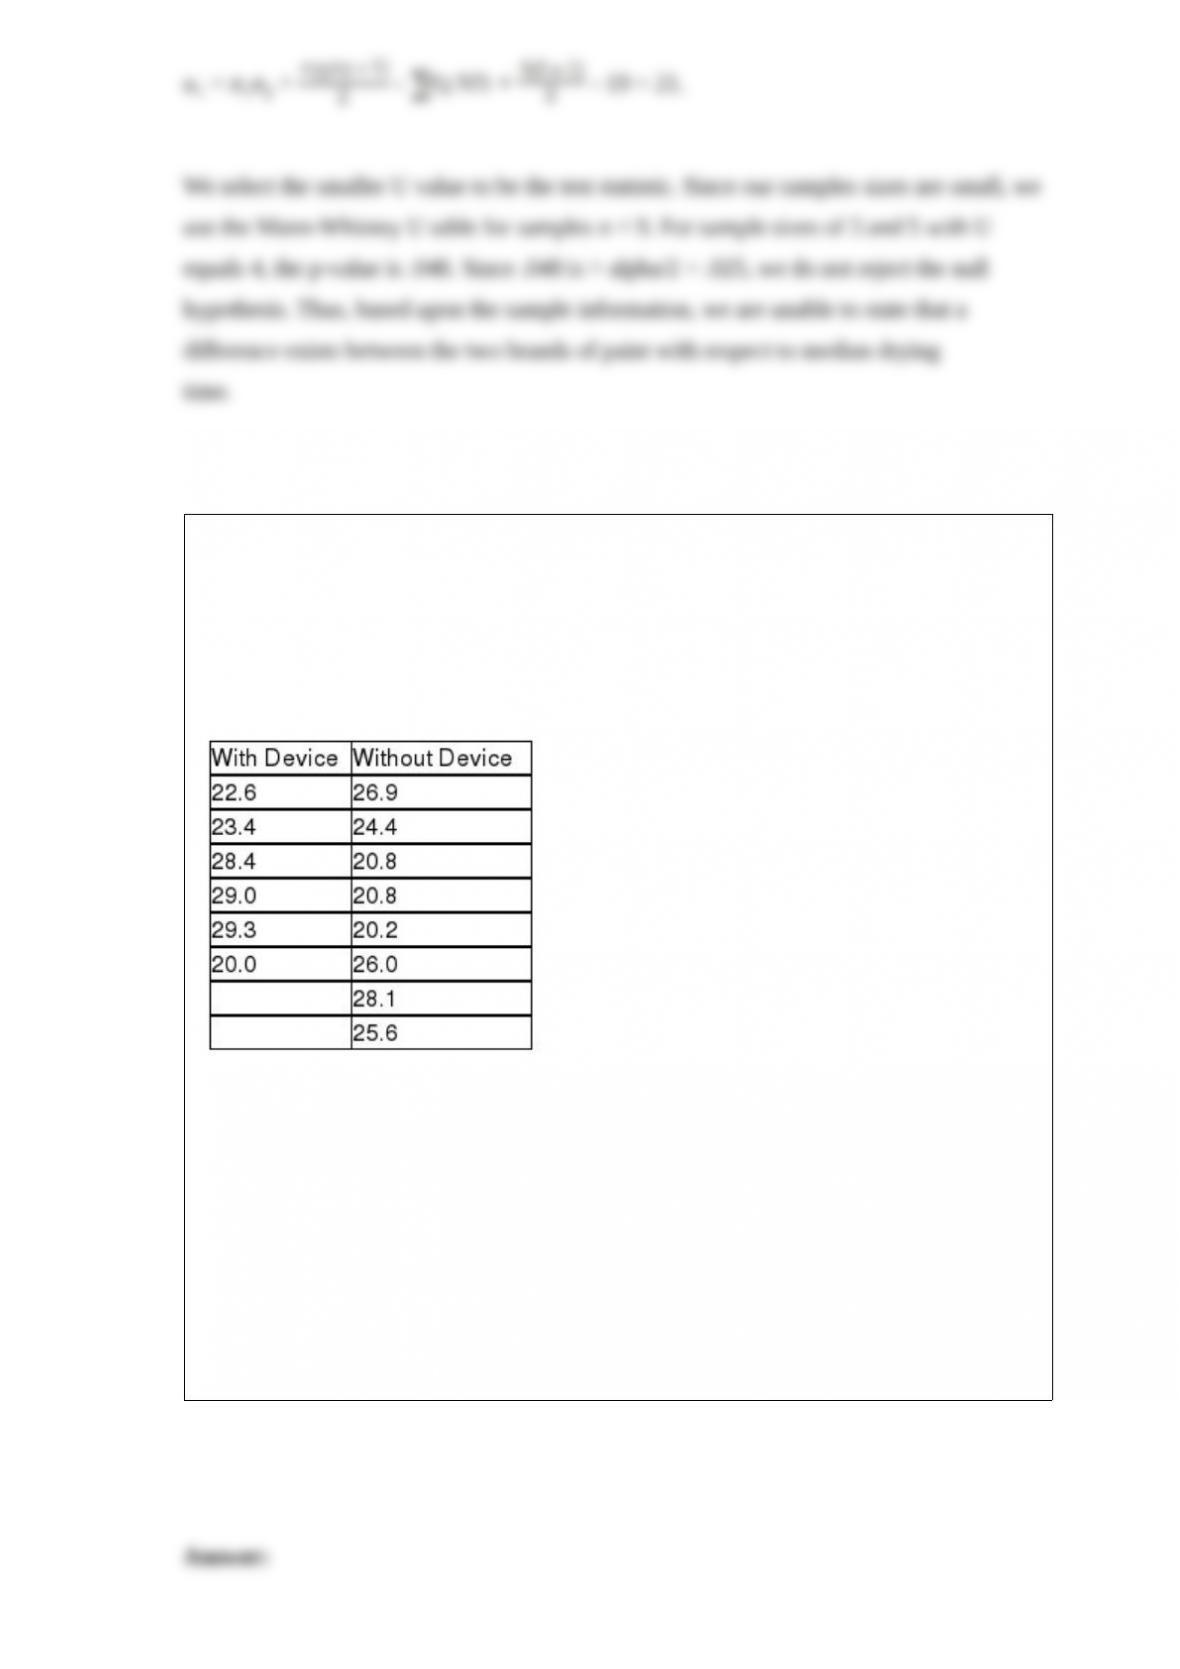
A company in Maryland has developed a device that can be attached to car engines,
which it believes will increase the miles per gallon that cars will get. The owners are
interested in estimating the difference between mean mpg for cars using the device
versus those that are not using the device. The following data represent the mpg for
independent random samples of cars from each population. The variances are assumed
equal and the populations normally distributed.
Given this data, what is the critical value if the owners wish to have a 90 percent
confidence interval estimate?
A) t = 2.015
B) t = 1.7823
C) z = 1.645
D) z = 1.96

Construct a 95% confidence interval estimate for the difference between two population
means based on the following information:
A) 25.41 ≤ (1 – 2) ≤ 44.59
B) 35.41 ≤ (1 – 2) ≤ 40.59
C) 15.741 ≤ (1 – 2) ≤ 54.16
D) 22.13 ≤ (1 – 2) ≤ 47.87
Recently, a department store chain was interested in determining if there was a
difference in the mean number of customers who enter the three stores in Seattle. The
analysts set up a study in which the number of people entering the stores was counted
depending on whether the day of the week was Saturday, Sunday, or a weekday. The
following data were collected:
Given this format, what is the null hypothesis for testing whether blocking is effective?

A) H0 : μA= μB= μC
B) H0 : μSat= μSun= μWeek
C) Not all means are equal.
D) H0 : σ1 = σ2 = σ3
For the following hypothesis:
With n = 20, = 71.2, s = 6.9, and α = 0.1, state the decision rule in terms of the critical
value of the test statistic.
A) This is a one-tailed test of the population mean with σ unknown. Therefore, the
decision rule is: accept the null hypothesis if the calculated value of the test statistic, t,
is greater than 1.3277. Otherwise, reject.
B) This is a one-tailed test of the population mean with σ unknown. Therefore, the
decision rule is: accept the null hypothesis if the calculated value of the test statistic, t,
is greater than 2.1727. Otherwise, reject.
C) This is a one-tailed test of the population mean with σ unknown. Therefore, the
decision rule is: reject the null hypothesis if the calculated value of the test statistic, t, is
greater than 1.3277. Otherwise, do not reject.
D) This is a one-tailed test of the population mean with σ unknown. Therefore, the
decision rule is: reject the null hypothesis if the calculated value of the test statistic, t, is
greater than 2.1727. Otherwise, do not reject.

Consider the situation in which a study was recently conducted to determine whether
the median price of houses is the same in Seattle and Phoenix. The following data were
collected.
Given these data, if a Mann-Whitney U test is to be used, the test statistic is:
A) 22
B) 14
C) approximately 1.96
D) 34
For the following hypothesis test:
With n = 15, s = 7.5, and = 62.2, state the calculated value of the test statistic t.
A) 1.014
B) 0.012

C) 0.878
D) 1.312
When small samples are used to estimate a population mean, in cases where the
population standard deviation is unknown:
A) the t-distribution must be used to obtain the critical value.
B) the resulting margin of error for a confidence interval estimate will tend to be fairly
small.
C) there will be a large amount of sampling error.
D) None of the above
We want to test whether type of car owned (domestic or foreign) is independent of
gender. A contingence table is obtained from a sample of 990 people as
At alpha = 0.05 level, we conclude that:
A) x2= 3.34 and type of car owned is independent of gender.

B) x2 = 3.34 and type of car owned is dependent of gender.
C) x2 = 3.84 and type of car owned is independent of gender.
D) x2 = 3.84 and type of car owned is dependent of gender.
Suppose as part of a national study of economic competitiveness a marketing research
firm randomly sampled 200 adults between the ages of 27 and 35 living in metropolitan
Seattle and 180 adults between the ages of 27 and 35 living in metropolitan
Minneapolis. Each adult selected in the sample was asked, among other things, whether
they had a college degree. From the Seattle sample 66 adults answered yes and from the
Minneapolis sample 63 adults answered yes when asked if they had a college degree.
Based on the sample data, can we conclude that there is a difference between the
population proportions of adults between the ages of 27 and 35 in the two cities with
college degrees? Use a level of significance of 0.10 to conduct the appropriate
hypothesis test.
A) Since the test statistic, 1.8214, is greater than the critical value of 1.645, reject the
null hypothesis and conclude that there is a higher proportion of Seattle adults that have
a college degree
B) Since the test statistic, 2.0112, is greater than the critical value of 1.645, reject the
null hypothesis and conclude that there is a higher proportion of Seattle adults that have
a college degree.
C) Since the test statistic, 0.7001, is not greater than the critical value of 1.645, do not
reject the null hypothesis and conclude that there is not a higher proportion of Seattle
adults that have a college degree.
D) Since the test statistic, 0.8921, is not greater than the critical value of 1.645, do not
reject the null hypothesis and conclude that there is not a higher proportion of Seattle
adults that have a college degree.

If a manager wishes to develop a confidence interval estimate for estimating the
difference between two population means, an increase in the size of the samples used
will result in:
A) an increase in the size of the critical value.
B) a wider confidence interval.
C) a more precise confidence interval.
D) a less precise confidence interval
A recent study of 15 shoppers showed that the correlation between the time spent in the
store and the dollars spent was 0.235. Using a significance level equal to 0.05, which of
the following is the test statistic for testing whether the true population correlation is
equal to zero?
A) t = 0.245
B) t = 1.76
C) t = 2.1604
D) t = 0.872

Which of the following is not an indication of potential multicollinearity problems?
A) The sign on the standard error of the estimate is positive.
B) A sign on a regression slope coefficient is negative when the sign on the correlation
coefficient was positive.
C) The standard error of the estimate increases when a variable enters the model in the
presence of other independent variables.
D) An independent variable goes from being statistically significant to being
insignificant when a new variable is added to the model.