
1) In pure competition, the industry demand curve is infinitely price elastic.
2) A good with a price-elasticity coefficient of 0.75 has a demand that is price-inelastic.
3) The basic difference between pure competition and monopolistic competition is in
the number of firms in the industry.
4) In the short run a pure monopolist will charge the highest price the market will bear
for its product.
5) The demand for a resource depends on its productivity and the market value of the
product it is producing.
6) Demographers expect world population to ultimately decline in the next century.
7) The graph depicts a monopolistically competitive firm.
Refer to the above graph. At the profit-maximizing level of short-run output, this
monopolistically competitive firm will be making a profit of:
A.$275

B.$350
C.$500
D.$525
8) The equilibrium point in the market is where S and D curve intersect.
Refer to the graph above. At equilibrium, consumer surplus would be represented by the
area:
A.a + b
B.a + b + c
C.a
D.b + c
9) The public interest theory of regulation stipulates that government regulation of a
natural monopoly is necessary in order to achieve the following, except:
A.Preventing the natural monopoly from harming society through its monopoly pricing
B.Garnering for society at least part of the cost reductions from being a natural
monopoly
C.Avoiding the reduction in output associated with monopoly power
D.Eventually breaking up the monopoly to achieve competition within the industry
10) People’s tendency to prefer something that will yield immediate benefits over
something whose benefits come later is called by behavioral economists as:
A.Myopia
B.Mental accounting
C.Anchoring
D.Framing
11) Answer the question on the basis of the following production possibilities data for
two countries, Alpha and Beta, which have populations of equal size.
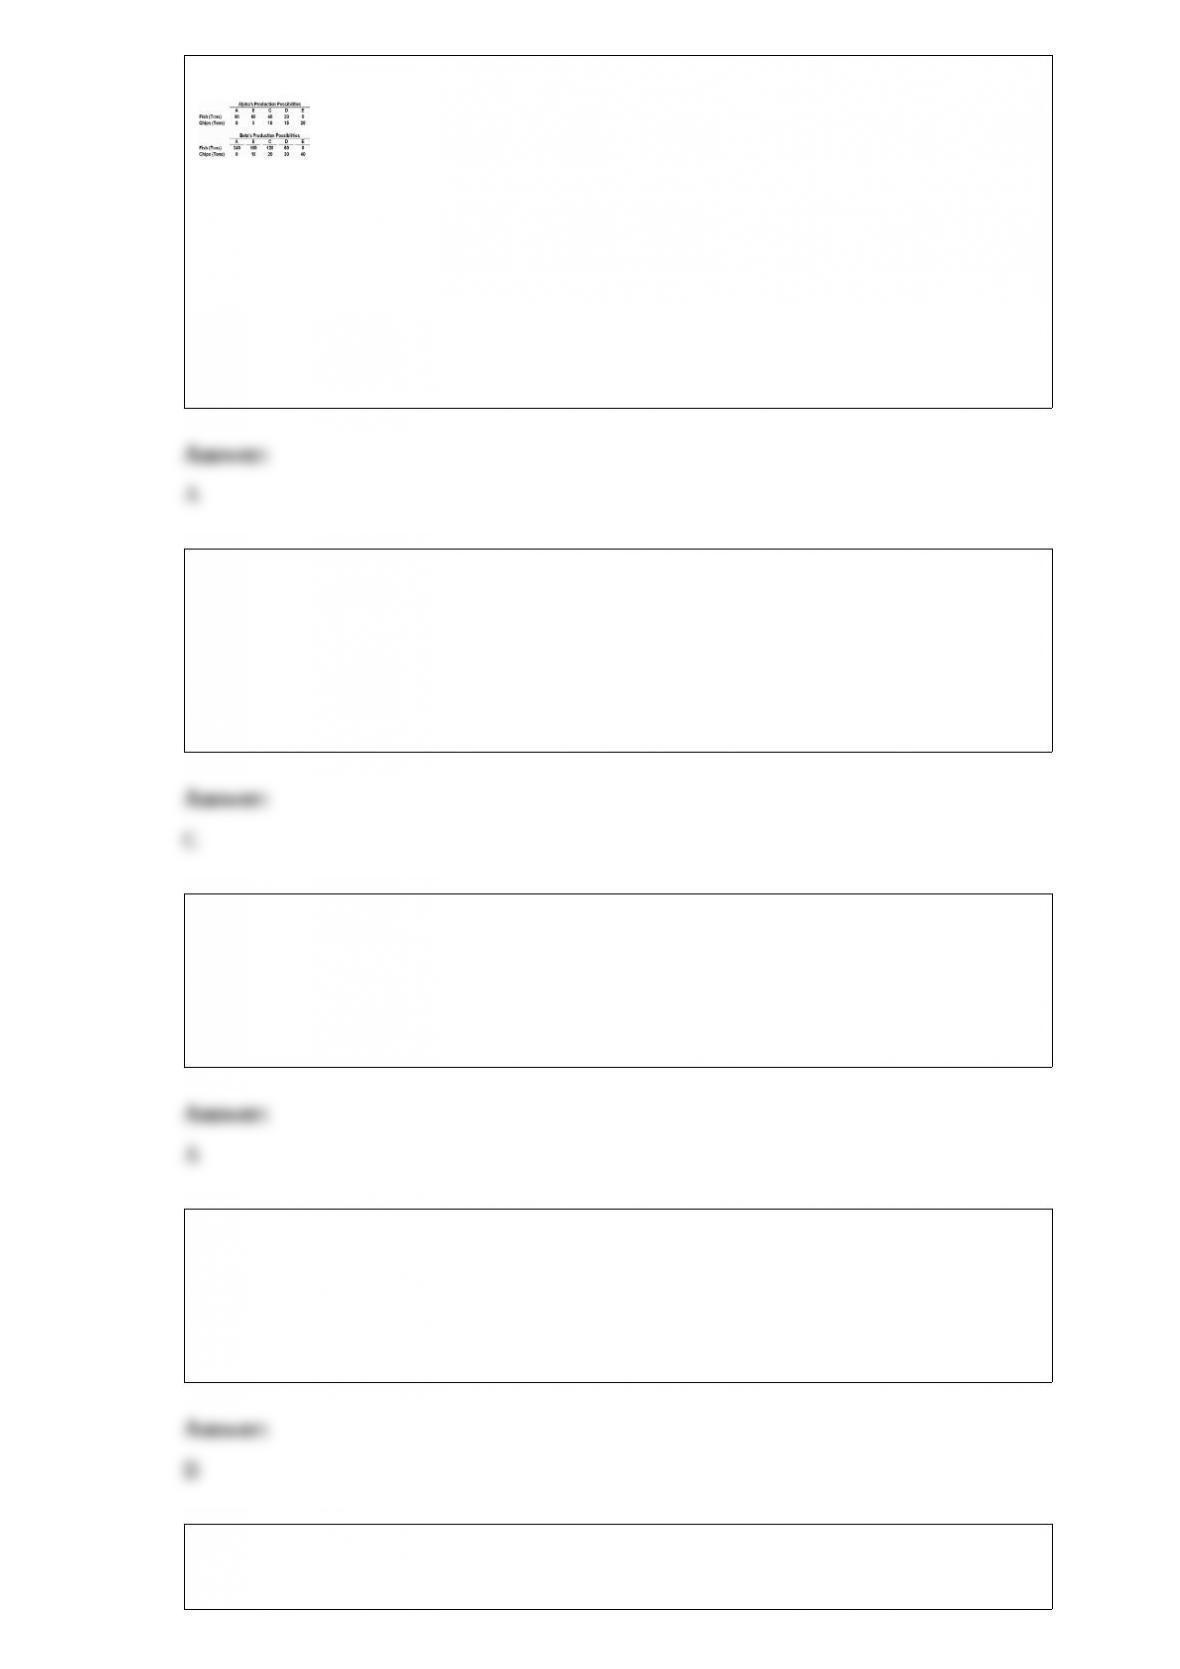
Refer to the given data. Suppose that before specialization and trade Alpha chose
production alternative C and Beta chose production alternative B. After specialization
and trade, the gains will be:
A.20 tons of fish.
B.20 tons of chips.
C.20 tons of fish and 20 tons of chips.
D.240 tons of fish and 20 tons of chips.
12) The real cost of buying a market basket of 25 important commodities in 2011
compared to the cost in the 1845-1850 base period is:
A.Higher by about 100 percent
B.About the same or equal
C.Lower by about 50 percent
D.Higher by about 50 percent
13) Which of the following is a unique feature of oligopoly?
A.Mutual interdependence.
B.Advertising expenditures.
C.Product differentiation.
D.Nonprice competition.
14) In the market for superstars:
A.earnings reflect pricing power rather than marginal revenue product.
B.small differences in talent get magnified into huge differences in pay.
C.entry and exit rarely occur.
D.product demand is typically highly elastic.
15) Those who believe that “there is no such thing as bad publicity” base this argument
on which of the following ideas from behavioral economics?

A.That the recognition heuristic will overcome any negative emotional associations.
B.That the recognition heuristic will prevent people from incorporating negative
information into their decision-making process.
C.That framing effects will diminish the negative emotions associated with most bad
publicity.
D.That self-serving biases will make people “look the other way” and ignore bad
publicity.
16) Mr. Samuelson’s current rates of purchase are such that the marginal utility of slacks
is 18 and the marginal utility of ties for him is 5. If slacks and ties are priced at $12 and
$2 respectively, it can be concluded that Mr. Samuelson:
A.Is spending too much on slacks and not enough on ties
B.Is spending too much on ties and not enough on slacks
C.Is spending his income in such a way as to maximize his satisfaction
D.Should buy six times as many ties as he does slacks
17) Most people’s natural aversion against complex mathematical problems is an
example of:
A.Confirmation bias
B.A mental heuristic
C.Rational choice
D.Cognitive bias
18)
Refer to the diagram. If price falls from $10 to $2, total revenue:
A.rises from A + B to A + B + D + C and demand is elastic.
B.falls from A + D to B + C and demand is inelastic.
C.rises from C + D to B + A and demand is elastic.
D.falls from A + B to B + C and demand is inelastic.

19) Mia wants to buy a book. The economic perspective suggests that Mia will buy the
book if:
A.She has enough money to pay for the marginal cost of the book
B.The marginal benefit of the book is a positive value
C.The marginal cost of the book is greater than its marginal benefit
D.The marginal benefit of the book is greater than its marginal cost
20) A consumer makes purchases of an existing product X such that the marginal utility
is 10 and the price is $5. The consumer also tries a new product Y and at the current
level of consumption it has a marginal utility of 8 and a price of $1. The
utility-maximizing rule suggests that this consumer should:
A.Increase consumption of product X and decrease consumption of product Y
B.Increase consumption of product X and increase consumption of product Y
C.Increase consumption of product Y and decrease consumption of product X
D.Decrease consumption of product Y and decrease consumption of product X
21) The following graph shows a total revenue curve for a monopolist.
Refer to the above graph. The firm’s marginal revenue curve must be:
A.Downsloping
B.Constant
C.Upsloping
D.U-shaped
22) The average tax rate is:
A.change in taxes/change in taxable income.
B.total taxes/total taxable income.
C.the sum of the marginal tax rate and the rate of transfer payments.
D.the tax on incremental income less the tax on total income.
23) A plot of the Environment Performance Index (EPI) scores for nations on the
vertical axis and corresponding GDP per person on the horizontal axis shows that as:
A.GDP rises, EPI score falls
B.GDP rises, EPI score rises
C.GDP falls, EPI score rises
D.GDP falls, EPI score stays relatively constant
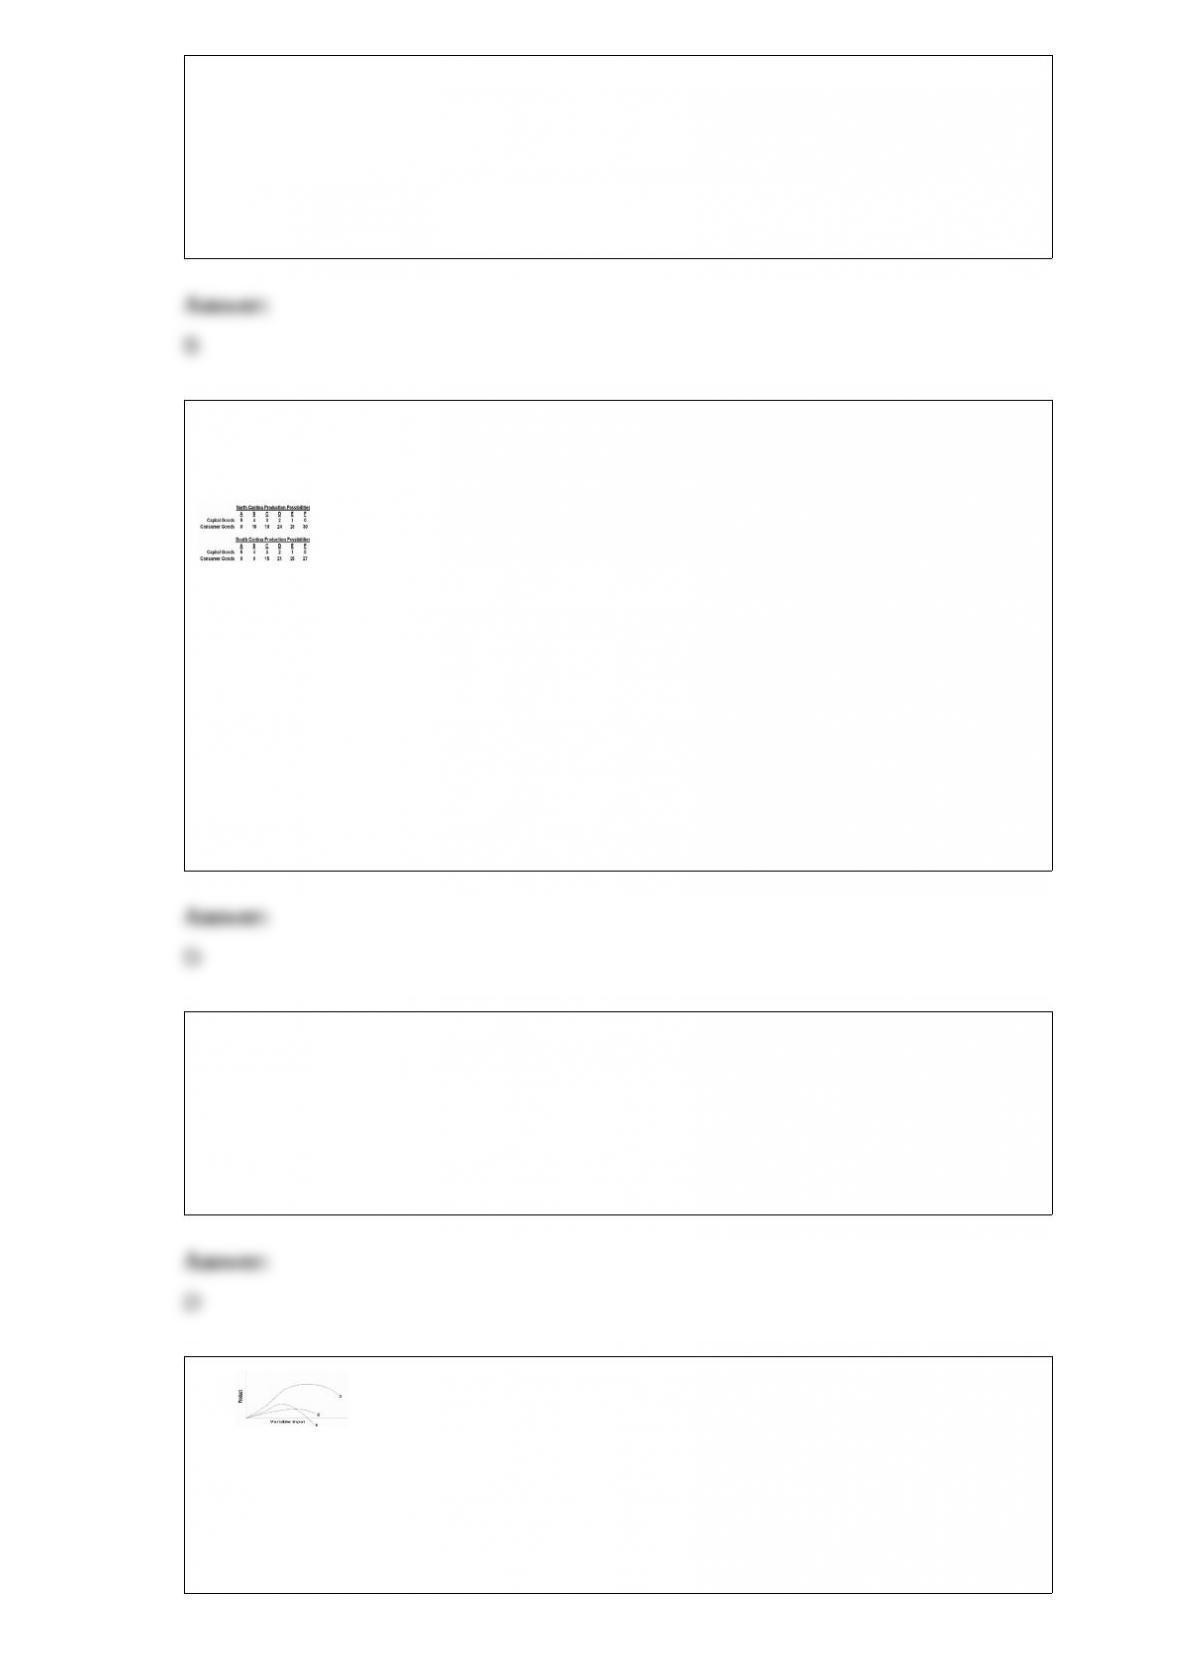
24) Answer the question on the basis of the following production possibilities tables for
two countries, North Cantina and South Cantina:
Refer to the tables. Suppose that resources in North Cantina and South Cantina are
identical in quantity and quality. We can conclude that:
A.South Cantina has better technology than North Cantina in producing both capital
and consumer goods.
B.North Cantina has better technology than South Cantina in producing both capital and
consumer goods.
C.North Cantina is growing more rapidly than South Cantina.
D.North Cantina has better technology than South Cantina in producing consumer
goods but not capital goods.
25) In 2011, about ____ percent of employed wage and salary workers belonged to
unions.
A.8.4
B.5.5
C.14.8
D.11.8
26)
In the diagram, curves 1, 2, and 3 represent the:
A.average, marginal, and total product curves respectively.
B.marginal, average, and total product curves respectively.
C.total, average, and marginal product curves respectively.
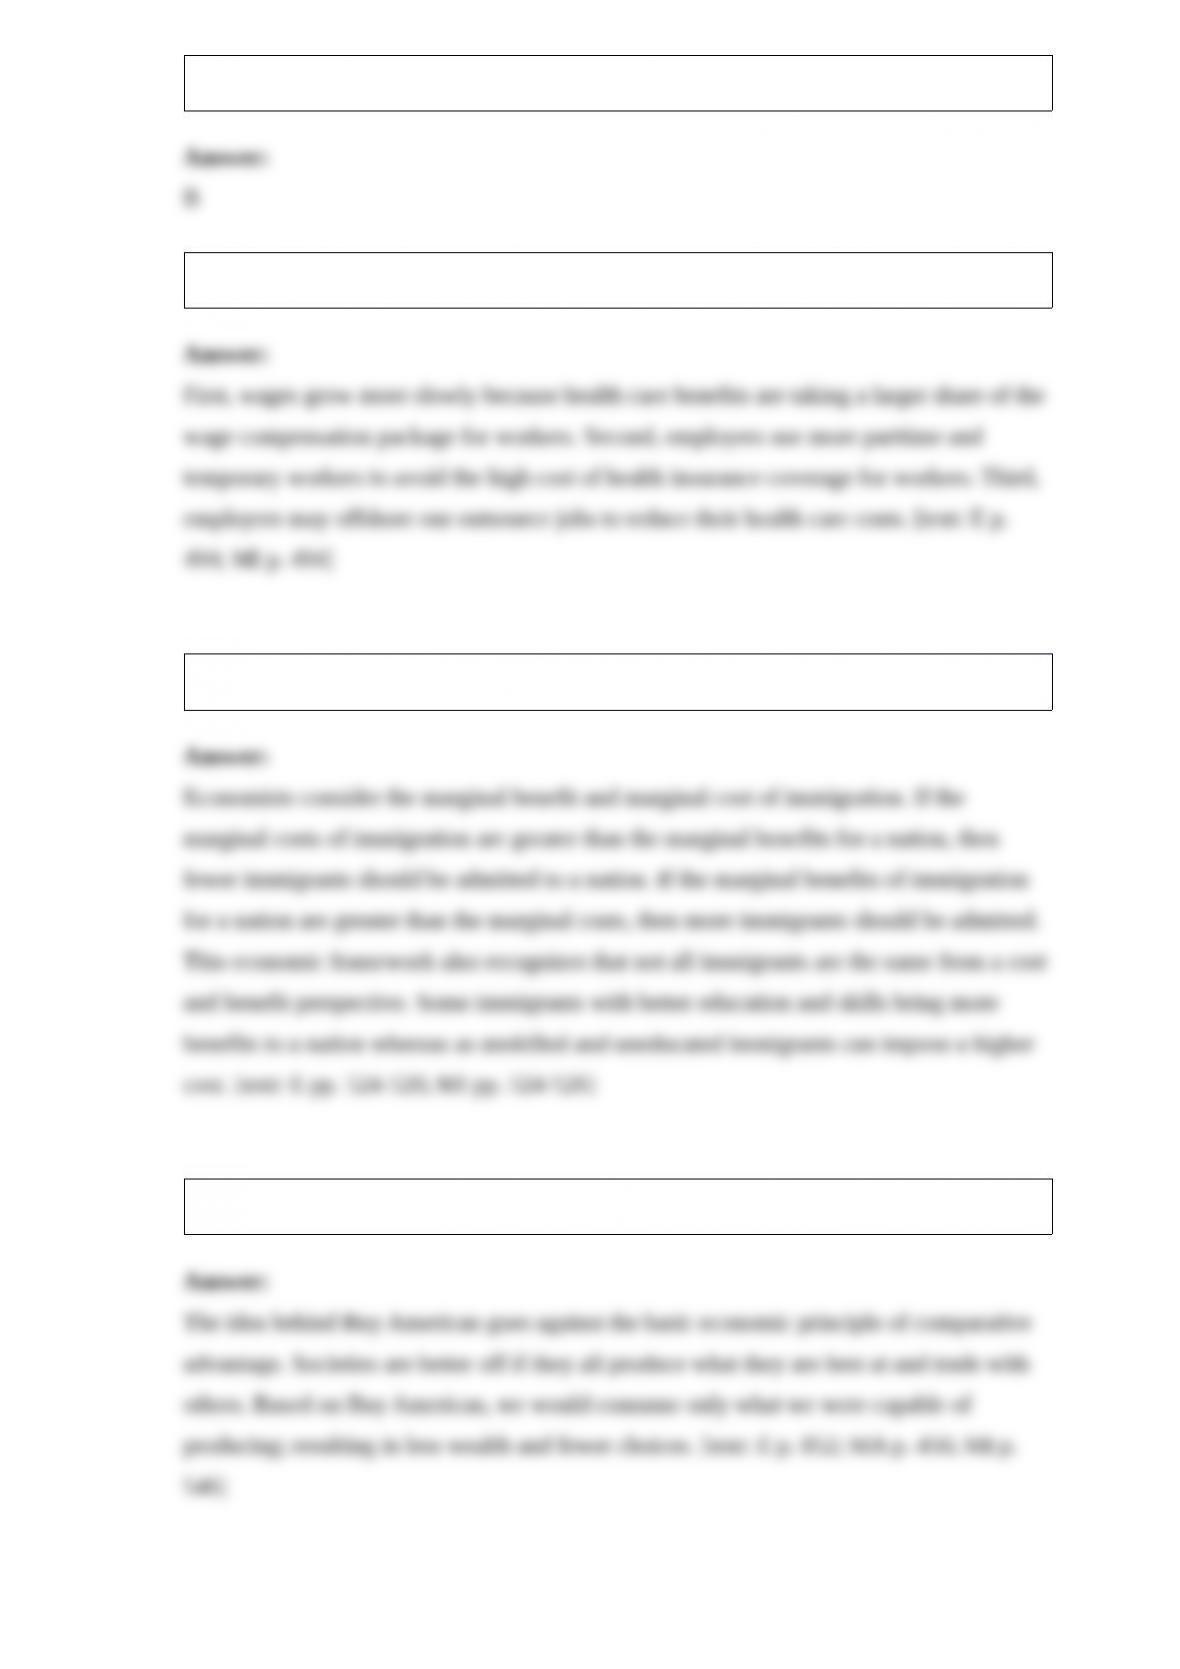
D.total, marginal, and average product curves respectively.
27) What are three effects on labor markets of rising health care costs?
28) What economic framework can inform the debate on immigration?
29) Explain how the Buy American theme hurts Americans.
30) Define negative externality and give an example.
31) Suppose a consumer has a daily income of $48 and purchases just two goods, A and
B. The price of A is $8 and the price of B is $6. In the graph below, draw the budget line
for the consumer. Indicate the area of the below graph that is attainable given the
income and the area that is unattainable.
32) Compare and contrast the suitability of different market structure for fostering
technological advance.
33) How have firms and organizations devised ways to overcome information problems
without government intervention? Give three examples.
34) Use economic analysis to explain why tenants in New York City who are covered
by rent-controlled laws do not want to move.
35) Good Grapes is selling grapes in a purely competitive market. Its output is 5000
pounds, which it sells for $5 a pound. At the 5000-pound level of output, the average
variable cost is $4.00, the marginal cost is $4.25, and the average total cost is $4.50 a
pound. Should the firm increase output, decrease output, or not produce? Why? How
should the firm determine the optimal level of output?

36) How have antitrust laws been applied to monopoly since the 1980s?