

A study of interior designers’ opinions with respect to the most desirable primary color
for executive offices showed that:
What is the probability that a designer does not prefer red?
A. 1.00
B. 0.77
C. 0.73
D. 0.23
When testing for differences between treatment means, the t statistic is based on
____________.
A. The treatment degrees of freedom
B. The total degrees of freedom
C. The error degrees of freedom
D. The ratio of treatment and error degrees of freedom

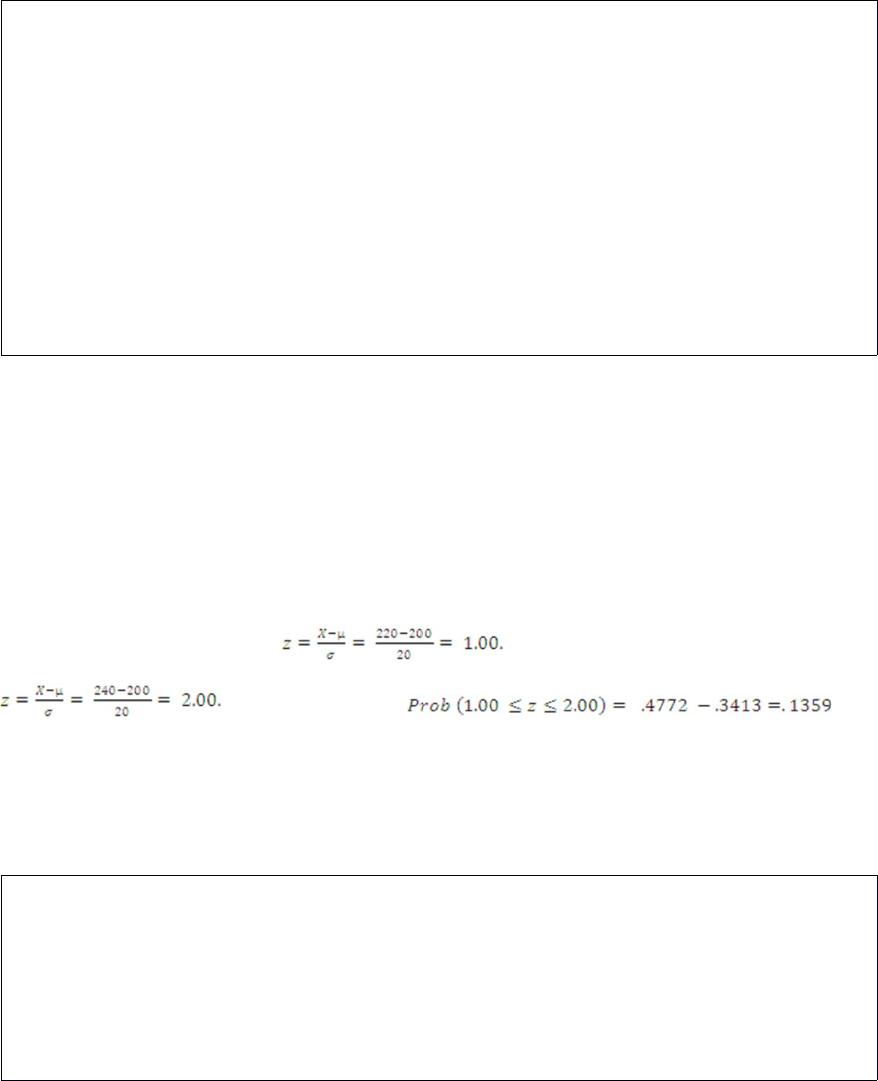
A frequency distribution has a mean of 200 and a standard deviation of 20. The class
limits for one class are 220 up to 240. Based on the normal distribution, what is the
probability that an observation would be in this class?
A. 0.1359
B. 0.3413
C. 0.4772
D. 0.8185
An experiment to determine the most effective way to teach safety principles applied
four different teaching methods. Some employees were given programmed instruction
booklets and worked through the course at their own pace. Other employees attended
lectures. A third group watched a television presentation, and a fourth group was
divided into small discussion groups. A high of 10 was possible. A sample of five tests
was selected from each group. The test grade results were:
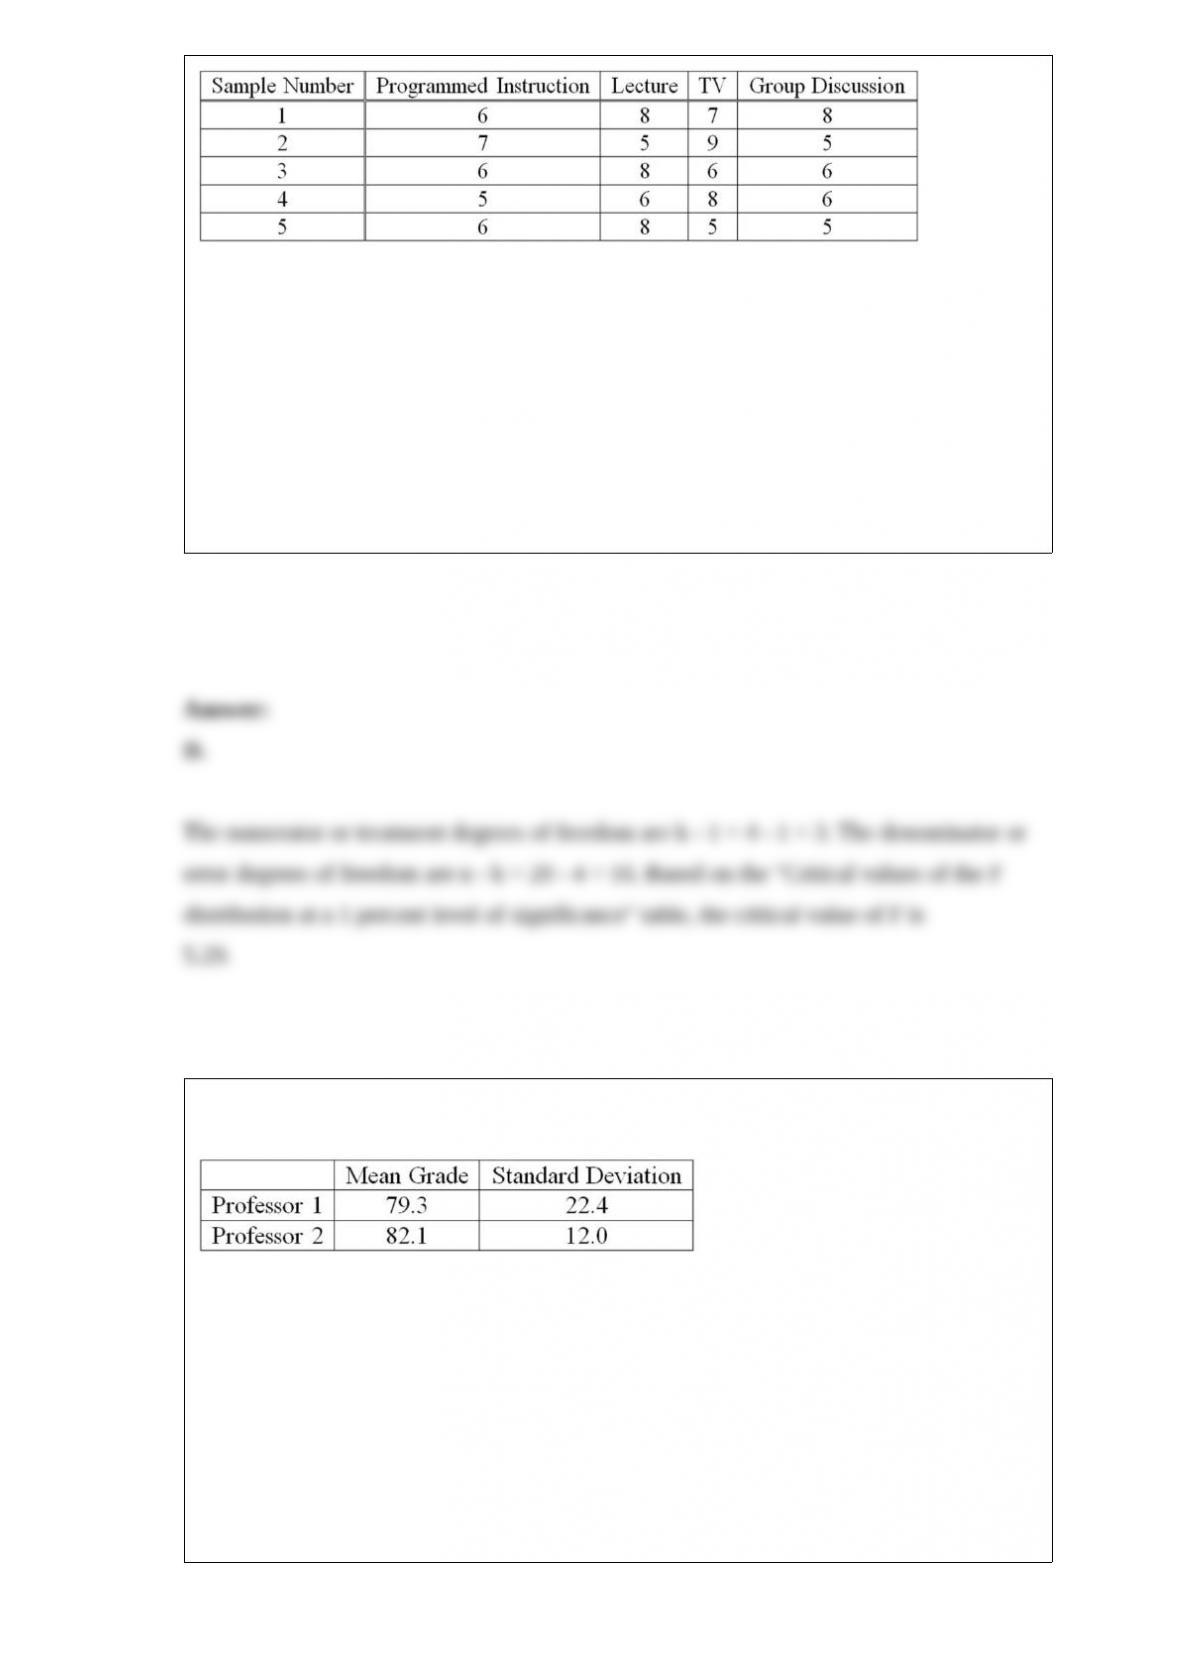
At the 0.01 level, what is the critical value?
A. 1.00
B. 1.96
C. 3.24
D. 5.29
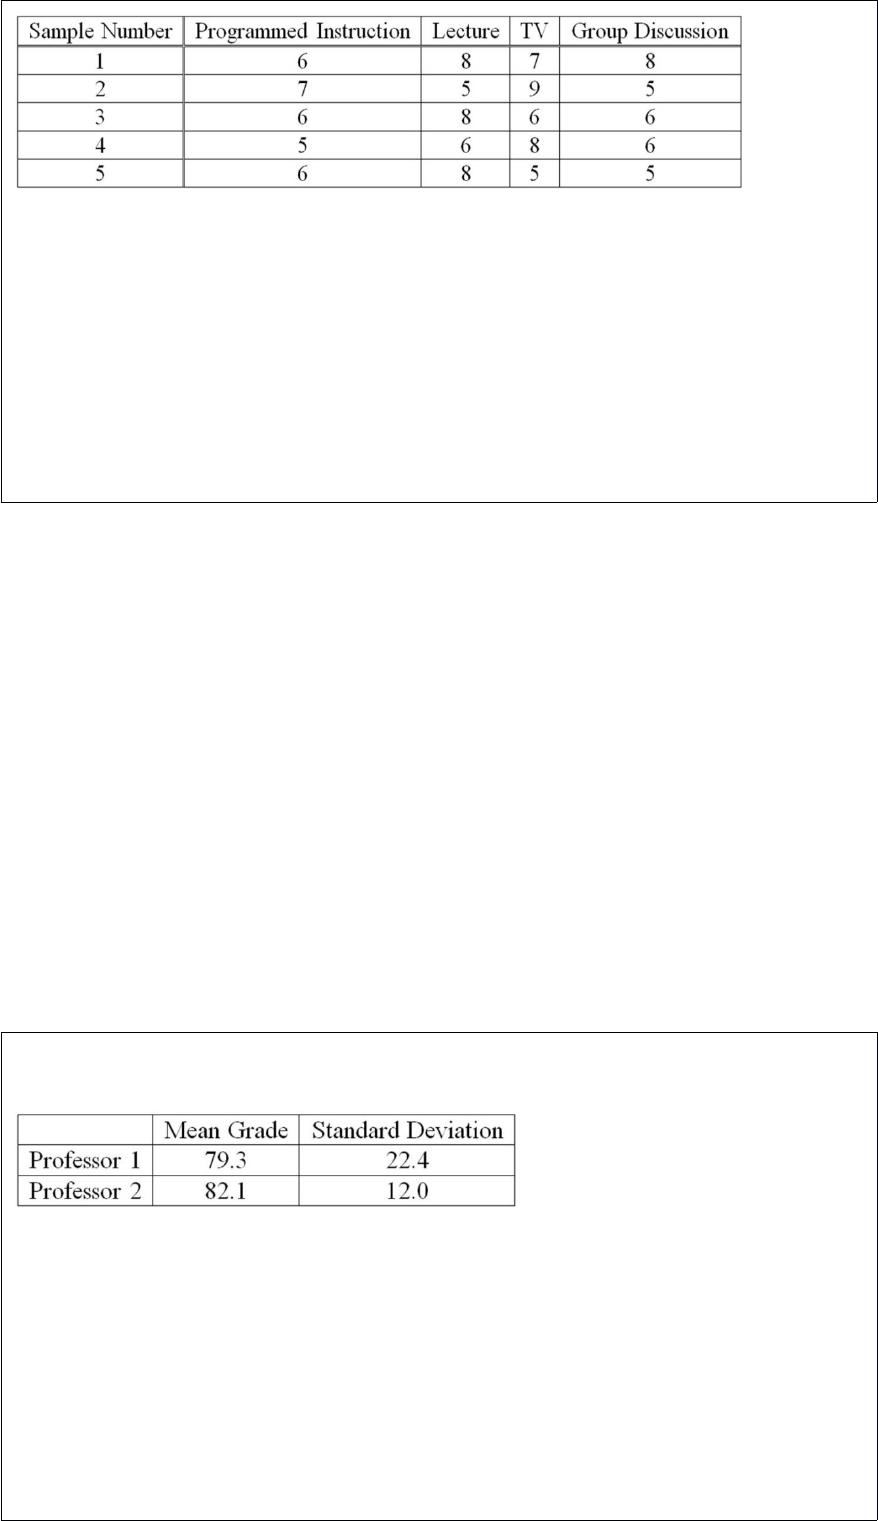
Two accounting professors decided to compare the variance of their grading procedures.
To accomplish this, they each graded the same 10 exams, with the following results:
What is the critical value of F at the 0.01 level of significance?
A. 5.85
B. 5.35
C. 6.51
D. 4.03
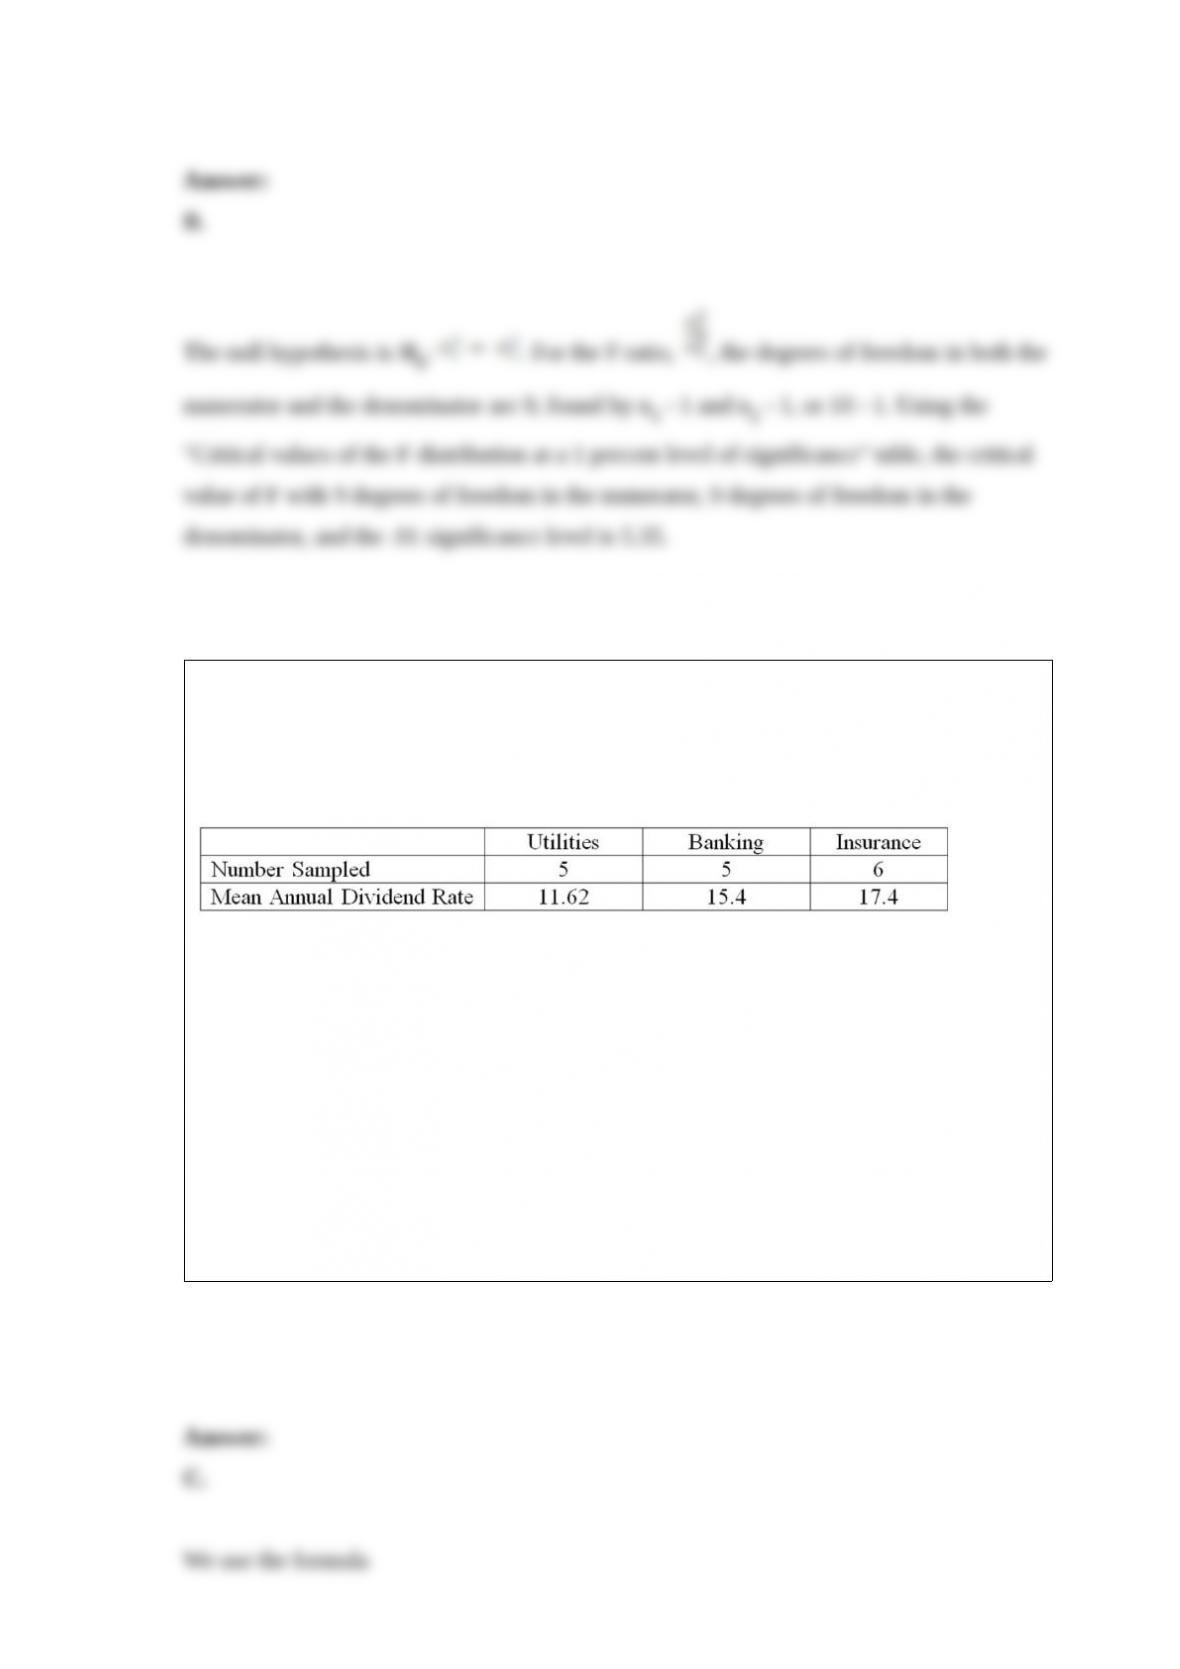
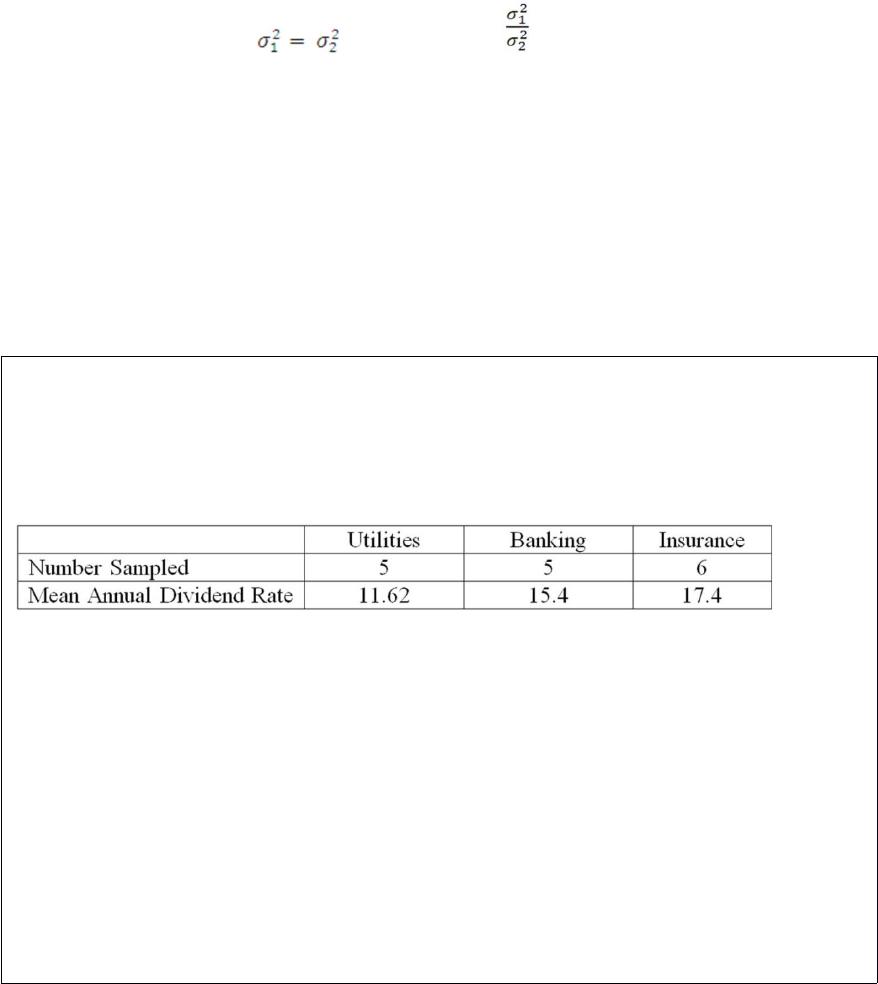
The annual dividend rates for a random sample of 16 companies in three different
industries, utilities, banking, and insurance were recorded. The ANOVA comparing the
mean annual dividend rate among three industries rejected the null hypothesis that the
dividend rates were equal. The Mean Square Error (MSE) was 3.36. The following
table summarized the results:
When comparing the mean annual dividend rate for companies in the utilities and
insurance industries, the following 95% confidence interval can be constructed:
_________________.
A. 5.78 2.160 * 2.40
B. 5.78 2.120 * 2.40
C. 5.78 2.160 * 1.11
D. 5.78 2.120 * 1.11


A researcher is studying the relationship between 10 different variables and a critical
measure of business performance. What method can be used to select the best set of
variables to predict performance?
A. Stepwise regression
B. ANOVA
C. Simple linear regression
D. Residual analysis
The numbers 0 through 9 are used in code groups of four to identify an item of clothing.
Code 1083 might identify a blue blouse, size medium. The code group 2031 might
identify a pair of pants, size 18, and so on. Repetitions of numbers are not permittedin
other words, the same number cannot be used more than once in a total sequence. As
examples, 2256, 2562, or 5559 would not be permitted. How many different code
groups can be designed?
A. 5,040
B. 620
C. 10,200
D. 120
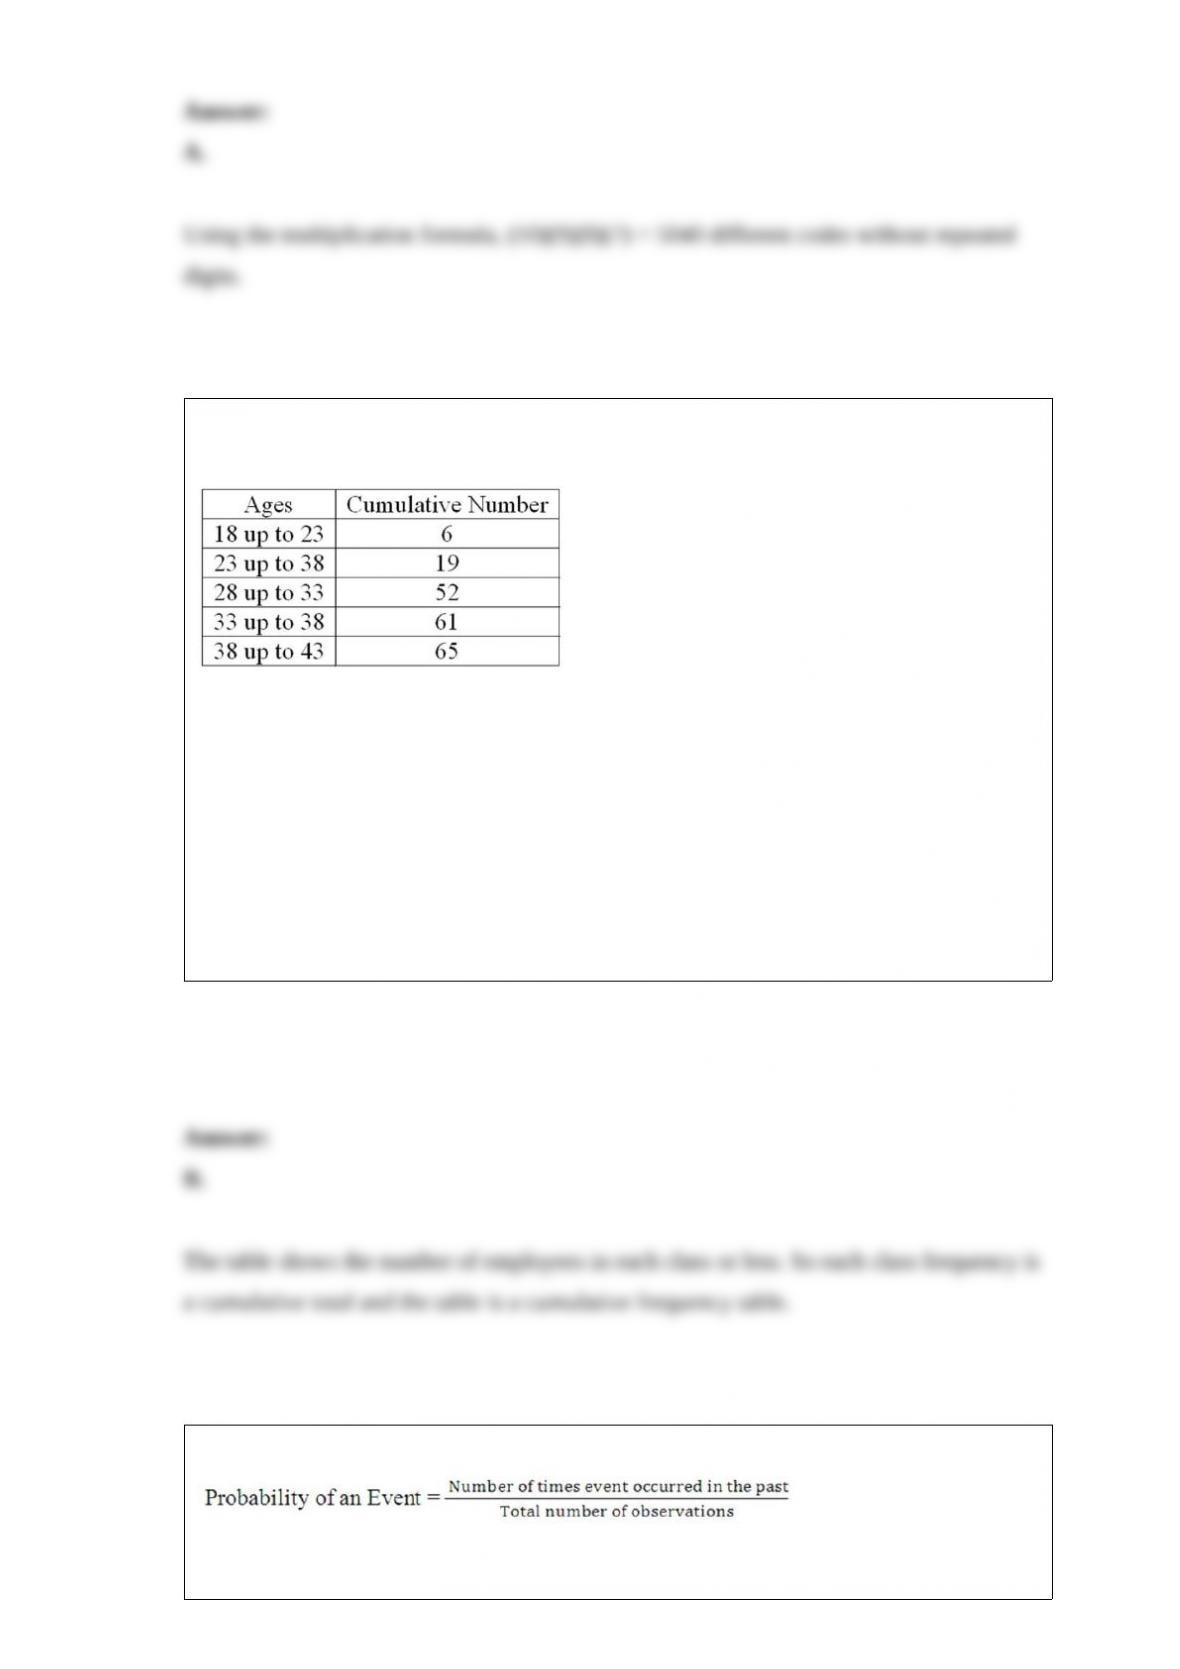
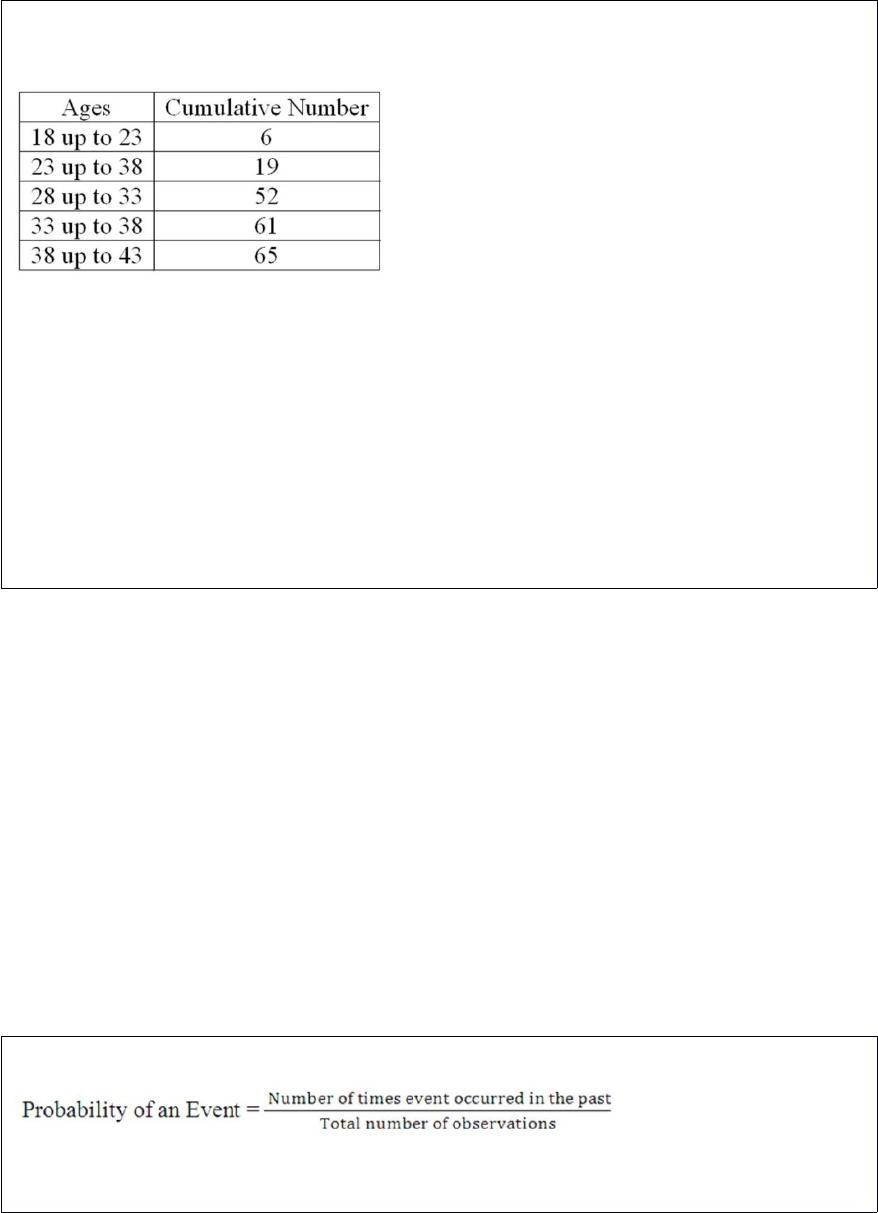
The number of employees less than the upper limit of each class at Lloyd’s Fast Food
Emporium is shown in the following table:
What is it called?
A. A histogram
B. A cumulative frequency table
C. A pie chart
D. A frequency polygon
Which approach to probability is exemplified by the following formula?
A. Classical approach


B. Empirical approach
C. Subjective approach
D. None Apply
According to Chebyshev’s Theorem, at least what percent of the observations lie within
plus and minus 1.75 standard deviations of the mean?
A. 56%
B. 95%
C. 67%
D. 100%
A researcher is studying the effect of 10 different variables on a critical measure of
business performance. In selecting the best set of independent variables to predict the
dependent variable, the stepwise regression technique is used. How are variables
selected for inclusion in the model?


A. Highest increase in the multiple R2
B. Largest p-value
C. Smallest p-value
D. Smallest regression coefficient
What are the critical values for a two-tailed test with a 0.01 level of significance when n
is large and the population standard deviation is known?
A. Above 1.960 and below -1.960
B. Above 1.645 and below -1.645
C. Above 2.576 and below -2.576
D. Above 1.000 and below -1.000
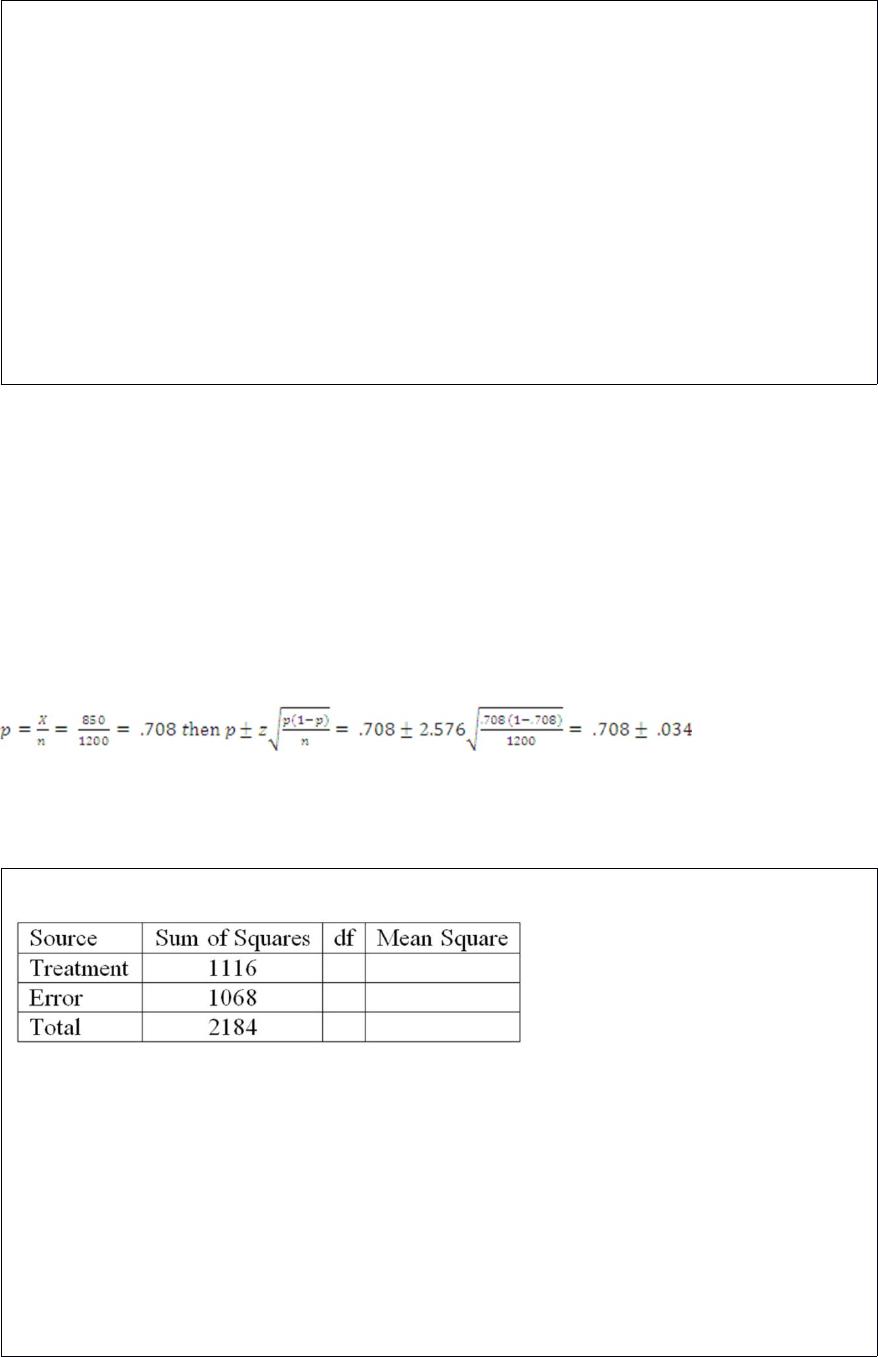
A survey of households in a small town showed that in 850 of 1,200 sampled
households, at least one member attended a town meeting during the year. Using the
99% level of confidence, what is the confidence interval for the proportion of
households represented at a town meeting?
A. [0.674, 0.742]
B. [0.655, 0.705]
C. [0.665, 0.694]
D. [0.679, 0.680]
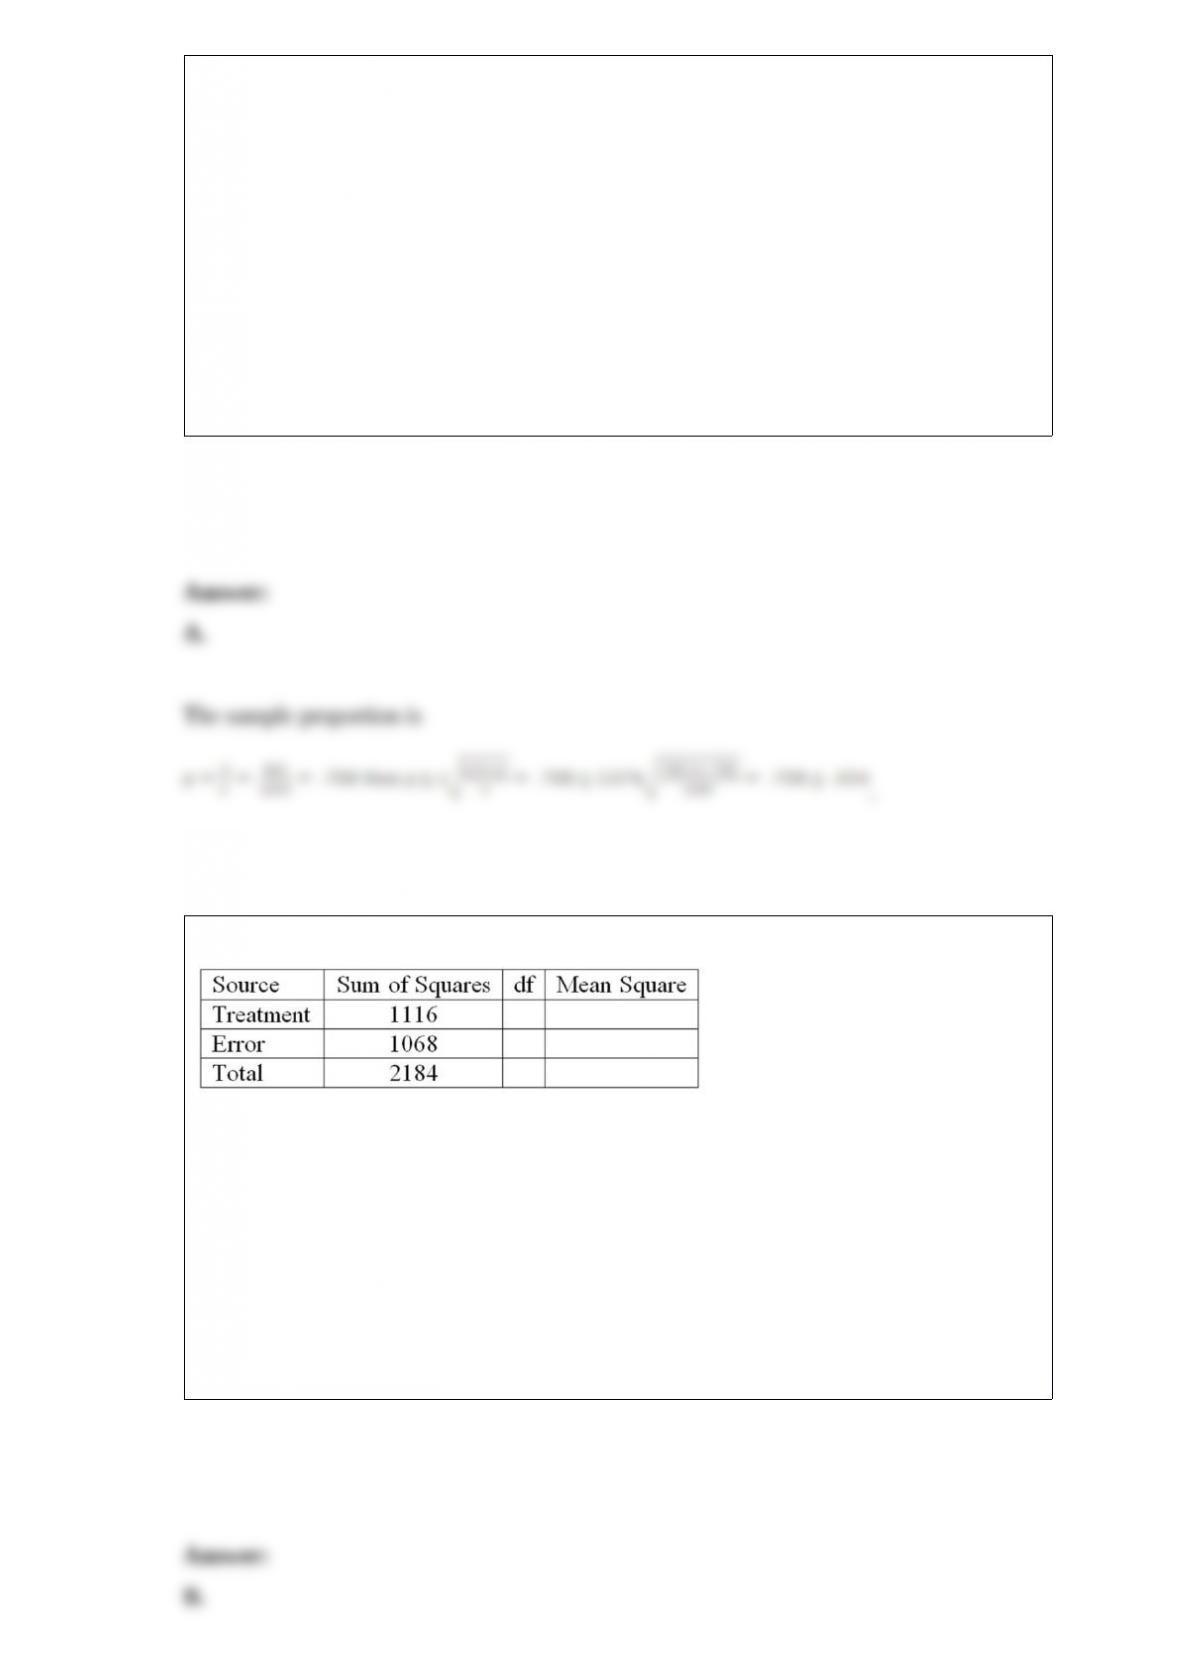
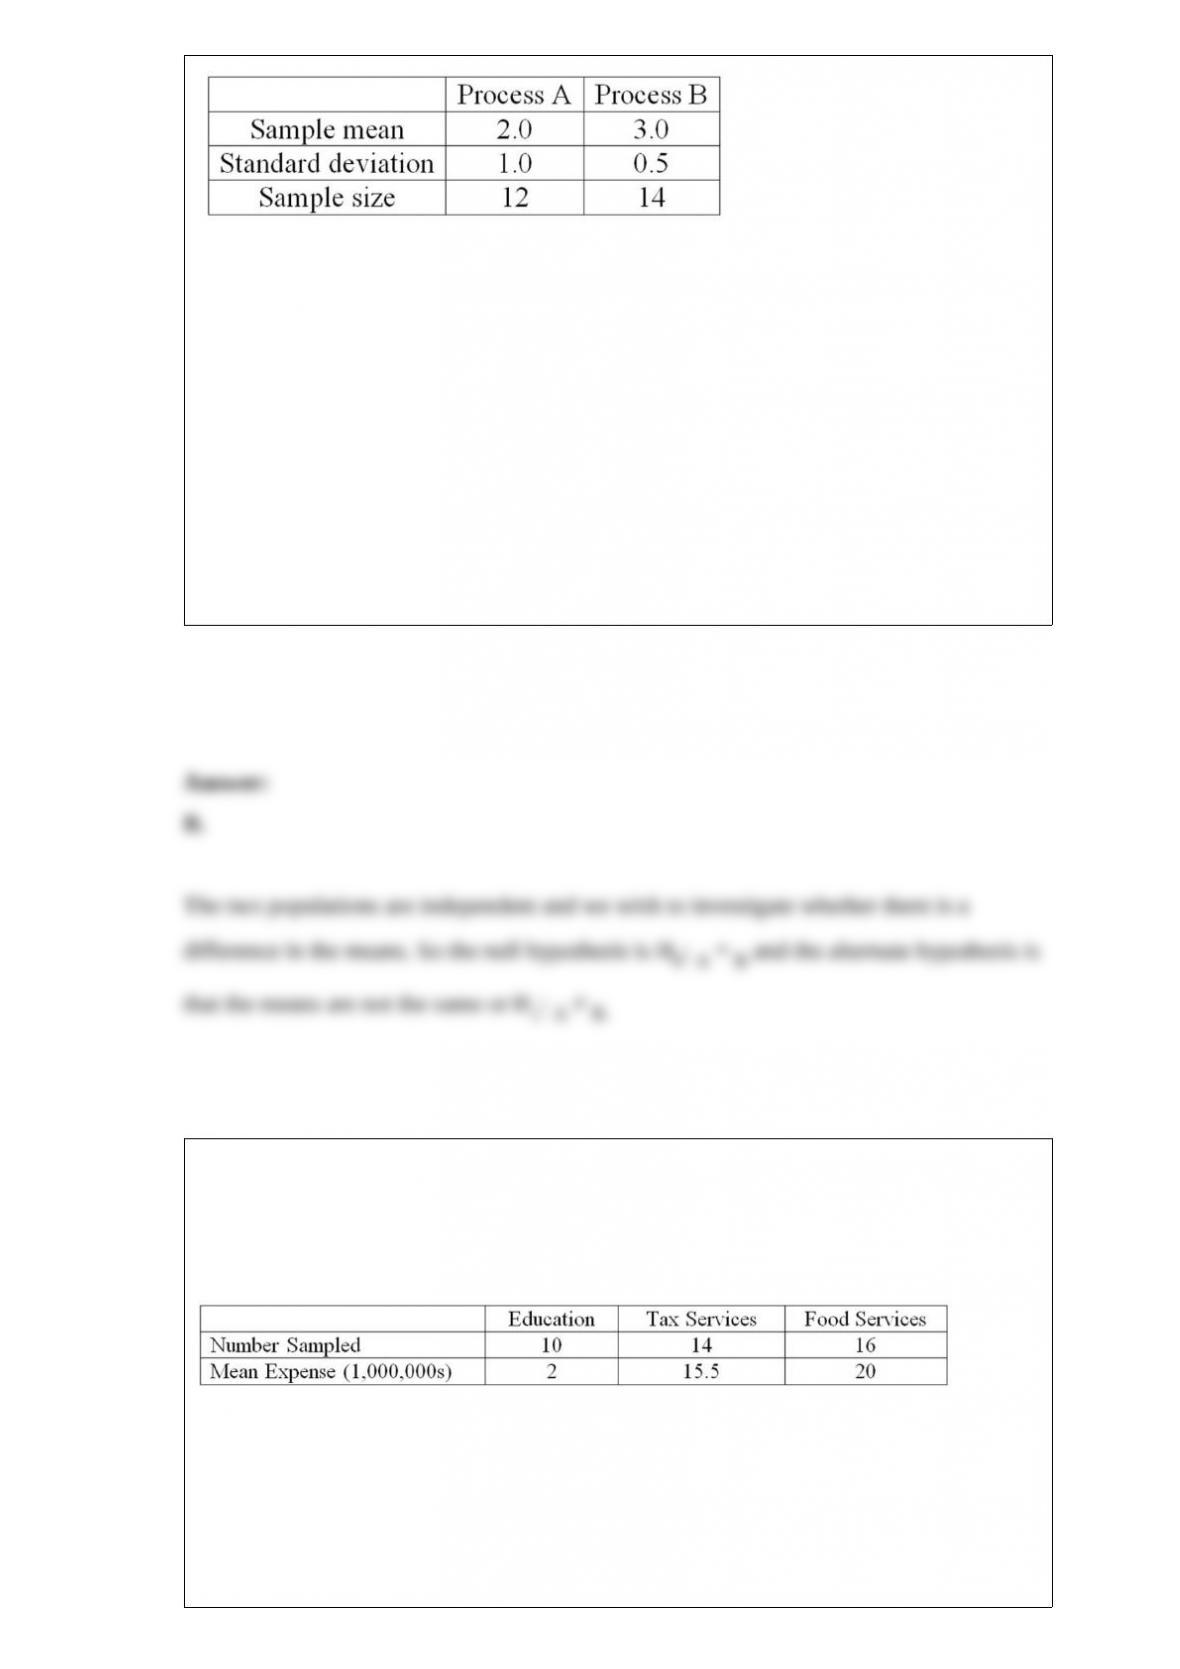
Given the following ANOVA table for three treatments each with six observations:
What is the critical value of F at the 5% level of significance?
A. 3.29
B. 3.68
C. 3.59
D. 3.20


A group of statistics students decided to conduct a survey at their university to find the
average (mean) amount of time students spent studying per week. Assuming a
population standard deviation of six hours, what is the required sample size if the error
should be less than a half hour with a 95% level of confidence?
A. 554
B. 130
C. 35
D. 393
A national manufacturer of ball bearings is experimenting with two different processes
for producing precision ball bearings. It is important that the diameters be as close as
possible to an industry standard. The output from each process is sampled and the
average error from the industry standard is measured in millimeters. The results are
presented next.
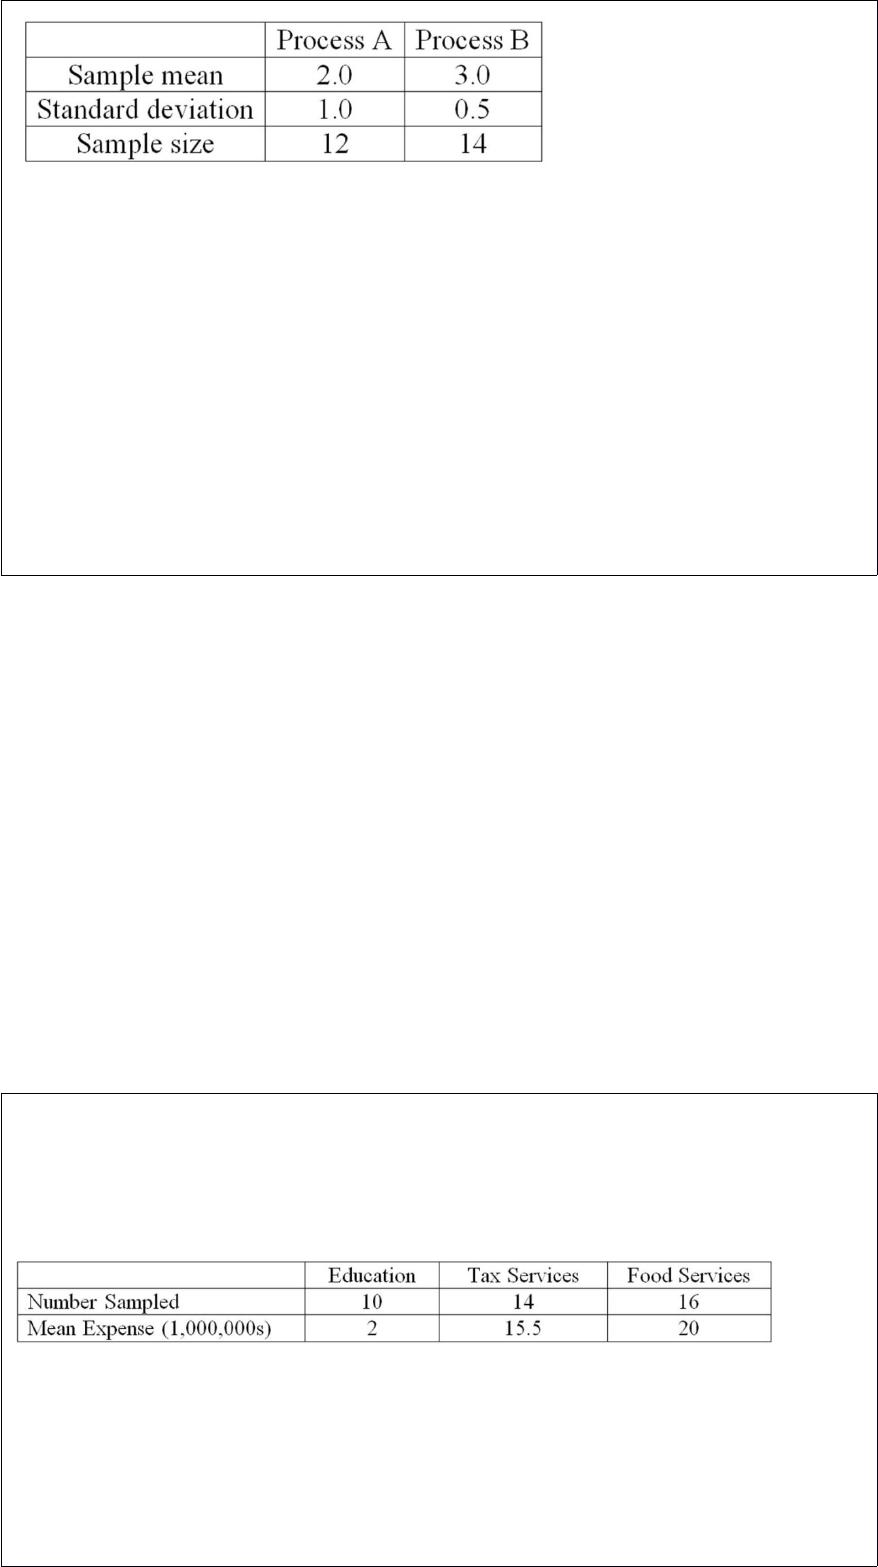
The researcher is interested in determining whether there is evidence that the two
processes yield different average errors. The population standard deviations are
unknown but assumed equal. What is the alternate hypothesis?
A. H1: A = B
B. H1: A ≠ B
C. H1: A ≤ B
D. H1: A > B
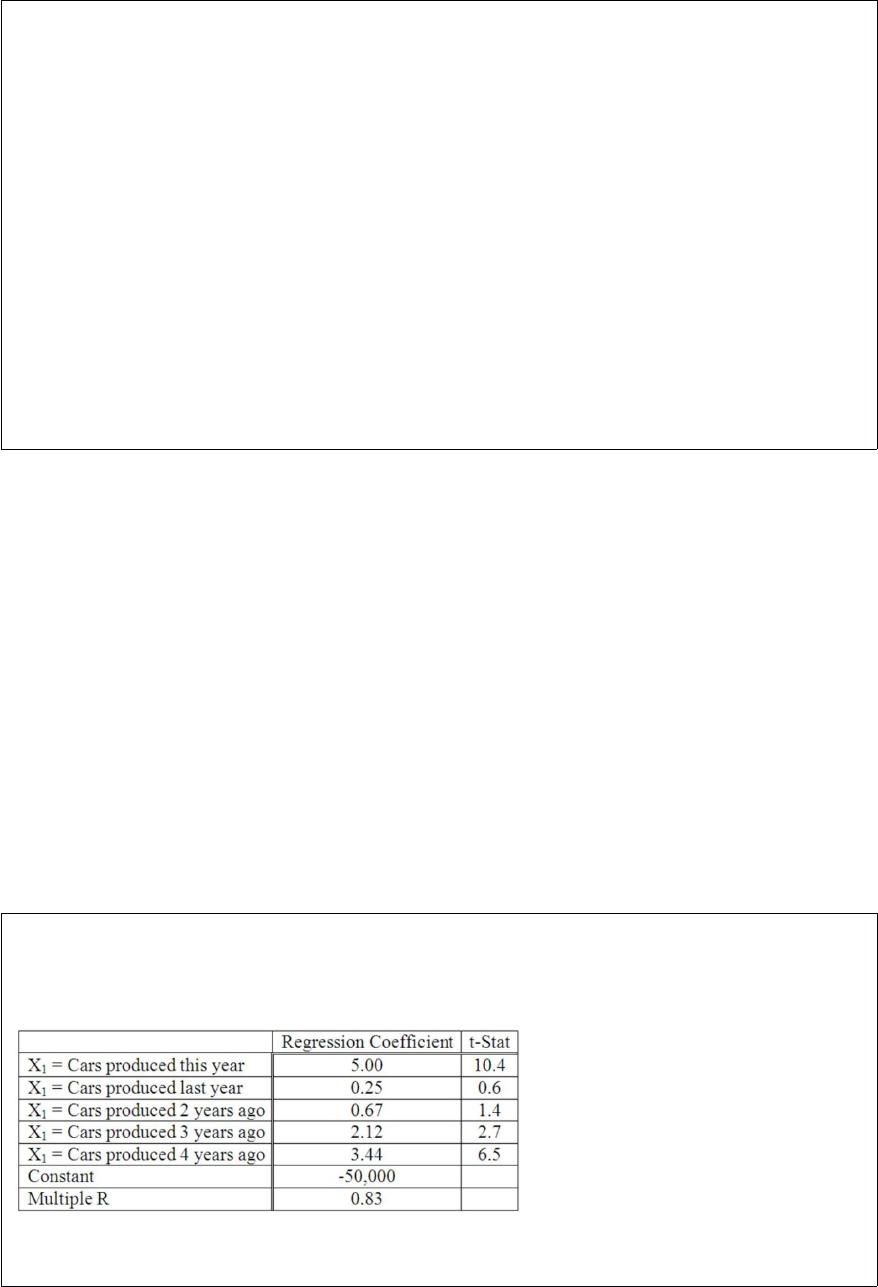
A random sample of 40 companies with assets over $10 million was surveyed and
asked to indicate their industry and annual computer technology expense. The ANOVA
comparing the average computer technology expense among three industries rejected
the null hypothesis. The Mean Square Error (MSE) was 195. The following table
summarized the results:
Based on the comparison between the mean annual computer technology expense for
companies in the tax service and food service industries, the 95% confidence interval
shows an interval of -5.85 to 14.85 for the difference. This result indicates that
_______________.
A. There is no significant difference between the two industry technology expenses


B. The interval contains a difference of 20.7
C. Companies in the food service industry spend significantly more than companies in
the tax service industry
D. Companies in the food service industry spend significantly less than companies in
the tax service industry
For a binomial distribution, the mean is 4.0 and n = 8. What is π for this distribution?
A. 0.5
B. 1.00
C. 4.0
D. 0.1


For a distribution of sample means constructed by sampling 5 items from a population
of 15, ___________.
A. The sample size is 15
B. There will be 3,003 possible sample means
C. The mean of the sample means will be 3
D. The standard error will be 1
Which of the following is NOT a characteristic of a binomial probability distribution?
A. Each outcome is mutually exclusive.
B. Each trial is independent.
C. The probability of success remains constant from trial to trial.
D. The number of trials is limited to two.

The mean annual incomes of certified welders are normally distributed with the mean
of $50,000 and a standard deviation of $2,000. The ship building association wishes to
find out whether their welders earn more or less than $50,000 annually. The alternate
hypothesis is that the mean is not $50,000. Which of the following is the alternate
hypothesis?
A. H1: π ≠ $50,000
B. H1: ≠ $50,000
C. H1: < $50,000
D. H1: = $50,000
The production of car tires in any given year is related to the number of cars produced
that year and in prior years. Suppose our econometric model resulted in the following
data.
Which variable in the model is the most significant predictor of tire production?


The following graph is a ___________.
A. Dot plot
B. Stem-and-leaf display
C. Box plot
D. Scatter plot
The following are the weekly amounts of welfare payments made by the federal
government to a sample of six families: $139, $136, $130, $136, $147, and $136. What
is the range?
A. $0
B. $14
C. $52
D. $17


A marketing firm is studying consumer preferences for winter fashions in four different
months. From a population of women 18-21 years of age, a random sample of 100
women was selected in January. Another random sample of 100 women was selected in
March. Another random sample of 100 women was selected in June. Another random
sample of 100 women was selected in September. What is the sample size?
A. 4
B. 100
C. 400
D. 1
A study of a company’s practice regarding the payment of invoices revealed that an
invoice was paid an average of 20 days after it was received. The standard deviation
equaled five days. Assuming that the distribution is normal, what percent of the
invoices were paid within 15 days of receipt?
A. 15.87%
B. 37.91%
C. 34.13%
D. 86.74%


The expected value of a uniform distribution is computed using the formula _________.
The probability of two or more events occurring concurrently is called a(n) _________.
A. Conditional probability
B. Empirical probability
C. Joint probability
D. Tree diagram


If the variance of the “number of daily parking tickets issued is 100, the standard
deviation is defined as the _____________.
A. “Number of daily parking tickets”
B. “Number of daily parking tickets” squared.
C. Absolute value of the variance of the “number of daily parking tickets”
D. Square root of the variance of the “number of daily parking tickets”
A random sample of 85 supervisors revealed that they worked an average of 6.5 years
before being promoted. The population standard deviation was 1.7 years. Using the 0.95
degree of confidence, what is the confidence interval for the population mean?
A. 6.99 and 7.99
B. 4.15 and 7.15
C. 6.14 and 6.86
D. 6.49 and 7.49


Which of the following statements is correct regarding the goodness-of-fit test?
A. Variables are based on the nominal measurement scale.
B. Population must be normal.
C. All the expected frequencies must be equal.
D. All the expected frequencies must be unequal.
A dot plot shows ____________.
A. The general shape of a distribution
B. The mean, median, and mode
C. The relationship between two variables
D. The interquartile range


If we are testing for the difference between two population proportions, it is assumed
that the two populations follow the ________________ distribution.
The null hypothesis for an ANOVA comparing three population means is
___________________.
The z or t value that separates the region of rejection from the region of non-rejection is
called a __________________.

To compute a confidence interval for a population proportion, a __________ statistic is
used.
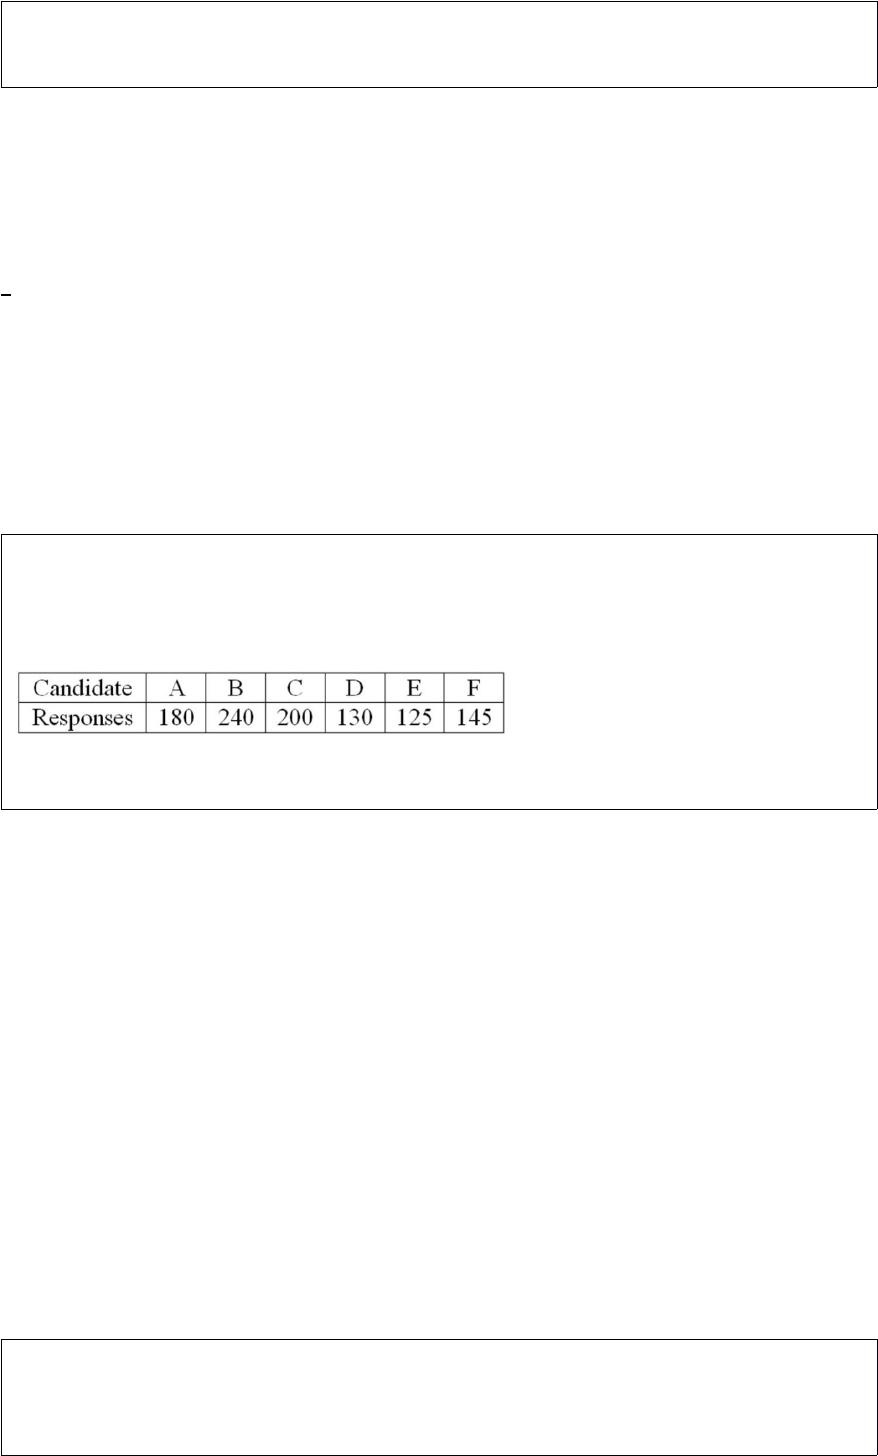
Six people have declared their intentions to run for a trustee seat in the next local
election. A political poll is conducted during the campaign among 1,020 randomly
sampled voters to determine if there is any clear preference among the voters. The
responses are shown next.
What is the expected frequency for each candidate?
A silkscreen printing company purchases t-shirts. To ensure the quality of the shipment,
300 t-shirts are randomly selected. Fifteen are defective. What is the 95% confidence
interval for the proportion defective?

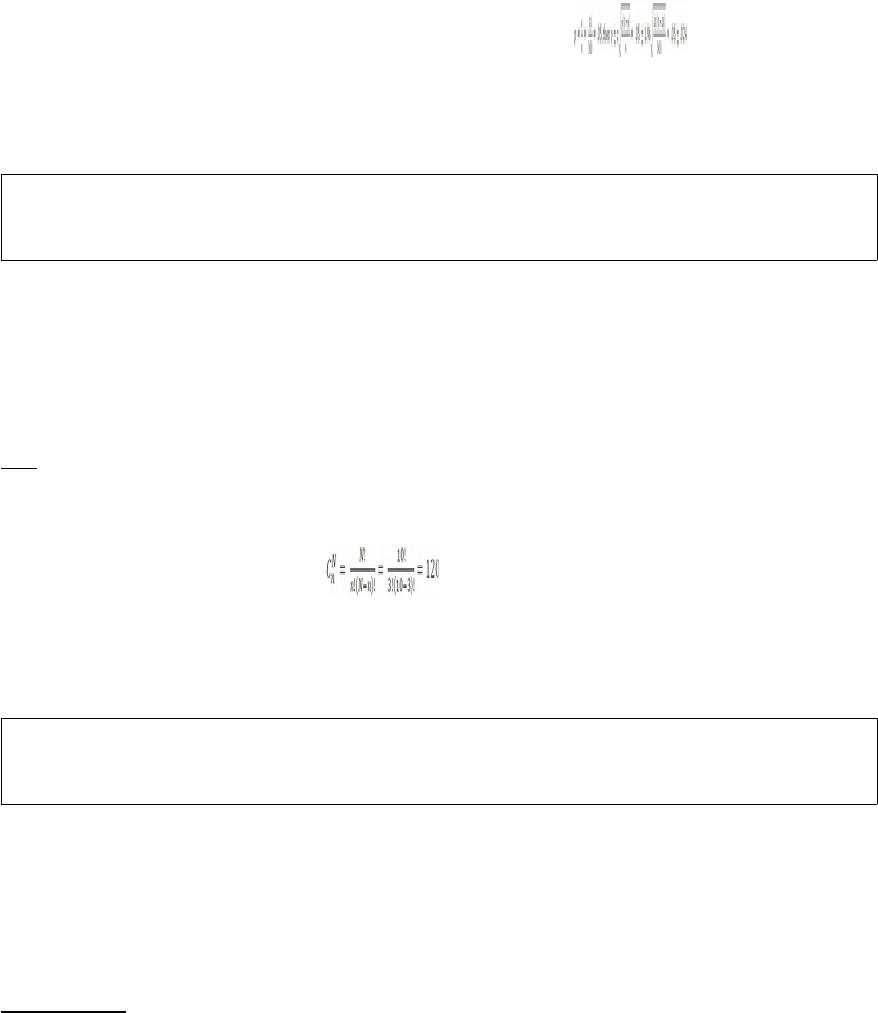
A total of _______ different samples of size 3 can be collected from a population of 10
items.
A table showing the number of observations that have been grouped into each of several
classes is called a frequency ________________.


The capacities of several metal containers are 38, 20, 37, 64, and 27 liters. What is the
range in liters?
When observing a checkout line at a food store, the average number of people served is
15 per hour. Using the Poisson distribution, what is the standard deviation of the
number of people served in an hour?
If π = 1/5 and n = 100, the standard deviation of this binomial distribution is _____.


In a study of protein breakfast bars, five bars from each of three brands were tested to
see if the mean amount of protein per bar differs among the brands. If the error sum of
squares is 0.09, the mean square error is _____.
Given the sample information in the following table regarding public opinion on gun
control, who is more likely to favor gun control?


The computed value of a chi-square statistic is always positive because the numerator is
the difference between the observed frequencies and the expected frequencies
______________.
When testing for a difference between the means of two dependent samples, n1 and n2
are ________________.