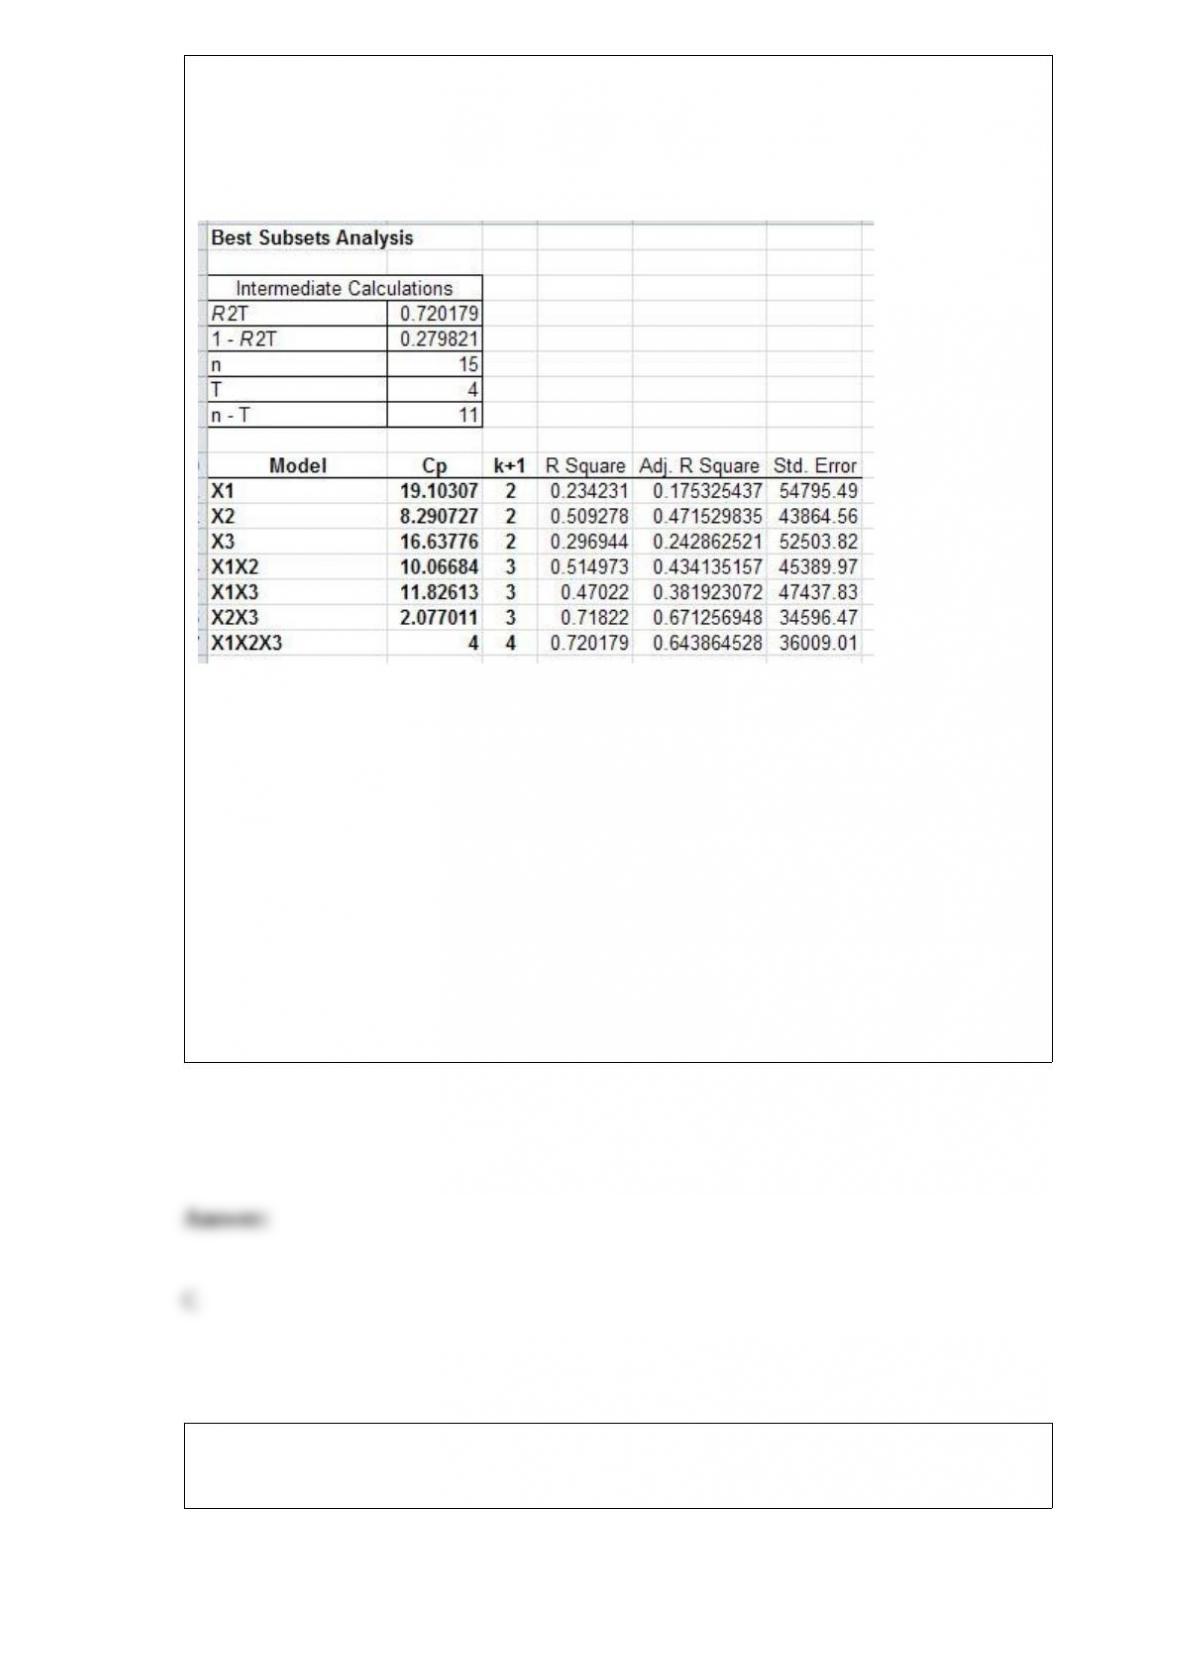
A home appraisal company would like to develop a regression model that would predict
the selling price of a house based on the age of the house in years (X1), the living area
of the house in square feet (X2) and the number of bedrooms (X3). The following table
shows the results of a best subsets regression procedure.
The set of independent variables that would be the most appropriate to predict the
selling price of a house is
____________________________________________________________.
A) the living area of the house in square feet
B) the age of the house in years and the living area of the house in square feet
C) the living area of the house in square feet and the number of bedrooms
D) the age of the house in years, the living area of the house in square feet, and the
number of bedrooms
The table below shows the number of cars sold last month by seven employees at
Concord Motors and their number of years of sales experience.

Management would like to use simple regression analysis to estimate monthly car sales
using the number of years of sales experience. Which one of the following statements
describes the results of the hypothesis test that the population slope is not equal to zero
using α = 0.05?
A) Because the absolute value of the test statistic is less than the absolute value of the
critical value, we fail to reject the null hypothesis and cannot conclude that the
population slope is not equal to zero.
B) Because the absolute value of the test statistic is less than the absolute value of the
critical value, we can reject the null hypothesis and conclude that the population slope
is equal to zero.
C) Because the absolute value of the test statistic is greater than the absolute value of
the critical value, we can reject the null hypothesis and conclude that the population
slope is not equal to zero.
D) Because the absolute value of the test statistic is greater than the absolute value of
the critical value, we fail to reject the null hypothesis and conclude that the population
slope is equal to zero.
According to the Insurance Research Council, 14% of U.S. drivers are uninsured. A
random sample of seven drivers was selected. What is the standard deviation of this
distribution?
A) 0.319
B) 0.573
C) 0.918
D) 1.457
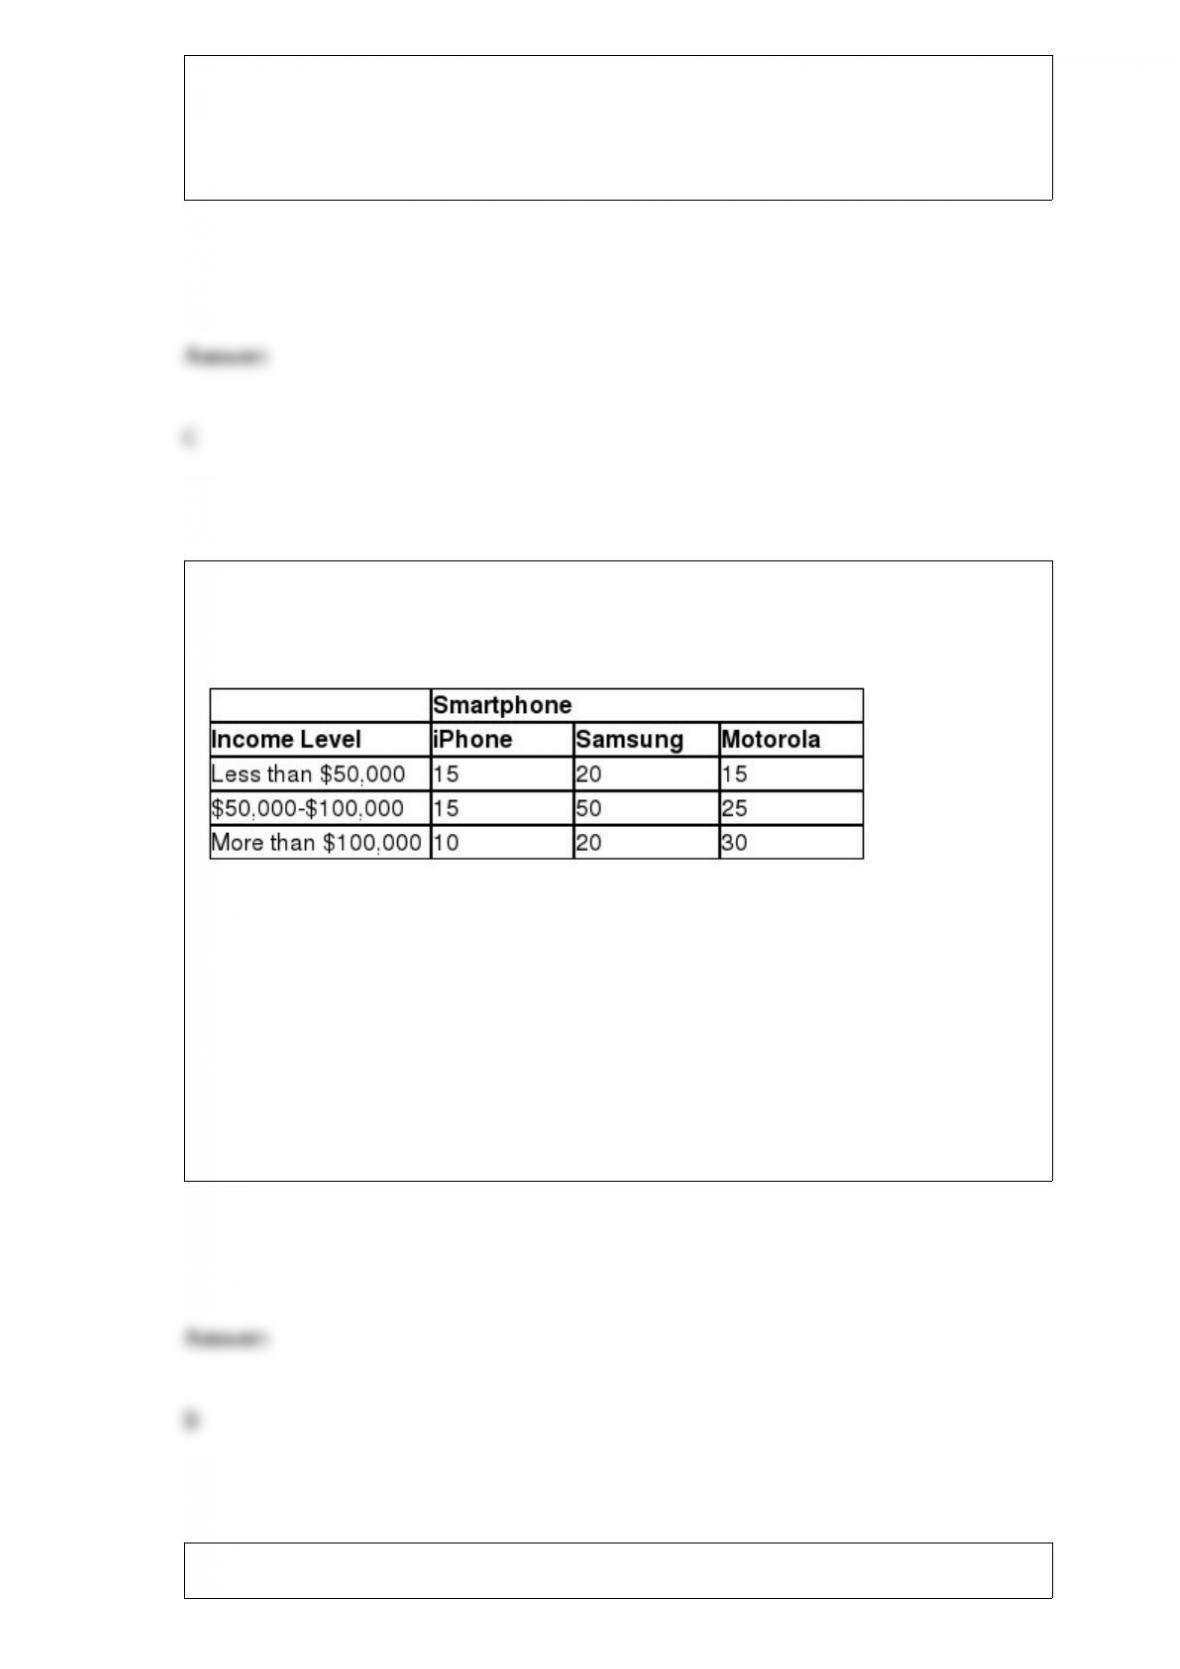
AT&T would like to investigate if brand of smartphone and income level are
independent variables. The following contingency table shows the number of customers
who own three brands of smartphones along with their income level.
The degrees of freedom for the critical value is ________.
A) 3
B) 4
C) 5
D) 6
Susan would like to conduct a survey of homeowners in the Meadowbrook

neighborhood to get their opinions on proposed road modifications in the area. She
would like to sample 50 homes using systematic sampling. There are a total of 200
homes in the Meadowbrook neighborhood. What value of k should Susan use?
A) 4
B) 10
C) 50
D) 200
A ________ describes the difference between the actual and predicted values of a
dependent variable.
A) variance
B) correlation
C) dummy variable
D) residual
Experian would like to test the hypothesis that the average credit score for an adult in
Virginia is different from the average credit score for an adult in North Carolina. A
random sample of 40 adults in Virginia had an average credit score of 699 and a random
sample of 35 adults in North Carolina had an average credit score of 682. It is believed
that the population standard deviation for credit scores is 44 and 41 for Virginia and
North Carolina residents, respectively. Experian would like to set α = 0.05. Define
Population 1 as Virginia and Population 2 as North Carolina and use the critical value
approach to test this hypothesis.
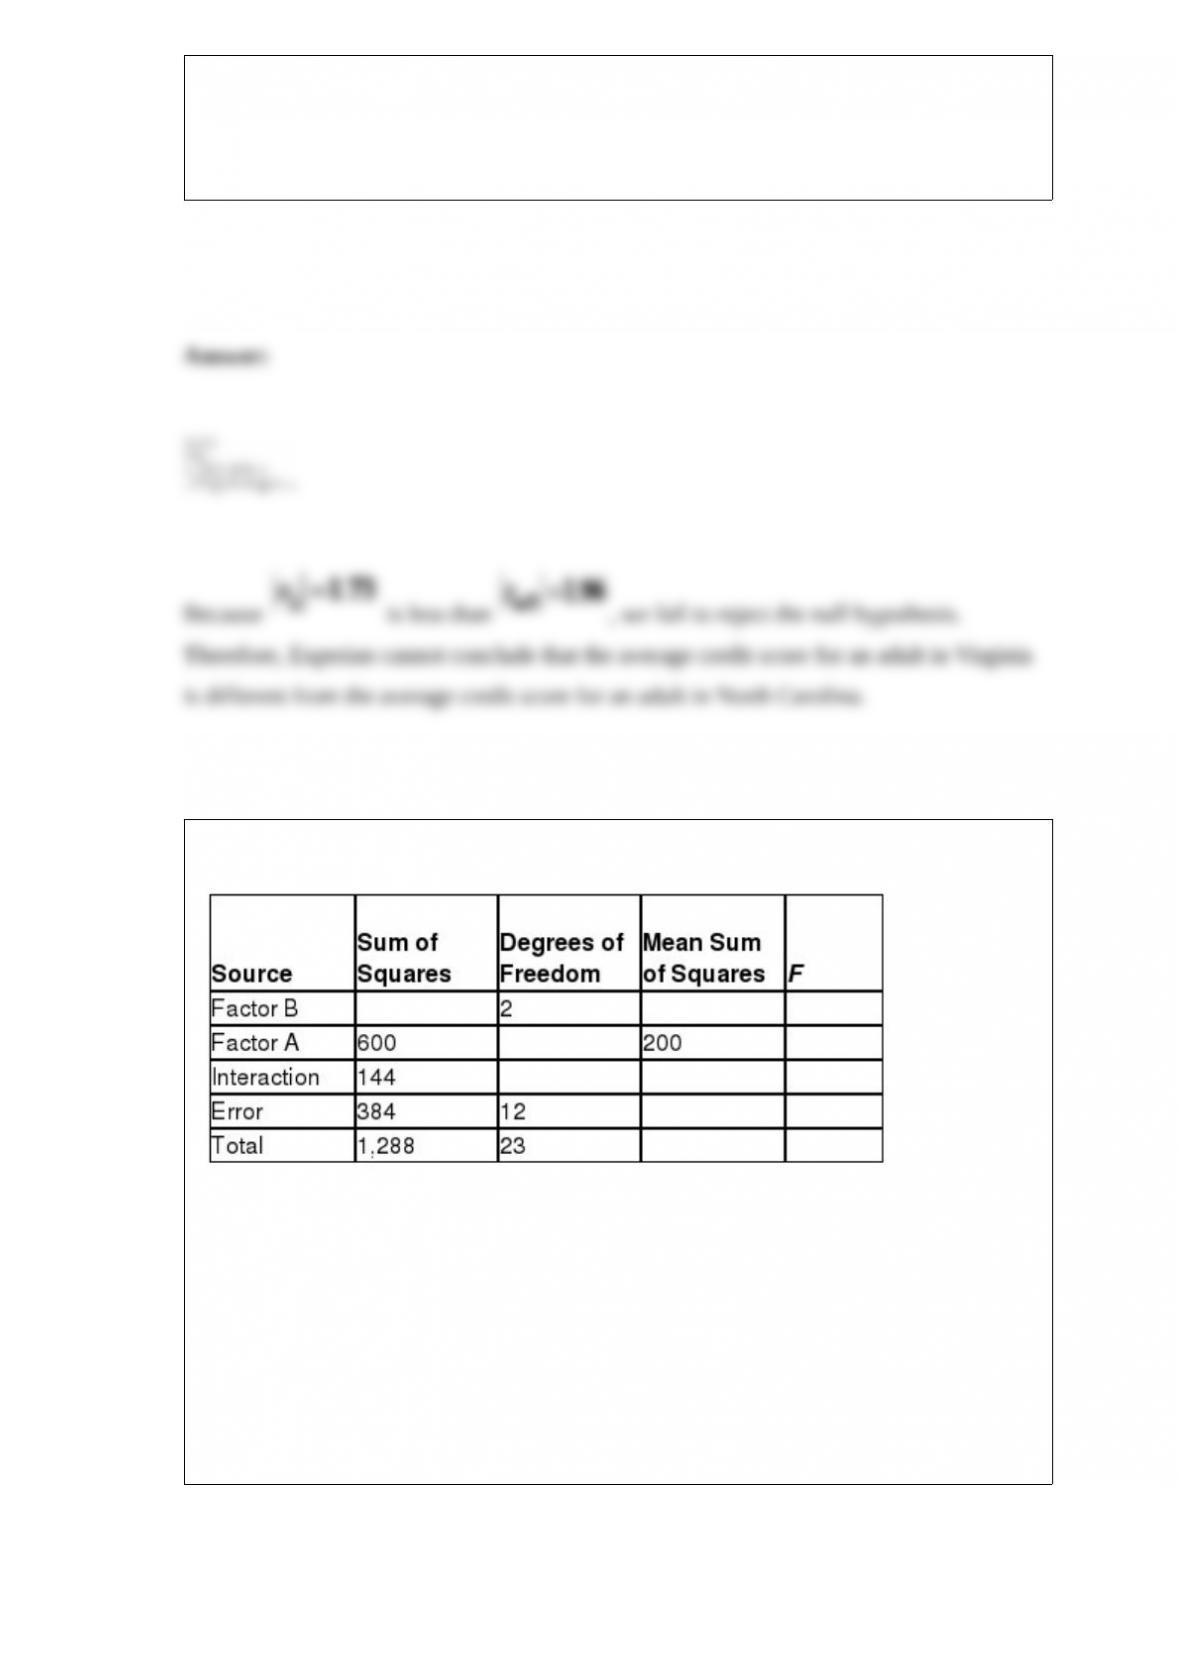
Consider the partially completed two-way ANOVA summary table.
The Factor B test statistic for this ANOVA procedure is ________.
A) 2.50
B) 3.44
C) 4.65
D) 5.97
A professor would like to test the hypothesis that the average number of minutes that a
student needs to complete a statistics exam has a standard deviation that is less than 5.0
minutes. A random sample of 15 students was selected and the sample standard
deviation for the time needed to complete the exam was found to be 4.0 minutes. The
degrees of freedom for this hypothesis test would be ________.
A) 13
B) 14
C) 15
D) 16
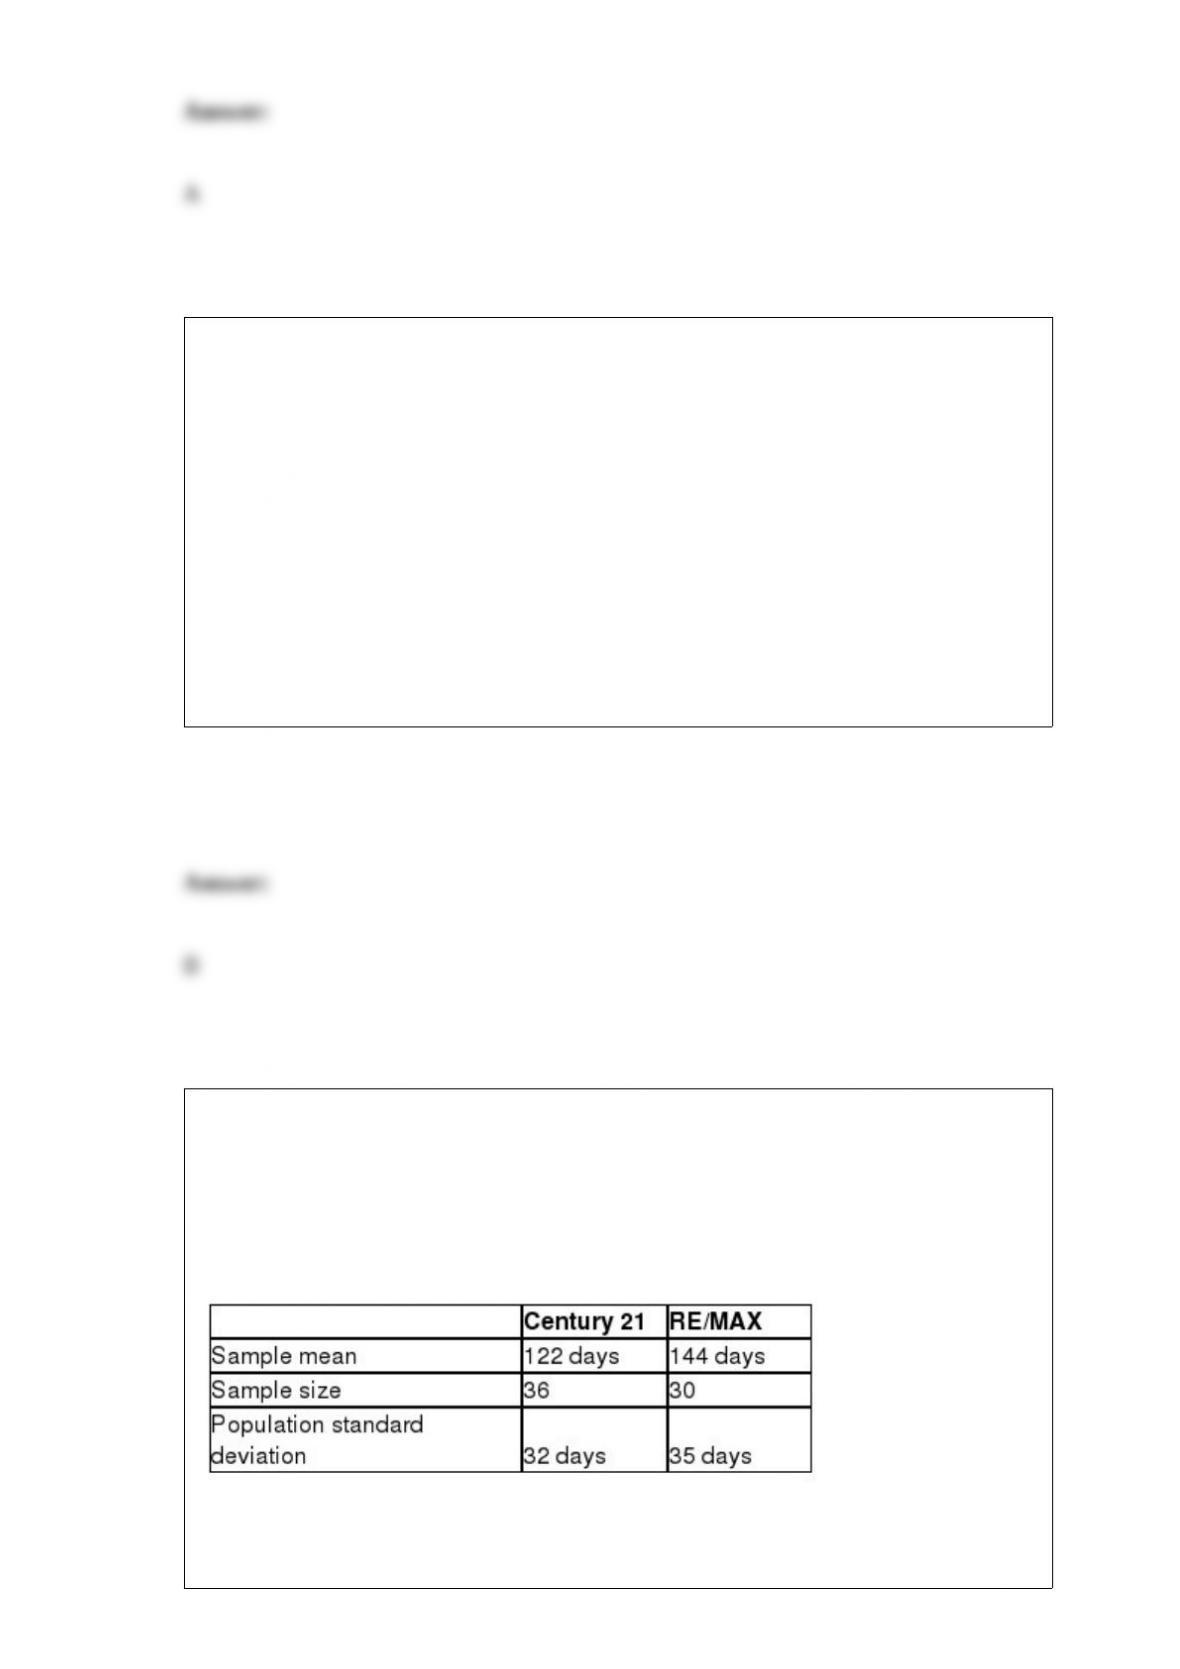
Two real estate companies, Century 21 and RE/MAX, compete with one another in a
local market. The manager of the Century 21 office would like to advertise that homes
listed with RE/MAX average more than 10 days on the market when compared to
homes listed with his company. The following data shows the sample size and average
number of days on the market for the two companies along with the population standard
deviations.
If Population 1 is defined as RE/MAX and Population 2 is defined as Century 21, the
p-value for this hypothesis test would be ________.
A) 0.0749
B) 0.0952
C) 0.1364
D) 0.1777
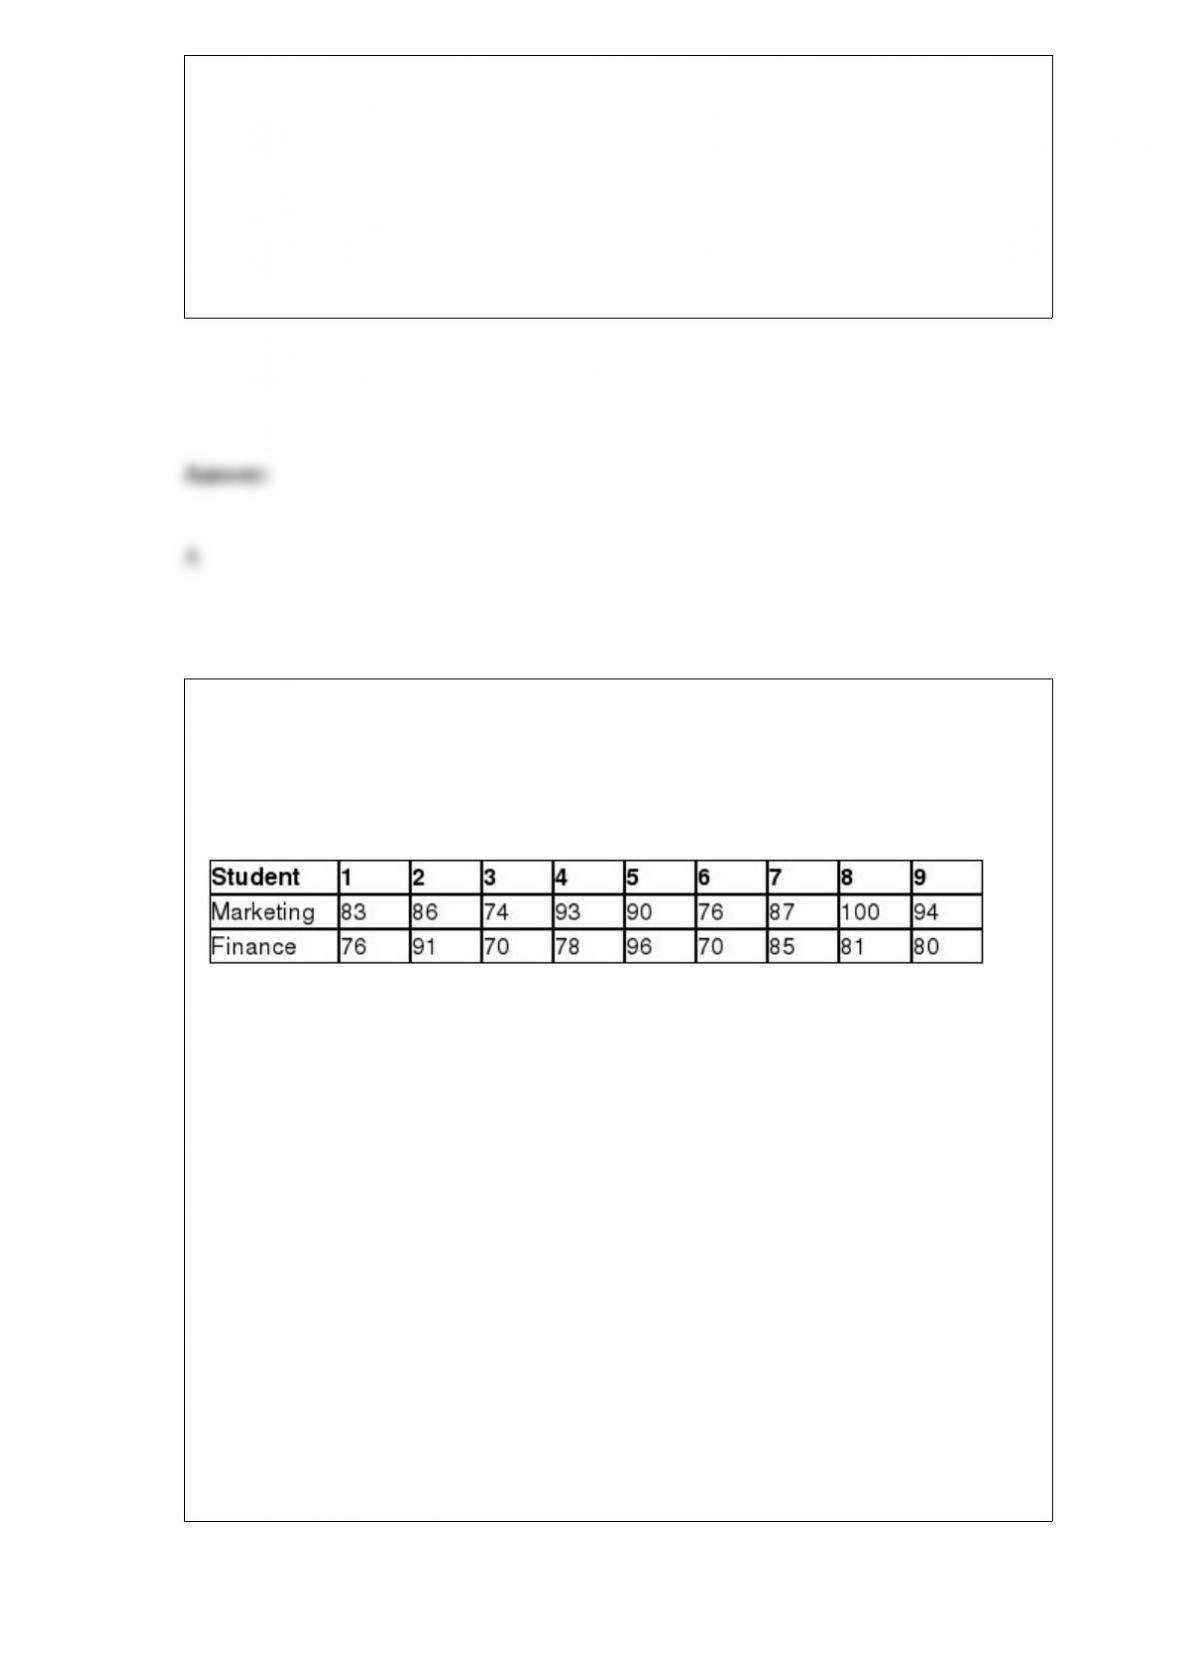
The Dean of the Business School at City University would like to test the hypothesis
that a difference exists between the median final exam grades for the Introduction to
Marketing course and the Introduction to Finance course. A random sample of eight
students who took both courses was selected and their final exam grade for each course
is shown below.
Using α = 0.10, which one of the following statements is true?
A) Because the test statistic is greater than the critical value, we can conclude that a
difference exists between the median final exam grades for the Introduction to
Marketing course and the Introduction to Finance course.
B) Because the test statistic is greater than the critical value, we cannot conclude that
that a difference exists between the median final exam grades for the Introduction to
Marketing course and the Introduction to Finance course.
C) Because the test statistic is less than the critical value, we can conclude that that a
difference exists between the median final exam grades for the Introduction to
Marketing course and the Introduction to Finance course.
D) Because the test statistic is less than the critical value, we cannot conclude that that a
difference exists between the median final exam grades for the Introduction to
Marketing course and the Introduction to Finance course.
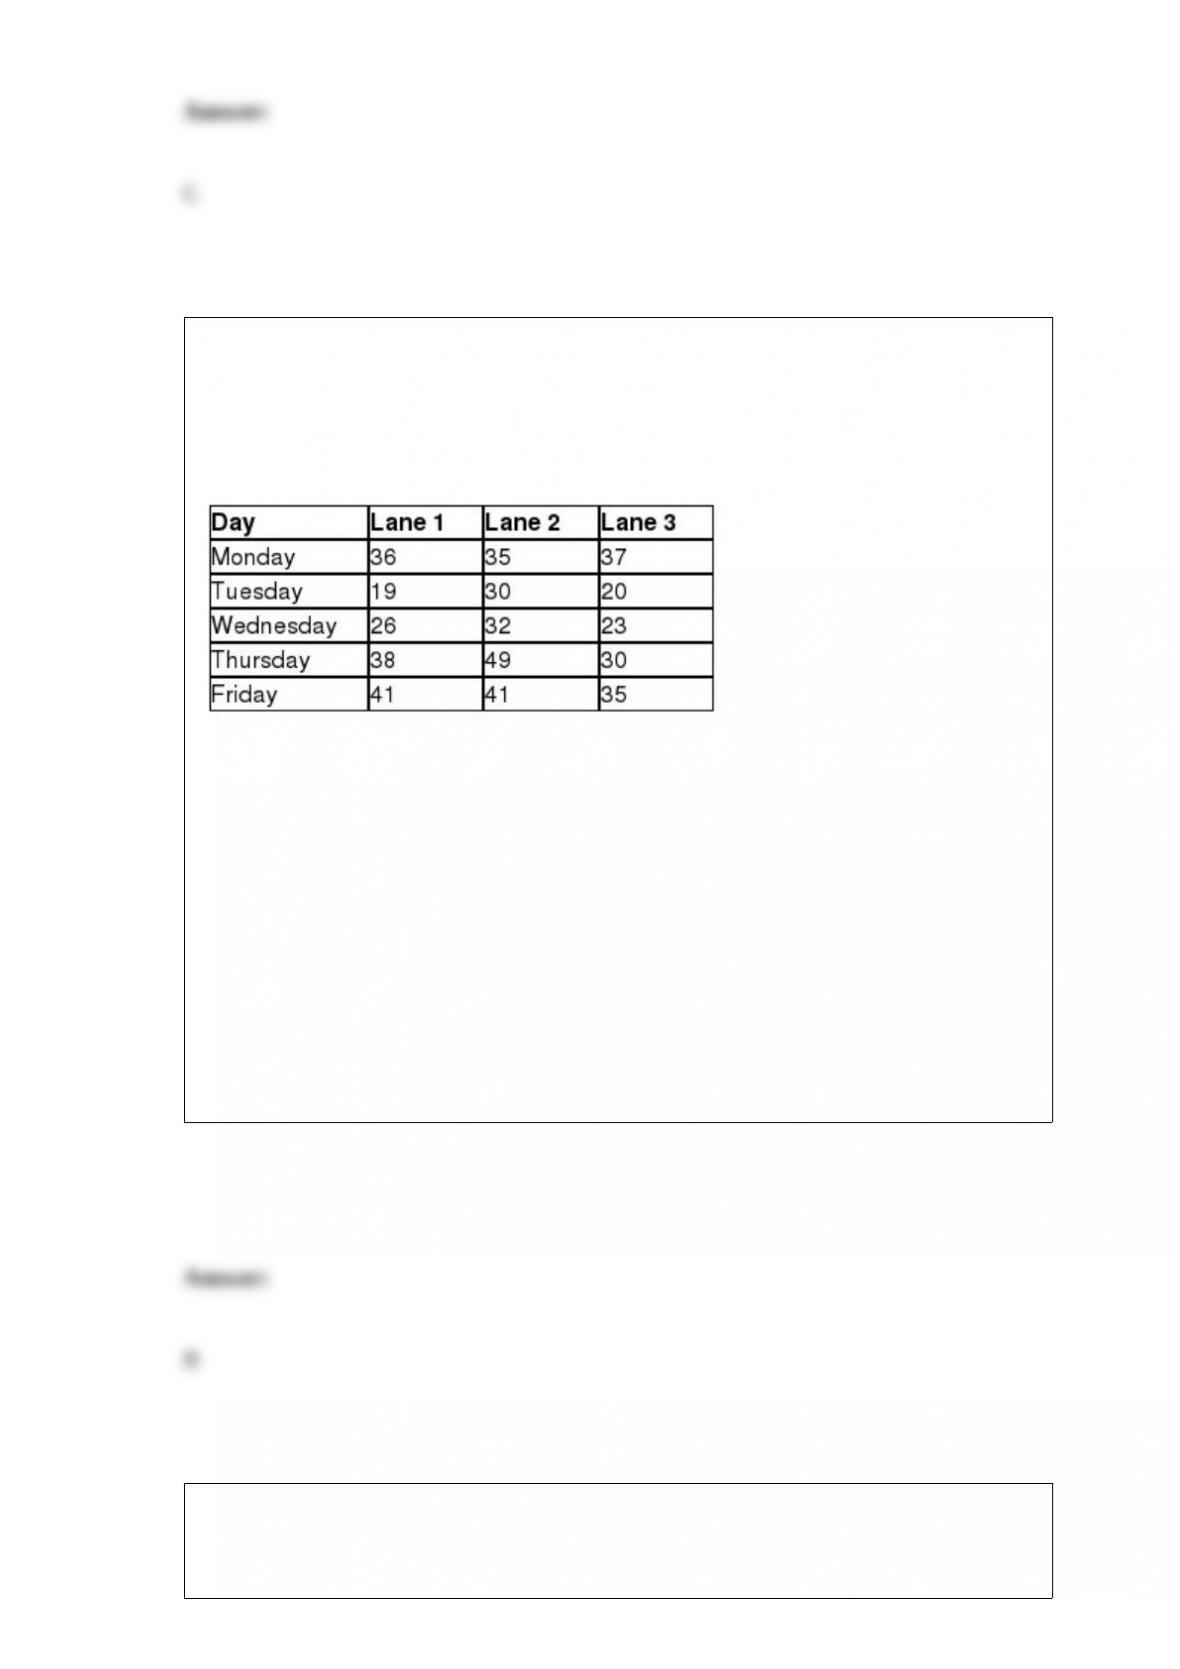
In Delaware, cars are inspected each year using state-operated inspection centers. The
Wilmington center has three drive-through lanes where cars are inspected in a sequence
of steps. The following data show the number of minutes that a random sample of
drivers spent waiting and having their cars inspected in the three lanes each day of the
week.
The state of Delaware would like to perform a randomized block ANOVA to test for a
difference in the average times the drivers spend in the three lanes using the weekday as
a blocking factor with α = 0.05. The main factor critical value for this hypothesis test
would be ________.
A) 3.838
B) 4.459
C) 5.738
D) 6.044
Assume that the number of pieces of junk mail per day that a person receives in their
mail box follows the Poisson distribution and averages 4.3 pieces per day. What is the
probability that this person will not receive any junk mail tomorrow?
A) 0.0136
B) 0.0314
C) 0.1069
D) 0.1360
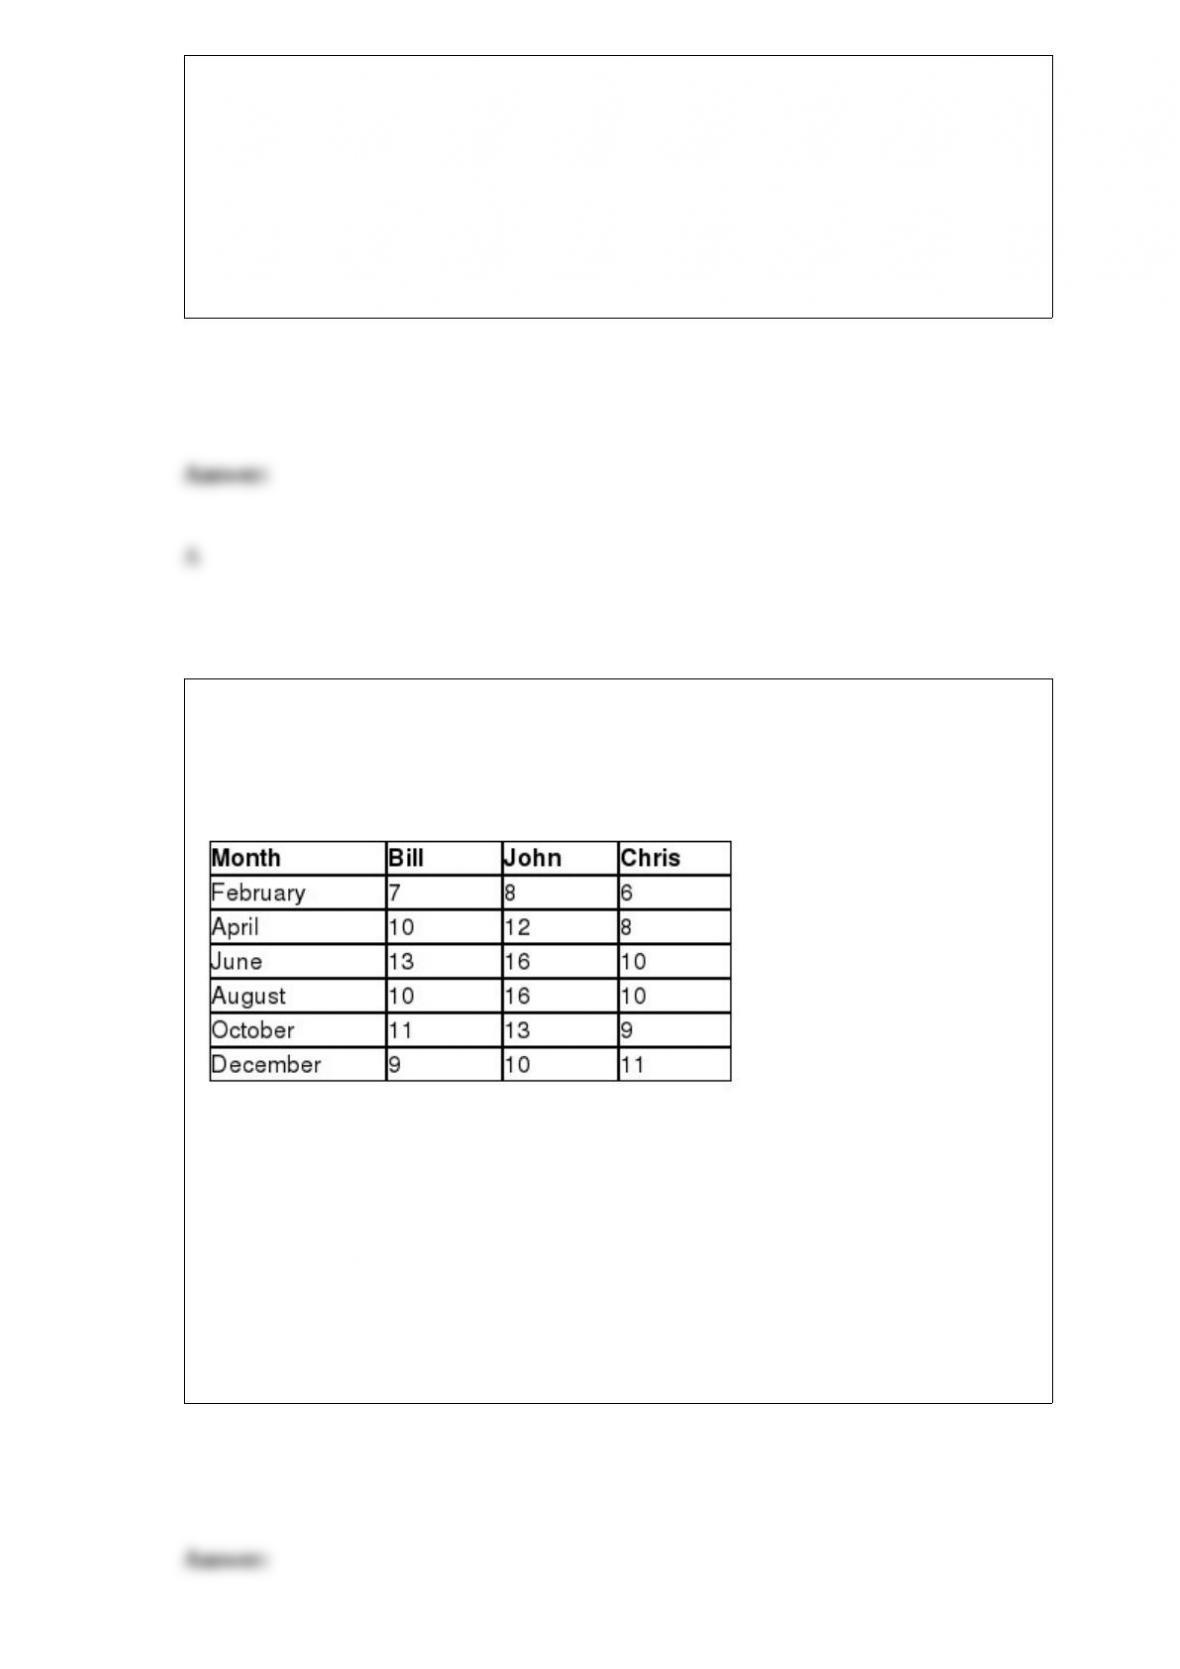
Sheridan Motors is a car dealership that would like to investigate if there is a difference
in the average number of car sales per month between three sales employees using a
randomized block ANOVA. The following data represent the number of car sales last
year for these employees for six different months.
The sum of squares error for these observations is ________.
A) 17.4
B) 18.1
C) 20.6
D) 23.0
The interquartile range represents the middle ________ of a range.
A) 10%
B) 25%
C) 50%
D) 75%
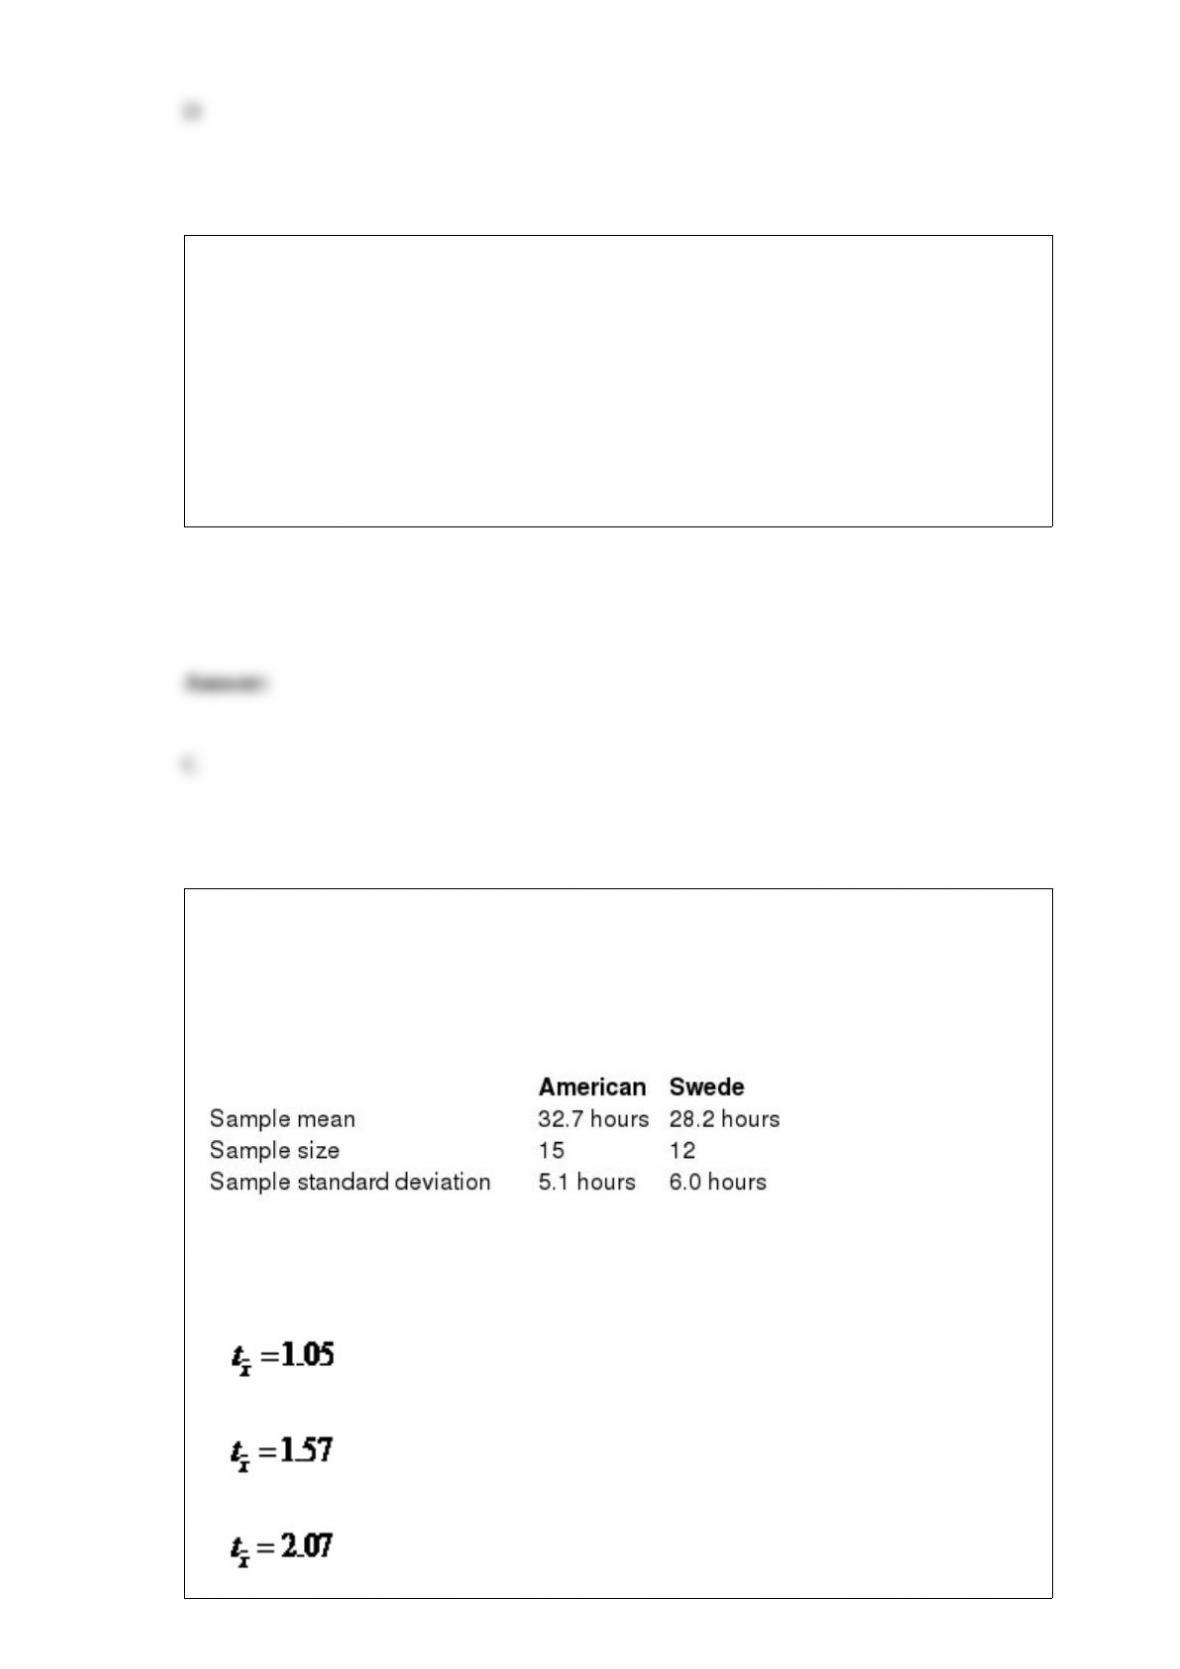
You have been assigned to test the hypothesis that the average number of hours per
week that an American works is higher than the average number of hours per week that
a Swede works. The following data summarizes the sample statistics for the number of
hours worked per week for workers in each country. Assume that the population
variances are unequal.
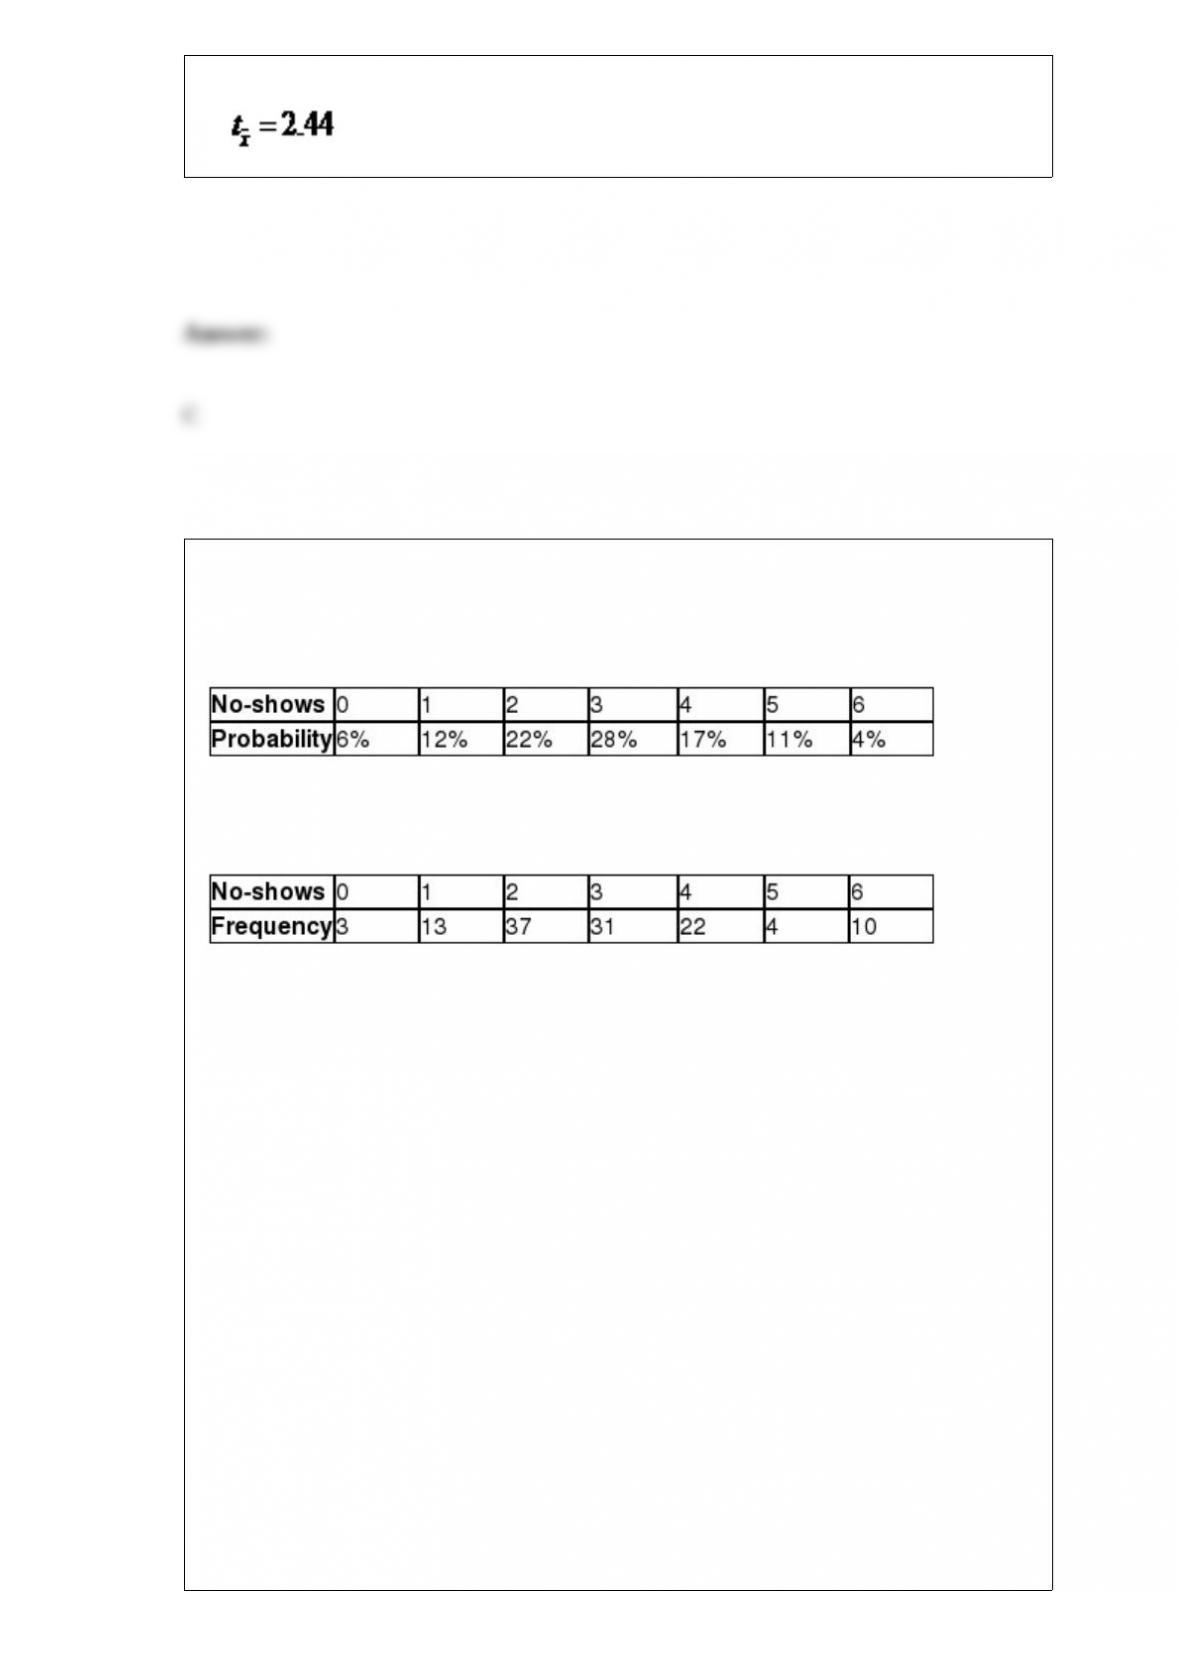
If Population 1 is defined as American workers and Population 2 is defined as Swedish
workers, the test statistic for this hypothesis test would be ________.
A)
B)
C)
D)
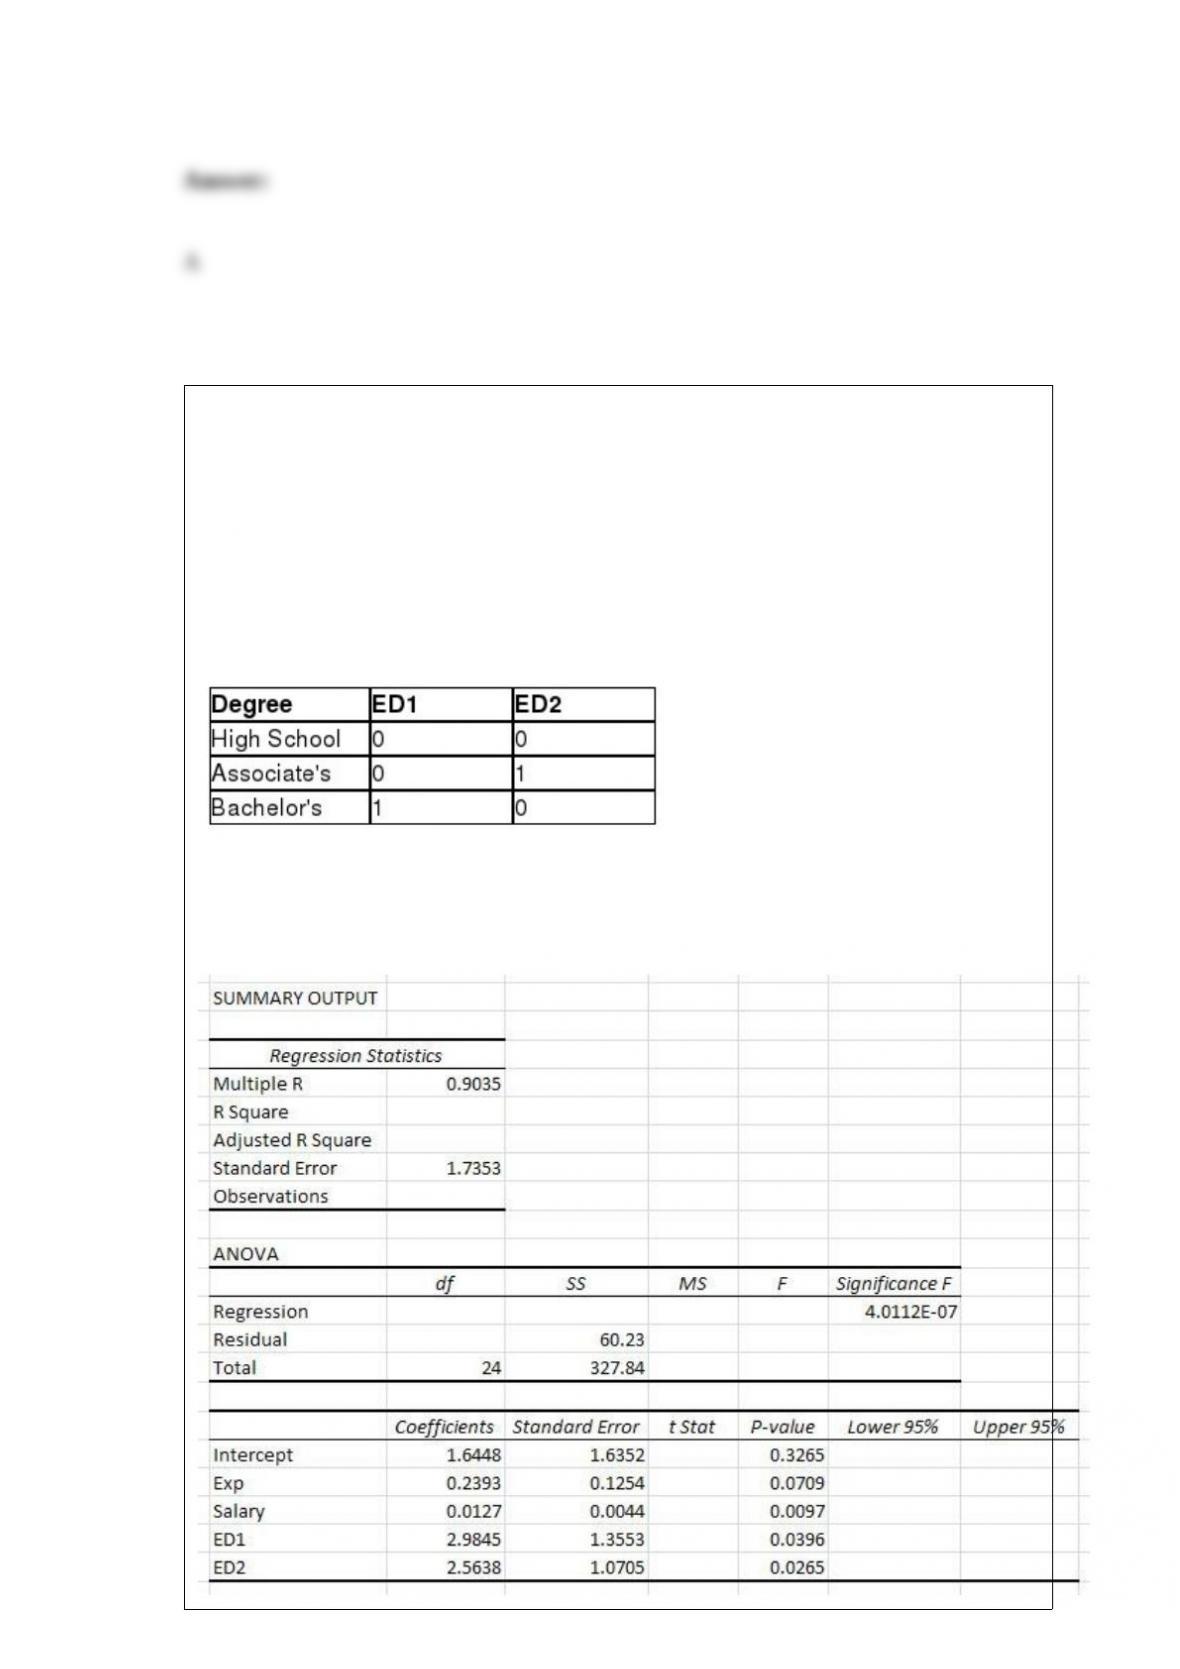
The airline industry defines no-shows as passengers who have purchased a ticket but
fail to arrive at the gate on time for departure. Southwest Airlines operates many flights
from Philadelphia to Dallas and experienced the following no-show probability
distribution last year.
The following data represent the number of no-shows that occurred on a random sample
of 120 flights between these two cities this year.
Southwest Airlines would like to know if the probability distribution of no-shows has
changed between last year and this year on flights between these two cities using α =
0.05. The conclusion for this hypothesis test would be that because the test statistic is
__________________________.
A) more than the critical value, we can reject the null hypothesis and conclude that the
probability distribution for no-shows has changed from last year to this year for flights
between these two cities
B) less than the critical value, we can reject the null hypothesis and conclude that the
probability distribution for no-shows has changed from last year to this year for flights
between these two cities
C) more than the critical value, we cannot reject the null hypothesis and conclude that
the probability distribution for no-shows has changed from last year to this year for
flights between these two cities
D) less than the critical value, we cannot reject the null hypothesis and cannot conclude
that the probability distribution for no-shows has changed from last year to this year for
flights between these two cities
Use the following information to answer the question(s) below.
Ford would like to develop a regression model that would predict the number of cars
sold per month by a dealership employee based on the employee’s number of years of
sales experience (Exp), the employee’s weekly base salary before commissions (Salary),
and the education level of the employee. There are three levels of education in the sales
forcehigh school degree, associate’s degree, and bachelor’s degree. The following
dummy variables have been defined.
The following Excel output shows the partially completed regression output from a
random sample of employees from the previous month.
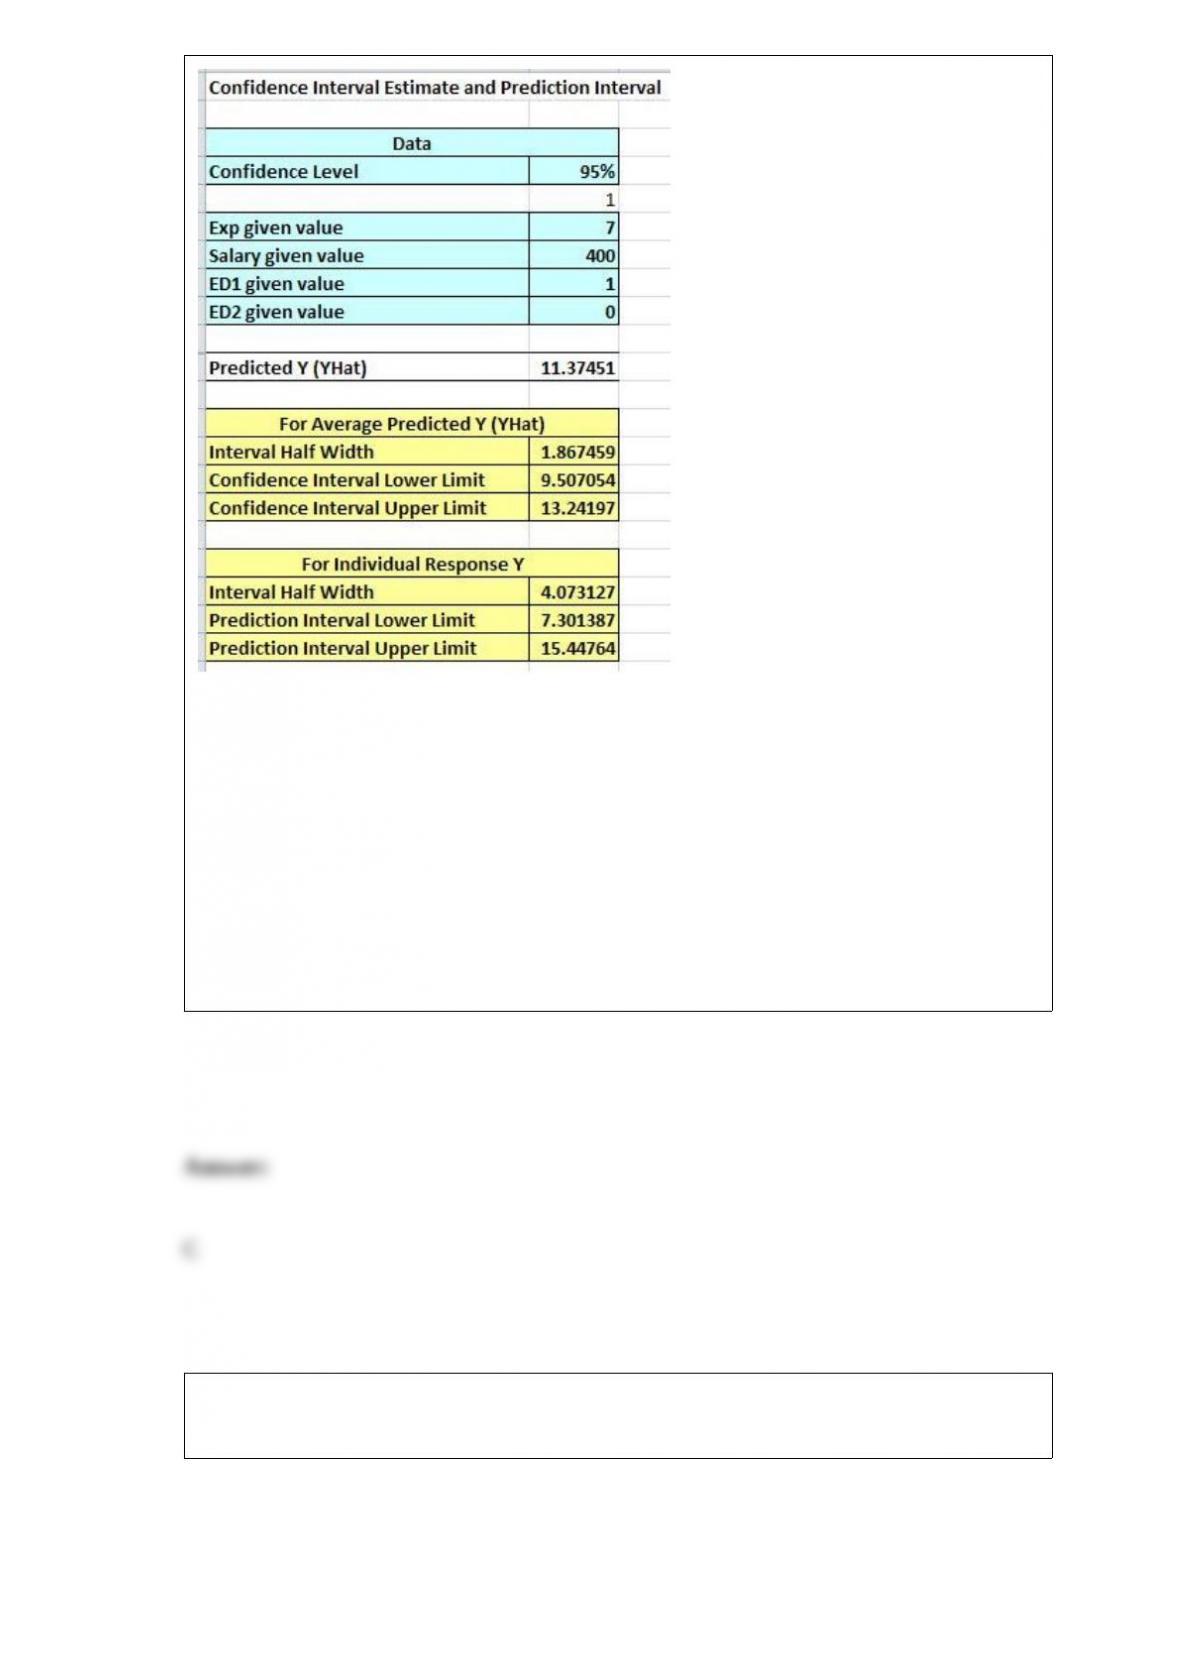
An employee with an associate’s degree will average ________ more cars sales per
month than an employee with a high school degree.
A) 2.9845
B) 1.3553
C) 2.5638
D) 0.4207
The following chart shows the average market price for five brands of cars in March
2013.
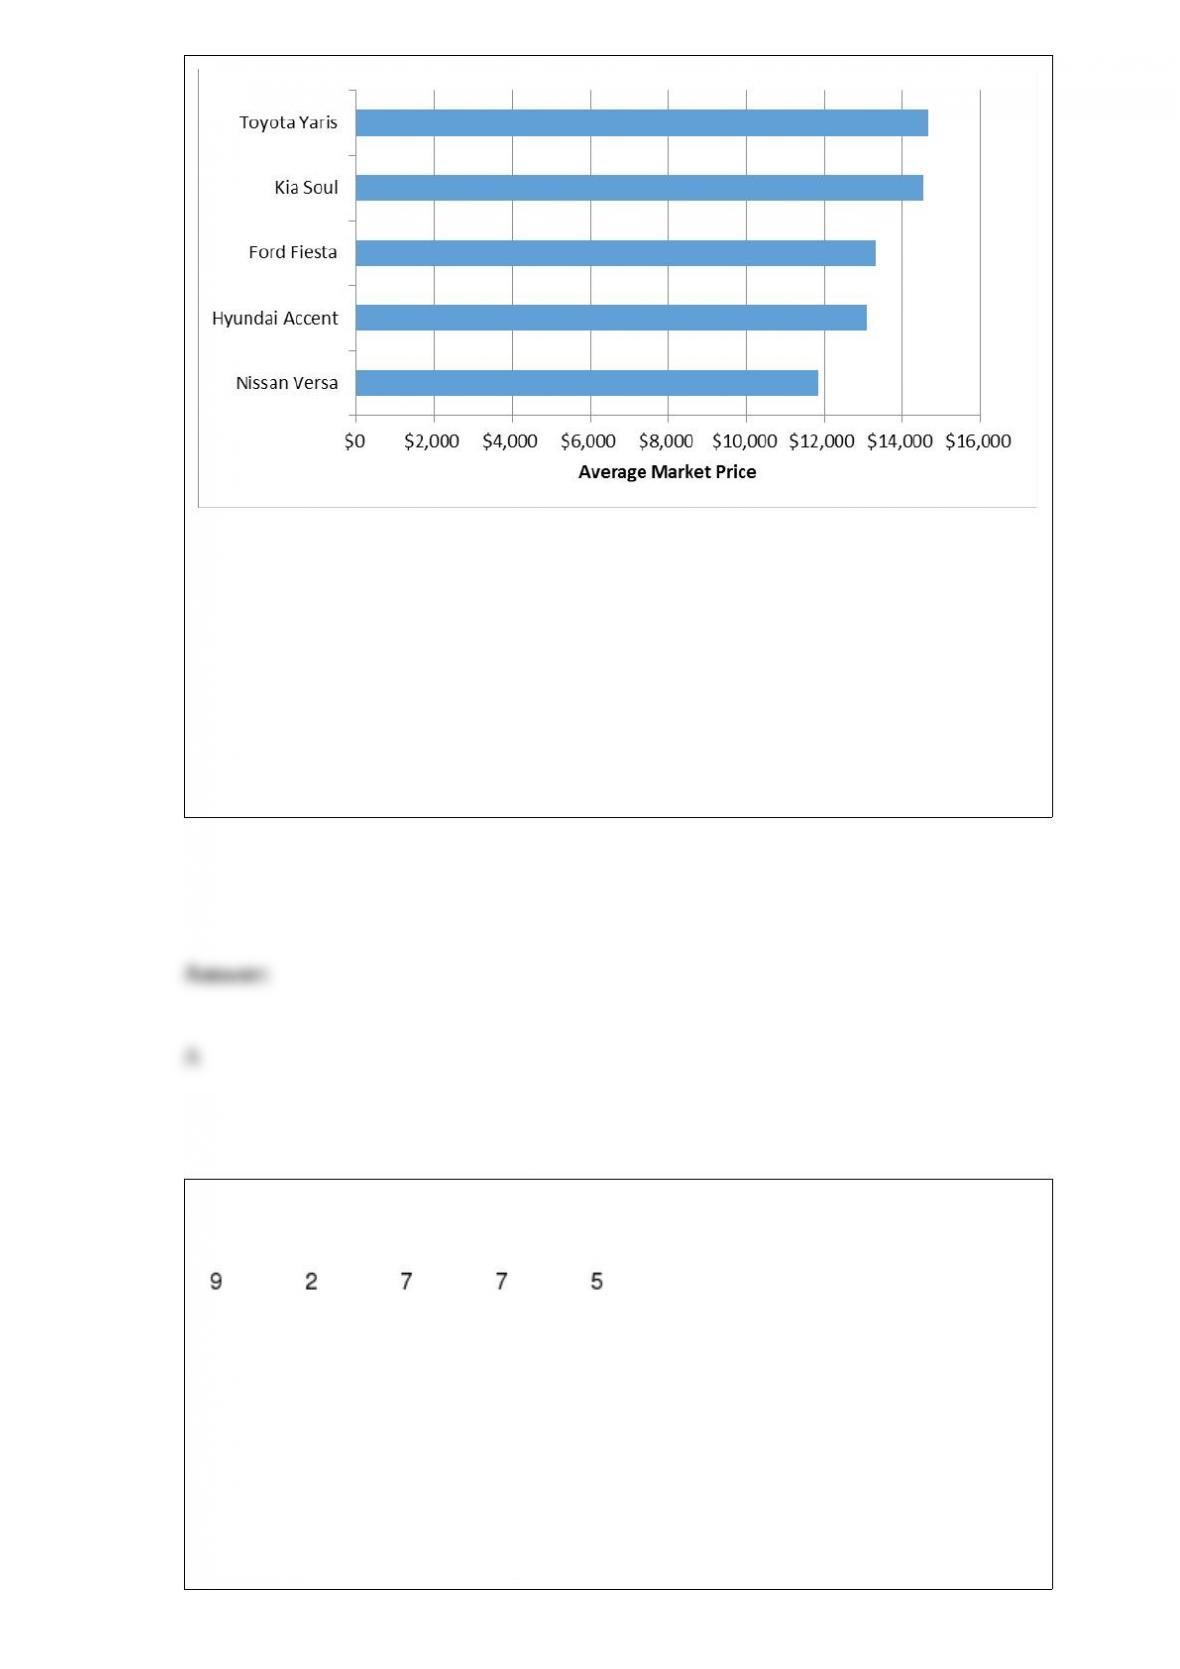
This chart is an example of a __________ bar chart.
A) horizontal
B) stacked
C) clustered
D) vertical
The following data represents the number of Sony TVs sold per day at a particular
Costco over a random sample of five business days.
The range of this sample is ________.
A) 5
B) 6
C) 7
D) 8

When testing for a normal distribution with the chi-square goodness-of-fit test with a
sample size of 50 observations, the number of intervals needed to satisfy the minimum
number of expected frequencies is ________.
A) 4
B) 5
C) 6
D) The sample size is too small to perform the chi-square goodness-of-fit test.
Two six-sided die are rolled. Calculating the probability of the sum of the two die being
a 10 is an example of using ________ probability.
A) subjective
B) empirical
C) classical
D) simple
The time that customers wait to be served at the delicatessen for a grocery store follows
the uniform distribution between 0 and 7 minutes. What is the probability that a
randomly selected customer will wait less than 2 minutes at the deli?
A) 0.1429
B) 0.2857
C) 0.5714
D) 0.8571
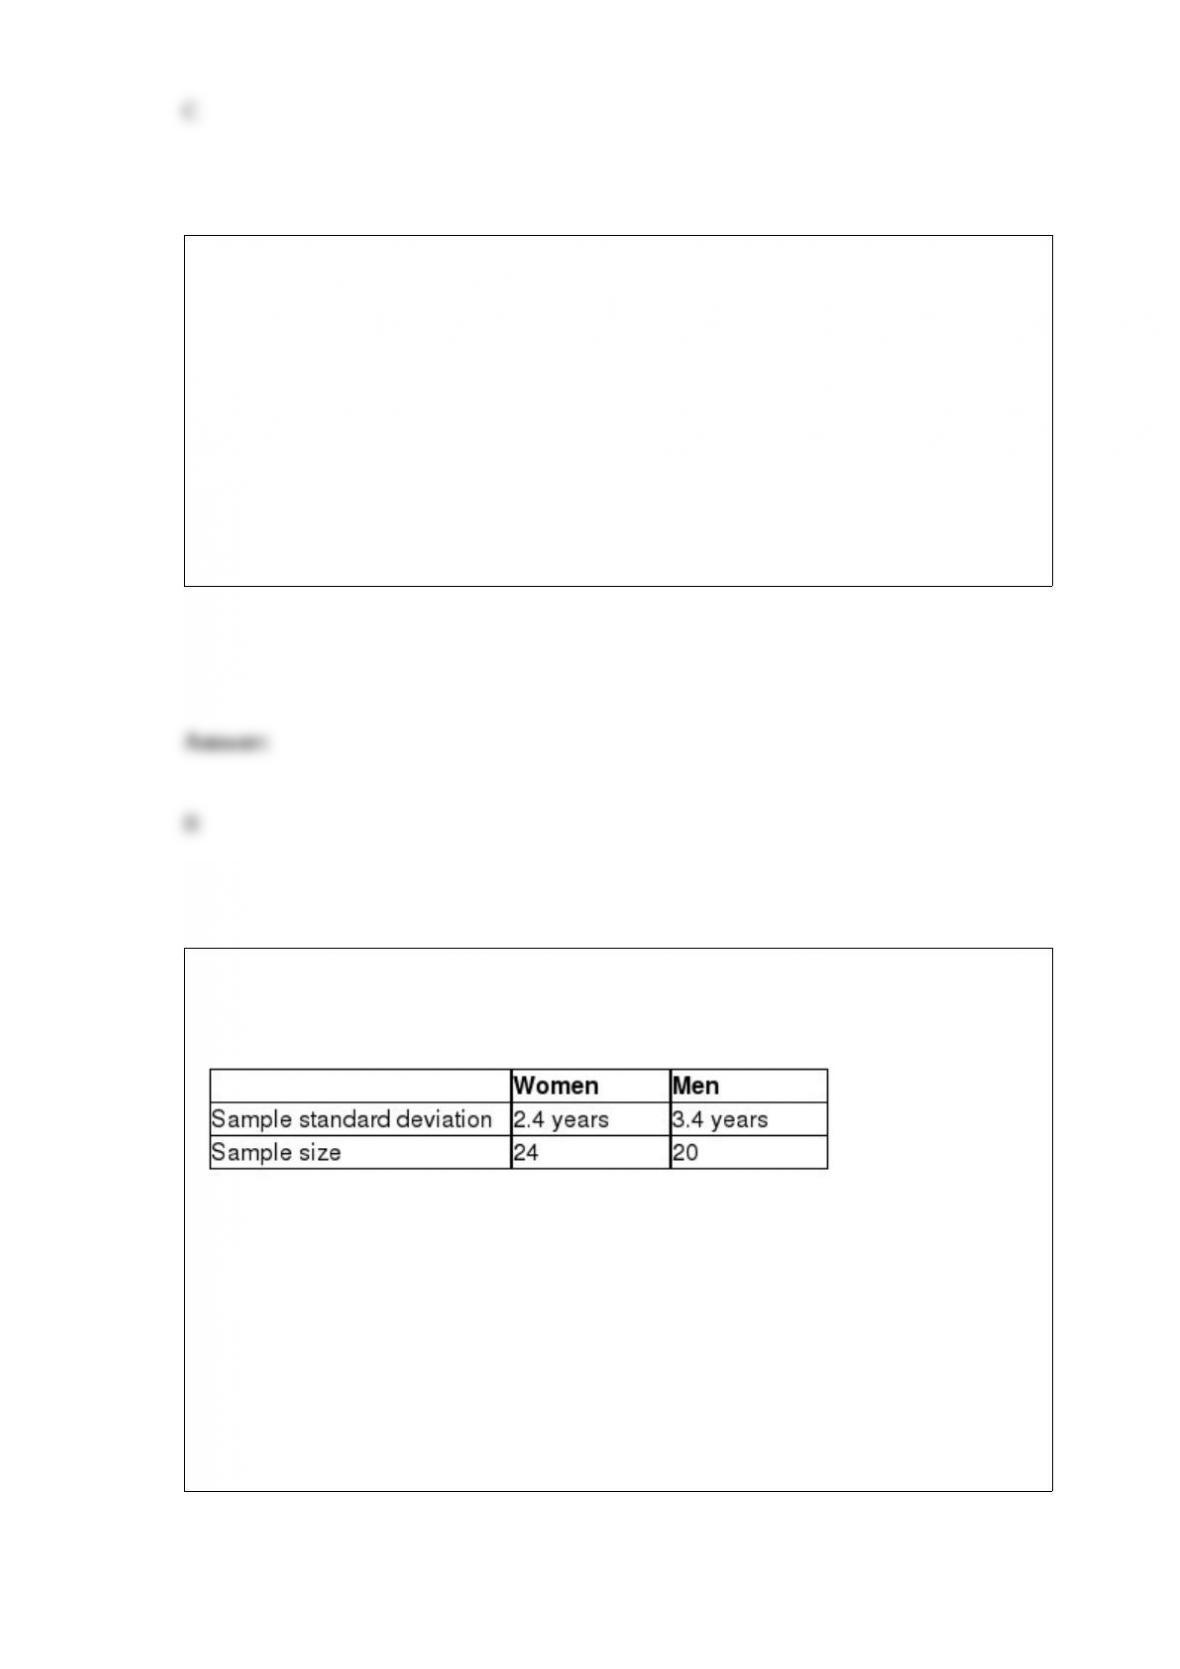
The federal government would like to test the hypothesis that the standard deviation for
the age of men filing for Social Security is higher than the standard deviation for the
age of women. The following table summarizes sample statistics from each population.
Using α = 0.10, the critical value for this hypothesis test would be ________.
A) 1.606
B) 1.611
C) 1.676
D) 1.753

The following data represents the number of Sony TVs sold per day at a particular
Costco over a random sample of five business days.
The variance of this sample is ________.
A) 2.4
B) 3.0
C) 3.3
D) 7.0
The Retail Advertising and Marketing Association would like to estimate the average
amount of money that a person spends for Mother’s Day with a 99% confidence interval
and a margin of error within plus or minus $12. Assuming the standard deviation for
spending on Mother’s Day is $36, the required sample size is ________.
A) 60
B) 72
C) 97
D) 108

The time that customers wait to be served at the delicatessen for a grocery store follows
the uniform distribution between 0 and 7 minutes. What is the mean of this distribution?
A) 1.5
B) 2.5
C) 3.5
D) 4.5
Jeff sells the New York Times Sunday newspaper at a city corner near several churches.
He sells each newspaper for $6.50 after purchasing them for $4.00. Any unsold
newspaper can be returned to the New York Times for a $0.75 credit. Jeff expects
demand on Sunday to be 75, 100, 125, or 150 newspapers and would like to order one
of these four quantities from the New York Times. If the Jeff uses the equally likely
criterion, how many newspapers will he order?
A) 75
B) 100
C) 125
D) 150
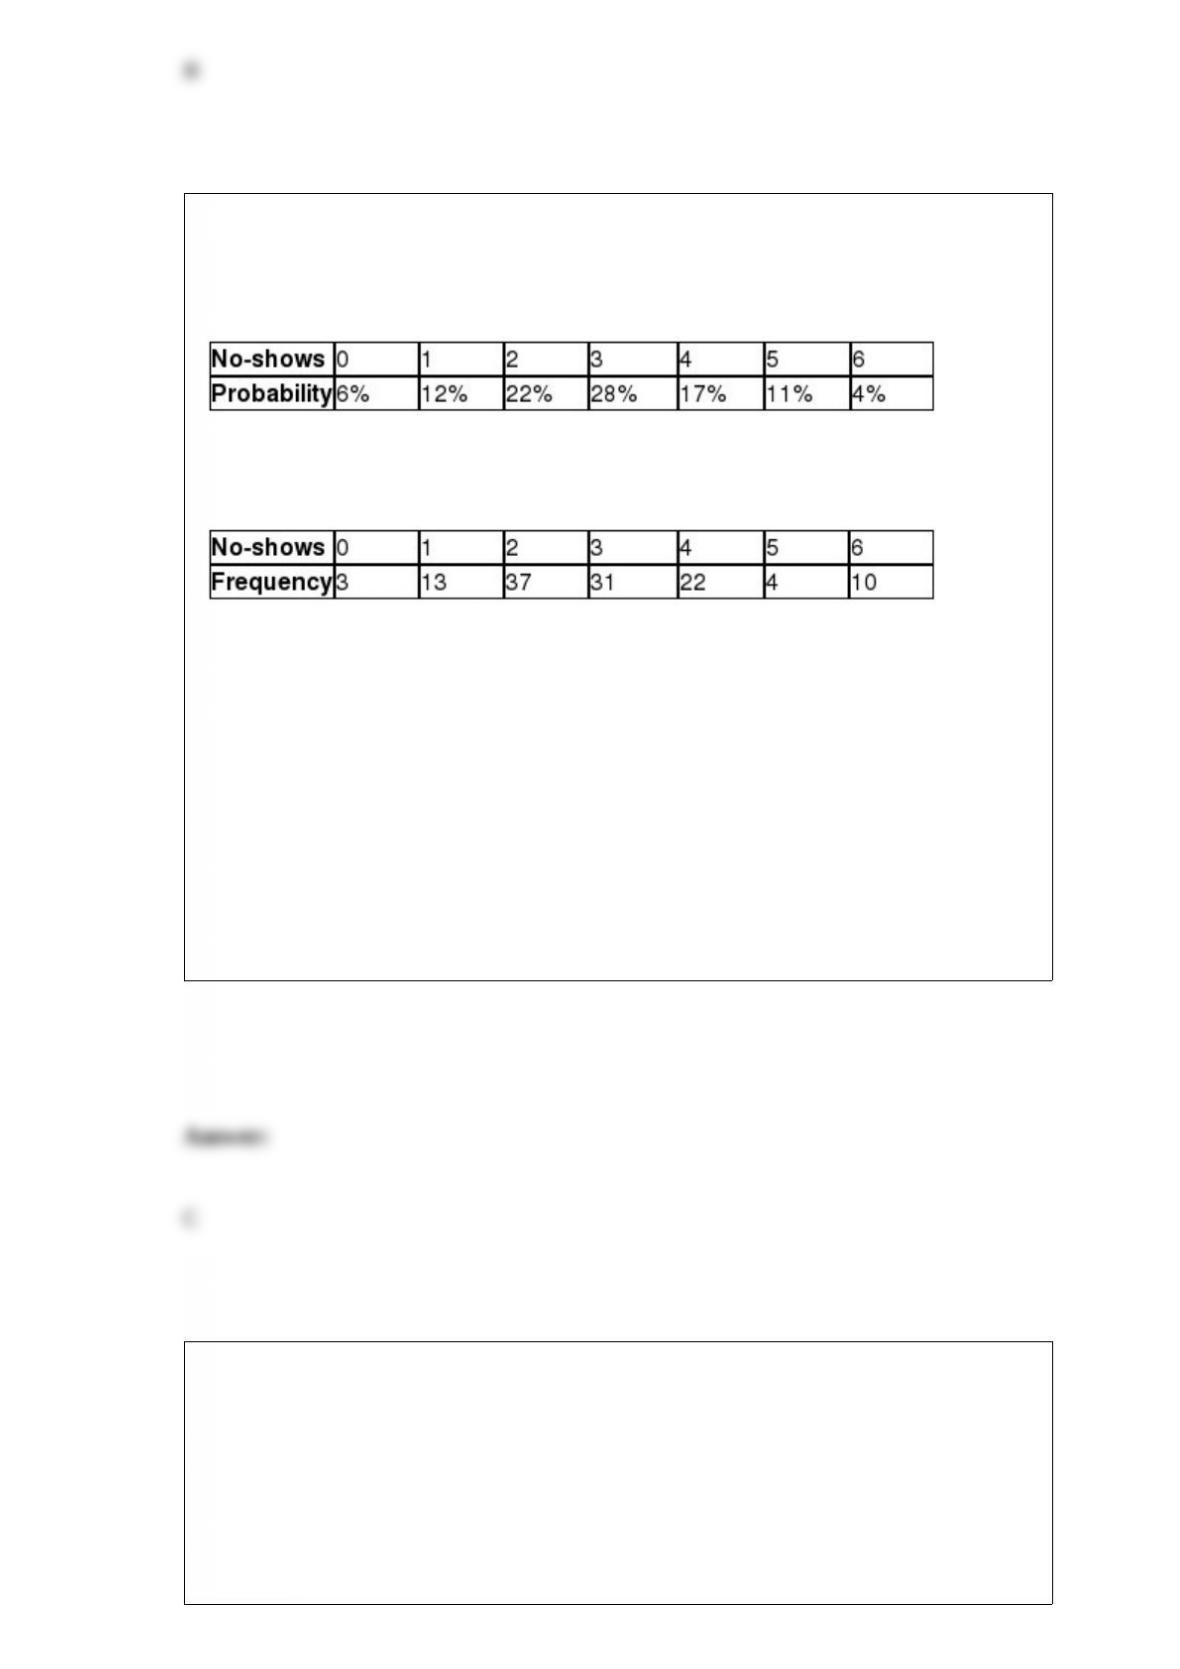
The airline industry defines no-shows as passengers who have purchased a ticket but
fail to arrive at the gate on time for departure. Southwest Airlines operates many flights
from Philadelphia to Dallas and experienced the following no-show probability
distribution last year.
The following data represent the number of no-shows that occurred on a random sample
of 120 flights between these two cities this year.
Southwest Airlines would like to know if the probability distribution of no-shows has
changed between last year and this year on flights between these two cities using α =
0.05. The critical value for this hypothesis test is ________.
A) 5.991
B) 7.815
C) 12.592
D) 14.067
The Retail Advertising and Marketing Association would like to estimate the average
amount of money that a person spends for Mother’s Day with a 99% confidence interval
and a margin of error within plus or minus $6. Assuming the standard deviation for
spending on Mother’s Day is $36, the required sample size is ________.
A) 210
B) 239

C) 284
D) 313
In a Major League Baseball game today, the Philadelphia Phillies scored six runs
against the New York Mets. This is an example of _________ data.
A) nominal
B) ordinal
C) interval
D) ratio
A local church has a congregation consisting of 480 adult members. The church’s
administrators would like to estimate the average weekly donation per member per
week. A random sample of 90 members was found to have an average donation of
$56.70 and a standard deviation of $10.50. The 90% confidence interval to estimate the
average weekly donation is ________.
A) ($49.93, $63.48)
B) ($55.04, $58.36)
C) ($46.73, $66.67)

D) ($44.71, $68.69)