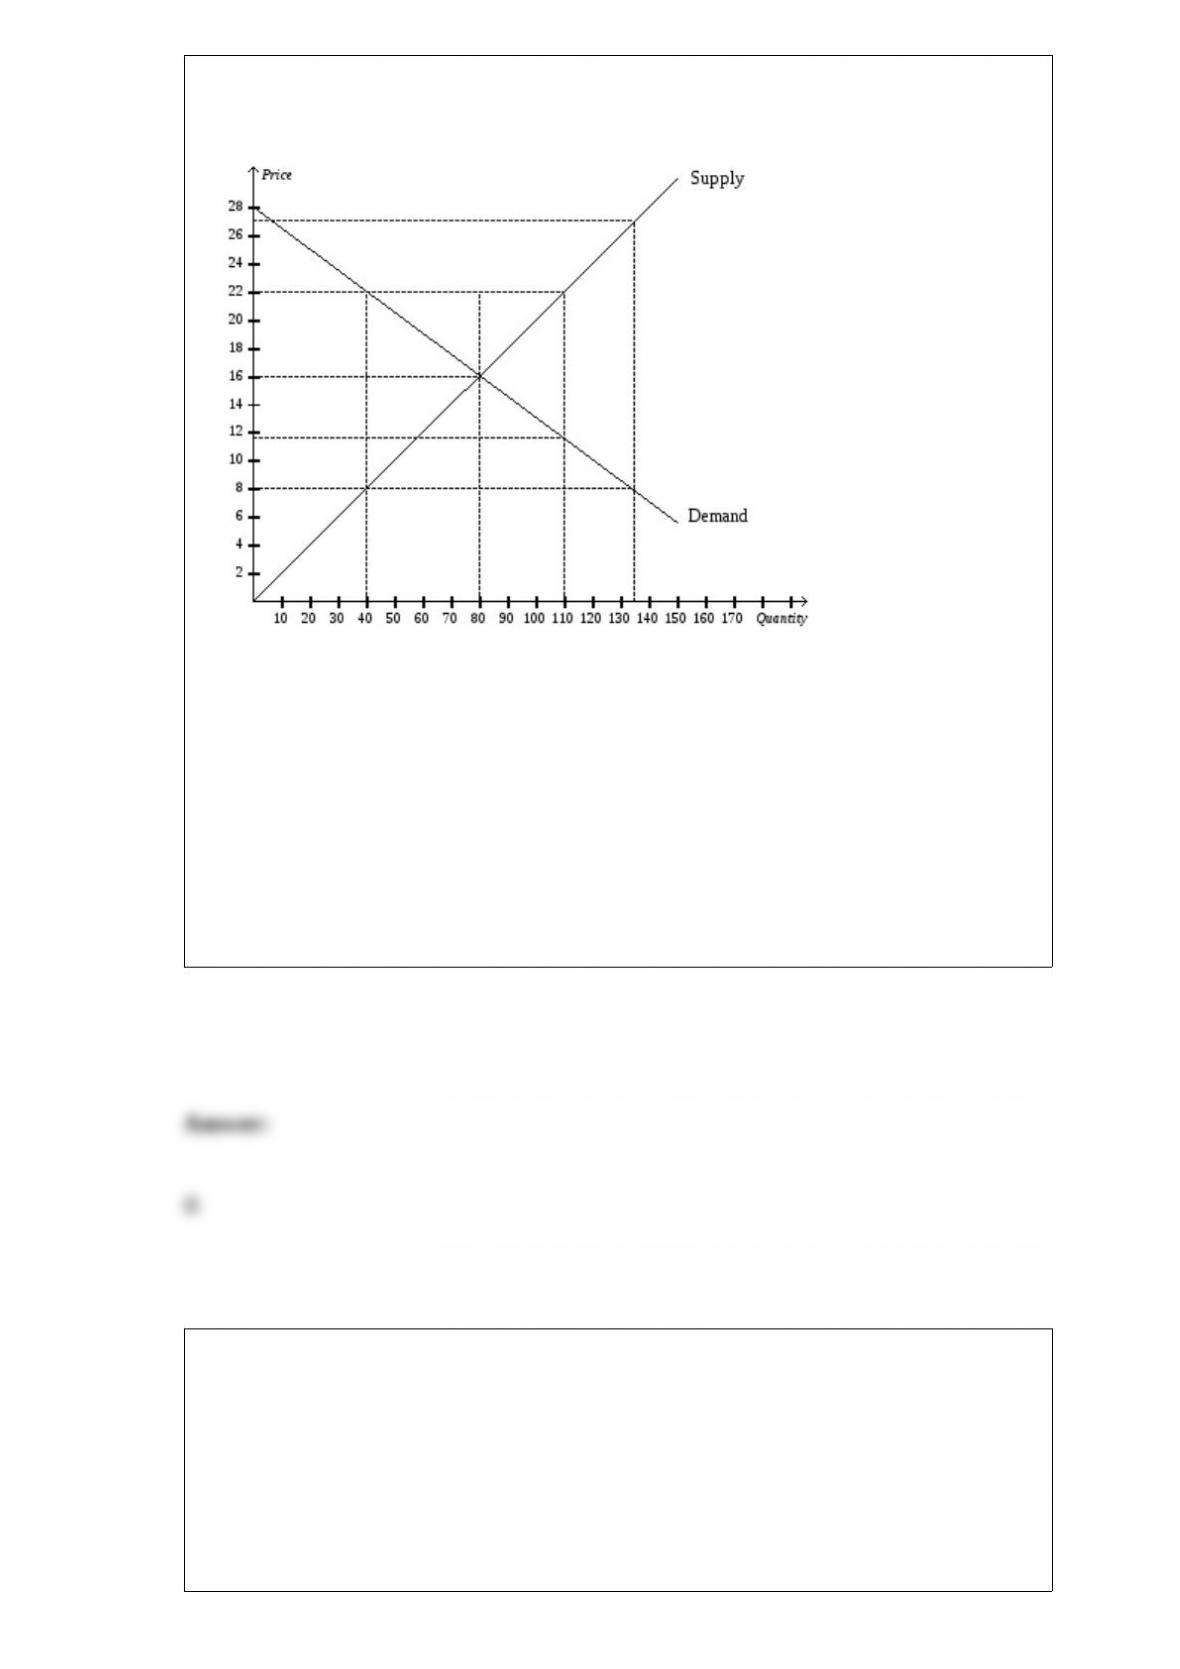
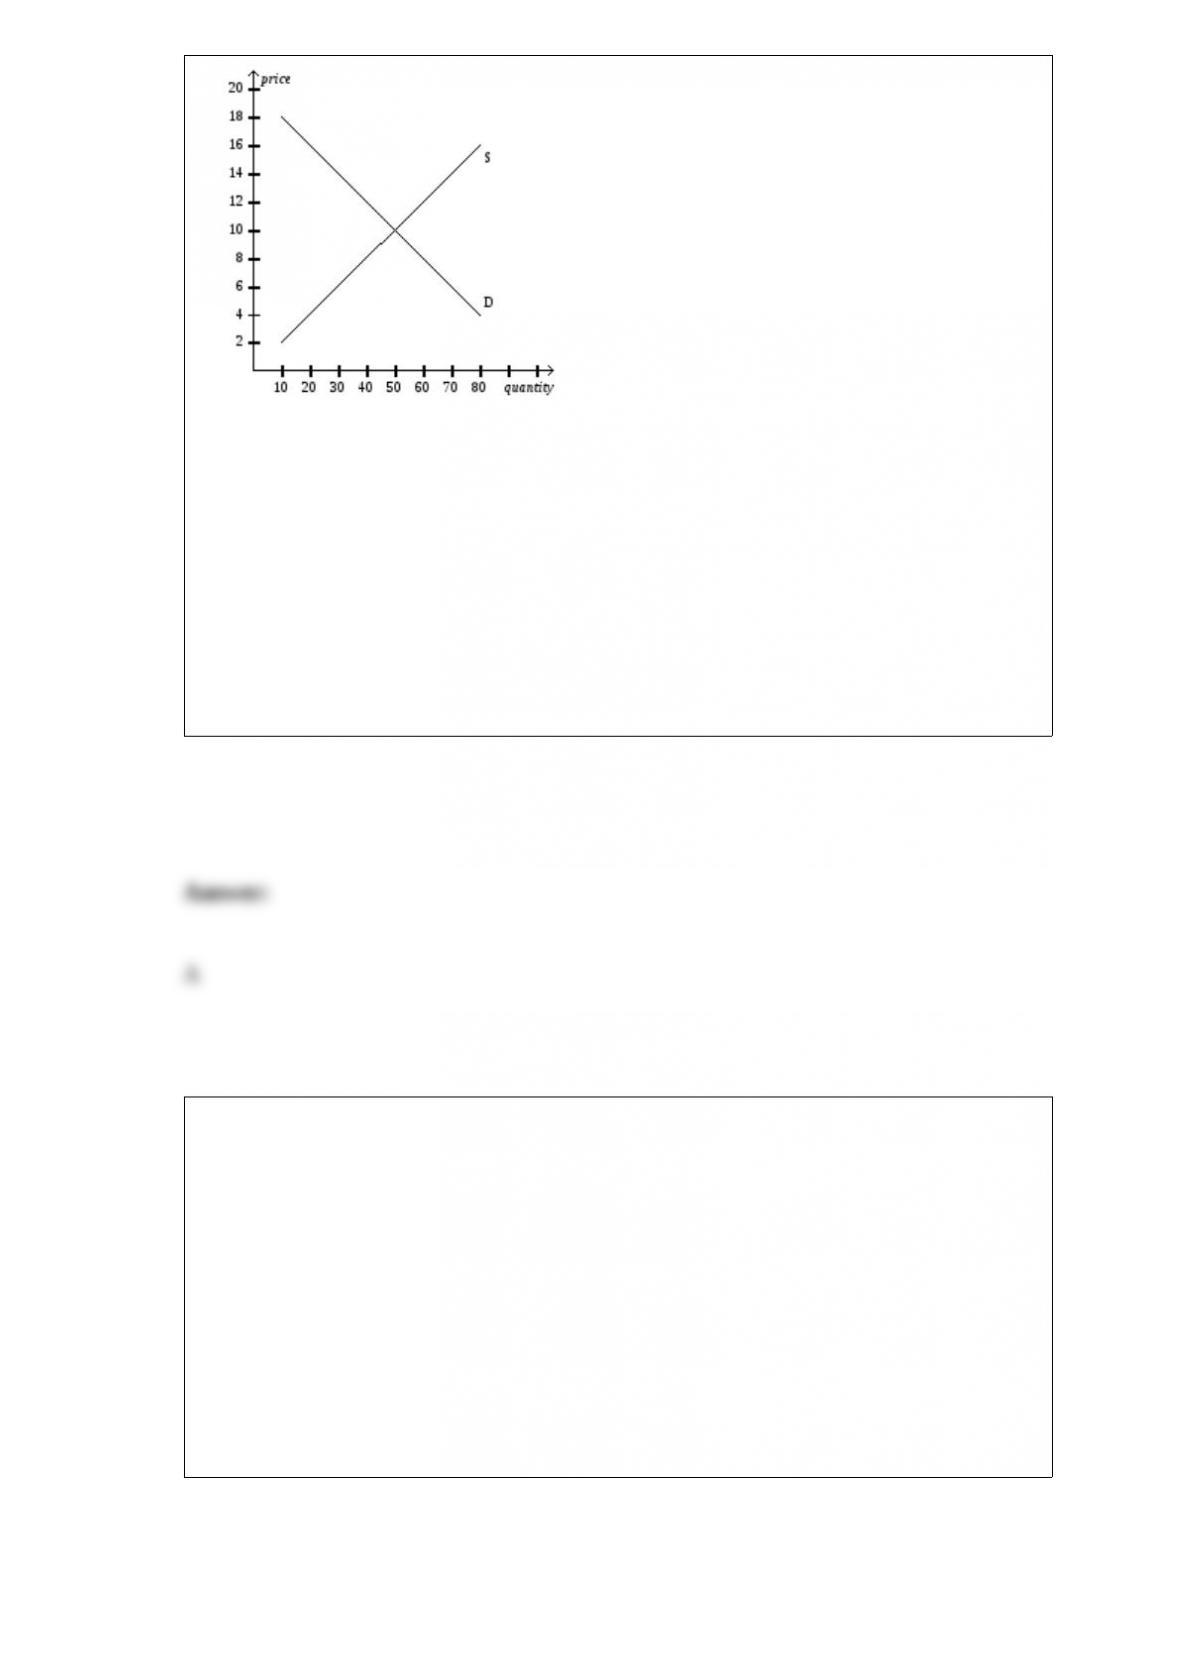
Figure 7-18
Refer to Figure 7-18. If the price decreases from $22 to $16 due to a shift in the supply
curve, consumer surplus increases by
a. $120.
b. $360.
c. $480.
d. $600.
Bob is looking for work after school, but everywhere he fills out an application, the
managers say they always have a lot more applications than open positions. Tom has a
law degree. Several firms have made him offers, but he thinks he might be able to find a
firm where his talents could be put to better use.
a. Bob and Tom are both frictionally unemployed.
b. Bob and Tom are both structurally unemployed.

c. Bob is frictionally unemployed, and Tom is structurally unemployed.
d. Bob is structurally unemployed, and Tom is frictionally unemployed.
The reported unemployment rate should be viewed as
a. a useful but imperfect measure of joblessness.
b. clearly smaller than the true unemployment rate.
c. clearly larger than the true unemployment rate.
d. being very close to the true unemployment rate.
Scenario 8-1
Erin would be willing to pay as much as $100 per week to have her house cleaned.
Ernesto’s opportunity cost of cleaning Erin’s house is $70 per week.
Refer to Scenario 8-1. Assume Erin is required to pay a tax of $40 when she hires
someone to clean her house for a week. Which of the following is correct?
a. Erin will now clean her own house.
b. Ernesto will continue to clean Erin’s house, but his producer surplus will decline.

c. Total economic welfare (consumer surplus plus producer surplus plus tax revenue)
will increase.
d. Erin will continue to hire Ernesto to clean her house, but her consumer surplus will
decline.
The self-interest of the participants in an economy is guided into promoting general
economic self-interest by
a. the invisible hand.
b. market power.
c. government intervention.
d. oikonomos.
Table 11-7
The table below relates to the economy of Mainland, where the typical consumer’s
market basket consists of 2 iPhones and 3 hamburgers.

Refer to Table 11-7. If the base year is 2007, then the consumer price index (rounded to
the nearest whole number) was
a. 100 in 2007, 83 in 2008, and 76 in 2009.
b. 76 in 2007, 83 in 2008, and 100 in 2009.
c. 76 in 2007, 100 in 2008, and 83 in 2009.
d. 100 in 2007, 76 in 2008, and 83 in 2009.
In the circular-flow diagram,
a. profit flows from households to firms.
b. labor flows from households to firms.
c. services flow from households to firms.
d. All of the above are correct.
Table 2-2
The following table contains some production possibilities for an economy for a given
year:
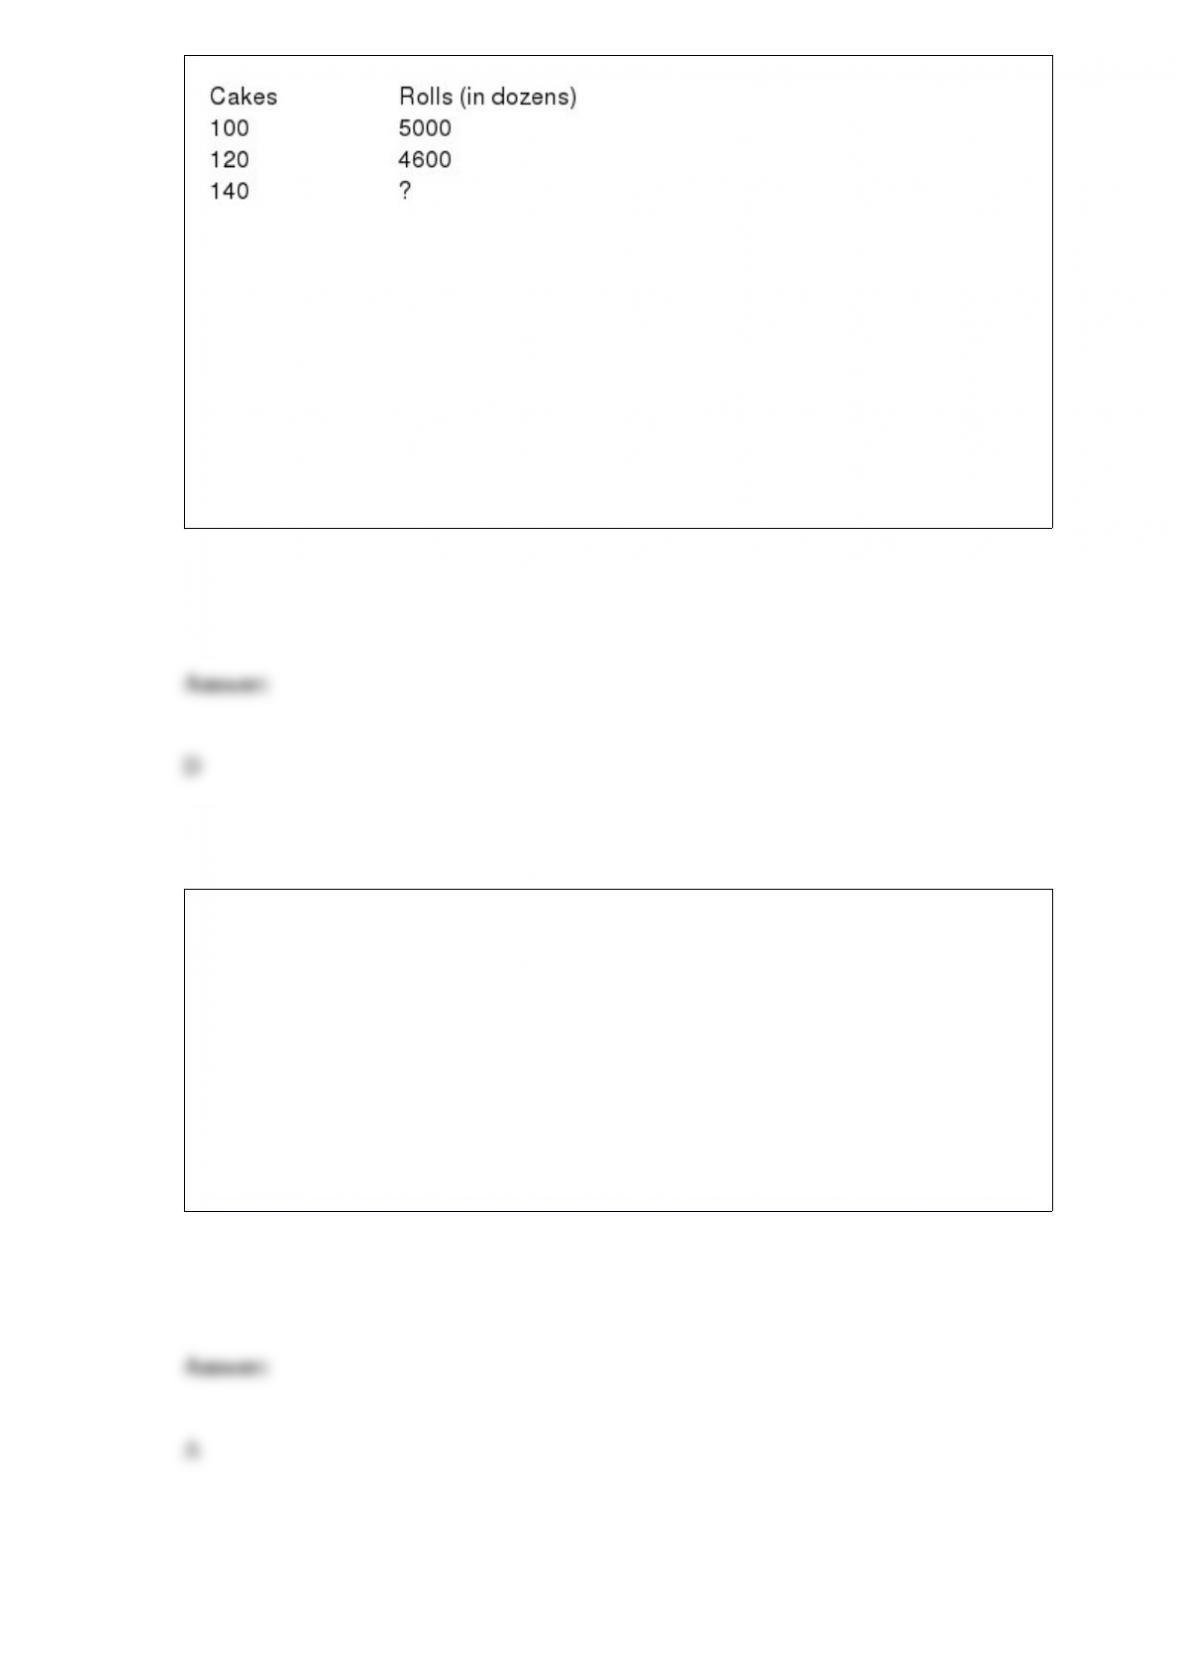
Refer to Table 2-2. If the production possibilities frontier is bowed outward, then “?”
could be
a. 4400.
b. 4300.
c. 4200.
d. 4100.
Suppose the price of a quart of milk rises from $1.00 to $1.20 and the price of a T-shirt
rises from $8.00 to $9.60. If the CPI rises from 150 to 195, then people likely will buy
a. more milk and more T-shirts.
b. more milk and fewer T-shirts.
c. less milk and more T-shirts.
d. less milk and fewer T-shirts.

Which of the following transactions would be included in GDP for 2010?
a. In February 2010, Amanda sells a 1996 Honda Accord to Isabella.
b. In February 2010, Amanda buys a ticket to visit a zoo in Florida. She visits the zoo in
April
c. In December 2010, Isabella eats onions that she harvested from her backyard garden
in October
d. All of the above are correct.
Because the demand for wheat tends to be inelastic, the development of a new, more
productive hybrid wheat would tend to
a. increase the total revenue of wheat farmers.
b. decrease the total revenue of wheat farmers.
c. decrease the demand for wheat.
d. decrease the supply of wheat.
A recession is always associated with
a. the end of a war.

b. slowly growing real GDP.
c. rising inflation.
d. declining real GDP.
A country purchases $3 billion of foreign-produced goods and services and sells $2
billion dollars of domestically produced goods and services to foreign countries. It has
a. exports of $3 billion and a trade surplus of $1 billion.
b. exports of $3 billion and a trade deficit of $1 billion.
c. exports of $2 billion and a trade surplus of $1 billion.
d. exports of $2 billion and a trade deficit of $1 billion.
Suppose a country has a consumption tax that is similar to a state sales tax. If its
government were to eliminate the consumption tax and replace it with an income tax
that includes an income tax on interest from savings, what would happen?
a. There would be no change in the interest rate or saving.
b. The interest rate would decrease and saving would increase.
c. The interest rate would increase and saving would decrease.

d. None of the above is correct.
The second largest category, by relative importance, in the CPI calculation is
a. housing.
b. apparel.
c. transportation.
d. medical care.
Scenario 8-2
Tom mows Stephanie’s lawn for $25. Tom’s opportunity cost of mowing Stephanie’s
lawn is $20, and Stephanie’s willingness to pay Tom to mow her lawn is $28.
Refer to Scenario 8-2. Assume Tom is required to pay a tax of $3 each time he mows a
lawn. Which of the following results is most likely?
a. Stephanie now will decide to mow her own lawn, and Tom will decide it is no longer
in his interest to mow Stephanie’s lawn.
b. Stephanie is willing to pay Tom to mow her lawn, but Tom will decline her offer.
c. Tom is willing to mow Stephanie’s lawn, but Stephanie will decide to mow her own
lawn.
d. Tom and Stephanie still can engage in a mutually-agreeable trade.
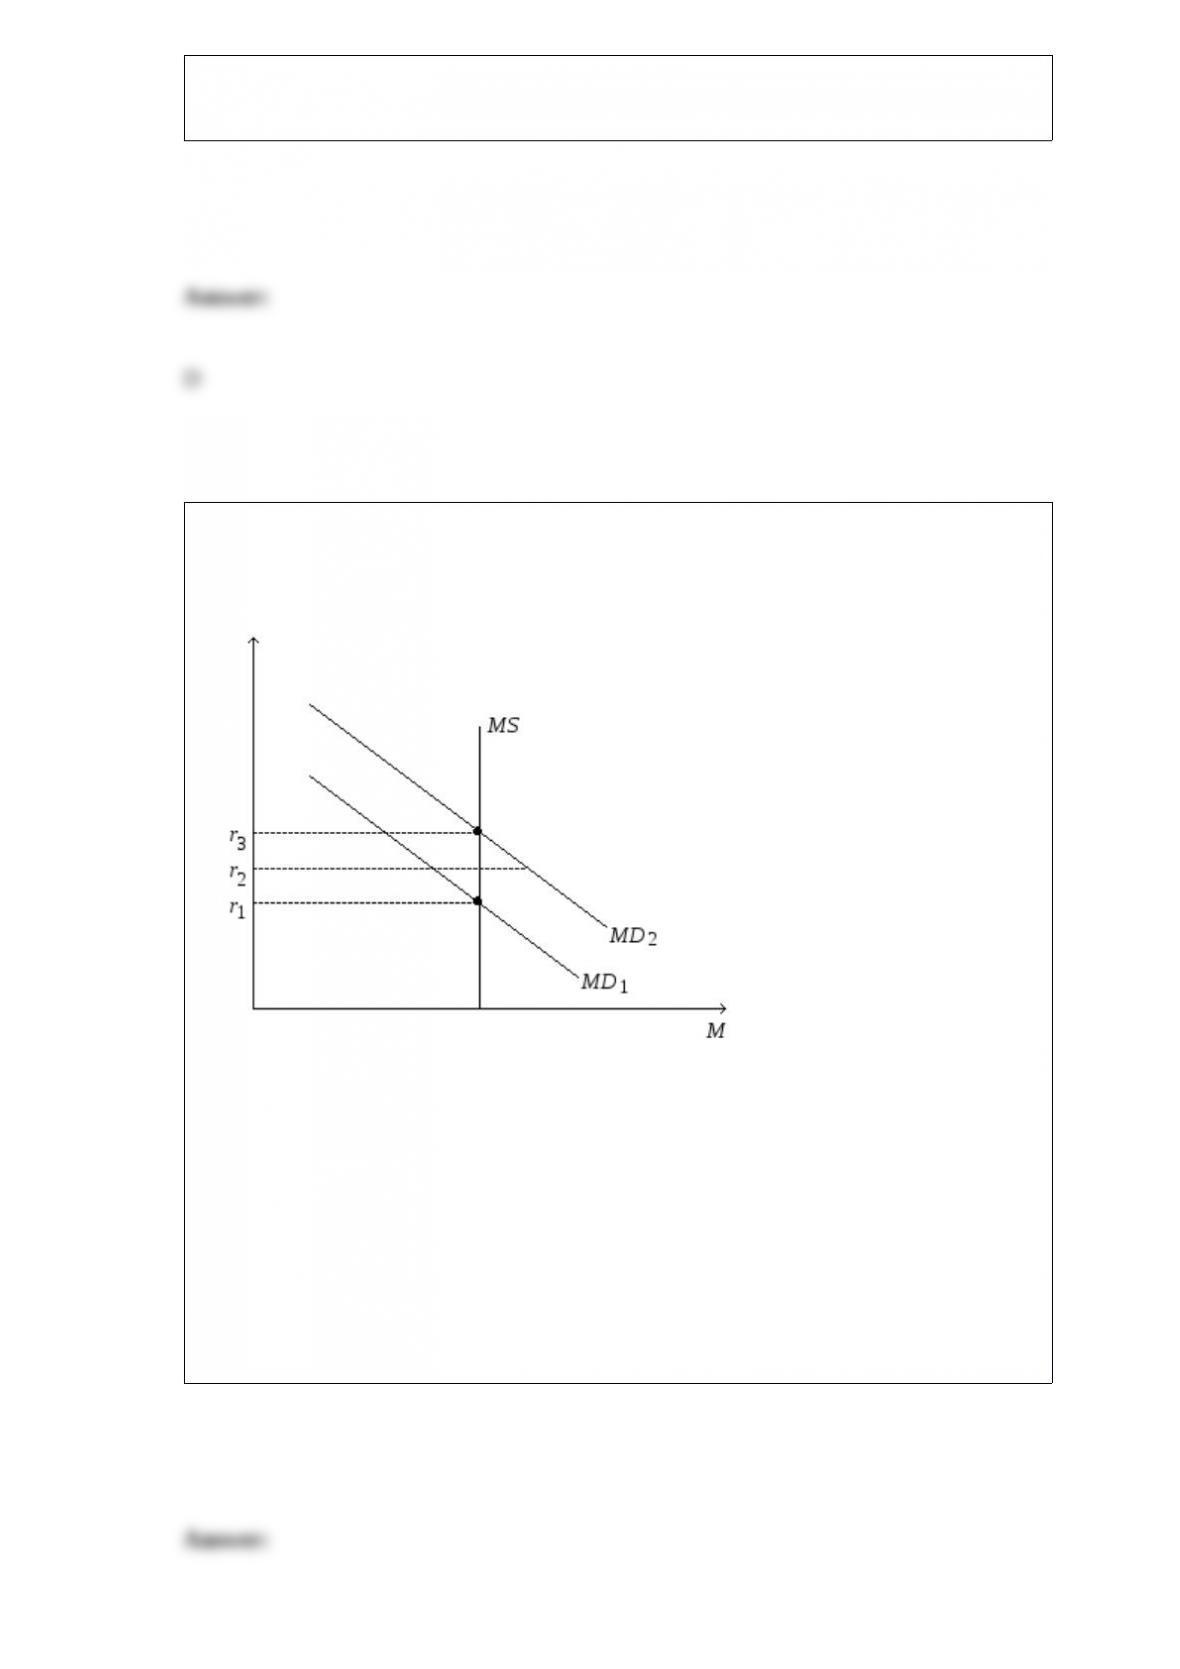
Figure 21-4. On the figure, MS represents money supply and MD represents money
demand.
Refer to Figure 21-4. Suppose the current equilibrium interest rate is r1. Which of the
following events would cause the equilibrium interest rate to increase?
a. The Federal Reserve increases the money supply.
b. Money demand increases.
c. The price level decreases.
d. All of the above are correct.

Scenario 13-1. Assume the following information for an imaginary, closed
economy.
GDP = $120,000; consumption = $70,000; private saving = $9,000;
national saving = $12,000.
Refer to Scenario 13-1. For this economy, taxes amount to
a. $28,000.
b. $38,000.
c. $41,000.
d. $44,000.
Figure 22-5
Use the graph below to answer the following questions.
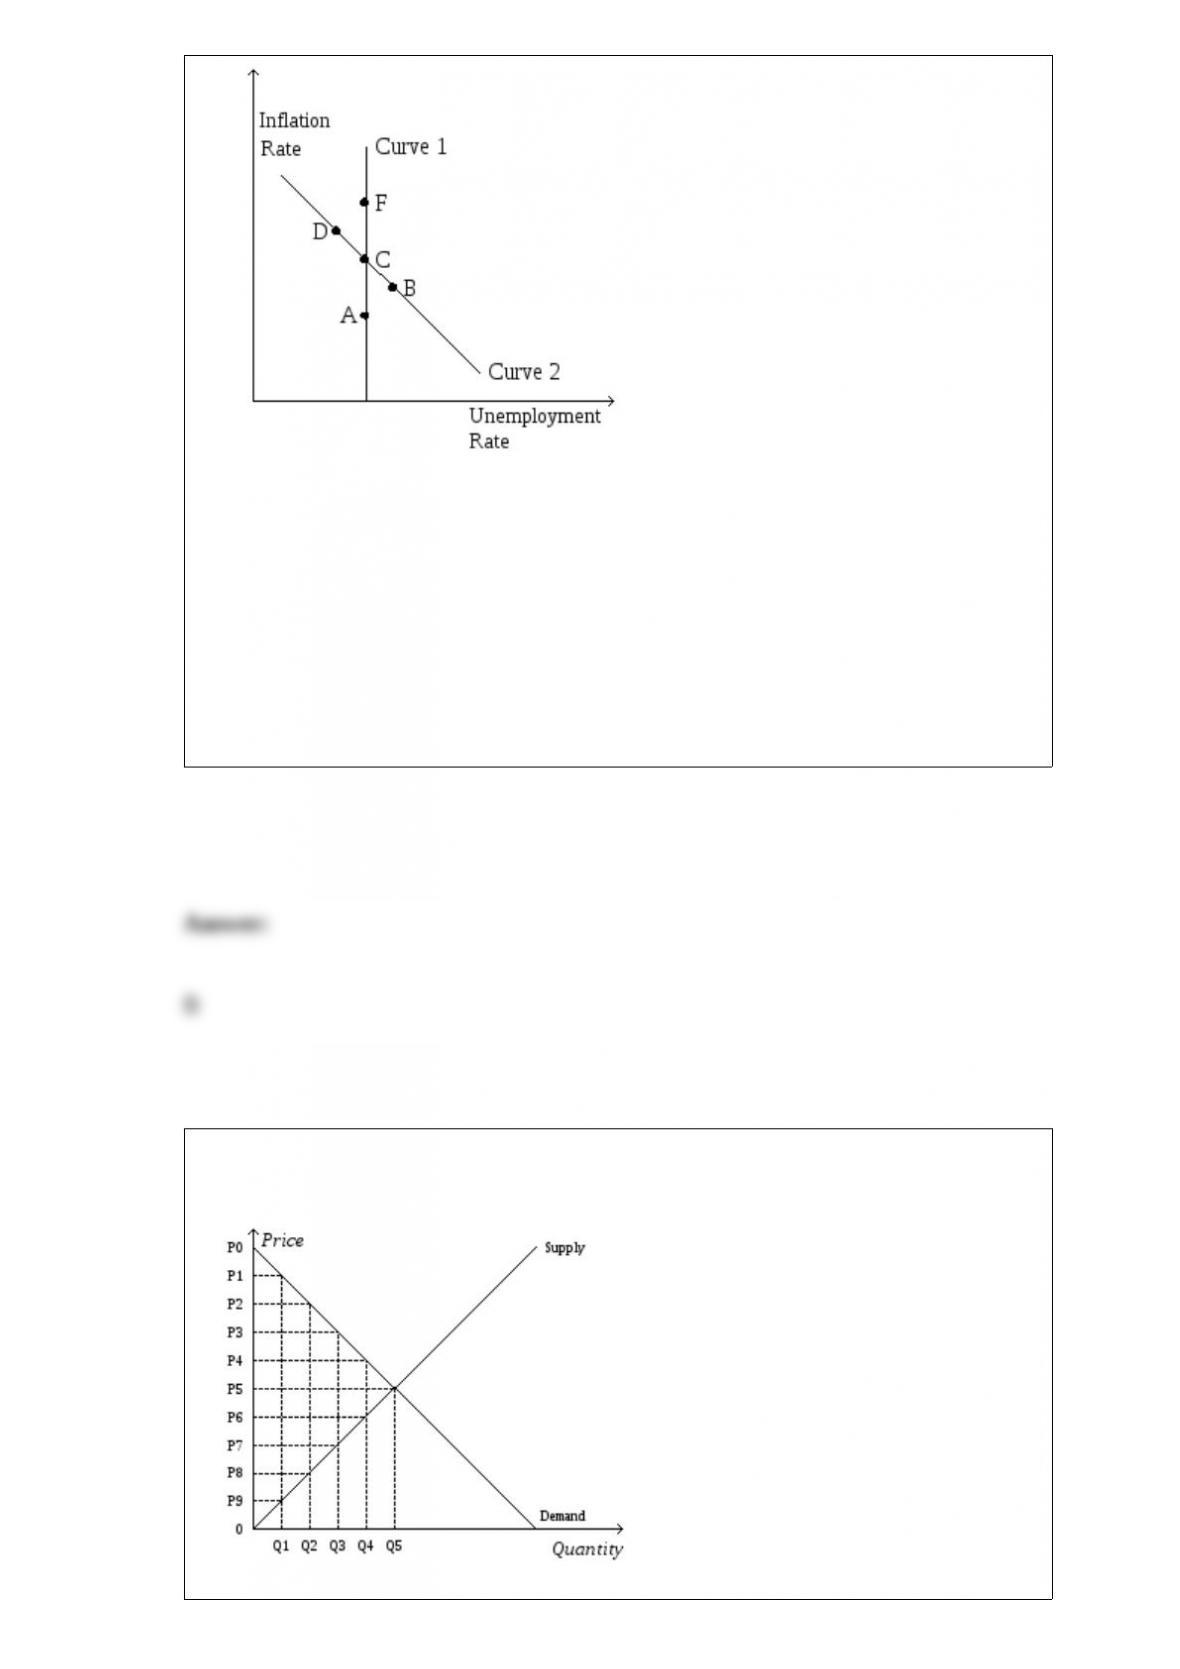
Refer to Figure 22-5. If the economy starts at C and the money supply growth rate
increases, then in the short run the economy moves to
a. B.
b. D.
c. F.
d. None of the above is consistent with an increase in the money supply growth rate.
Figure 8-10

Refer to Figure 8-10. Suppose the government imposes a tax that reduces the quantity
sold in the market after the tax to Q2. The price that sellers receive is
a. P0.
b. P2.
c. P5.
d. P8.
A favorable supply shock
a. raises unemployment and the inflation rate.
b. raises unemployment and reduces the inflation rate.
c. reduces unemployment and raises the inflation rate.
d. reduces unemployment and the inflation rate.
Figure 6-6
Refer to Figure 6-6. If the government imposes a price floor of $6 on this market, then
there will be
a. no surplus.
b. a surplus of 20 units.
c. a surplus of 30 units.
d. a surplus of 40 units.
Other things the same, the real exchange rate between U.S. and Belgian goods would be
higher if
a. prices in the U.S. were higher, or the number of euro the dollar purchased were
higher.
b. prices in the U.S. were higher, or the number of euro the dollar purchased were
lower.
c. prices in the U.S. were lower, or the number of euro the dollar purchased were higher.
d. prices in the U.S. were lower, or the number of euro the dollar purchased were lower.

If a good is inferior, then an increase in income will result in
a. an increase in the demand for the good.
b. a decrease in the demand for the good.
c. a movement down and to the right along the demand curve for the good.
d. a movement up and to the left along the demand curve for the good.
Government policies can change the costs and benefits that people face. Those policies
have the potential to
a. alter people’s behavior.
b. alter people’s decisions at the margin.
c. produce results that policymakers did not intend.
d. All of the above are correct.

Friedman argued that the Fed could use monetary policy to peg
a. the level of real GDP.
b. the growth rate of real GDP.
c. the rate of unemployment.
d. None of the above is correct.
If the nominal interest rate is 5 percent and the inflation rate is 2 percent, then what is
the real interest rate?
a. 10 percent
b. 7 percent
c. 3 percent
d. 2.5 percent
In the 1800s, Europeans purchased stock in American companies that used the funds to
build railroads and factories. The Europeans who did this engaged in
a. foreign portfolio investment.
b. indirect domestic investment.

c. foreign direct investment.
d. foreign indirect investment.
Suppose a basket of goods and services has been selected to calculate the CPI and 2004
has been selected as the base year. In 2002, the basket’s cost was $50; in 2004, the
basket’s cost was $52; and in 2006, the basket’s cost was $54.60. The value of the CPI
in 2006 was
a. 91.6.
b. 95.2.
c. 105.0.
d. 109.2.
The legal tender requirement means that
a. people are more likely to accept the dollar as a medium of exchange.
b. the government must hold enough gold to redeem all currency.
c. people may not make trades with anything else.
d. All of the above are correct.

The key determinant of the standard of living in a country is
a. the amount of goods and services produced from each hour of a worker’s time.
b. the total amount of goods and services produced within the country.
c. the total amount of its physical capital.
d. its growth rate of real GDP.
Your financial advisor tells you that if you earn the historical rate of return on a certain
mutual fund, then in three years your $20,000 will grow to $23,152.50. What rate of
interest does your financial advisor expect you to earn?
a. 5 percent
b. 6 percent
c. 7 percent
d. 8 percent

If wages for accountants rose, then accountants’ leisure time would have a lower
opportunity cost.
The Congressional Budget Office, which is staffed by economists, provides Congress
with independent evaluations of policy proposals.
Trade allows a person to obtain goods at prices that are less than that person’s
opportunity cost because each person specializes in the activity for which he or she has
the lower opportunity cost.

Both full-time and part-time workers are included in the Bureau of Labor Statistics’
“employed” category.
If the quality of a good deteriorates from one year to the next while its price remains the
same, then the value of a dollar falls.
Why might government expenditures be more appropriate than tax cuts to counter
recessions? Is there any evidence for this thinking?
Risk-averse individuals like good things more than they dislike comparable bad things.

Increased output and prices in the United States in the early 1940s were mostly the
result of increased government expenditures.
A decrease in supply will cause an increase in price, which will cause a decrease in
quantity demanded.
The rule of 70 applies to a growing savings account but not to a growing economy.

Economists agree that if a monetary policy rule is to be used, the best one makes the
growth rate of the money supply constant.
When two variables move in the same direction, the curve relating them is downward
sloping, and we say the variables are negatively related.
The money supply of Granov is $10,000 in a 100-percent-reserve banking system. If the
Central Bank of Granov decreases the reserve requirement ratio to 10 percent, the
money supply could increase by no more than $9,000.
Rent-control laws dictate a minimum rent that landlords may charge tenants.

Diversification cannot reduce market risk.