A graphical portrayal of a quantitative data set that divides the data into classes and
gives the frequency of each class is a(n) ___________.
A. ogive plot
B. dot plot
C. histogram
D. Pareto chart
E. bar chart
During the past six months, 73.2 percent of US households purchased sugar. Assume
that these expenditures are approximately normally distributed with a mean of $8.22
and a standard deviation of $1.10. What proportion of the households spent between
$5.00 and $9.00 on sugar?
A. .7611
B. .7628
C. .0017
D. .7594
The _____________ measures the strength of the linear relationship between the
dependent variable and the independent variable.
A. correlation coefficient
B. distance value
C. Y-intercept
D. residual
Consider the following data.
Create a stem-and-leaf display for the sample.

The random variable x has a uniform distribution when x lies between the values of 4
and 10. When x = 10, what is the value of f(x)?
A. 0
B. 1
C. 1/6
D. 1/14
The state agriculture department tested 203 fuel samples across the state in 2009 for
accuracy of the reported octane level. For premium grade, 14 out of 105 samples failed.
Find a 99 percent confidence interval for the true population proportion of premium
grade fuel-quality failures.
A. [.045, .221]
B. [.068, .198]
C. [.023, .115]
D. [.048, .219]
E. [.100, .276]

The least squares point estimates of the simple linear regression model minimize the
____________.
A. SS error
B. total variance
C. MS error
D. explained variance
The number of items rejected daily by a manufacturer because of defects for the last 30
days are:
20, 21, 8, 17, 22, 19, 18, 19, 14, 17, 11, 6, 21, 25, 4, 19, 9, 12, 16, 16, 10, 28, 24, 6, 21,
20, 25, 5, 17, 8
How many classes should be used in constructing a histogram?
A. 6
B. 5
C. 7
D. 4
E. 8
A(n) _____________ hypothesis is the statement that is being tested. It usually
represents the status quo, and it is not rejected unless there is convincing sample
evidence that it is false.
A. research
B. alternative
C. null
D. true
The Post Office has established a record in a major midwestern city for delivering 90
percent of its local mail the next working day. If you mail eight local letters, what is the
probability that all of them will be delivered the next day?
A. 1.0
B. .4305
C. .8131
D. .5695
Independently, a coin is tossed, a card is drawn from a deck, and a die is thrown. What
is the probability of observing a head on the coin, an ace on the card, and a five on the
die?

A. 0.0064
B. 0.1000
C. 0.7436
D. 0.0096
E. 0.5000
The number of degrees of freedom associated with a chi-square test for independence
based upon a contingency table with 4 rows and 3 columns is _____.
A. 7
B. 12
C. 5
D. 6
A fair die is rolled 10 times. What is the probability that an odd number (1, 3, or 5) will
occur fewer than 3 times?
A. .0547
B. .1172
C. .1550
D. .7752
E. .8450
A car insurance company would like to determine the proportion of accident claims
covered by the company. According to a preliminary estimate, 60 percent of the claims
are covered. How large a sample should be taken to estimate the proportion of accident
claims covered by the company if we want to be 98 percent confident that the sample
percentage is within 3 percent of the actual percentage of the accidents covered by the
insurance company?
A. 348
B. 1508
C. 1887
D. 1442

A survey is made in a neighborhood of 80 voters. 65 are Democrats and 15 are
Republicans. Of the Democrats, 35 are women, while 5 of the Republicans are women.
If one subject from the group is randomly selected, find the probability the individual is
either a woman or a Democrat.
A. .538
B. .813
C. .500
D. .438
E. .875
In the upcoming election for governor, the most recent poll, based on 900 respondents,
predicts that the incumbent will be reelected with 55 percent of the votes. For the sake
of argument, assume that 51 percent of the actual voters in the state support the
incumbent governor (p = 0.51). Calculate the probability of observing a sample
proportion of voters 0.55 or higher supporting the incumbent governor.
A. .0166
B. .0247
C. .0082
D. .9918
A local company makes a candy that is supposed to weigh 1.00 ounces. A random

sample of 25 pieces of candy produces a mean of 0.996 ounces with a standard
deviation of 0.004 ounces. How many pieces of candy must we sample if we want to be
99 percent confident that the sample mean is within 0.001 ounces of the true mean?
A. 126
B. 124
C. 107
D. 12
E. 6
A tire manufacturer needs to determine the amount of production for the coming month
(high vs. low). The level of production largely depends on the level of demand. For this
situation, the amount of production constitutes the ___________________ actions.
A. alternative
B. utility
C. certainty
D. uncertainty
___________ refers to describing the important aspects of a set of measurements.
A. Cross-sectional analysis
B. Runs plot
C. Descriptive statistics
D. Time series analysis
As a general rule, when creating a stem-and-leaf display, there should be ______ stem
values.
A. between 3 and 10
B. between 1 and 100
C. no fewer than 20
D. between 5 and 20
An apple juice producer buys all his apples from a conglomerate of apple growers in
one northwestern state. The amount of juice obtained from each of these apples is
approximately normally distributed with a mean of 2.25 ounces and a standard
deviation of 0.15 ounce. What is the probability that a randomly selected apple will
contain between 2.00 and 2.50 ounces?

A. .500
B. .905
C. .9525
D. .9544
A unit that fails to meet specifications is called a _____________ unit.
A. conforming
B. capable
C. defective
D. common cause
For the following hypothesis test, where H0: μ ≤ 10; vs. HA: μ > 10, we reject H0 at
level of significance α and conclude that the true mean is greater than 10, when the true
mean is really 14. Based on this information, we can state that we have
A. made a Type I error.
B. made a Type II error.
C. made a correct decision.
D. increased the power of the test.

A sequence of steadily increasing plot points on a control chart is referred to as
___________.
A. funneling
B. a run up
C. a cycle
D. out of control
Suppose that 60 percent of the voters in a particular region support a candidate. Find the
probability that a sample of 1,000 voters would yield a sample proportion in favor of
the candidate within 2 percentage points.
A. .9015
B. .8030
C. .0155
D. .7939
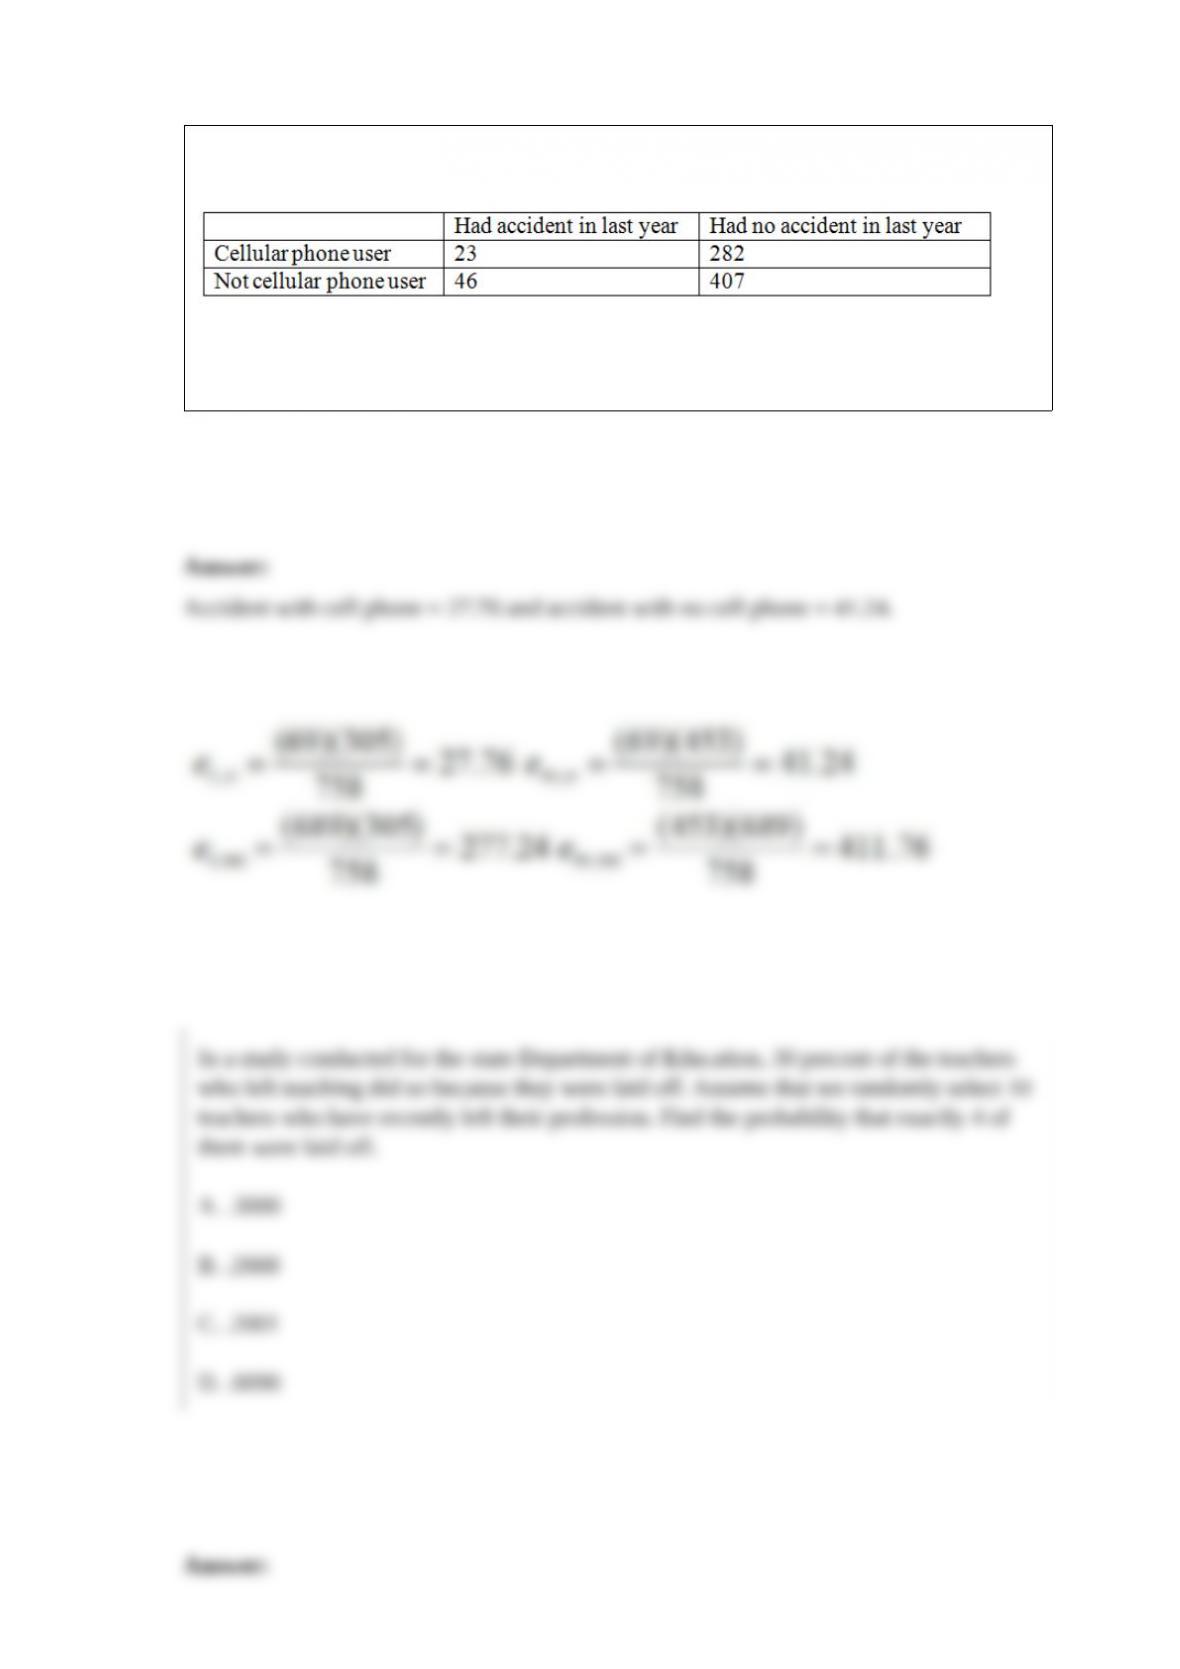
A study of car accidents and drivers who use cell phones collects the following sample
data.
Determine the expected frequencies of those who had accidents in the last year to use
for the chi-square test of independence.
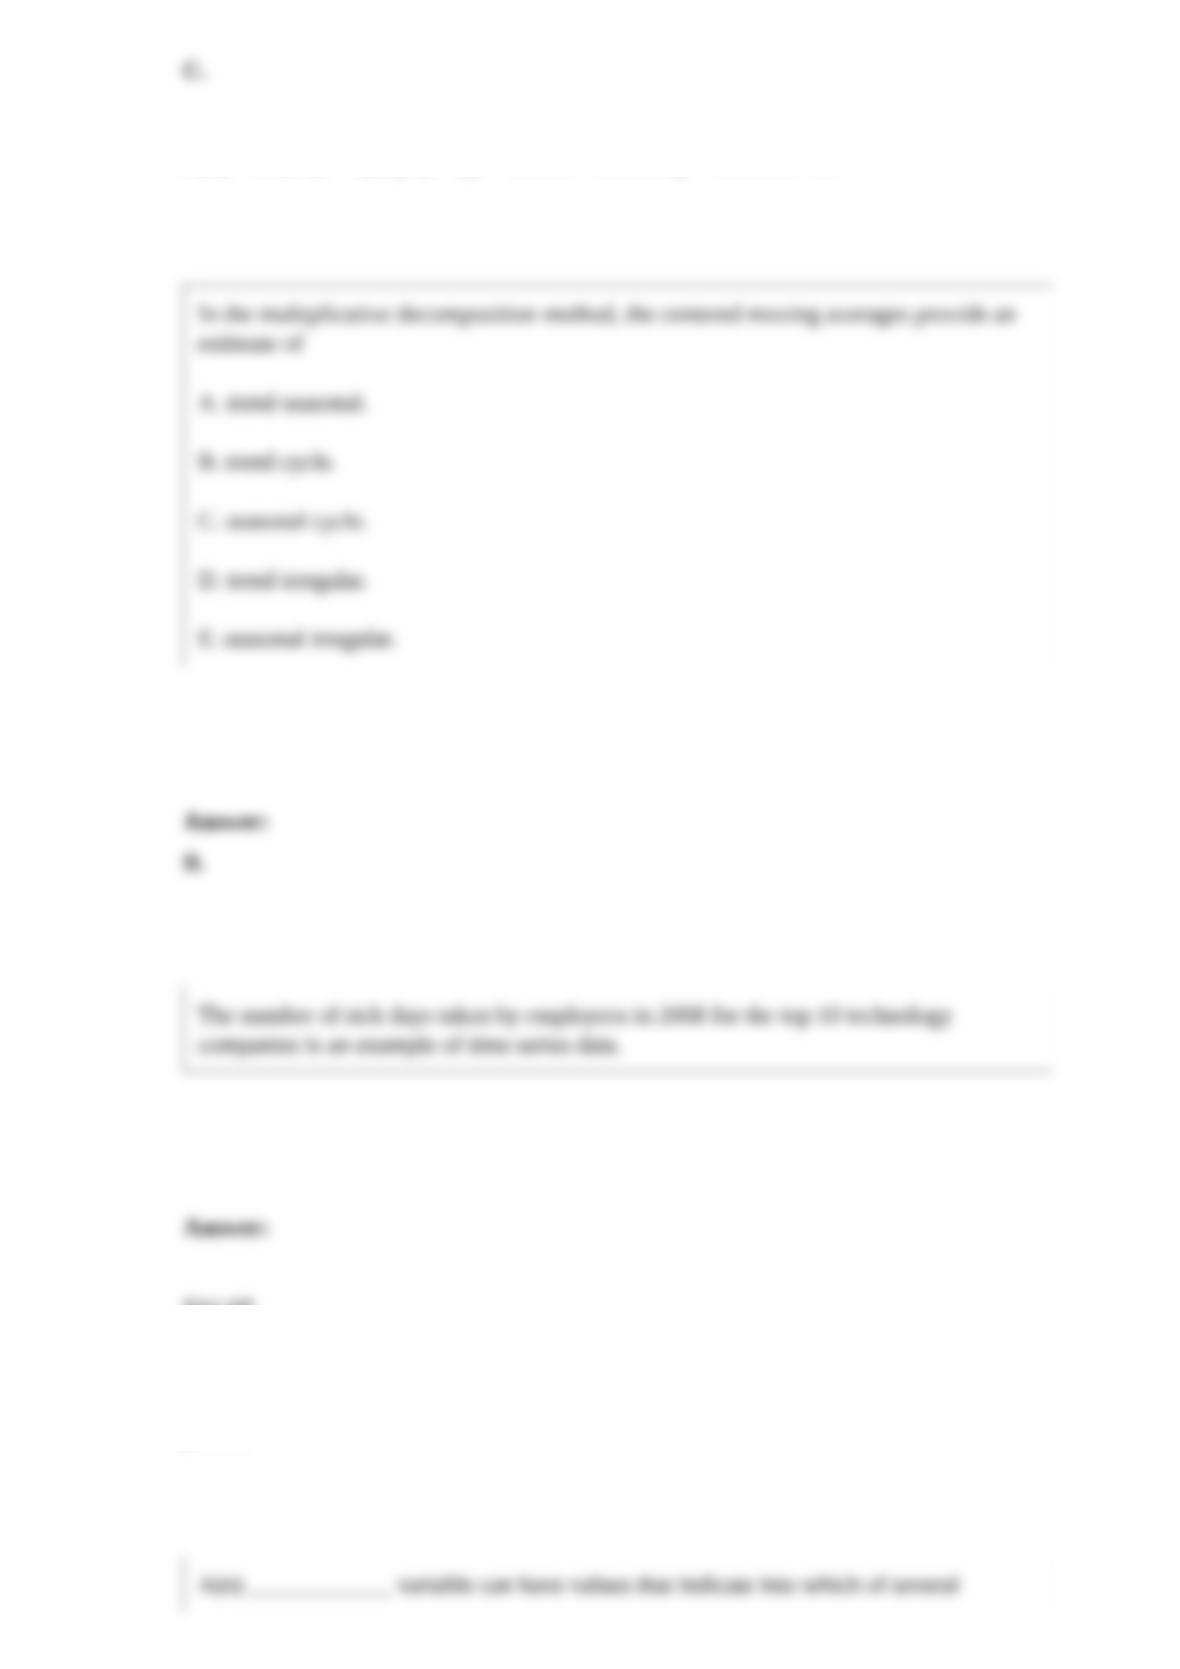
In the multiplicative decomposition method, the centered moving averages provide an
estimate of
A. trend seasonal.
B. trend cycle.
C. seasonal cycle.
D. trend irregular.
E. seasonal irregular.
The number of sick days taken by employees in 2008 for the top 10 technology
companies is an example of time series data.
A(n) ____________ variable can have values that indicate into which of several
categories of a population it belongs.
A. qualitative
B. quantitative
C. ratio
D. interval
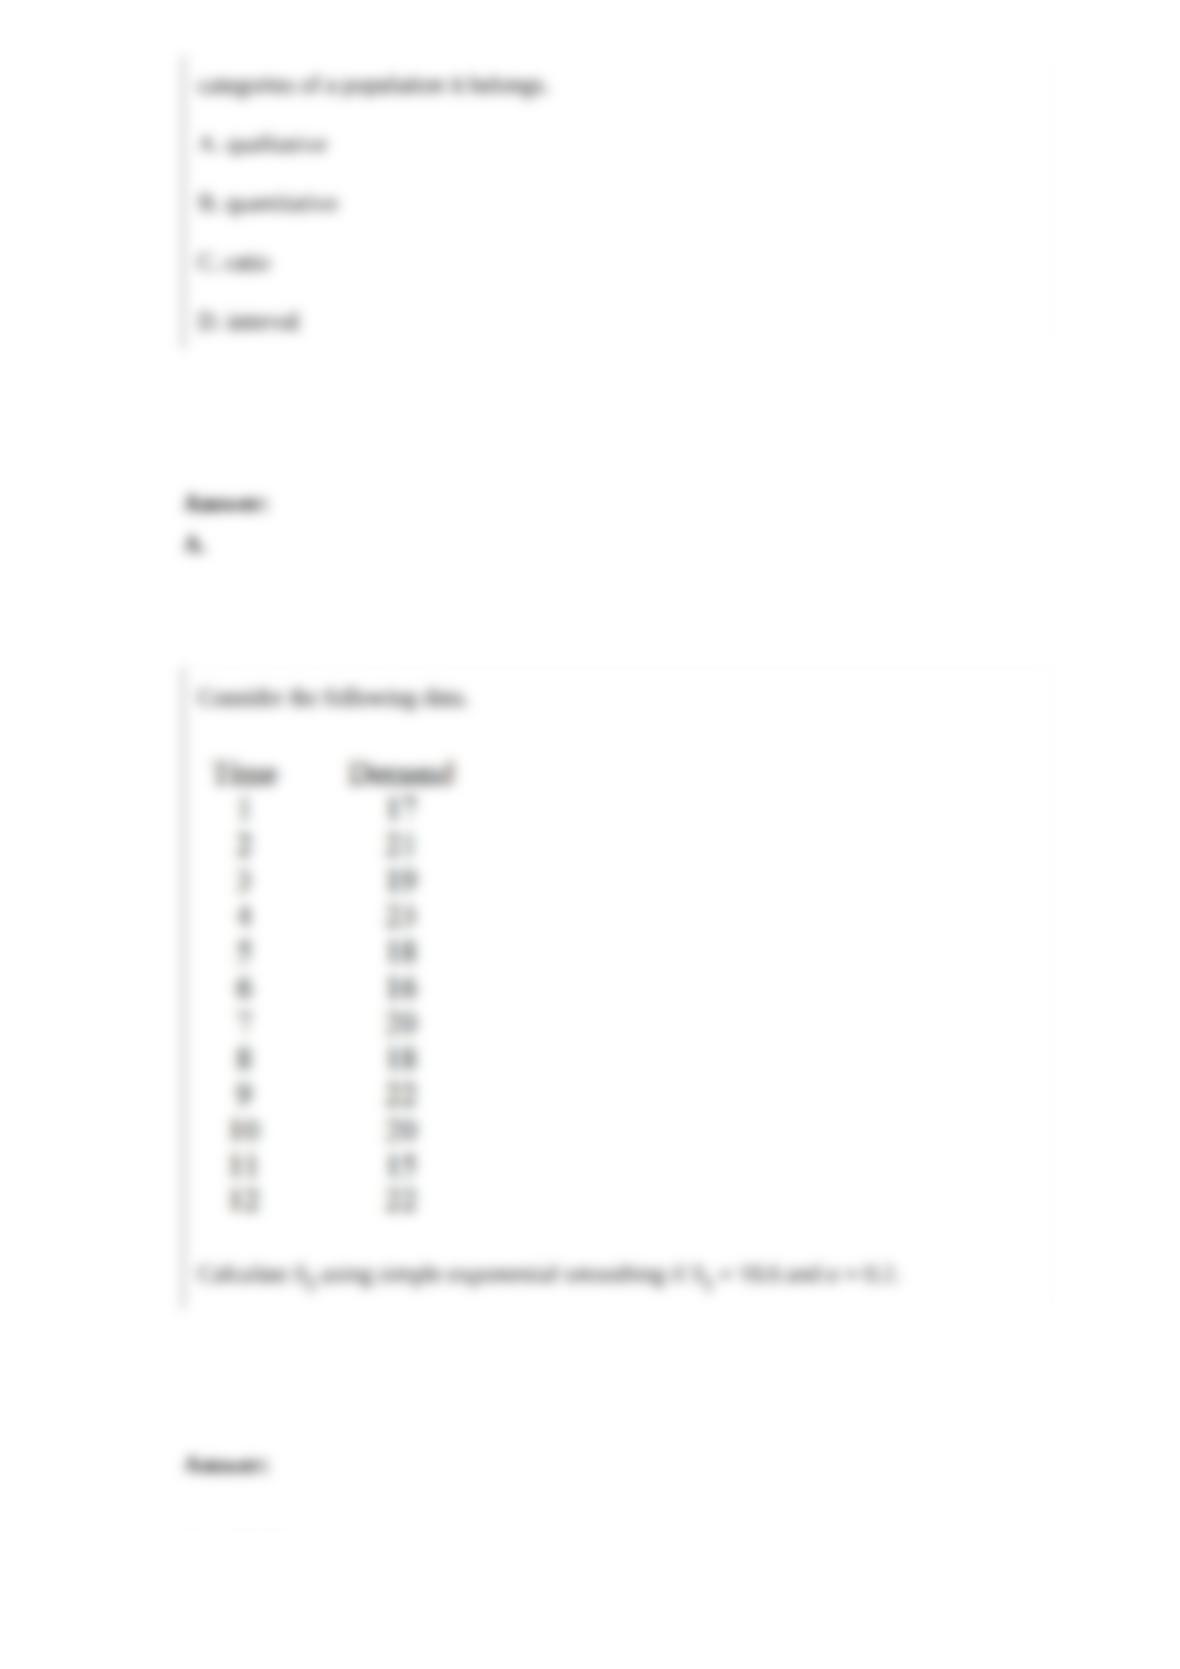
Consider the following data.
Calculate S3 using simple exponential smoothing if S1 = 18.6 and α = 0.2.
If the random variable X has a mean of and a standard deviation σ, then the mean and
standard deviation, respectively, of (X − )/σ are
A. μ and σ.
B. and s.
C. 1 and 0.
D. 0 and 1.
The ___________ of two events A and B is the event that consists of the sample space
outcomes belonging to both event A and event B.
A. union
B. intersection
C. complement
D. mutual exclusivity
In a market research study conducted by a local winery on white wine preference, the
following results were found. Of a sample of 500 men, 120 preferred white wine. Of a
sample of 500 women, 210 preferred white wine. Set up the alternative hypothesis that
will test the claim that the percentage of women who prefer white wine is 25 percent
higher than the percentage of men who prefer white wine.
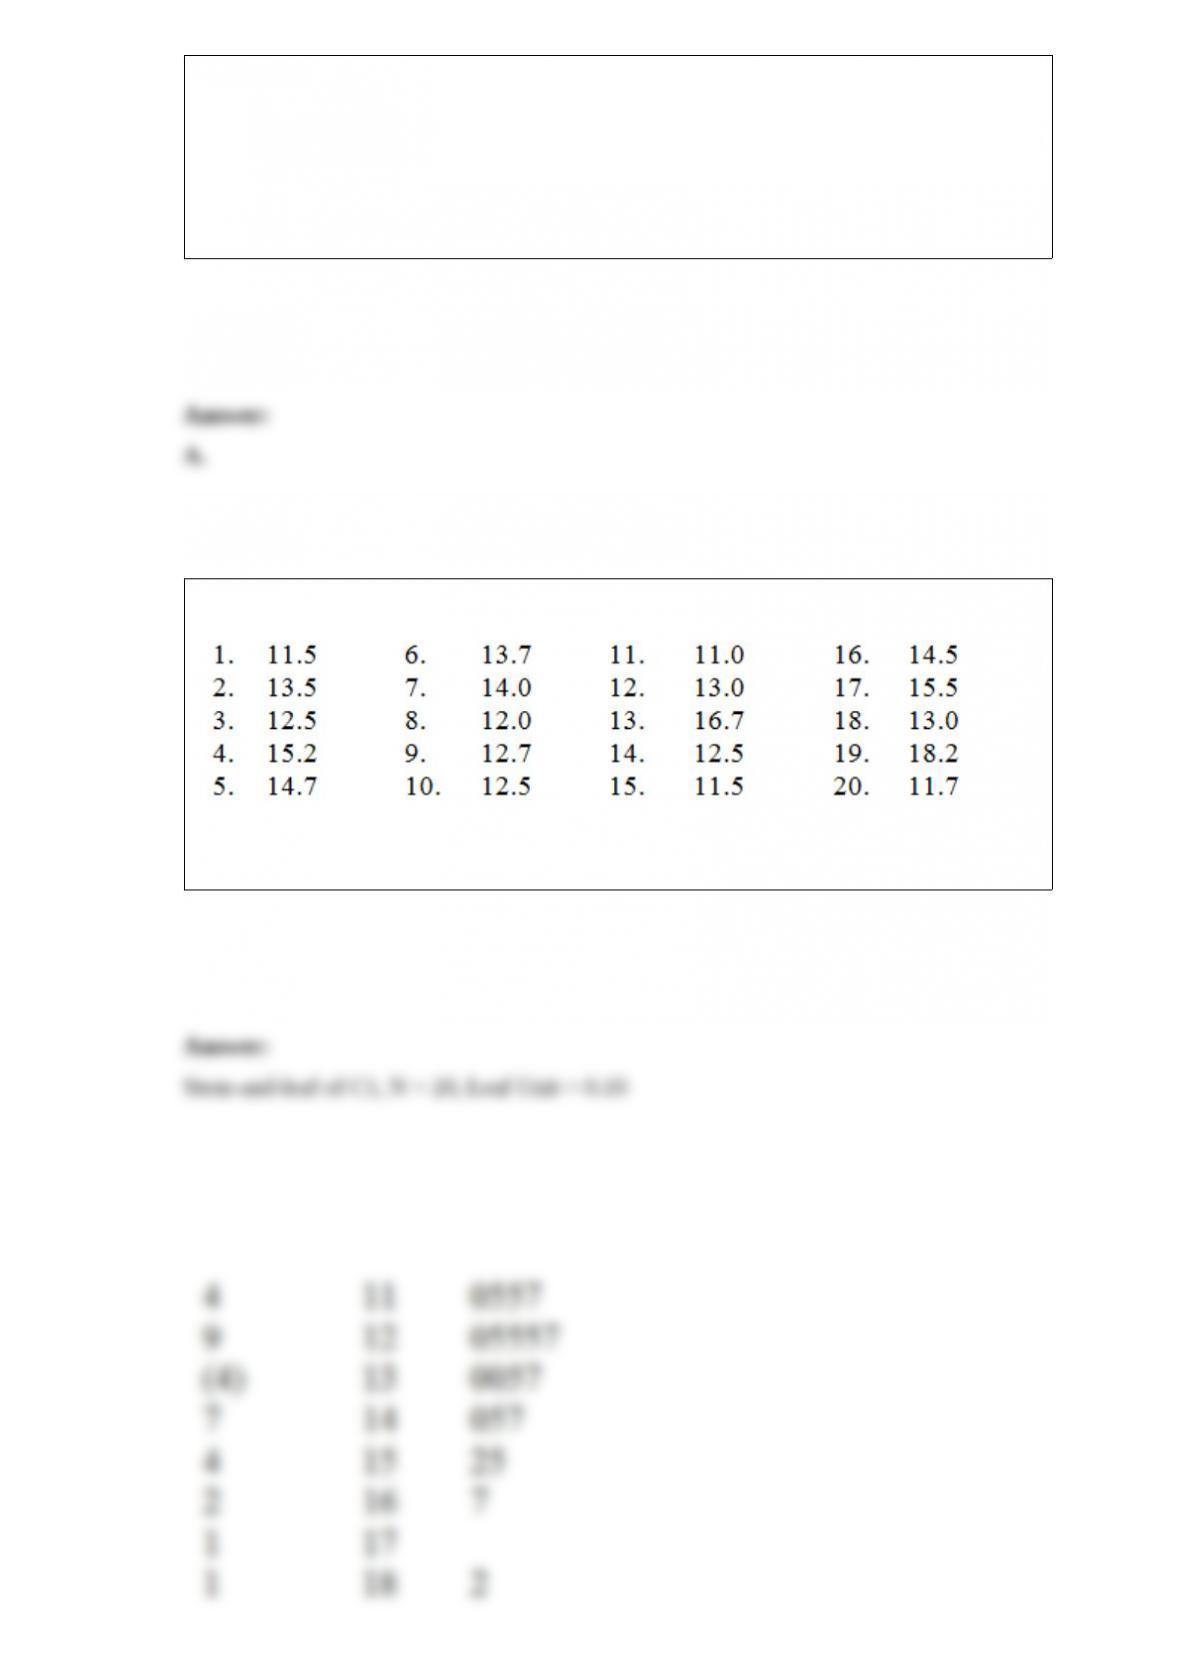
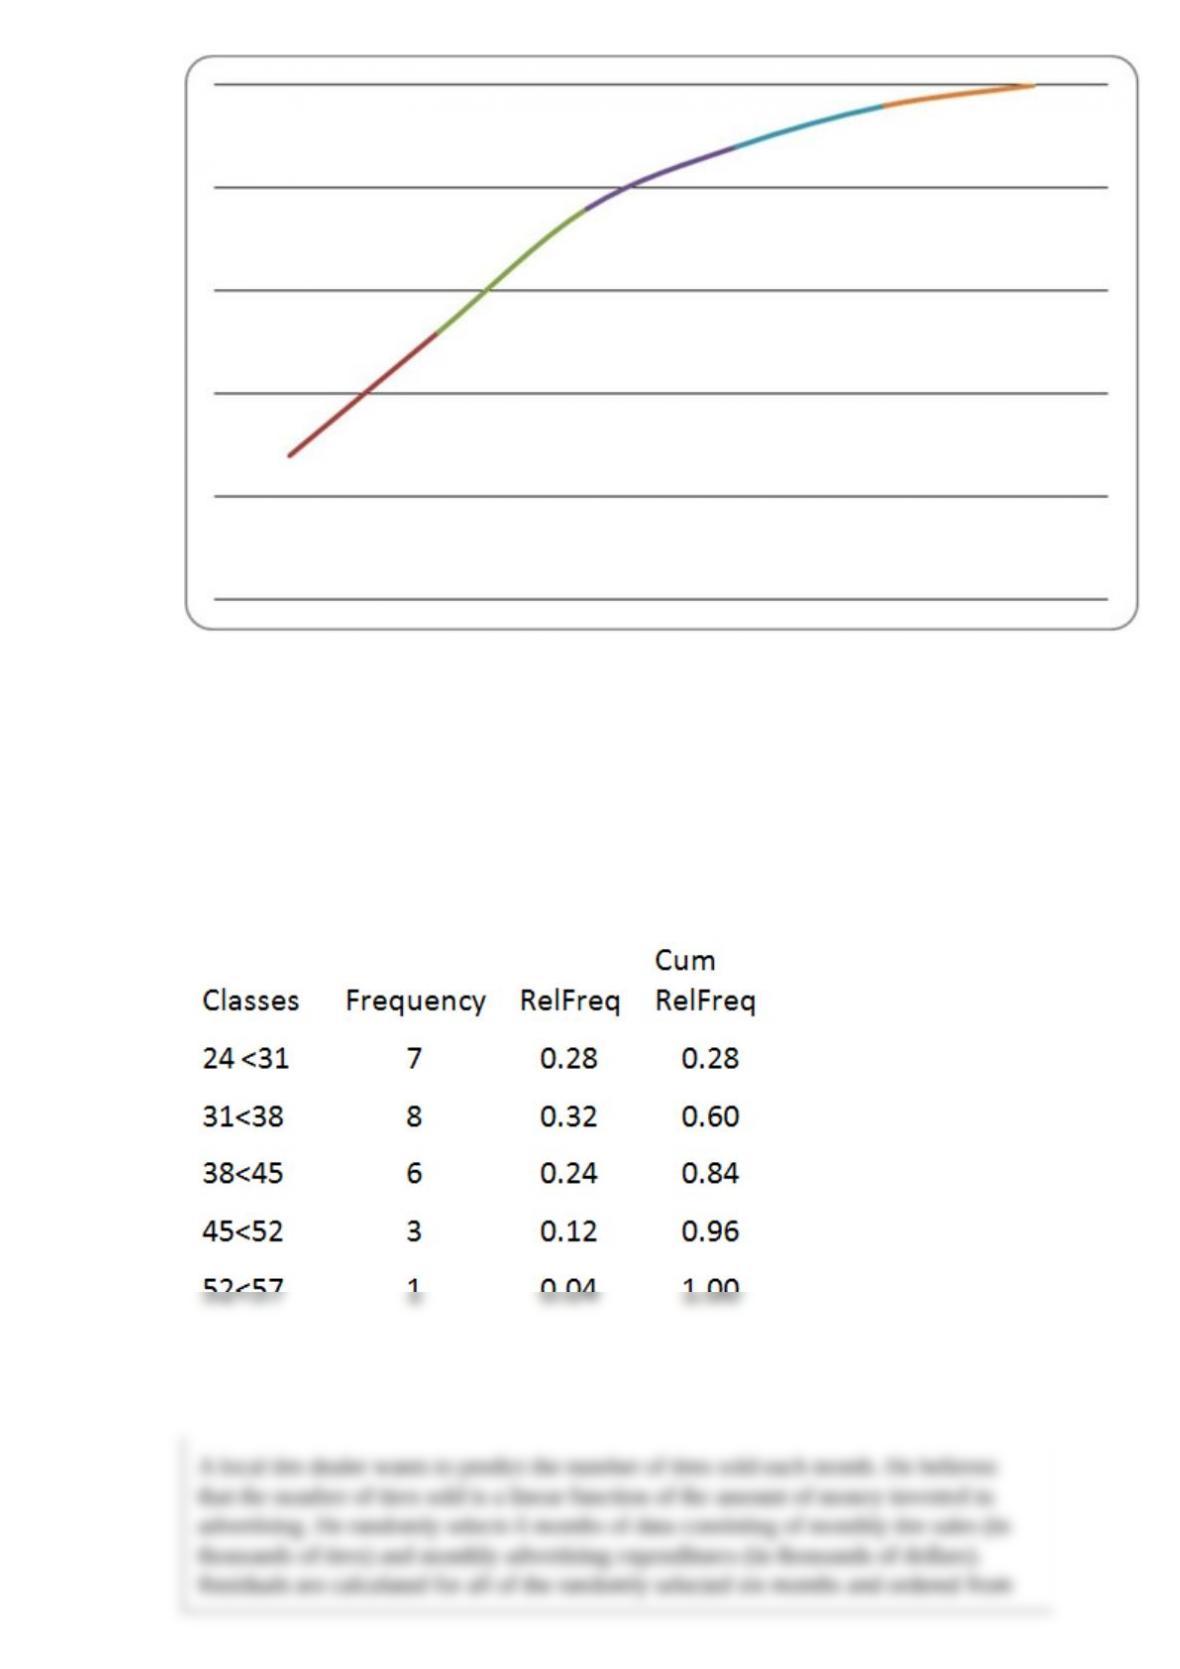
The number of weekly sales calls by a sample of 25 pharmaceutical salespersons is
below.
24, 56, 43, 35, 37, 27, 29, 44, 34, 28, 33, 28, 46, 31, 38, 41, 48, 38, 27, 29, 37, 33, 31,
40, 50
Construct an ogive plot.
A local tire dealer wants to predict the number of tires sold each month. He believes
that the number of tires sold is a linear function of the amount of money invested in
advertising. He randomly selects 6 months of data consisting of monthly tire sales (in
thousands of tires) and monthly advertising expenditures (in thousands of dollars).
Residuals are calculated for all of the randomly selected six months and ordered from
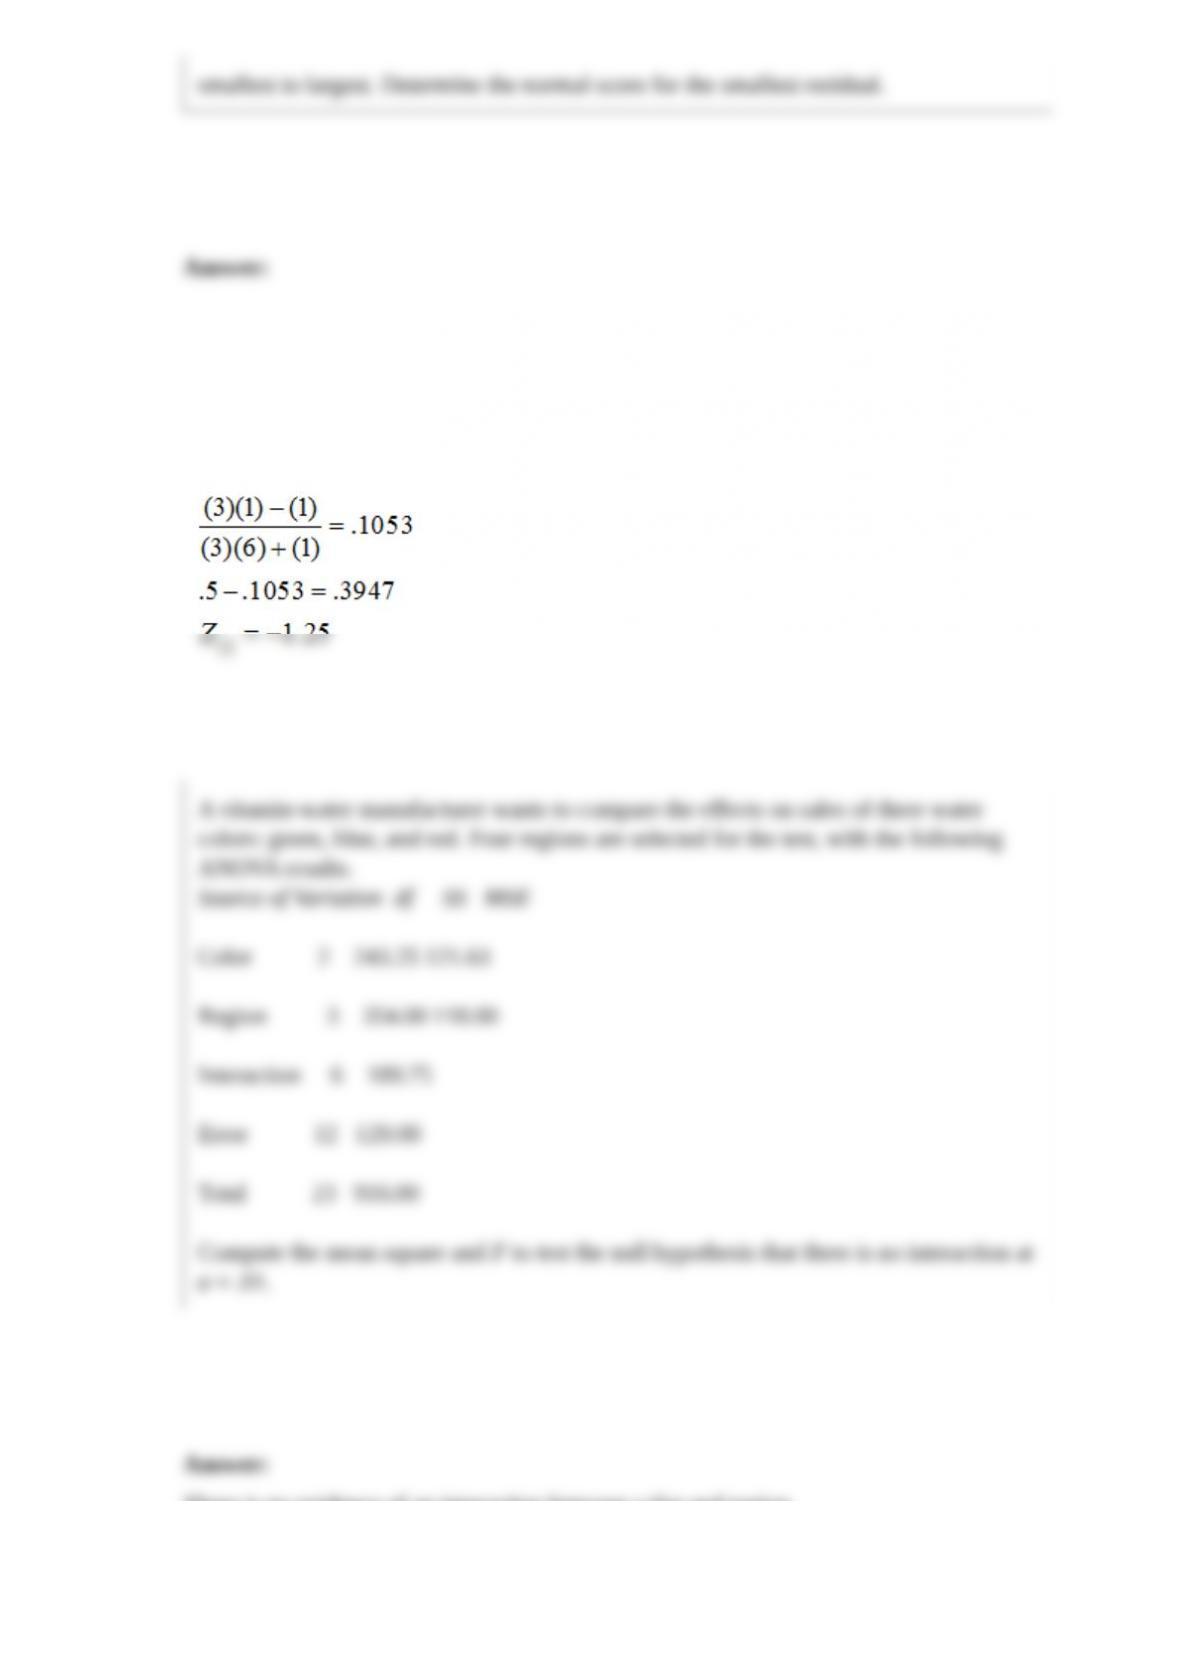
smallest to largest. Determine the normal score for the smallest residual.
A vitamin-water manufacturer wants to compare the effects on sales of three water
colors: green, blue, and red. Four regions are selected for the test, with the following
ANOVA results.
Source of Variation df SS MSE
Color 2 243.25 121.63
Region 3 354.00 118.00
Interaction 6 189.75
Error 12 129.00
Total 23 916.00
Compute the mean square and F to test the null hypothesis that there is no interaction at
α = .01.
In the past, of all the students enrolled in Basic Business Statistics, 10 percent earned an
A, 20 percent earned a B, 30 percent earned a C, 20 percent earned a D, and the
remainder failed the course. Dr. Johnson is a new professor teaching Basic Business
Statistics for the first time this semester. At the conclusion of the semester, of his 60
students, 10 had earned an A, 20 a B, 20 a C, 5 a D, and 5 received an F. Assume that
the class constitutes a random sample. Dr. Johnson wants to know if there is sufficient
evidence to conclude that the grade distribution of his class is different from the
historical grade distribution. Calculate the expected values for a B and for a C.
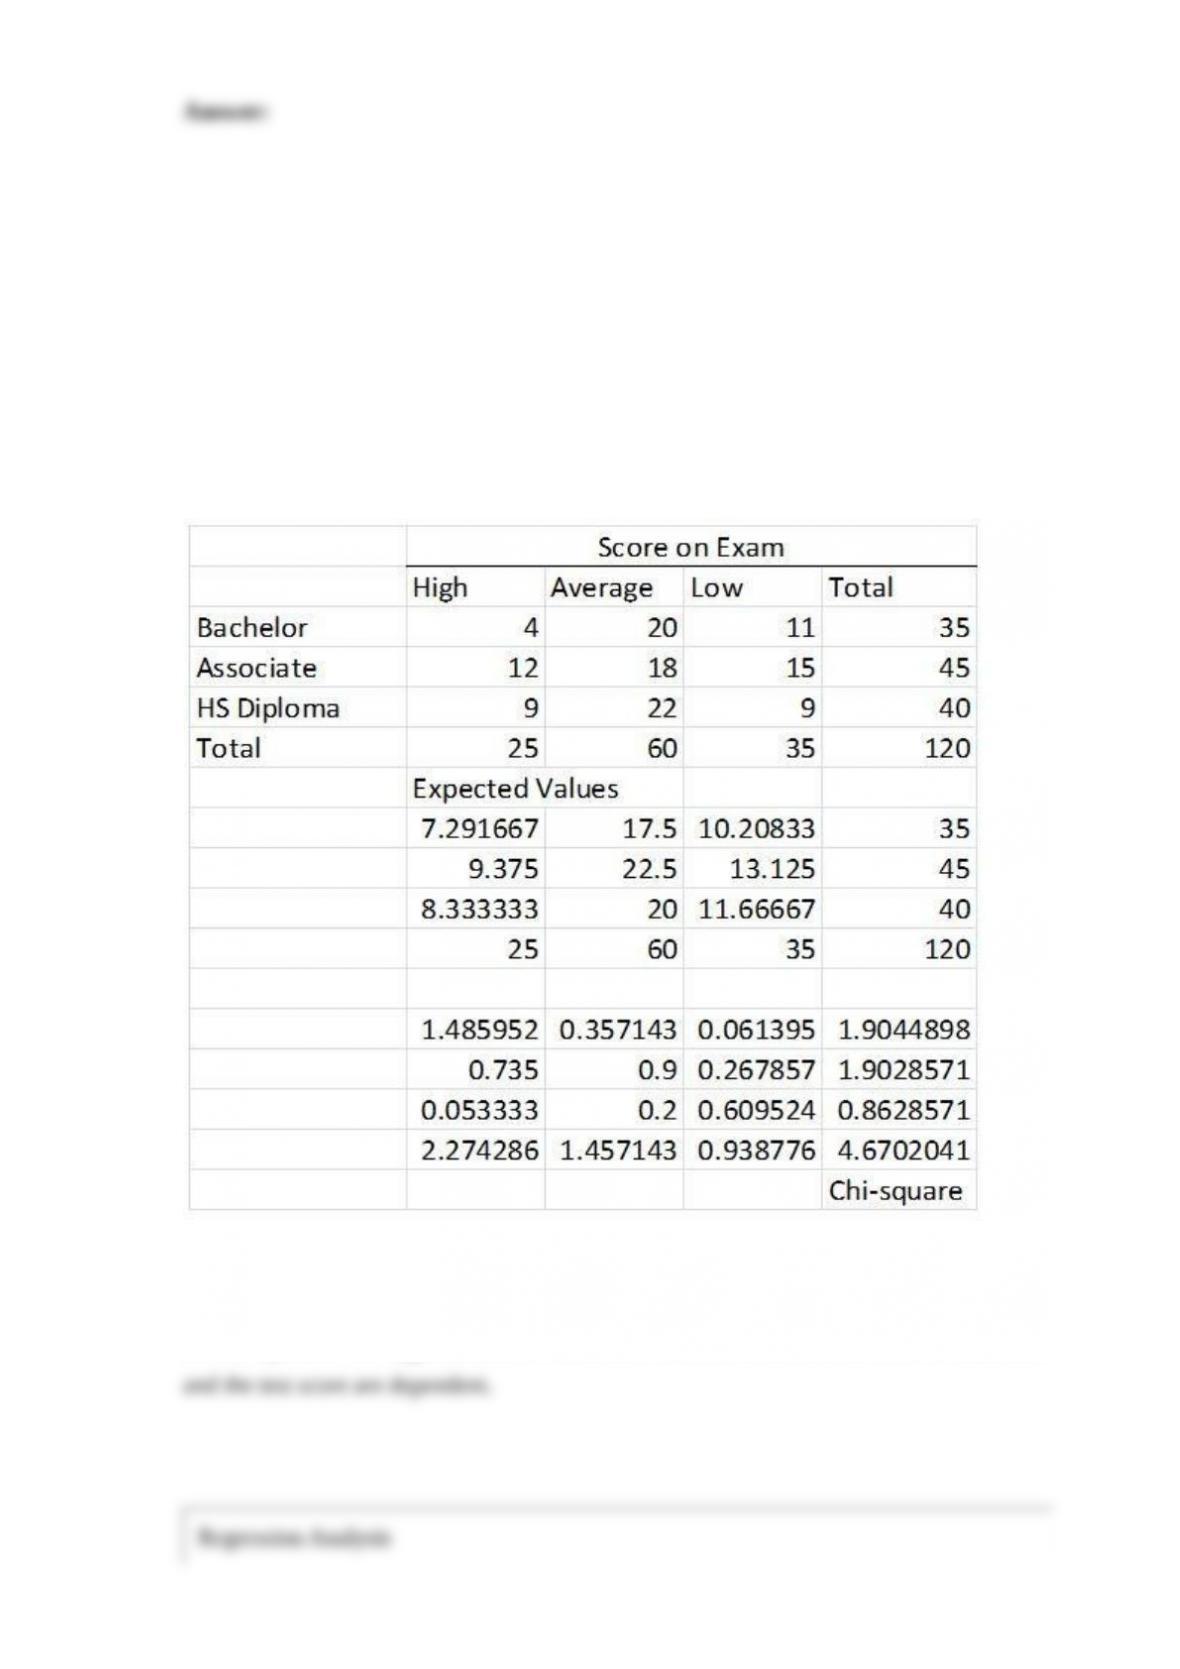
The HR manager of a major office supply chain is interested in determining whether
employee educational level affects knowledge of their job. An exam was given to 120
employees. The results are below.
Test the null hypothesis that score is independent of education level at α = .01.
Regression Analysis
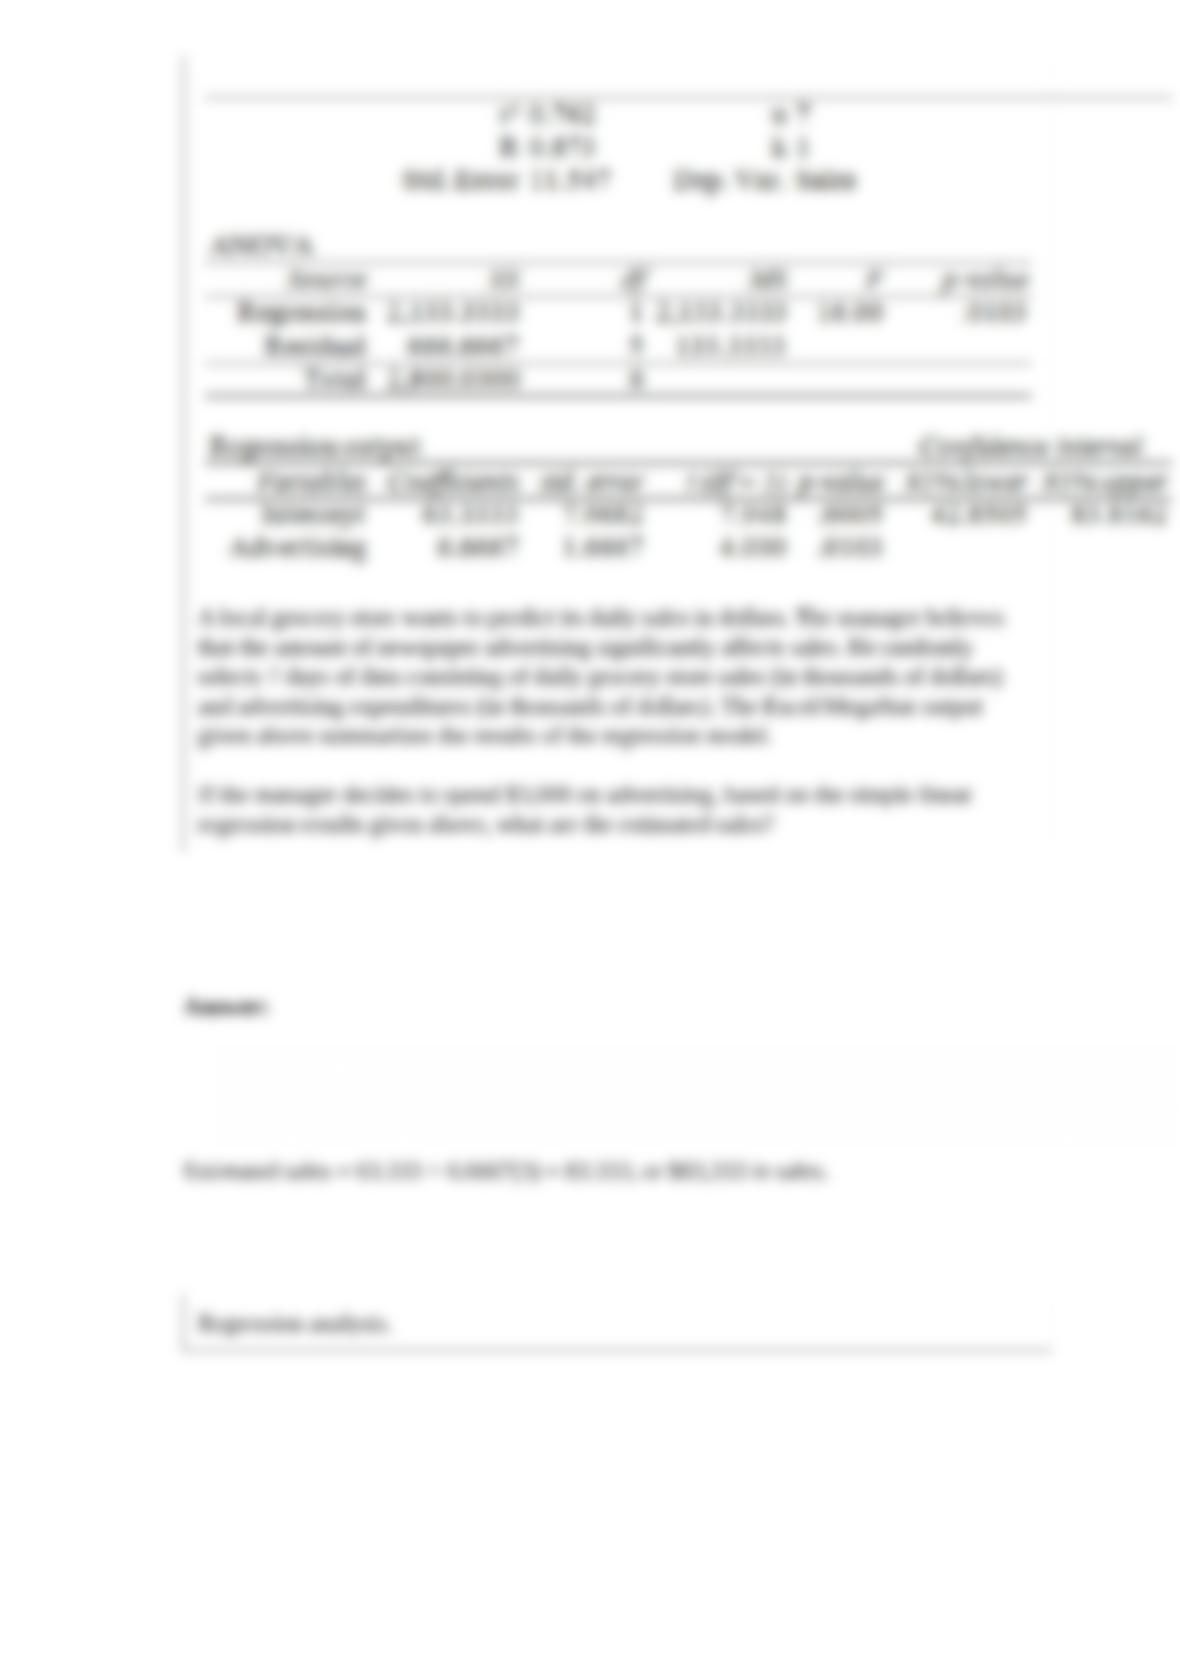
A local grocery store wants to predict its daily sales in dollars. The manager believes
that the amount of newspaper advertising significantly affects sales. He randomly
selects 7 days of data consisting of daily grocery store sales (in thousands of dollars)
and advertising expenditures (in thousands of dollars). The Excel/MegaStat output
given above summarizes the results of the regression model.
If the manager decides to spend $3,000 on advertising, based on the simple linear
regression results given above, what are the estimated sales?
Regression analysis.
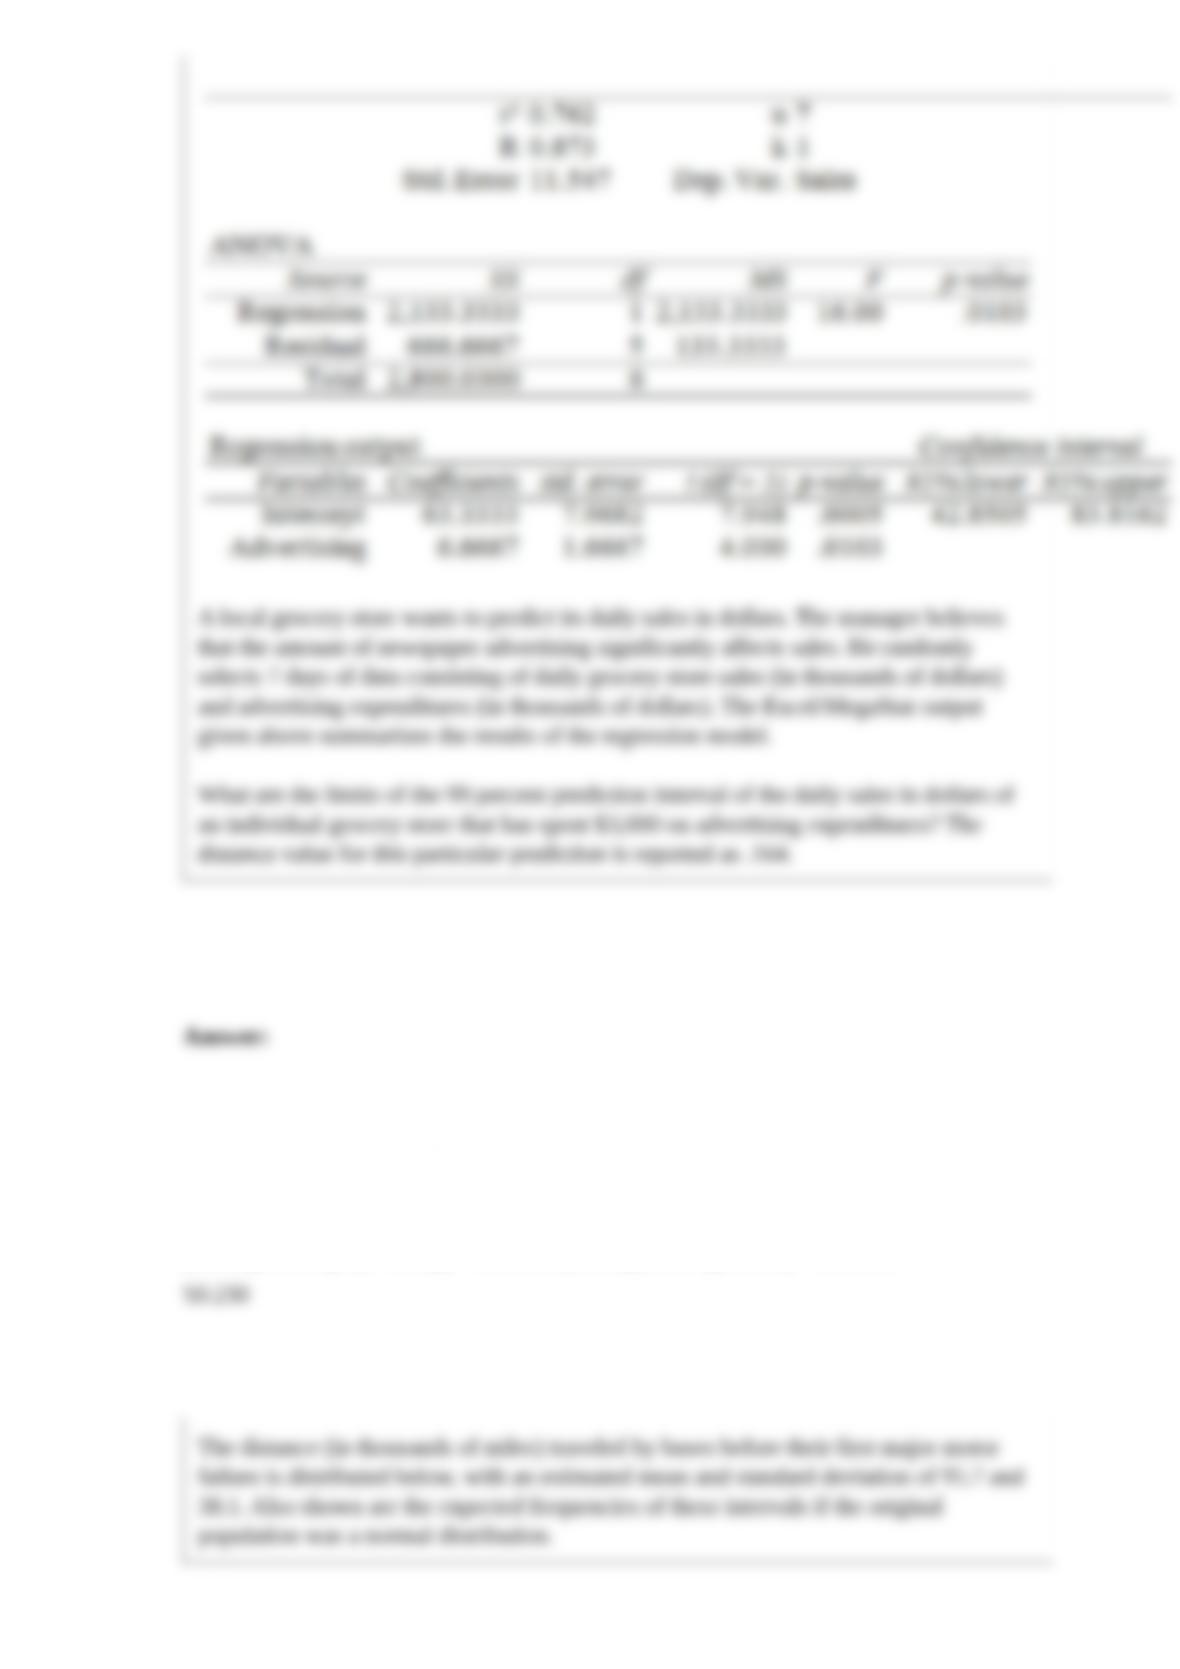
A local grocery store wants to predict its daily sales in dollars. The manager believes
that the amount of newspaper advertising significantly affects sales. He randomly
selects 7 days of data consisting of daily grocery store sales (in thousands of dollars)
and advertising expenditures (in thousands of dollars). The Excel/MegaStat output
given above summarizes the results of the regression model.
What are the limits of the 99 percent prediction interval of the daily sales in dollars of
an individual grocery store that has spent $3,000 on advertising expenditures? The
distance value for this particular prediction is reported as .164.
The distance (in thousands of miles) traveled by buses before their first major motor
failure is distributed below, with an estimated mean and standard deviation of 95.7 and
38.1. Also shown are the expected frequencies of these intervals if the original
population was a normal distribution.
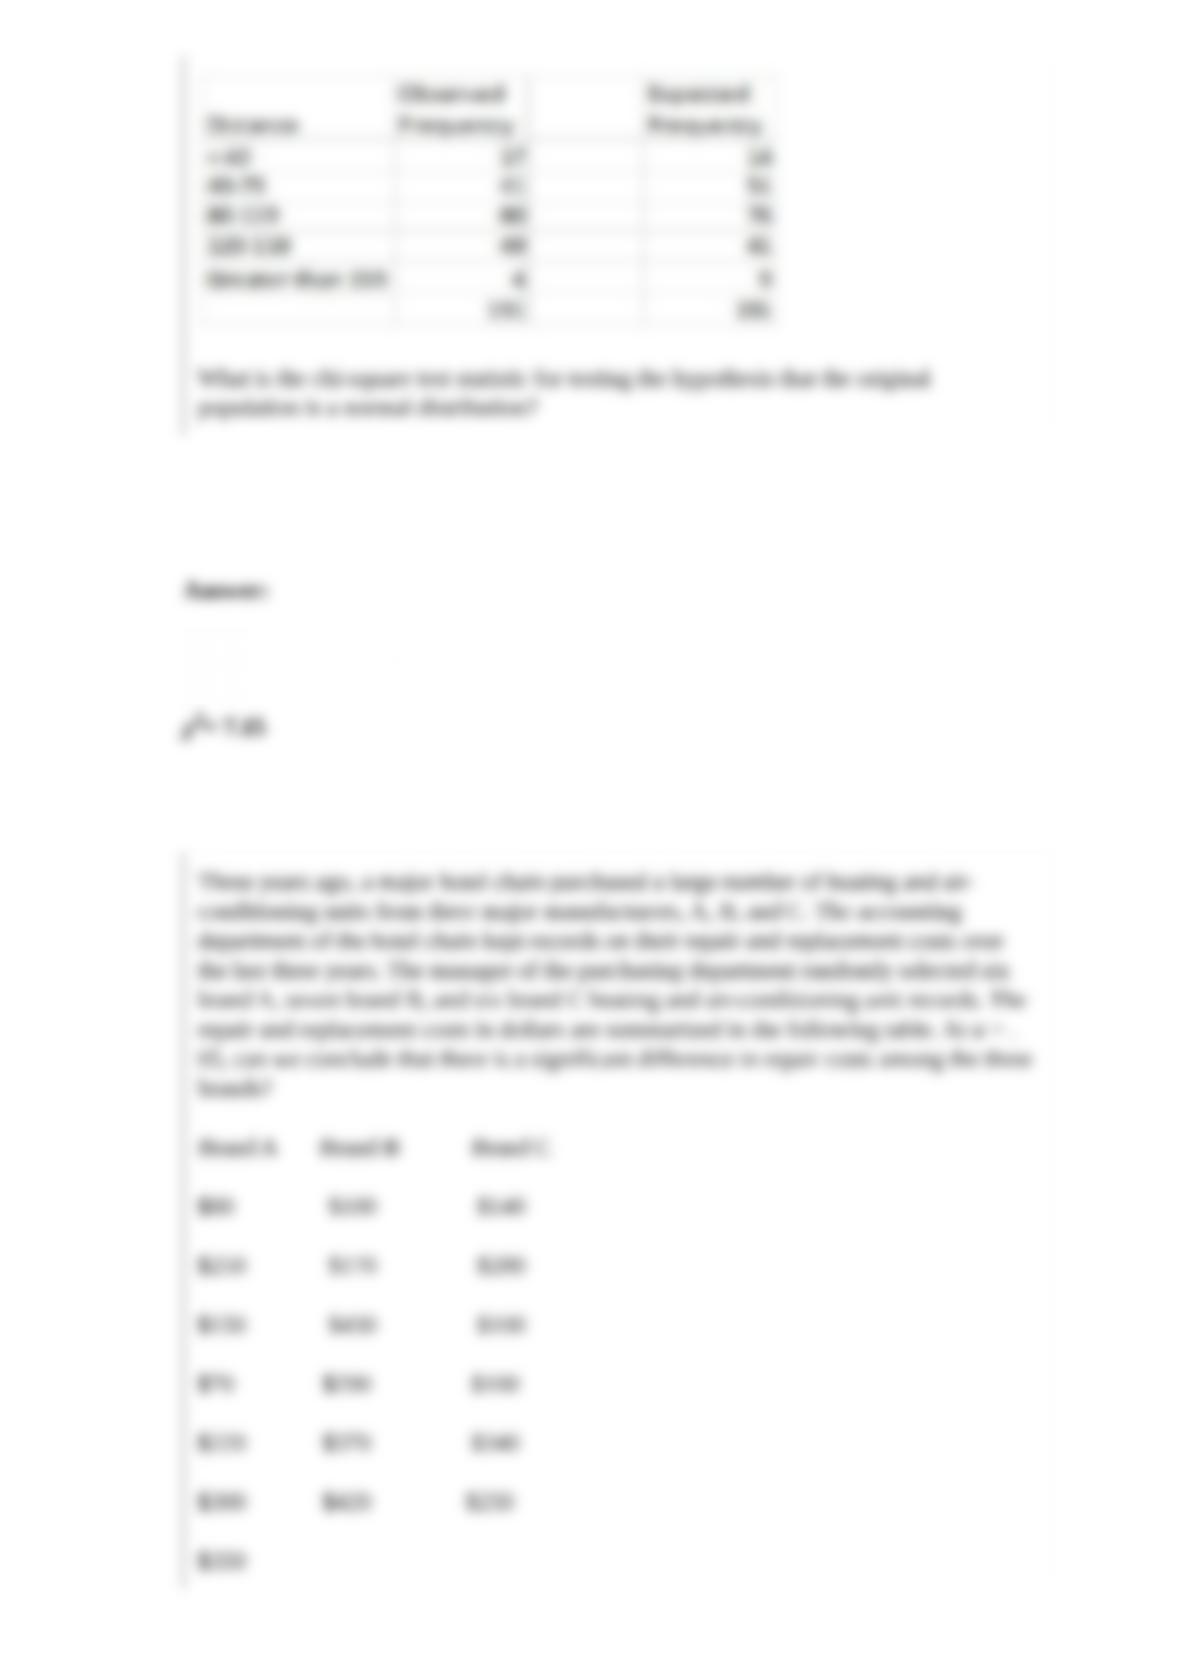
What is the chi-square test statistic for testing the hypothesis that the original
population is a normal distribution?
Three years ago, a major hotel chain purchased a large number of heating and
air-conditioning units from three major manufacturers, A, B, and C. The accounting
department of the hotel chain kept records on their repair and replacement costs over
the last three years. The manager of the purchasing department randomly selected six
brand A, seven brand B, and six brand C heating and air-conditioning unit records. The
repair and replacement costs in dollars are summarized in the following table. At α = .
05, can we conclude that there is a significant difference in repair costs among the three
brands?
Brand A Brand B Brand C
$80 $100 $140
$250 $170 $280
$150 $430 $100
$70 $290 $100
$220 $370 $340
$300 $420 $250
$350
A. Reject the null hypothesis.
B. Fail to reject the null hypothesis.
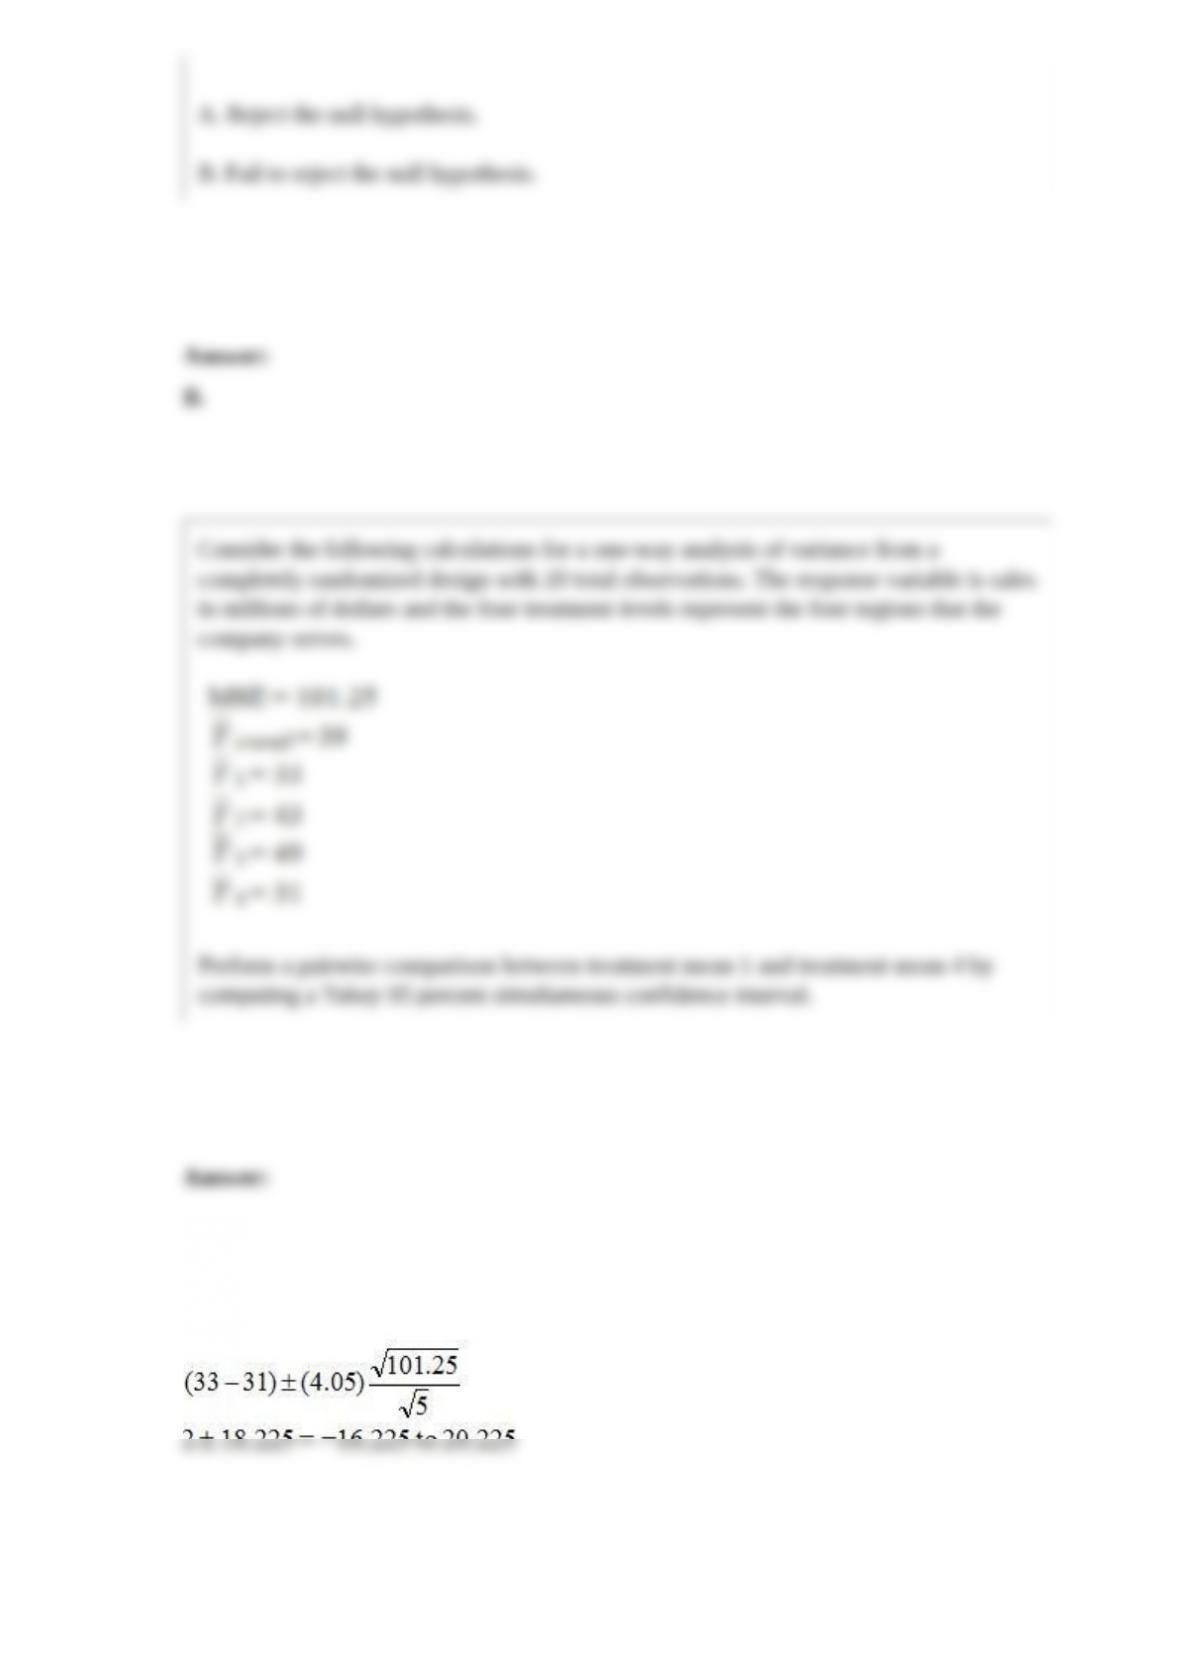
Consider the following calculations for a one-way analysis of variance from a
completely randomized design with 20 total observations. The response variable is sales
in millions of dollars and the four treatment levels represent the four regions that the
company serves.
Perform a pairwise comparison between treatment mean 1 and treatment mean 4 by
computing a Tukey 95 percent simultaneous confidence interval.
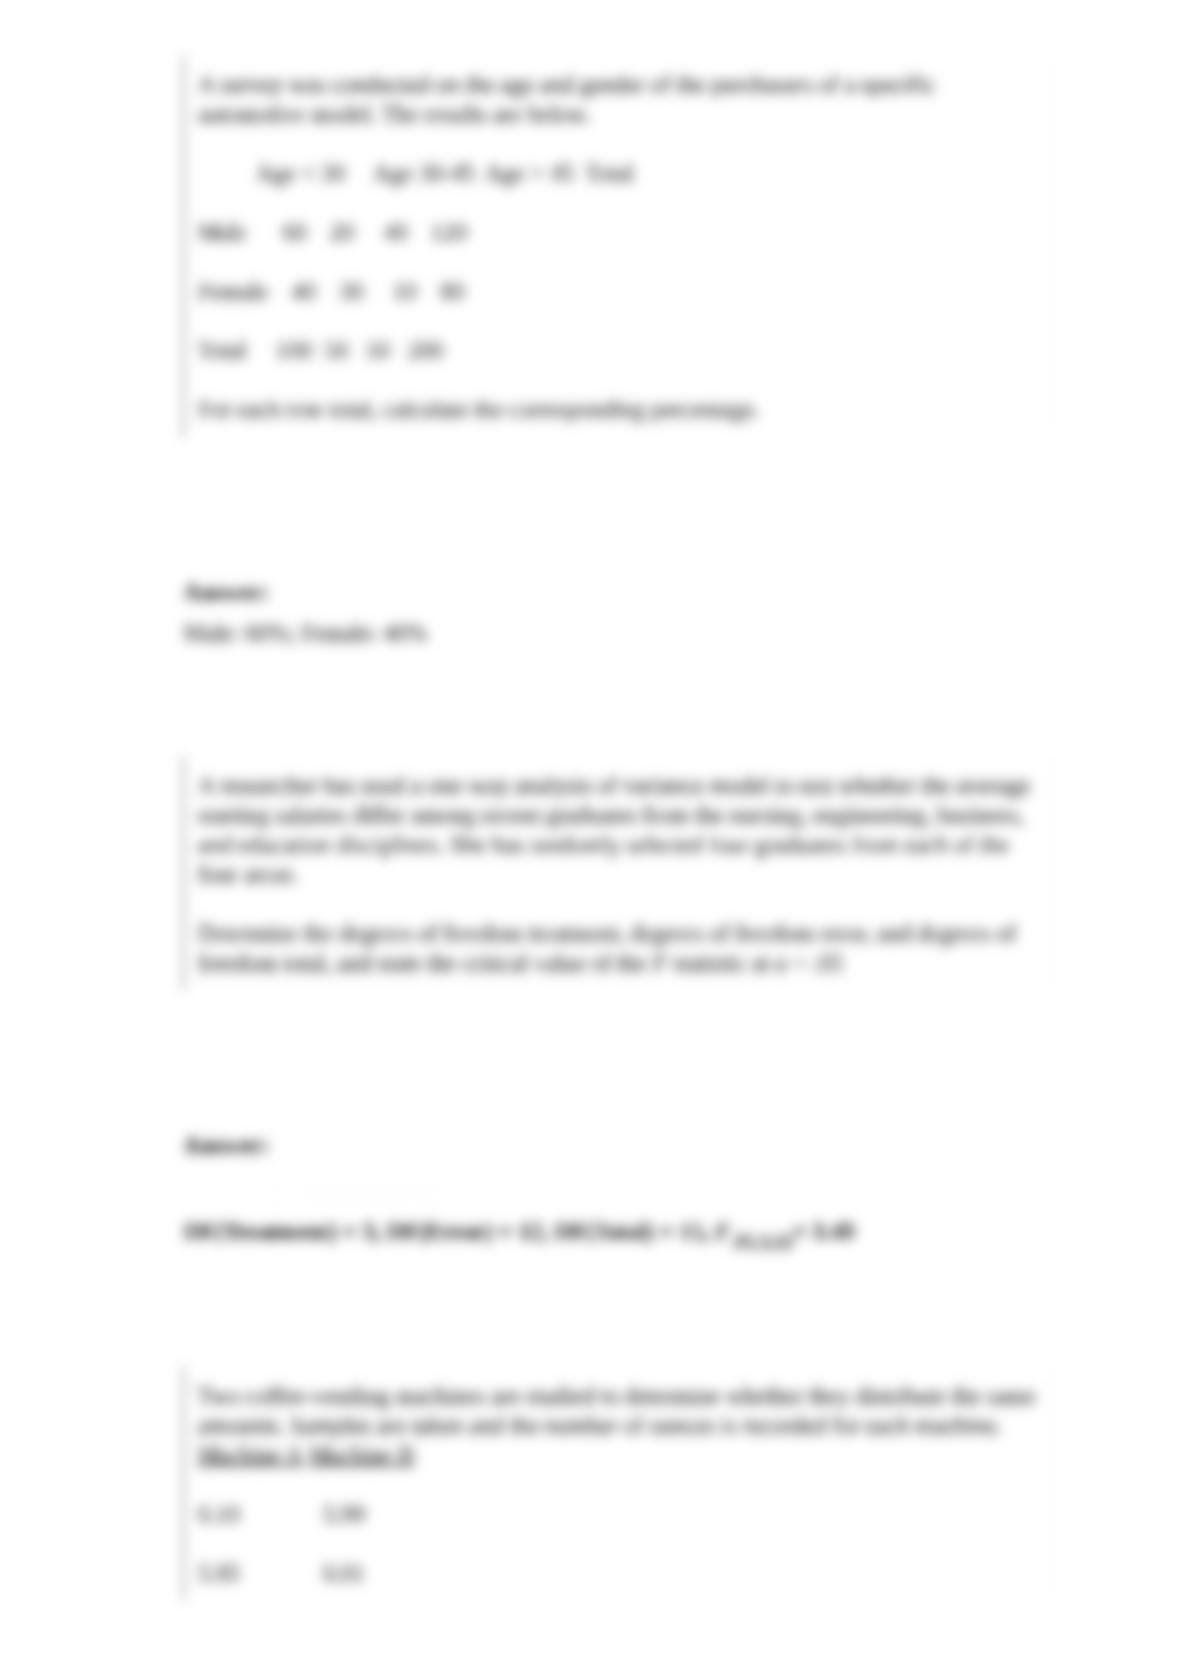
A survey was conducted on the age and gender of the purchasers of a specific
automotive model. The results are below.
Age < 30 Age 30-45 Age > 45 Total
Male 60 20 40 120
Female 40 30 10 80
Total 100 50 50 200
For each row total, calculate the corresponding percentage.
A researcher has used a one-way analysis of variance model to test whether the average
starting salaries differ among recent graduates from the nursing, engineering, business,
and education disciplines. She has randomly selected four graduates from each of the
four areas.
Determine the degrees of freedom treatment, degrees of freedom error, and degrees of
freedom total, and state the critical value of the F statistic at α = .05
Two coffee-vending machines are studied to determine whether they distribute the same
amounts. Samples are taken and the number of ounces is recorded for each machine.
Machine A Machine B
6.10 5.99
5.95 6.01
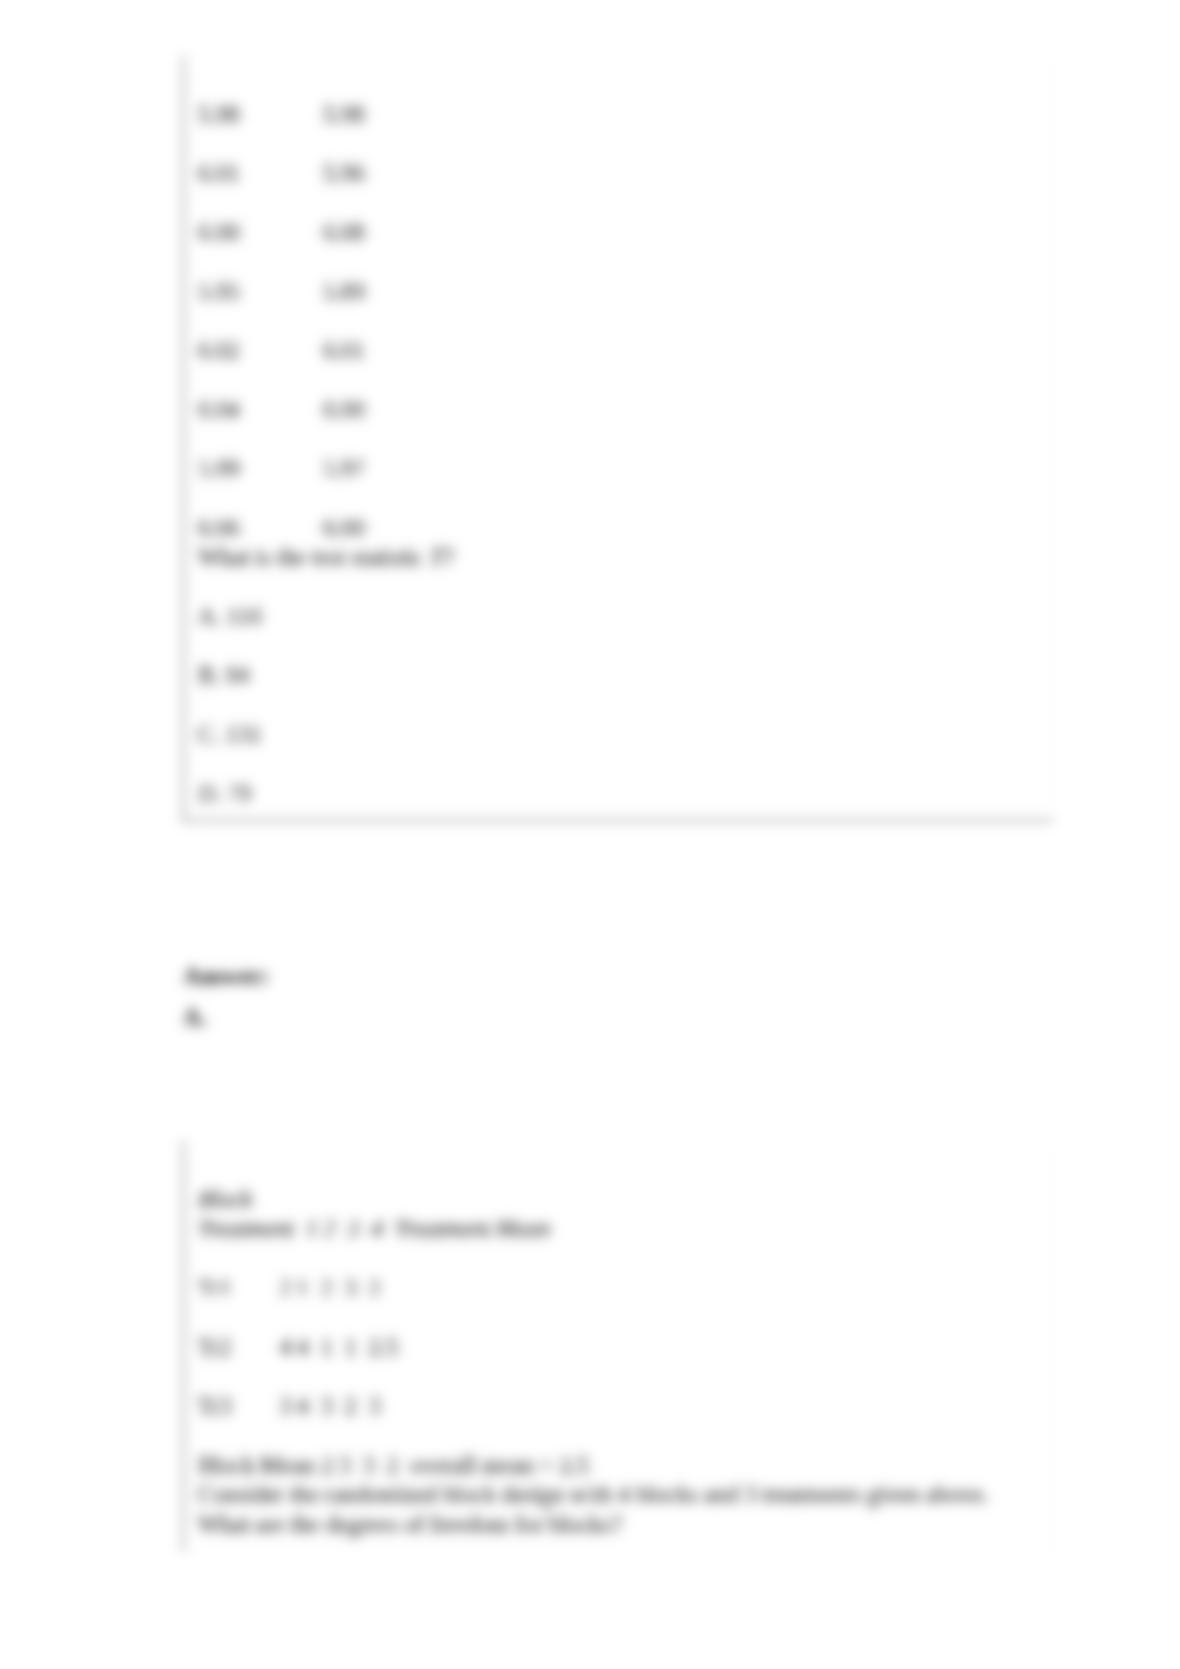
5.98 5.98
6.01 5.96
6.00 6.08
5.95 5.89
6.02 6.01
6.04 6.00
5.99 5.97
6.06 6.00
What is the test statistic T?
A. 116
B. 94
C. 131
D. 79
Block
Treatment 1 2 3 4 Treatment Mean
Tr1 2 1 2 3 2
Tr2 4 4 1 1 2.5
Tr3 3 4 3 2 3
Block Mean 2 3 3 2 overall mean = 2.5
Consider the randomized block design with 4 blocks and 3 treatments given above.
What are the degrees of freedom for blocks?
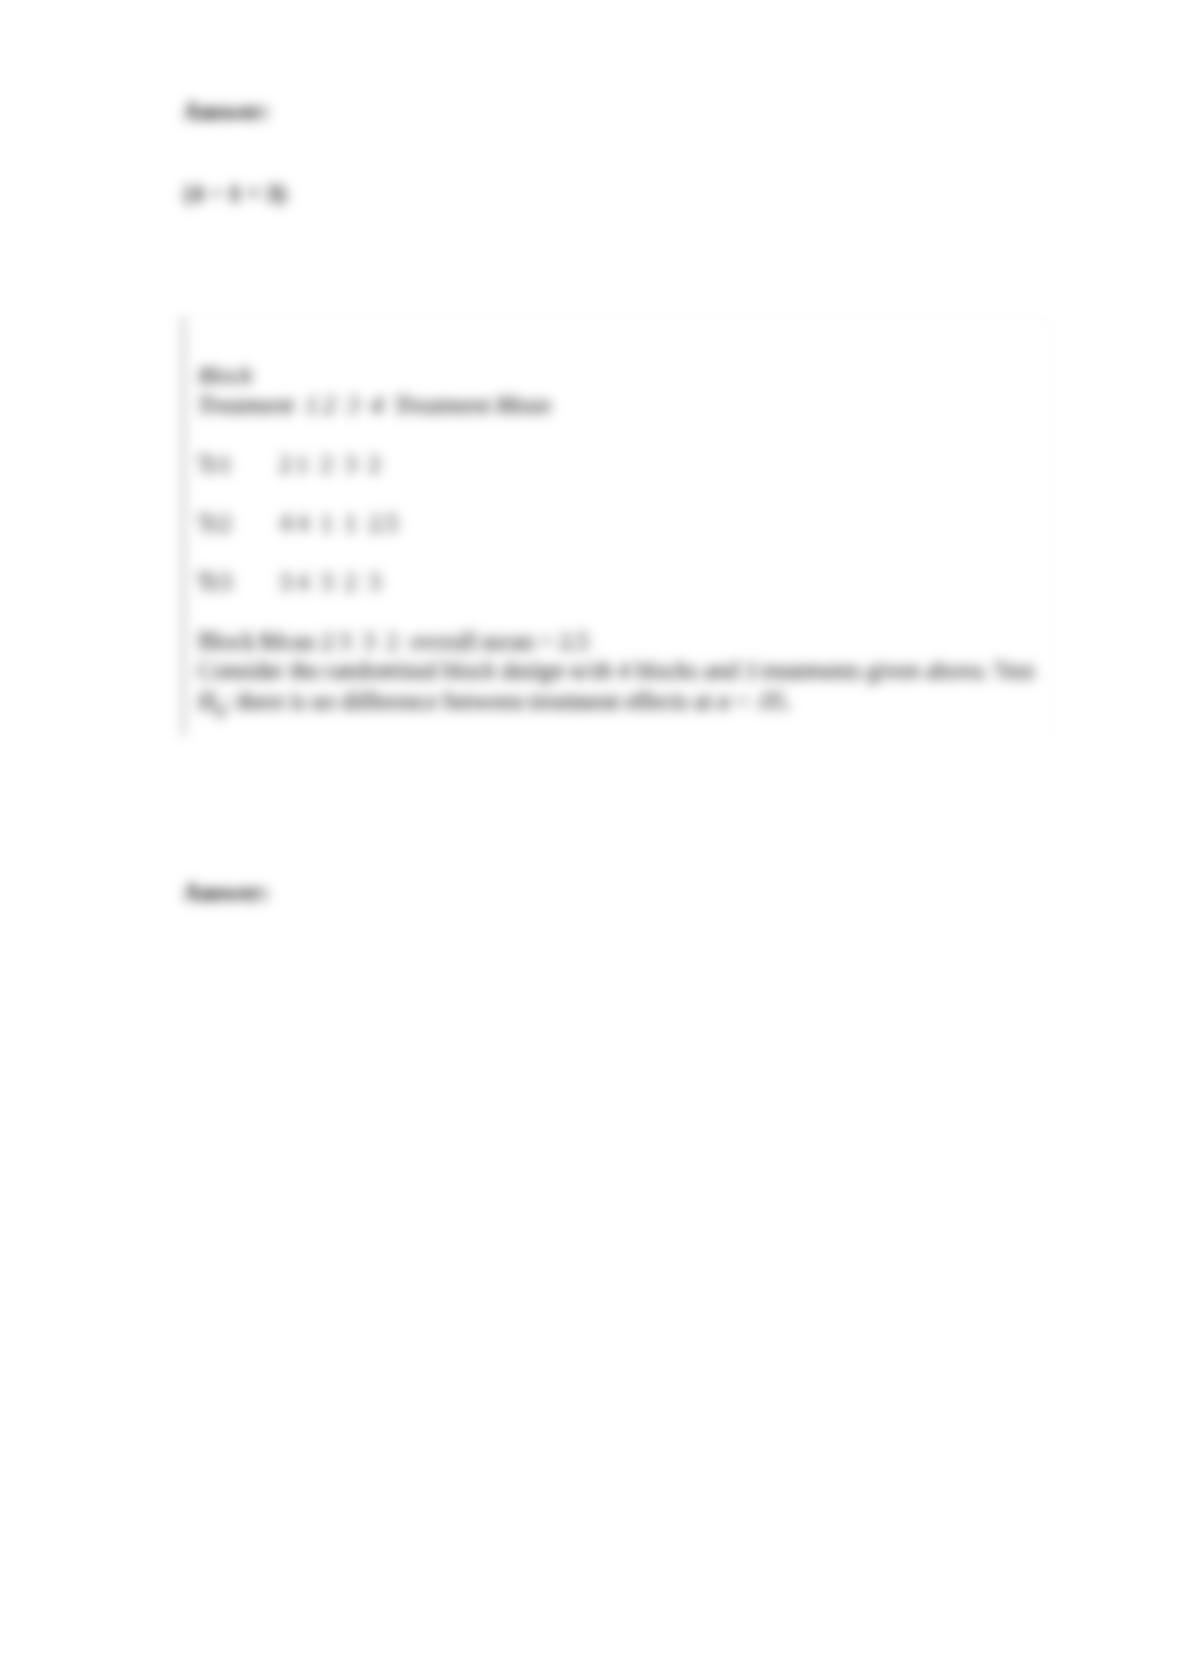
Block
Treatment 1 2 3 4 Treatment Mean
Tr1 2 1 2 3 2
Tr2 4 4 1 1 2.5
Tr3 3 4 3 2 3
Block Mean 2 3 3 2 overall mean = 2.5
Consider the randomized block design with 4 blocks and 3 treatments given above. Test
H0: there is no difference between treatment effects at α = .05.