
Table 55
PriceTotal
Revenue
$5$70
$6$78
$7$84
$8$88
$9$90
$10$90
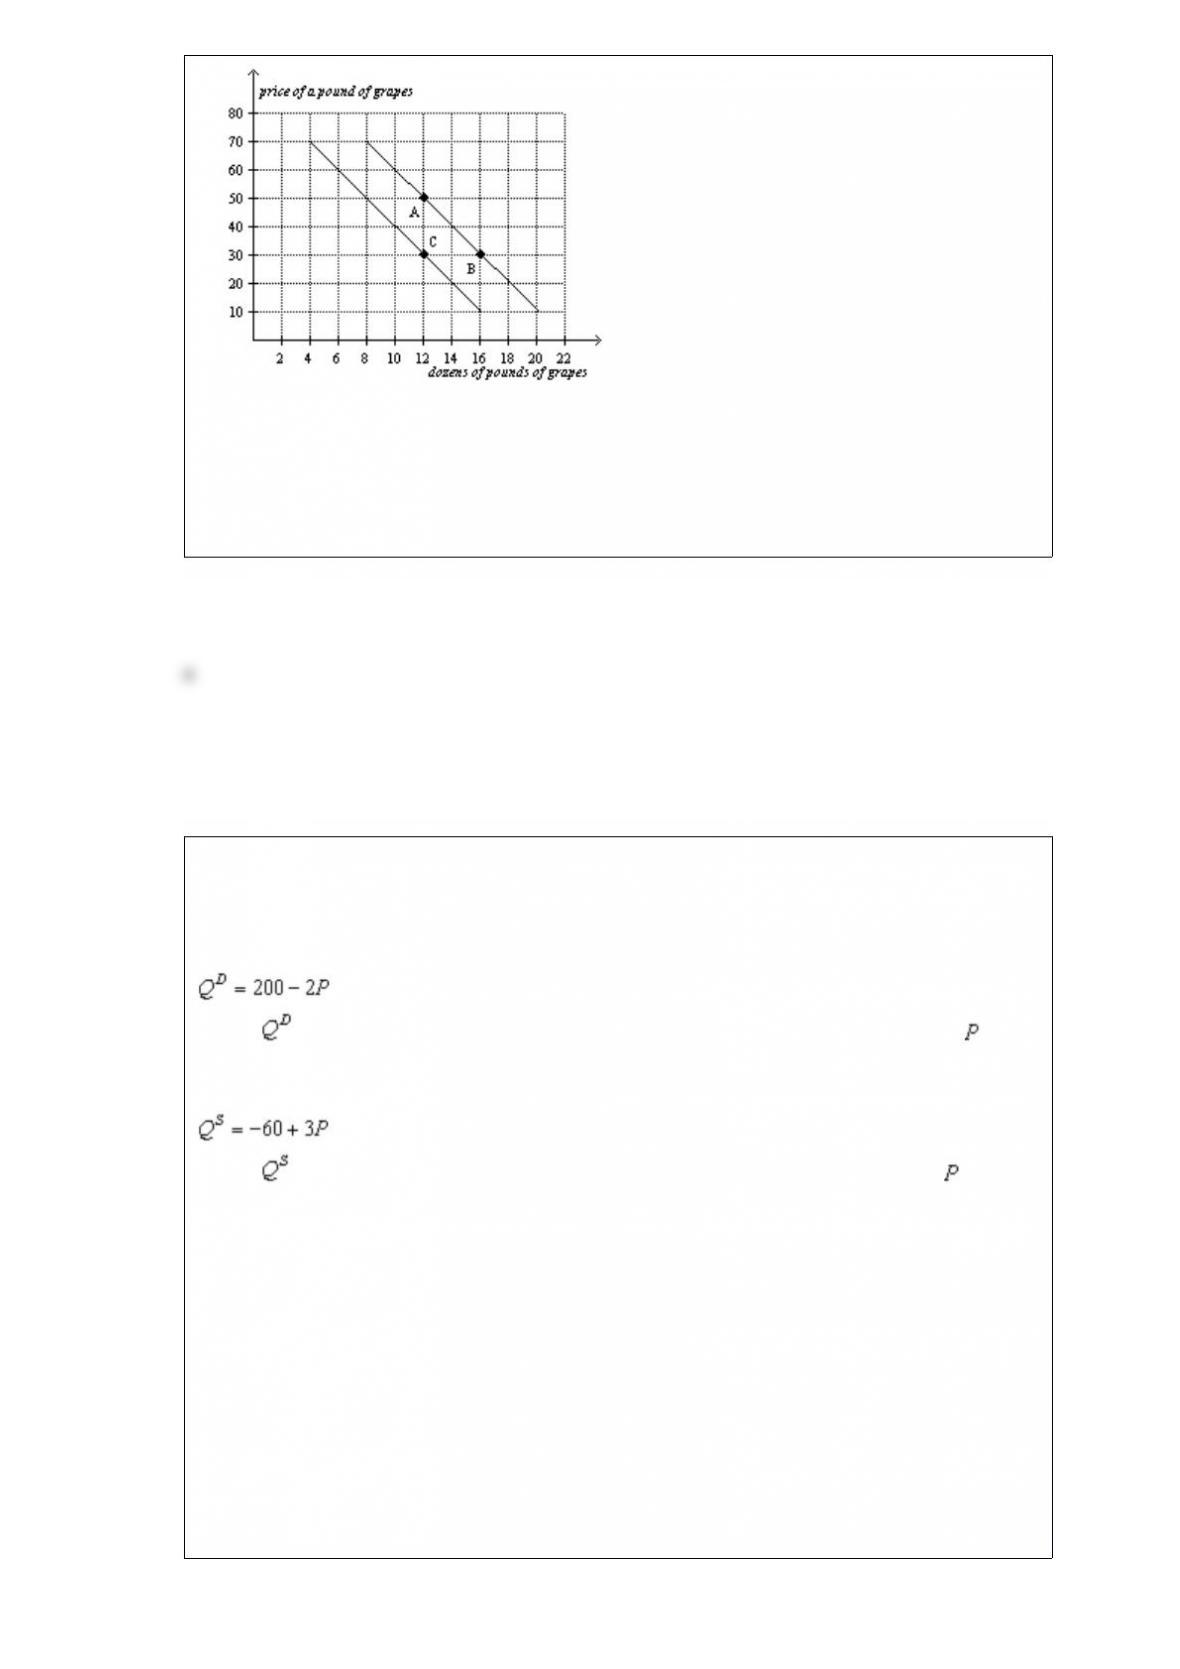
Refer to Table 55. Demand is unit elastic when quantity demanded changes from
a. 9 to 8.
b. 10 to 9.
c. 10 to 11.
d. There is not enough information given to determine the correct answer.
When quantity demanded responds strongly to changes in price, demand is said to be
a. fluid.
b. elastic.
c. dynamic.
d. highly variable.
Figure 36
Maxine’s Production Possibilities FrontierDaisy’s Production Possibilities Frontier

Refer to Figure 36. If Maxine and Daisy each divides her time equally between making
pies and making tarts, then total production is
a. 6 pies and 10 tarts.
b. 7.5 pies and 3 tarts.
c. 7.5 pies and 10 tarts.
d. 13.5 pies and 13 tarts.
Which of the following is likely to have the most price elastic demand?
a. milk
b. sailboats
c. good X in the short run compared to good X in the long run
d. gasoline
Suppose the United States has a comparative advantage over Mexico in producing pork.
The principle of comparative advantage asserts that
a. the United States should produce more pork than what it requires and export some of
it to Mexico.
b. the United States should produce a moderate quantity of pork and import the
remainder of what it requires from Mexico.
c. the United States should refrain altogether from producing pork and import all of

what it requires from Mexico.
d. Mexico has nothing to gain from importing United States pork.
How did the farm population in the United States change between 1950 and today?
a. It dropped from 10 million to fewer than 3 million people.
b. It dropped from 20 million to fewer than 5 million people.
c. It dropped from 30 million to just over 6 million people.
d. It increased from 10 million to almost 13 million people.
The 2005 Boston Globe article discussing ticket scalping points out that the price
people will pay for tickets will rise when
a. supply and demand are both limited.
b. supply is limited and demand is not limited.
c. supply is limited and demand is not limited.
d. supply and demand are both not limited.
You love peanut butter. You hear on the news that 50 percent of the peanut crop in the
South has been wiped out by drought and that this will cause the price of peanuts to
double by the end of the year. As a result, your demand for peanut butter
a. will increase but not until the end of the year.
b. increases today.
c. decreases as you look for a substitute good.
d. shifts left today.

Table 39
Assume that Maya and Miguel can switch between producing mixers and producing
toasters at a constant rate.
Hours Needed to Make 1Amount Produced in 60 Hours
MixerToasterMixerToaster
Maya 631020
Miguel105612
Refer to Table 39. We could use the information in the table to draw a production
possibilities frontier for Maya and a second production possibilities frontier for Miguel.
If we were to do this, measuring mixers along the horizontal axis, then
a. the slope of Maya’s production possibilities frontier would be 2 and the slope of
Miguel’s production possibilities frontier would be 2.
b. the slope of Maya’s production possibilities frontier would be 0.5 and the slope of
Miguel’s production possibilities frontier would be 0.5.
c. the slope of Maya’s production possibilities frontier would be 1.67 and the slope of
Miguel’s production possibilities frontier would be 1.67.
d. the slope of Maya’s production possibilities frontier would be 0.6 and the slope of
Miguel’s production possibilities frontier would be 0.6.
When a binding price ceiling is imposed on a market to benefit buyers,
a. every buyer in the market benefits.
b. every buyer and seller in the market benefits.
c. every buyer who wants to buy the good will be able to do so, but only if he waits in
long lines.
d. some buyers will not be able to buy any amount of the good.

Table 76
For each of three potential buyers of apples, the table displays the willingness to pay for
the first three apples of the day. Assume Xavier, Yadier, and Zavi are the only three
buyers of apples, and only three apples can be supplied per day.
First AppleSecond AppleThird Apple
Xavier$1.75$1.55$1.15
Yadier$1.50$1.25$0.75
Zavi$1.30$1.10$0.70
Refer to Table 76. If the market price of an apple increases from $1.40 to $1.60, then
consumer surplus
a. decreases by $0.15.
b. decreases by $0.30.
c. decreases by $0.45.
d. increases by $0.15.
Table 33
Production Opportunities
Hours Needed to Make 1 Unit of Number of Units Produced in 40 Hours
Cheese Wine Cheese Wine
England 1 4 40 10
France 5 2 8 20
Refer to Table 33. We could use the information in the table to draw a production
possibilities frontier for England and a second production possibilities frontier for
France. If we were to do this, measuring wine along the horizontal axis, then
a. the slope of England’s production possibilities frontier would be 4 and the slope of
France’s production possibilities frontier would be 0.4.
b. the slope of England’s production possibilities frontier would be 0.25 and the slope
of France’s production possibilities frontier would be 2.5.
c. the slope of England’s production possibilities frontier would be 0.25 and the slope of
France’s production possibilities frontier would be 2.5.
d. the slope of England’s production possibilities frontier would be 4 and the slope of
France’s production possibilities frontier would be 0.4.

To fully understand how taxes affect economic wellbeing, we must compare the
a. consumer surplus to the producer surplus.
b. price paid by buyers to the price received by sellers.
c. reduced welfare of buyers and sellers to the revenue raised by the government.
d. consumer surplus to the deadweight loss.
Currently you purchase ten frozen pizza per month. You will graduate from college in
December, and you will start a new job in January. You have no plans to purchase
frozen pizzas in January. For you, frozen pizzas are a(n)
a. substitute good.
b. normal good.
c. inferior good.
d. complementary good.
For a very long time the country of Zeeland has had an inflation rate of 9%. Suddenly
its inflation rate drops to 3%. The drop in the inflation rate
a. could be due to slower money supply growth. We would expect unemployment to be
higher.
b. could be due to slower money supply growth. We would expect unemployment to be
lower.
c. could be due to higher money supply growth. We would expect unemployment to be
higher.
d. could be due to higher money supply growth. We would expect unemployment to be
lower.

Workers displaced by trade eventually find jobs in
a. another country.
b. the government sector.
c. the industries in which the country has a comparative advantage.
d. a different company in the same industry.
A relatively flat demand curve indicates that
a. quantity demanded will adjust only slightly to a price change.
b. quantity demanded will adjust significantly to a price change.
c. quantity demanded will not adjust to a price change.
d. the change in quantity demanded will exactly equal a change in price.
Figure 711
Refer to Figure 711. If the supply curve is S’, the demand curve is D, and the
equilibrium price is $150, what is the producer surplus?

a. $625
b. $1,250
c. $2,500
d. $5,000
In 2011, the average American earned about $48,000 while the average Nigerian earned
about $1,200. Which of the following statements is likely?
a. The average American purchases more televisions than the average Nigerian.
b. The average American has better nutrition and healthcare than the average Nigerian.
c. The average American has a longer life expectancy than the average Nigerian.
d. All of the above are correct.
For which pairs of goods is the crossprice elasticity most likely to be positive?
a. peanut butter and jelly
b. bicycle frames and bicycle tires
c. pens and pencils
d. college textbooks and iPods
Figure 217
Refer to Figure 217. The slope of the curve between points A and B is
a. 5
b. 1/5
c. 1/5
d. 5
Scenario 92
• For a small country called Boxland, the equation of the domestic demand curve for
cardboard is
,
where represents the domestic quantity of cardboard demanded, in tons, and
represents the price of a ton of cardboard.
• For Boxland, the equation of the domestic supply curve for cardboard is
,
where represents the domestic quantity of cardboard supplied, in tons, and again
represents the price of a ton of cardboard.
Refer to Scenario 92. Suppose the world price of cardboard is $45. Then, if Boxland
goes from prohibiting international trade in cardboard to allowing international trade in
cardboard,
a. domestic producers of cardboard become better off and domestic consumers of
cardboard become better off.
b. domestic producers of cardboard become better off and domestic consumers of
cardboard become worse off.
c. domestic producers of cardboard become worse off and domestic consumers of
cardboard become better off.
d. domestic producers of cardboard become worse off and domestic consumers of
cardboard become worse off.
Today, producers changed their expectations about the future. This change
a. can cause a movement along a supply curve.
b. can affect future supply, but not today’s supply.
c. can affect today’s supply.
d. cannot affect either today’s supply or future supply.
Figure 412
Firm AFirm B
Refer to Figure 412. If these are the only two sellers in the market, then the market
quantity supplied at a price of $6 is
a. 2 units.
b. 10 units.
c. 12 units.
d. 22 units.
Figure 819
The vertical distance between points A and B represents the original tax.
Refer to Figure 819. The original tax can be represented by the vertical distance AB.
Suppose the government is deciding whether to lower the tax to CD or raise it to FG.
Which of the following statements is correct?
a. Compared to the original tax, the larger tax will decrease both tax revenue and
deadweight loss.
b. Compared to the original tax, the smaller tax will increase both tax revenue and
deadweight loss.
c. Compared to the original tax, the larger tax will decrease tax revenue and increase
deadweight loss.
d. Both a and b are correct.
Table 45
The table below shows the quantities demanded of cases of Mt. Dew per month by four
families at various prices.
Price of Case of Mr. DewThe Adams FamilyThe Jones FamilyThe Smith
FamilyThe Williams Family
$79151214
$88121010
$97986
$106662
Refer to Table 45. If the four families listed in the table are the only demanders of Mt.
Dew in the market, which of the following is a correct graph of the market demand?

a.
b.
c.
d.
Demand is elastic if the price elasticity of demand is
a. less than 1.
b. equal to 1.
c. equal to 0.
d. greater than 1.
If a nonbinding price ceiling is imposed on a market, then the
a. quantity sold in the market will decrease.
b. quantity sold in the market will stay the same.
c. price in the market will increase.
d. price in the market will decrease.
Figure 621
Refer to Figure 621. In the aftertax equilibrium, how much revenue does the
government collect from the tax on this good?
a. $210
b. $345
c. $420
d. $480
Figure 918. On the diagram below, Q represents the quantity of peaches and P
represents the price of peaches. The domestic country is Isoland.

Refer to Figure 918. Suppose Isoland changes from a notrade policy to a policy that
allows international trade. If the world price of peaches is $5, then the policy change
results in
a. a decrease in consumer surplus.
b. an increase in producer surplus.
c. an increase in total surplus.
d. All of the above are correct.
Elasticity of demand is closely related to the slope of the demand curve. The less
responsive buyers are to a change in price, the
a. steeper the demand curve will be.
b. flatter the demand curve will be.
c. further to the right the demand curve will sit.
d. closer to the vertical axis the demand curve will sit.
Consider the market for portable air conditioners in equilibrium. When a heat wave
strikes the equilibrium price
a. and quantity both decrease.
b. and quantity both increase.
c. increases, and the equilibrium quantity decreases.

d. decreases, and the equilibrium quantity increases.
With respect to how economists study the economy, which of the following statements
is most accurate?
a. Economists study the past, but they do not try to predict the future.
b. Economists use “rules of thumb” to predict the future.
c. Economists devise theories, collect data, and analyze the data to test the theories.
d. Economists use controlled experiments in much the same way that biologists and
physicists do.
It is possible for an economy to increase its production of both goods if the economy
a. moves downward and to the right along its production possibilities frontier and the
frontier is bowed outward.
b. moves upward and to the left along its production possibilities frontier and the
frontier is bowed outward.
c. moves in either direction along its production possibilities frontier and the frontier is
a straight line.
d. moves from a situation of inefficient production to a situation of efficient production.