According to the Insurance Research Council, 14% of U.S. drivers are uninsured. A
random sample of seven drivers was selected. What is the mean of this distribution?
A) 0.98
B) 1.15
C) 1.64
D) 2.12
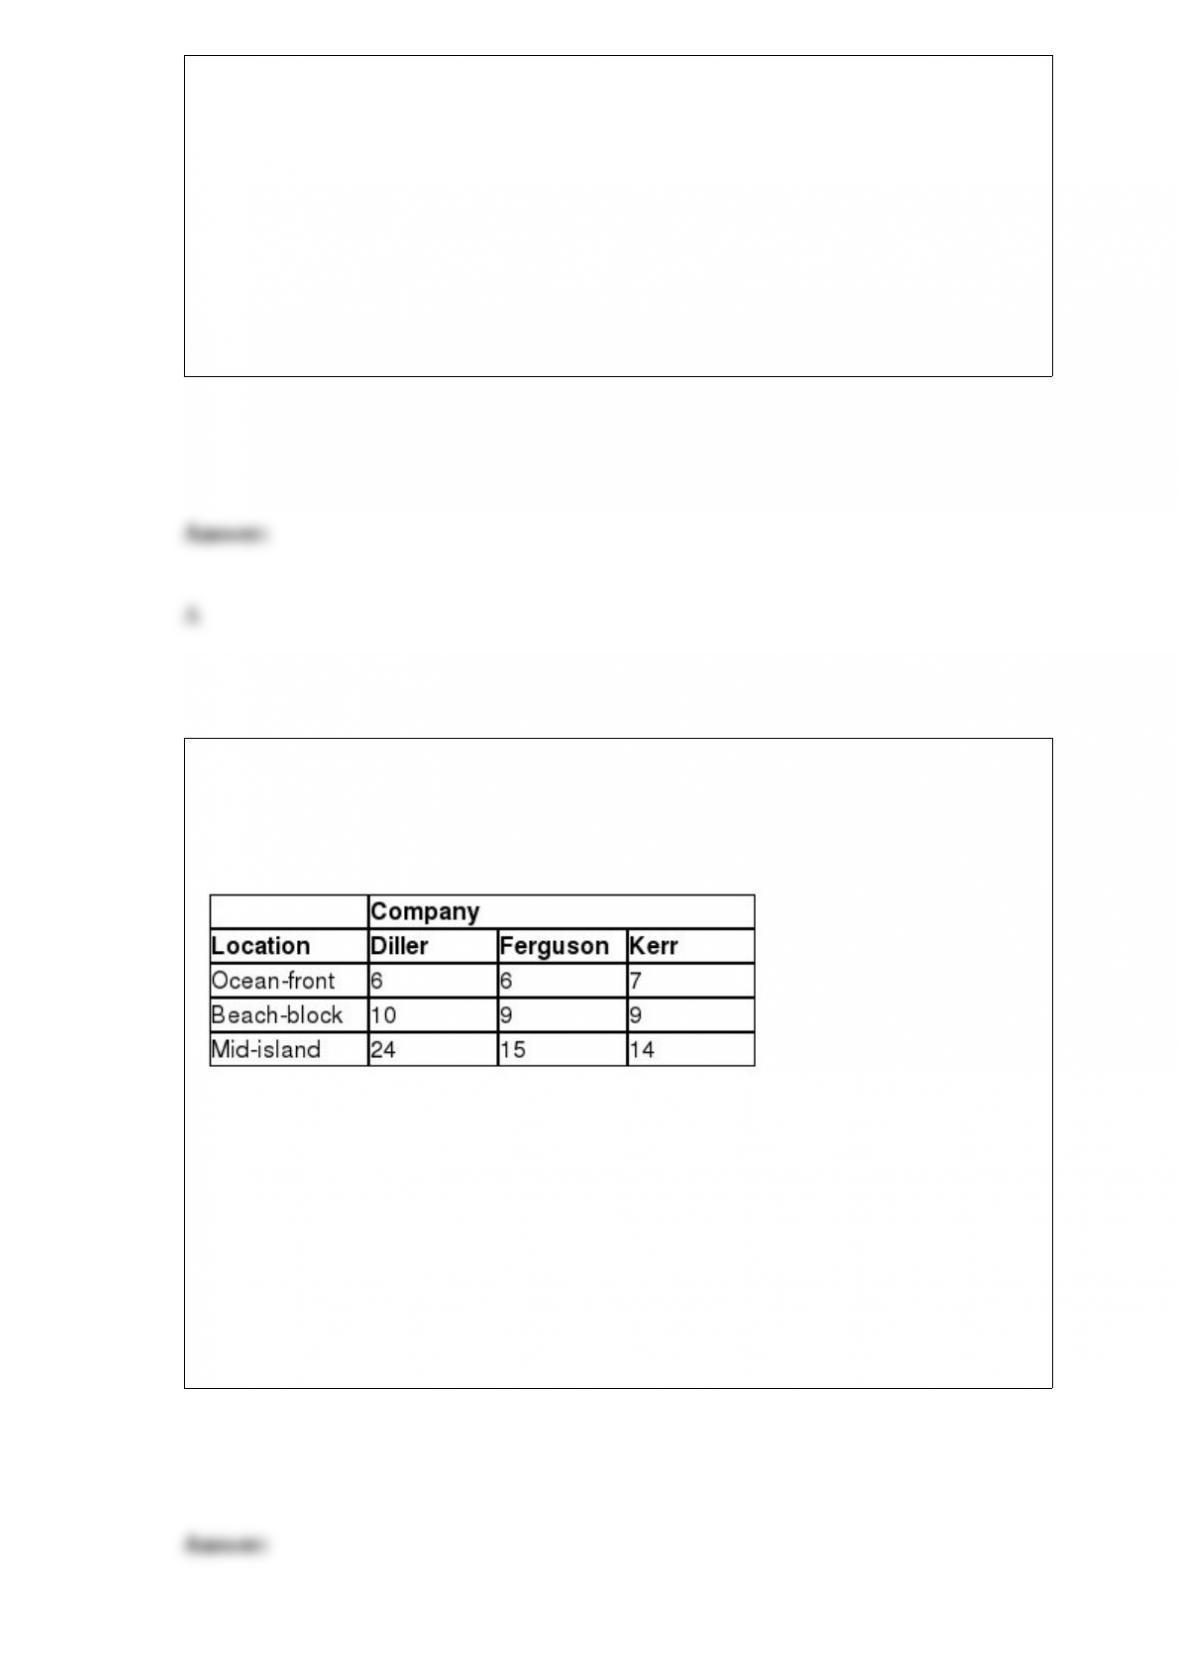
A beach community on a barrier island has three real estate companies that list rental
properties by location which are classified as ocean-front, beach-block, or mid-island.
The following contingency table shows the number of properties listed by each
company along with their location.
The expected number of listings for Diller that are a beach-block location is ________.
A) 7.6
B) 11.2
C) 15.9
D) 21.2
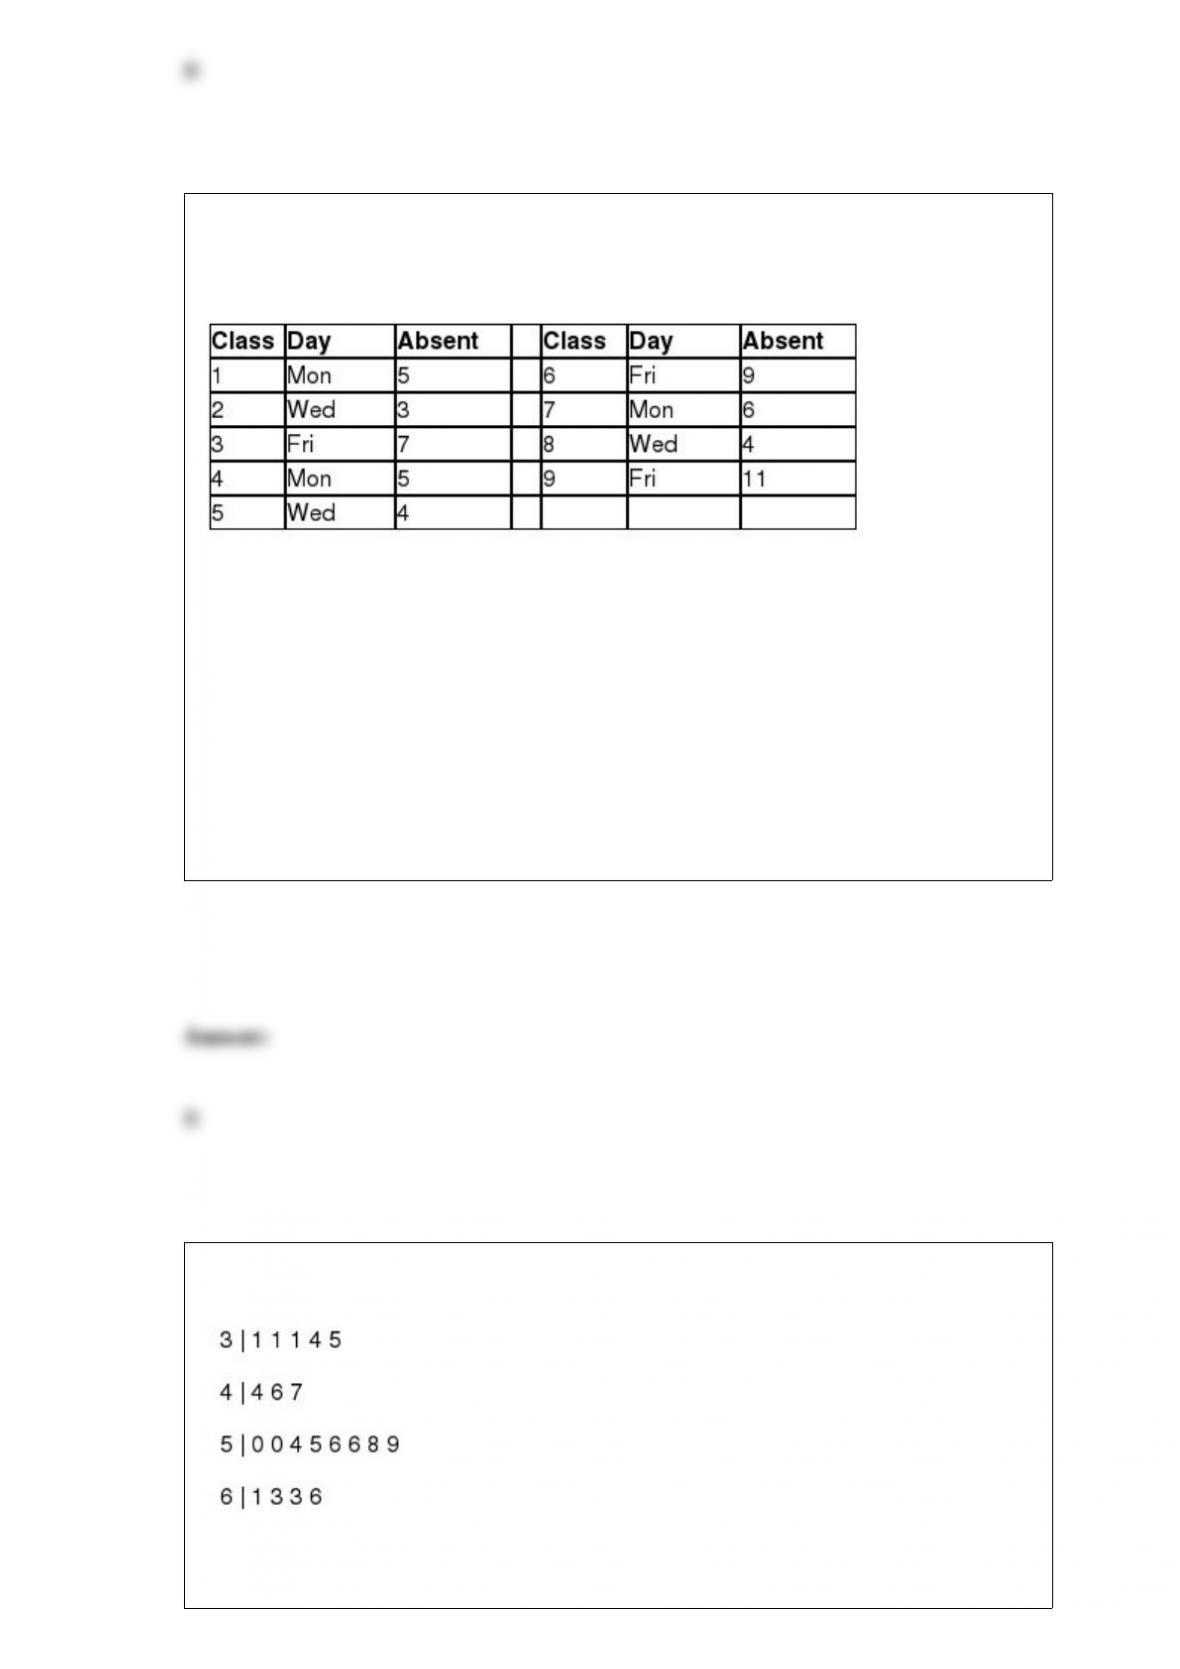
A large statistics class meets on Monday, Wednesday, and Friday each week during the
semester. The following data shows the number of absent students for the last nine
classes.
The trend component for the forecast of absent students for Class 10 using
multiplicative decomposition is ________.
A) 6.6
B) 7.5
C) 8.2
D) 8.5
Consider the following stem and leaf display.
Which of the following statements is correct?

A) There are a total of 10 data values in this data set.
B) The data value that occurs most often is 50.
C) This largest data value is 59.
D) The class 50-59 contains the most values.
________ is a single value used to describe the center point of a data set.
A) Coefficient of variation
B) Central tendency
C) Relative position
D) Variation
Costco sells paperback books in their retail stores and wanted to examine the
relationship between price and demand. The price of a particular novel was adjusted
each week and the weekly sales were recorded in the table below.

Management would like to use simple regression analysis to estimate weekly demand
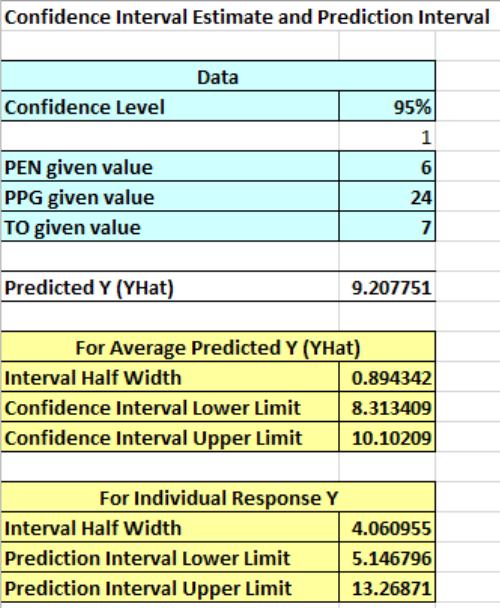
for this novel using the price of the novel. The 95% confidence interval that estimates
the average weekly sales for a price of $9 is ________.
A) (1.96, 13.16)
B) (7.26, 7.86)
C) (5.93, 9.19)
D) (1.26, 13.86)
Hamburgers are on the menu tomorrow at a school cafeteria and the manager needs to
decide how many to have ready for the lunch hour. Each hamburger costs the school
$1.85 and is sold for $3.50. Leftover hamburgers have no monetary value. The manager
expects demand tomorrow to be 100, 150, 200, or 250 hamburgers and would like to
prepare one of these four quantities for lunchtime. If the manager uses the equally likely
criterion, how many hamburgers will be prepared?
A) 100
B) 150
C) 200
D) 250
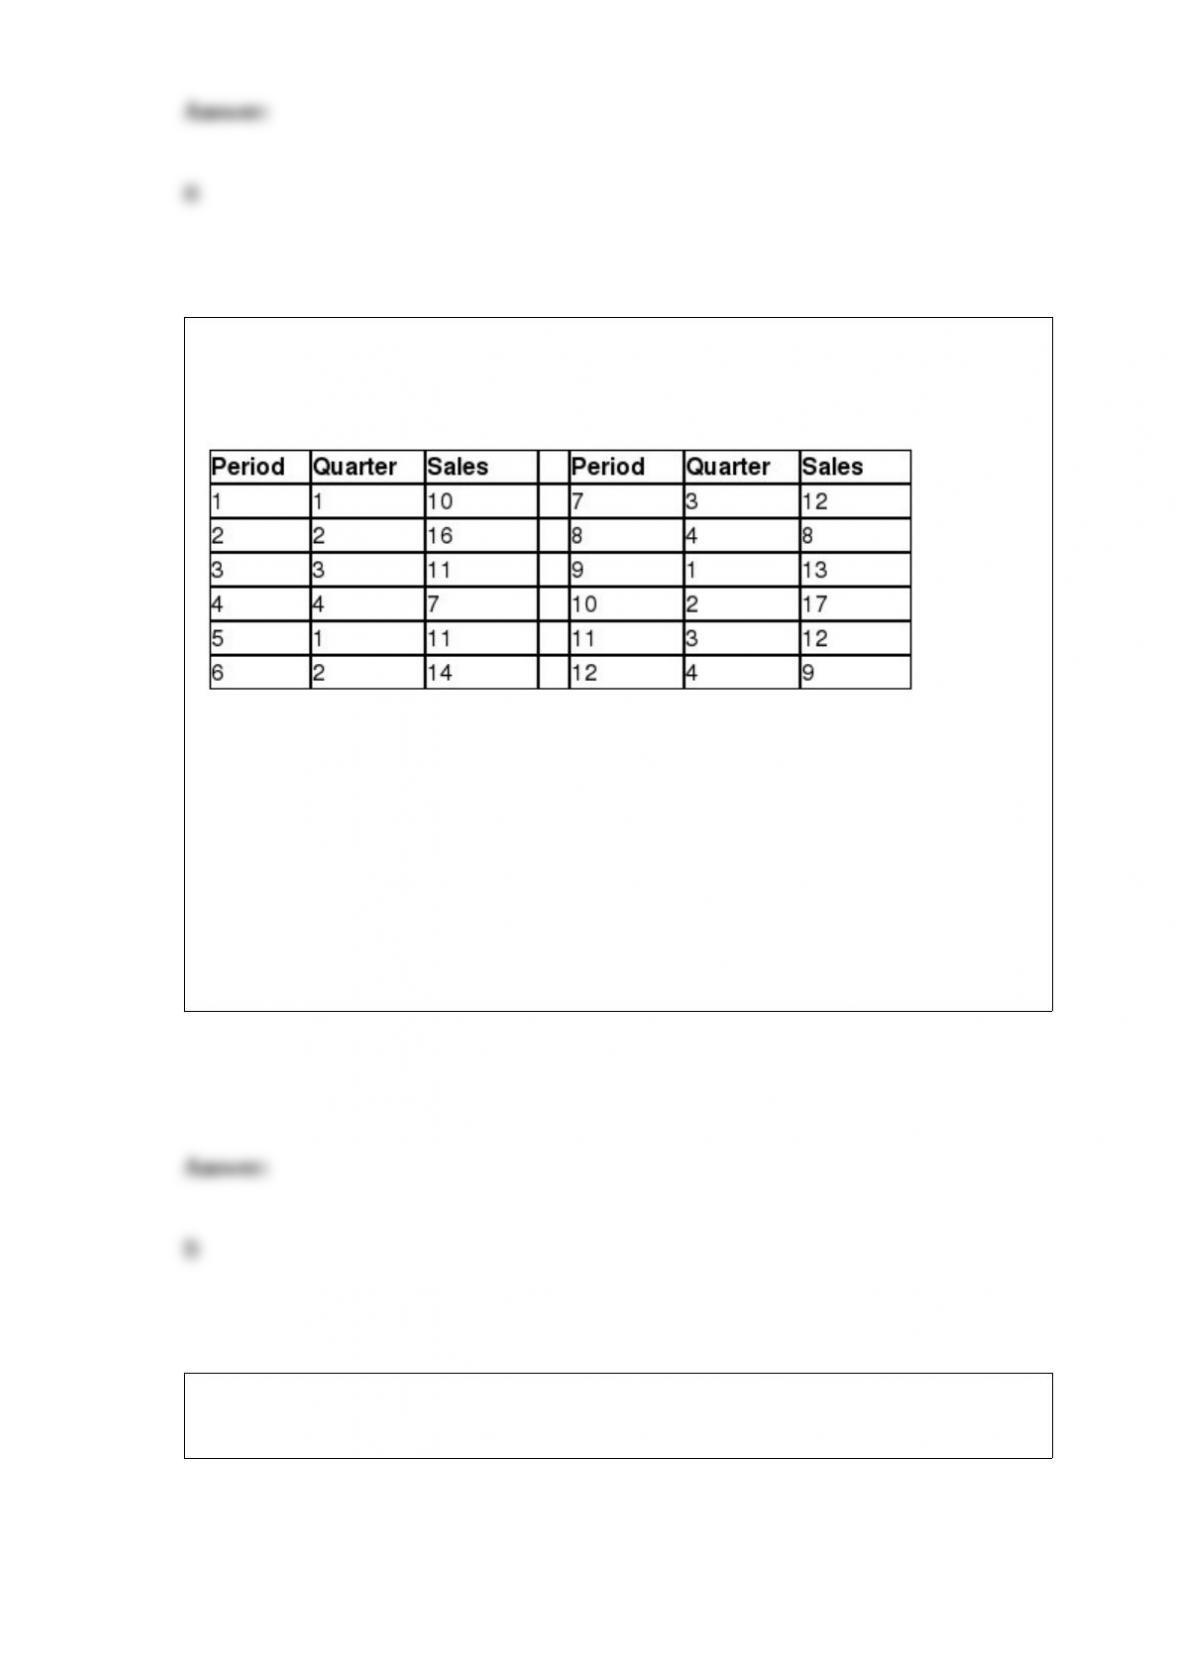
Chris is employed by Silver Lake Resort in Orlando, Florida, and sells timeshares. The
following table shows the number of timeshare sales for Chris for each quarter over the
past three years.
The sales forecast for Period 13 using multiplicative decomposition is ________.
A) 12.0
B) 13.7
C) 14.3
D) 14.9
A respondent to a survey indicates that he has lived in his current residence for three
years. This is an example of qualitative data.
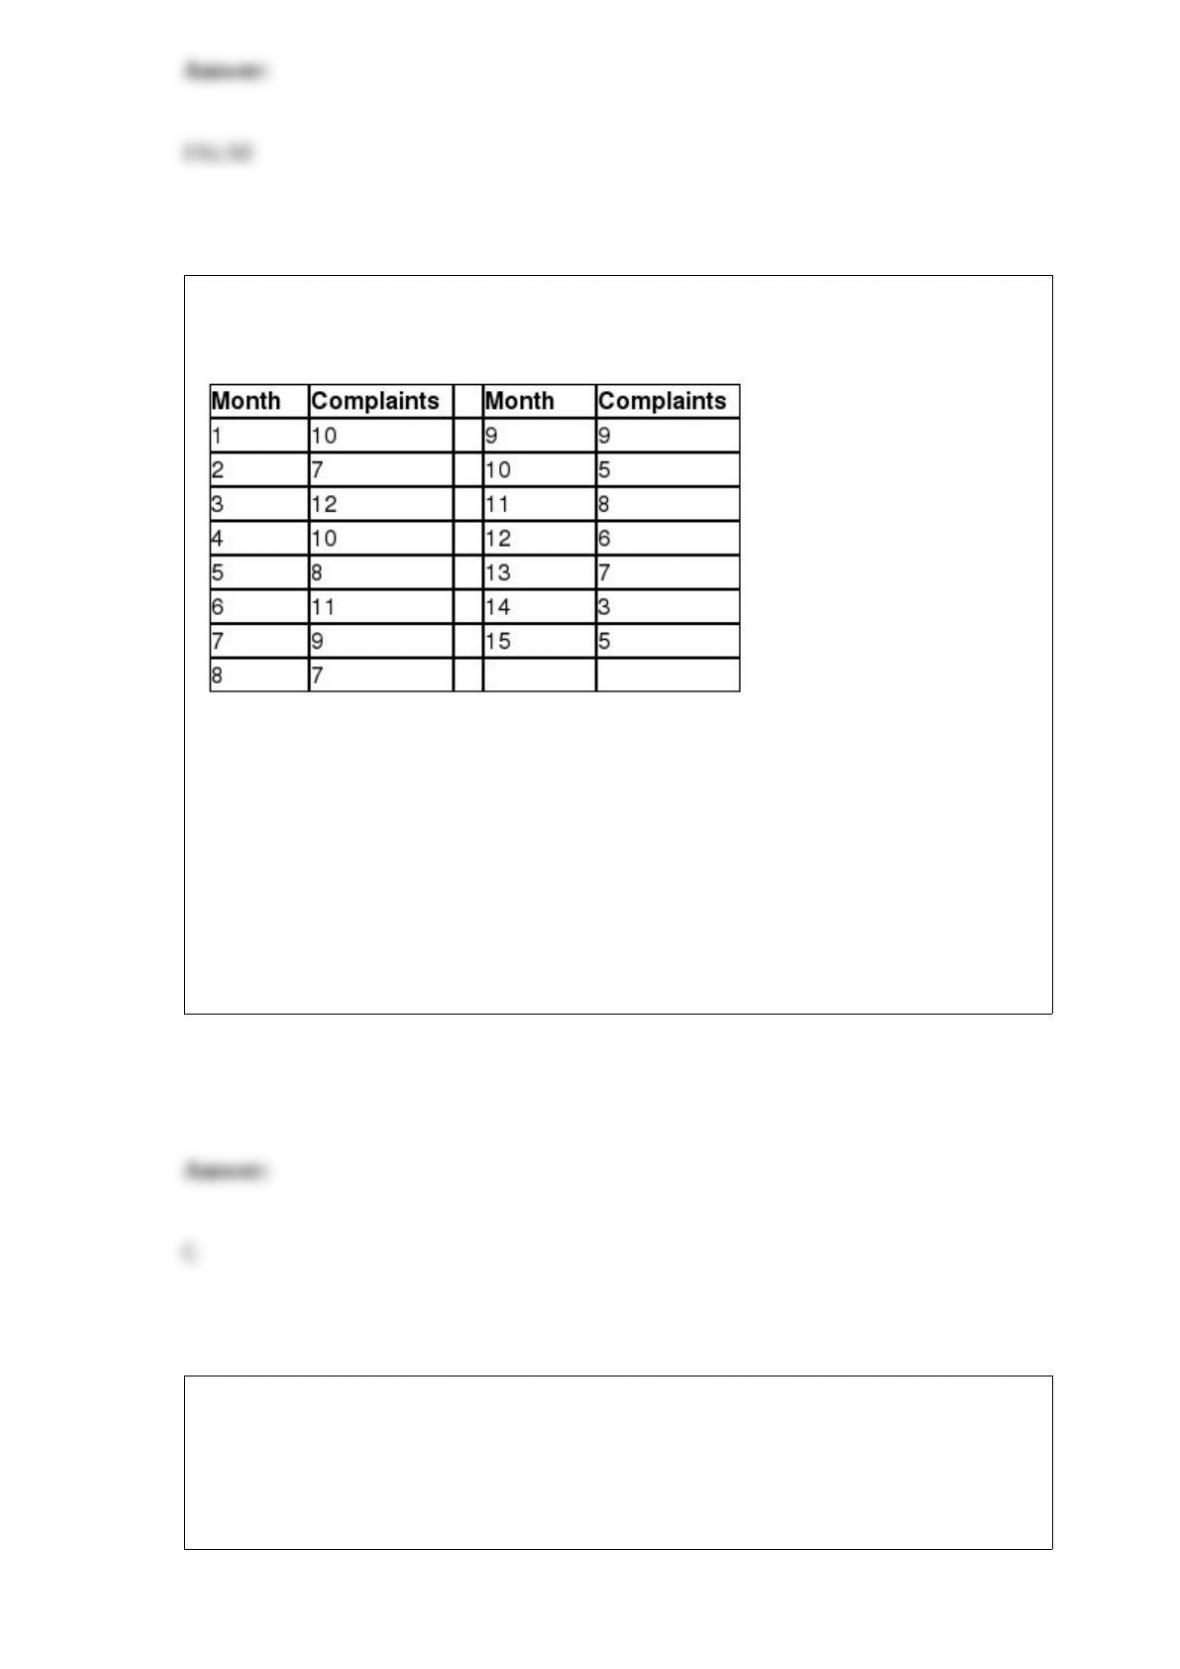
The following data represent the number of complaints per month that customer service
received at a large retailer over the last 15 months.
The trend projection intercept for this data is ________.
A) -3.116
B) -9.655
C) 11.000
D) 14.520
Use the following information to answer the question(s) below.
The National Football League has developed a regression model to predict the number
of wins during a season for a team using the following independent variables:
•Average points per game during the season (PPG)
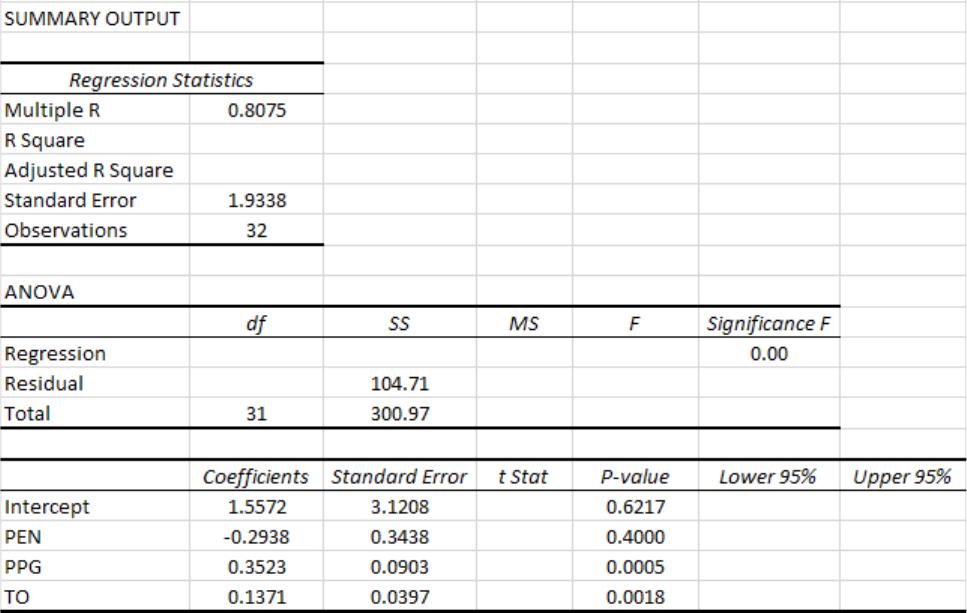
•Average number of penalties committed per game during the season (PEN)
•Turnover differential during the season (TO)
Turnover differential is defined as the number of times the team took the ball away from
their opponent with a turnover minus the number of times the team gave the ball away to
their opponent with a turnover. For example, if TO = +5, the team had five more
takeaways than giveaways. If TO = “7, the team had seven more giveaways than
takeaways during the season.
The following Excel output shows the partially completed regression output from a
random season.
Which one of the following statements is true concerning the 95% confidence interval for
the regression coefficient for the PPG variable?
A) Because the confidence interval includes zero, we have evidence to conclude that there
is a relationship between the average points per game and the average number of wins per
season for a team.
B) Because the confidence interval includes zero, we have evidence to conclude that there
is no relationship between the average points per game and the average number of wins per
season for a team.
C) Because the confidence interval does not include zero, we have evidence to conclude
that there is a relationship between the average points per game and the average number of
wins per season for a team.
D) Because the confidence interval does not include zero, we have evidence to conclude
that there is no relationship between the average points per game and the average number
of wins per season for a team.
The following data represents the ages of a household that consists of five people.
Assume that the household is considered a population in this example.
The standard deviation of this data set is ________.
A) 10.9
B) 12.0
C) 14.5
D) 16.0
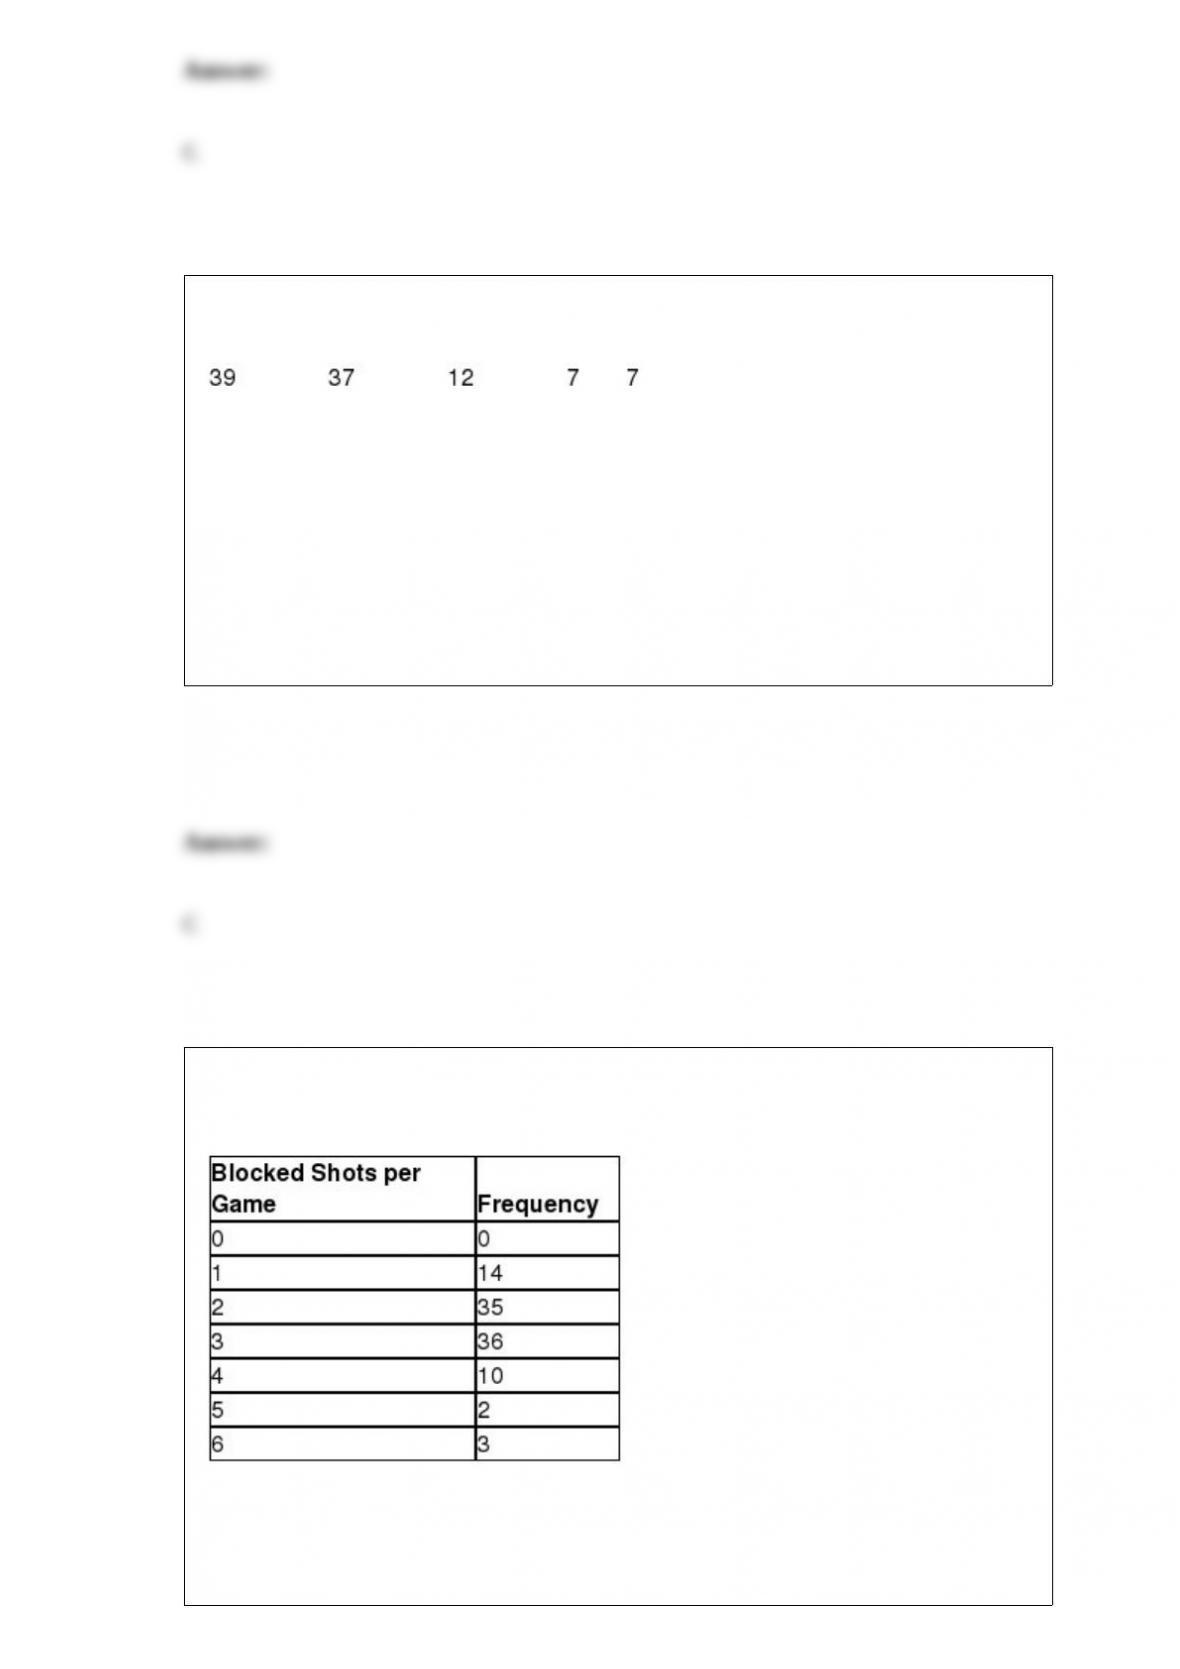
The following distribution shows the frequency distribution of the number of shots a
particular NBA player blocked in one game for a random sample of 100 games.
You have been assigned the task to test if the distribution of blocked shots per game for
this player follows the Poisson distribution using α = 0.05. The test statistic for this
sample is ________.

A) 3.819
B) 8.755
C) 15.627
D) 27.963
YouTube would like to test the hypothesis that the standard deviation for the length of
an online video watched by a user is more than 2 minutes. A random sample of 21
people who watched online videos was selected. The sample standard deviation for the
length of the video was found to be 2.5 minutes. Using α = 0.10, the conclusion for this
hypothesis test would be that because the test statistic is
____________________________.
A) more than the critical value, we can reject the null hypothesis and conclude that the
standard deviation for the length of online videos is more than 2.0 minutes
B) less than the critical value, we can reject the null hypothesis and cannot conclude
that the standard deviation for the length of online videos is more than 2.0 minutes
C) less than the critical value, we fail to reject the null hypothesis and cannot conclude
that the standard deviation for the time to complete an exam is less than 5.0 minutes
D) more than the critical value, we fail to reject the null hypothesis and conclude that
the standard deviation for the length of online videos is more than 2.0 minutes

The average natural gas bill for a random sample of 26 homes in the 19808 zip code
during the month of March was $305.30 with a sample standard deviation of $46.50.
The 80% confidence interval around this sample mean is ________.
A) ($268.82, $341.78)
B) ($277.94, $332.66)
C) ($287.06, $323.54)
D) ($293.3, $317.3)
Suppose Pepsi wants to perform a blind taste test to determine if people prefer Pepsi
Max or Pepsi One. The following table shows the preferences of a random sample of
adults.
The p-value for this hypothesis test is ________.
A) 0.0326
B) 0.0405
C) 0.1334
D) 0.2668

The critical value for a one-tail (upper) hypothesis test when the population standard
deviation is known, the sample size is 30 or more, and α = 0.02 is ________.
A) 2.05
B) 2.33
C) 2.575
D) 2.96
In Delaware, cars are inspected each year using state-operated inspection centers. The
Wilmington center has three drive-through lanes where cars are inspected in a sequence
of steps. The following data show the number of minutes that a random sample of
drivers spent waiting and having their cars inspected in the three lanes each day of the
week.
The state of Delaware would like to perform a randomized block ANOVA to test for a
difference in the average times the drivers spend in the three lanes using the weekday as
a blocking factor with α = 0.05. The total sum of squares for these observations is
________.
A) 836.0
B) 902.8
C) 974.4
D) 1,045.3
The sum of squares ________ measures the variation between each sample mean and
the grand mean of the data.
A) within
B) between
C) block
D) error
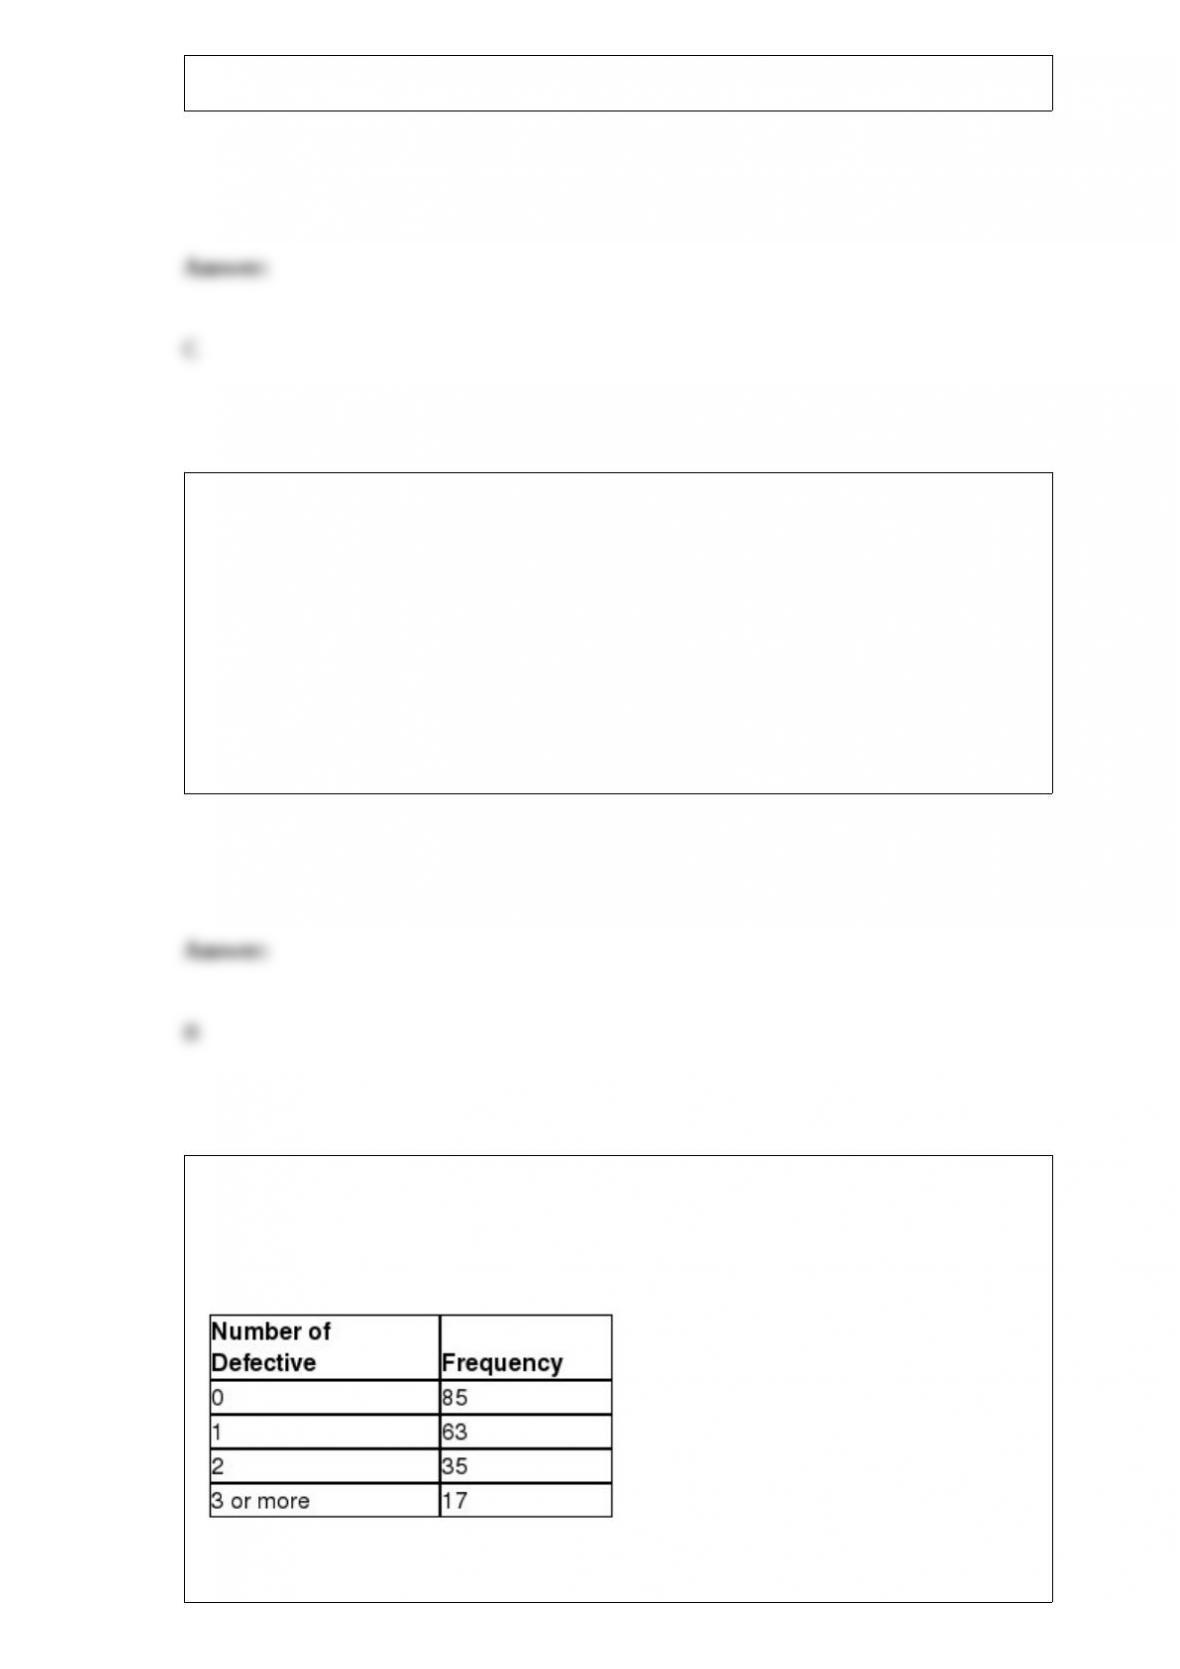
A manufacturer of smartphone batteries will randomly select 20 batteries from the
process each day and count the number of defects. Historically, 4% of the batteries
produced by this company have been defective. The following data represent the
frequency of defective batteries from a random sample of 200 days.
The manufacturer would like to test if the probability distribution for defective batteries

follows the binomial distribution with p = 0.04 and n = 20 using α = 0.05. The degrees
of freedom for the critical value is ________.
A) 3
B) 4
C) 5
D) 6
________ are the choices available to the decision maker in the field of decision
analysis.
A) States of nature
B) Alternatives
C) Outcomes
D) Payoffs
The following graph shows the average grade point average for a particular college
from 2006 until 2013.
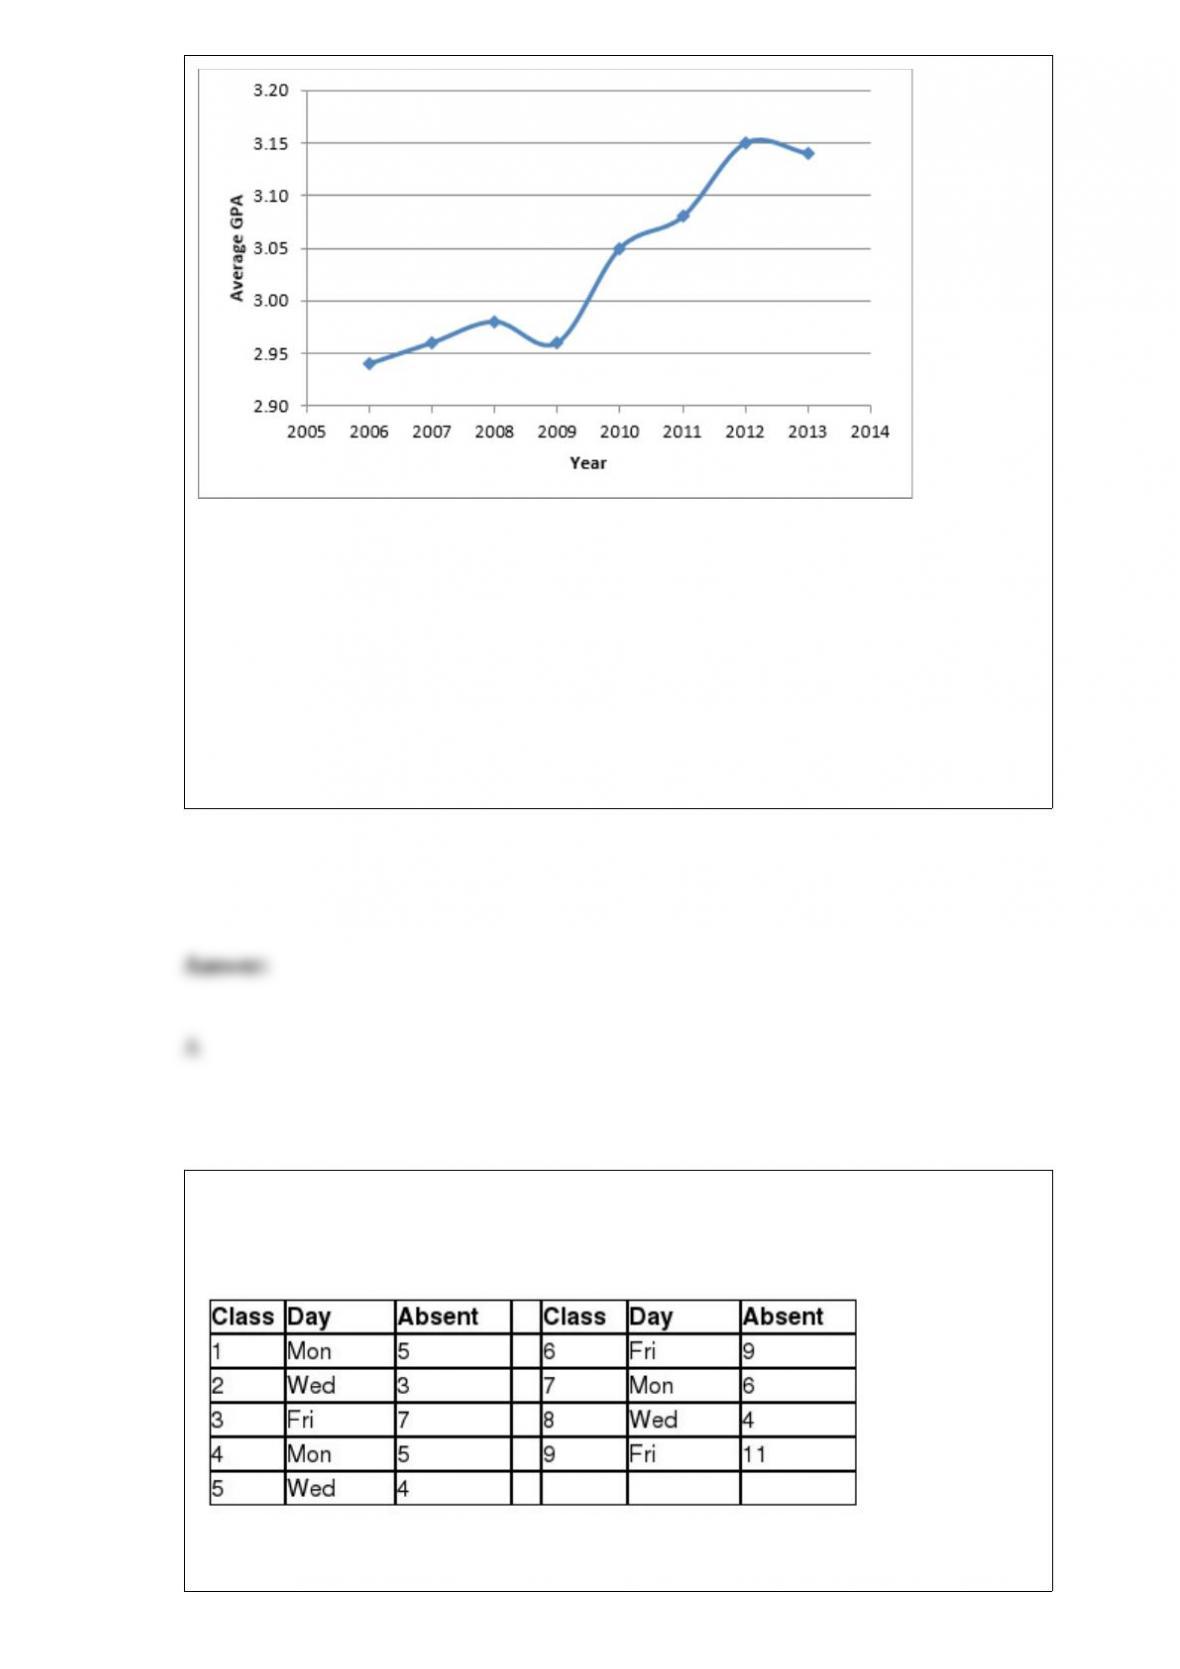
This graph is an example of a _________.
A) line chart
B) vertical bar chart
C) Pareto chart
D) histogram
A large statistics class meets on Monday, Wednesday, and Friday each week during the
semester. The following data shows the number of absent students for the last nine
classes.
The mean absolute deviation for forecasting absent students using multiplicative
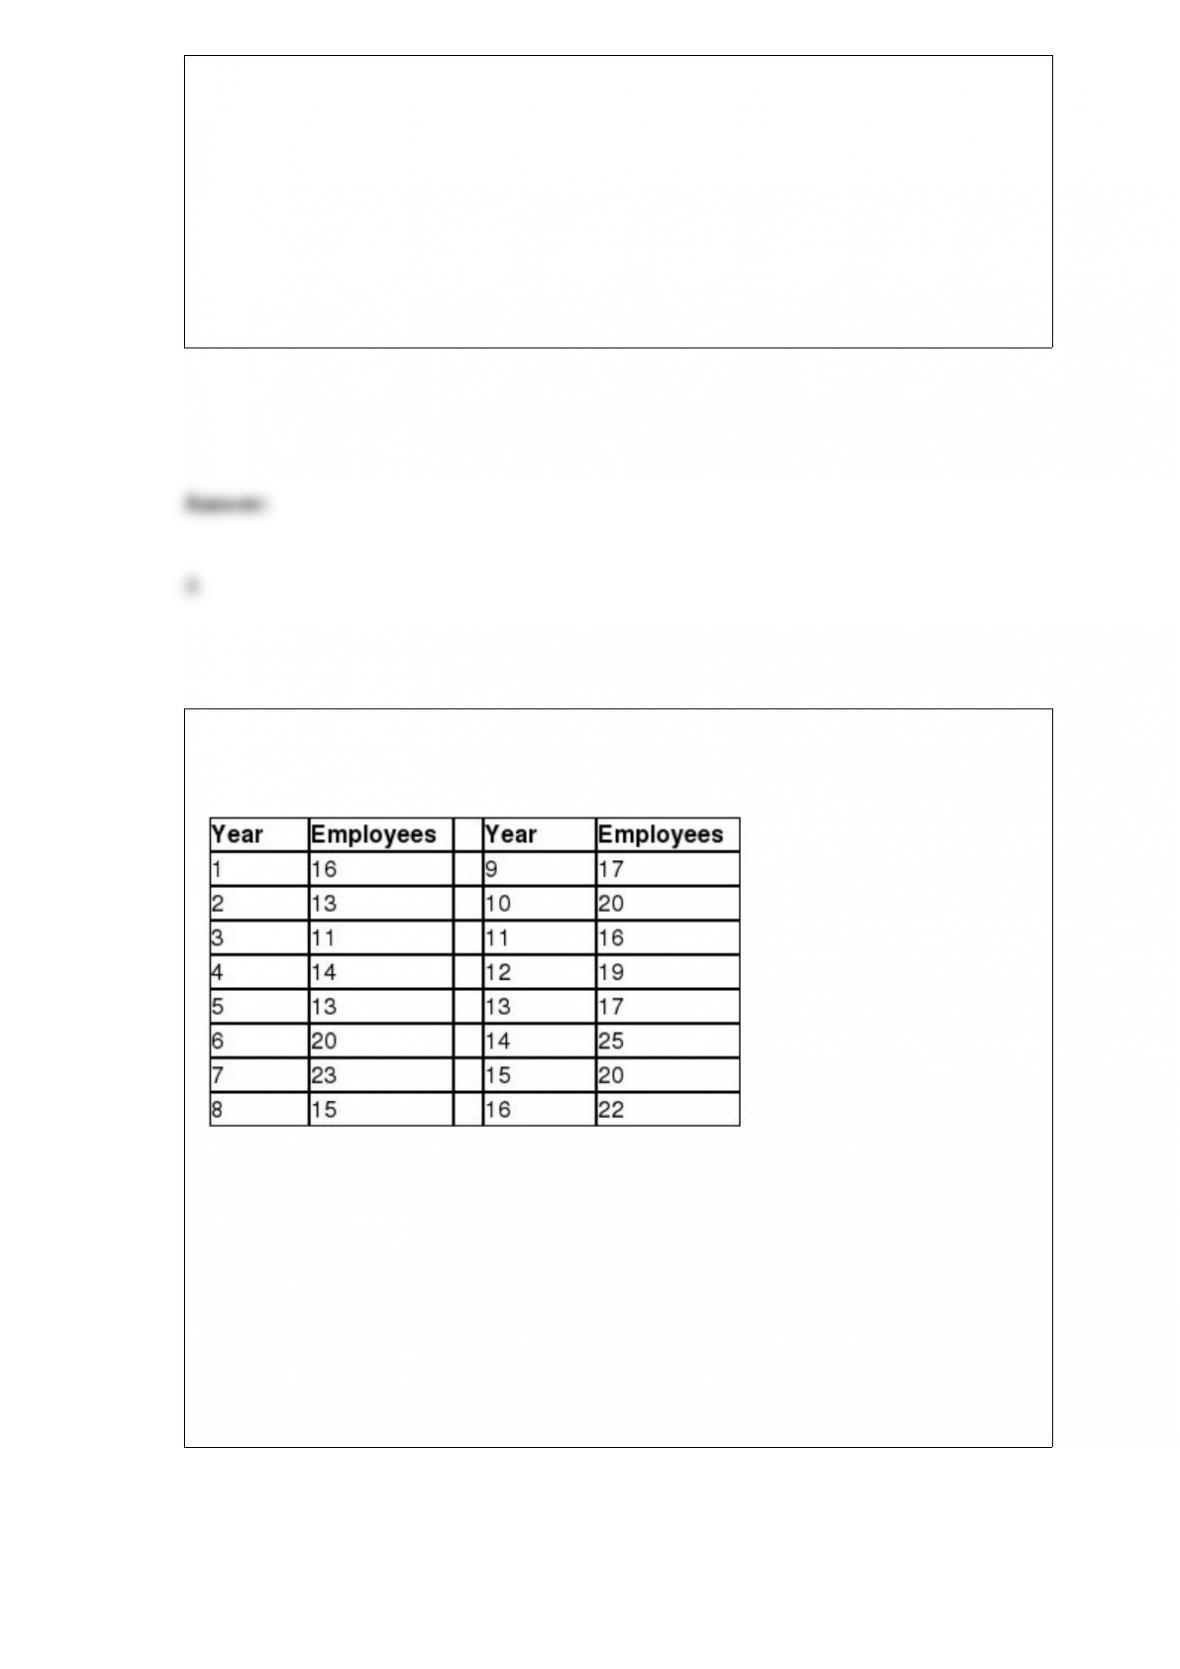
decomposition is ________.
A) 0.37
B) 2.30
C) 2.82
D) 3.33
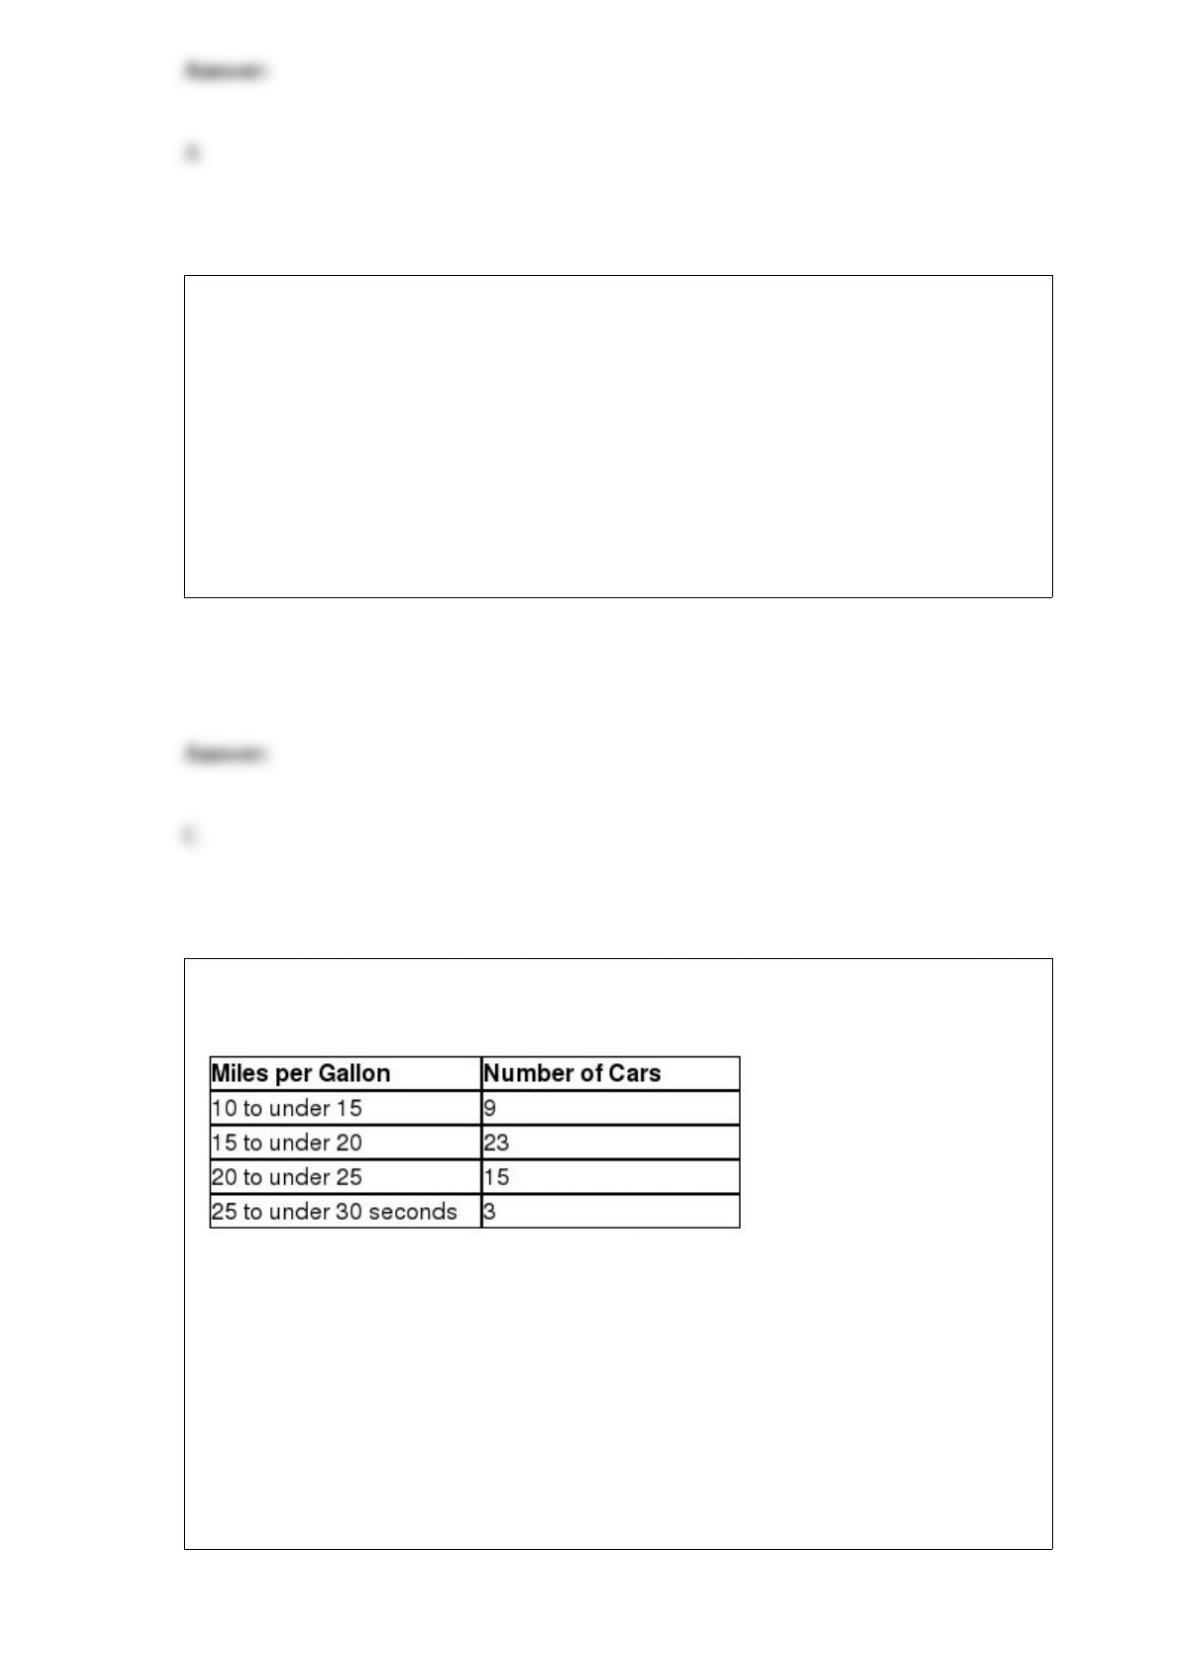
The following table shows the number of employees at Diamond Corporation over the
past 16 years.
The Durbin-Watson statistic for this time series is ________.
A) 2.15
B) 2.70
C) 3.44
D) 4.07
The ________ measures the variation in the dependent variable that is explained by the
set of independent variables in multiple regression.
A) sum of squares within
B) sum of squares error
C) sum of squares regression
D) total sum of squares
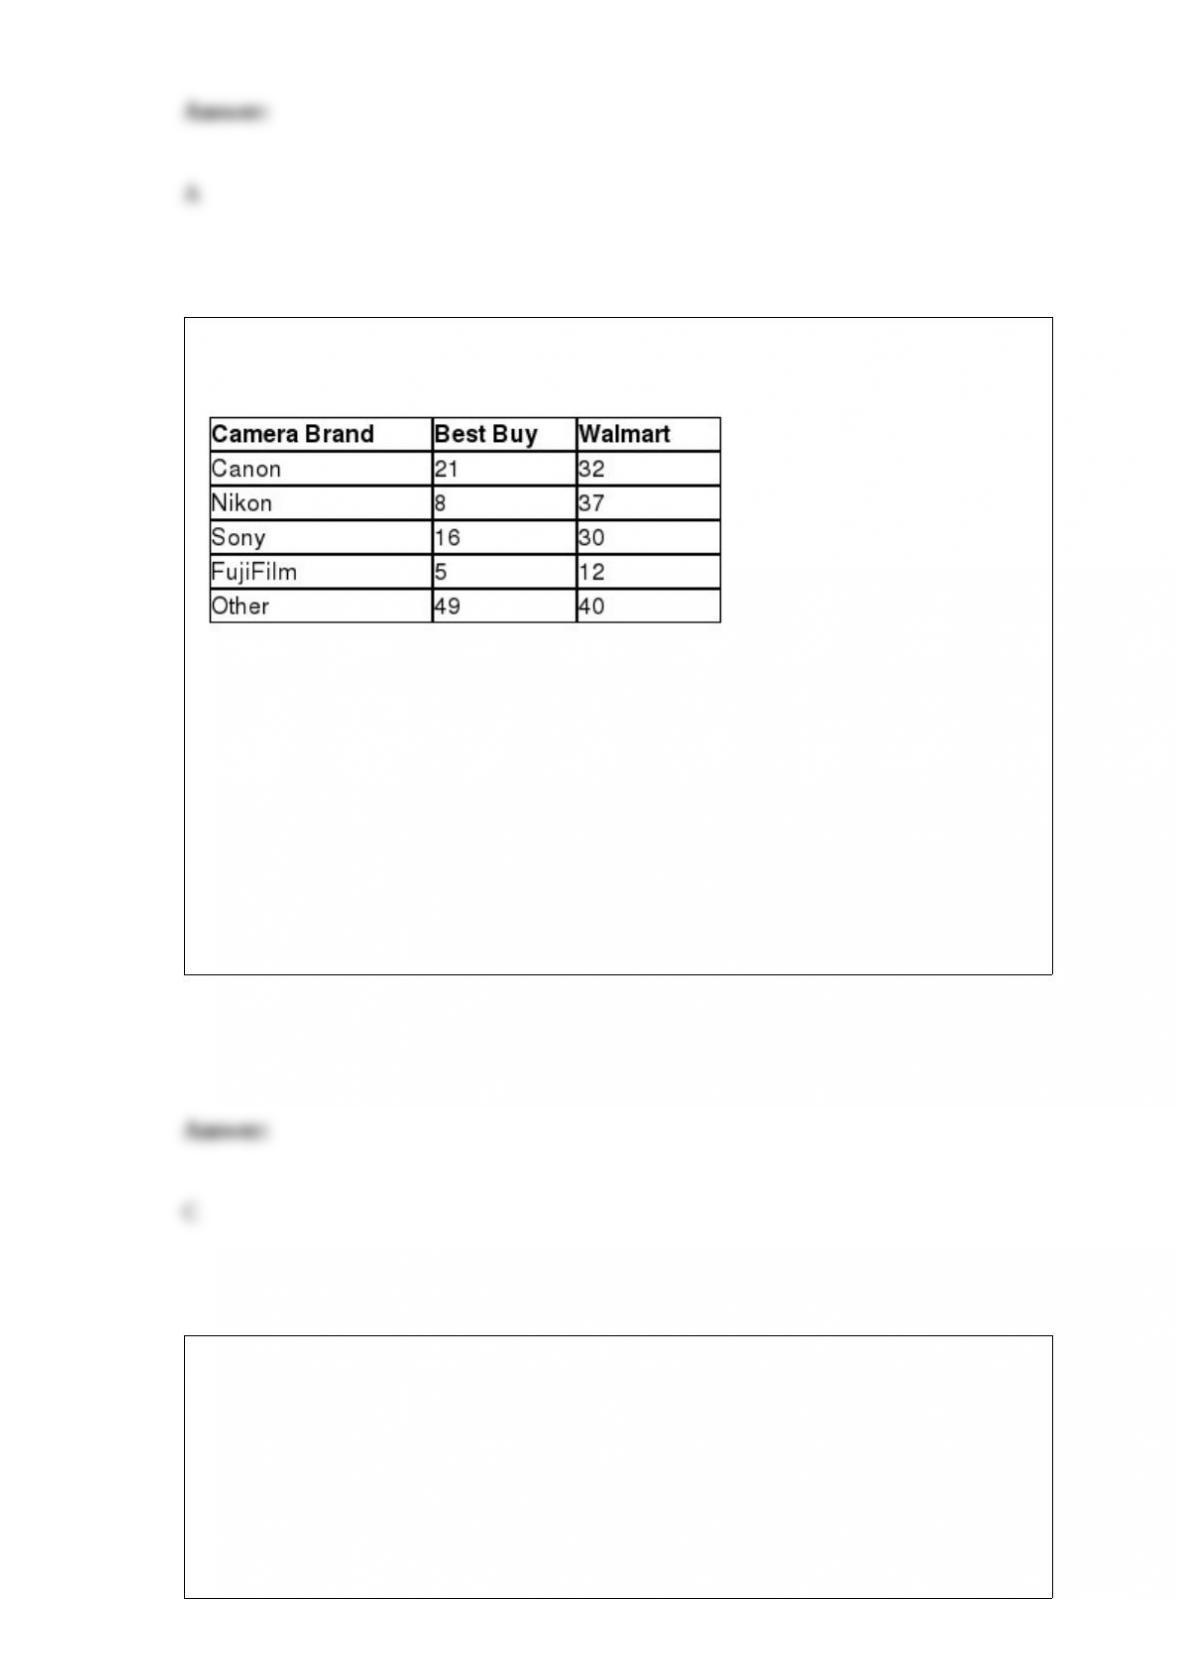
Smith Motors currently has 50 cars in their inventory. The following table shows the
number of cars in each class of combined city and highway miles per gallon.
What is the approximate variance for miles per gallon for cars from this population?
A) 16.6
B) 16.9
C) 17.3
D) 17.8
The following contingency table shows the number of customers who bought various
brands of digital cameras at Walmart and Best Buy.
The probability that a randomly selected customer from this sample bought a Canon
camera or a Nikon camera is ________.
A) 0.240
B) 0.333
C) 0.392
D) 0.500
According to the Centers for Medicare & Medicaid Services, 21% of nursing homes in
the United States received five stars in overall ratings on a scale of 1 to 5. A random
sample of seven nursing homes was selected. What is the probability that two or three
of them received five stars?
A) 0.1457
B) 0.2226
C) 0.2381
D) 0.4112
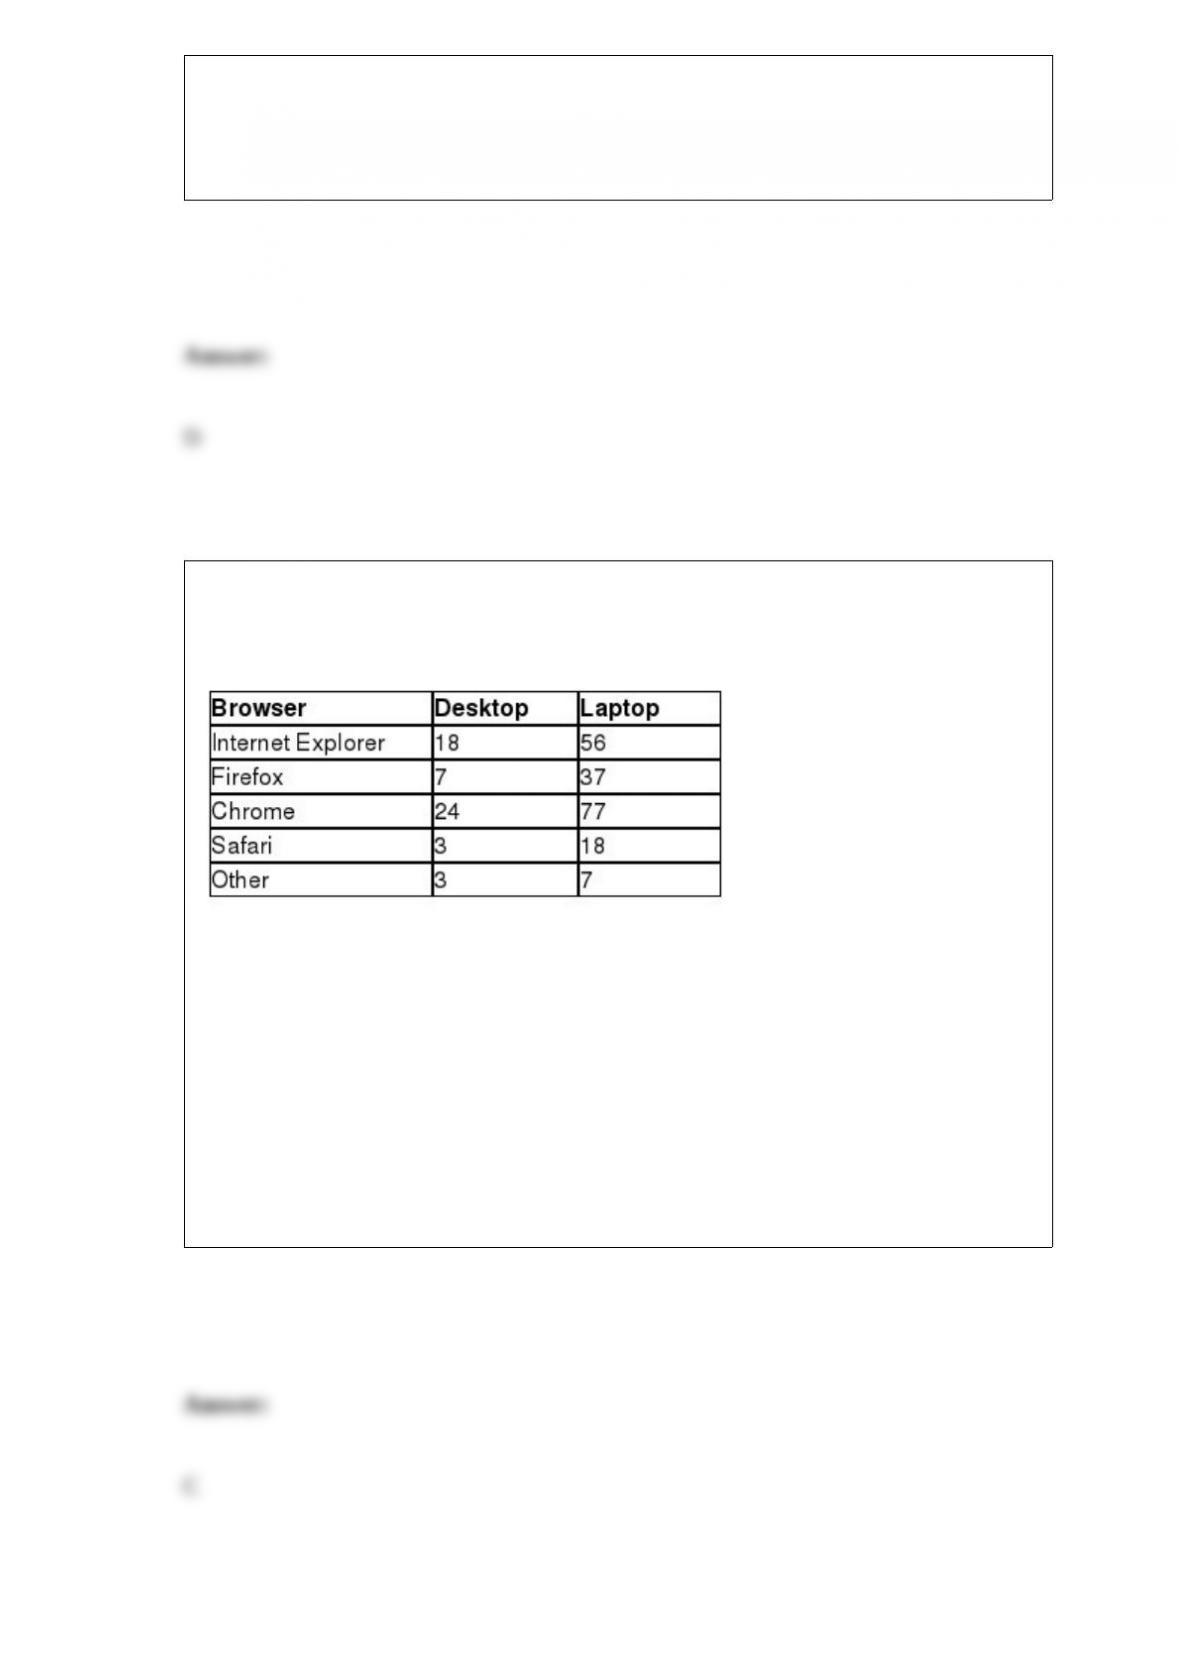
A random sample of computer users were asked which browser they primarily relied on
for surfing the Internet and whether this browser was installed on a desktop or laptop
computer. The following contingency table shows these results.
The probability that a randomly selected person from this sample used the Chrome
browser and used a laptop computer is ________.
A) 0.104
B) 0.237
C) 0.308
D) 0.440
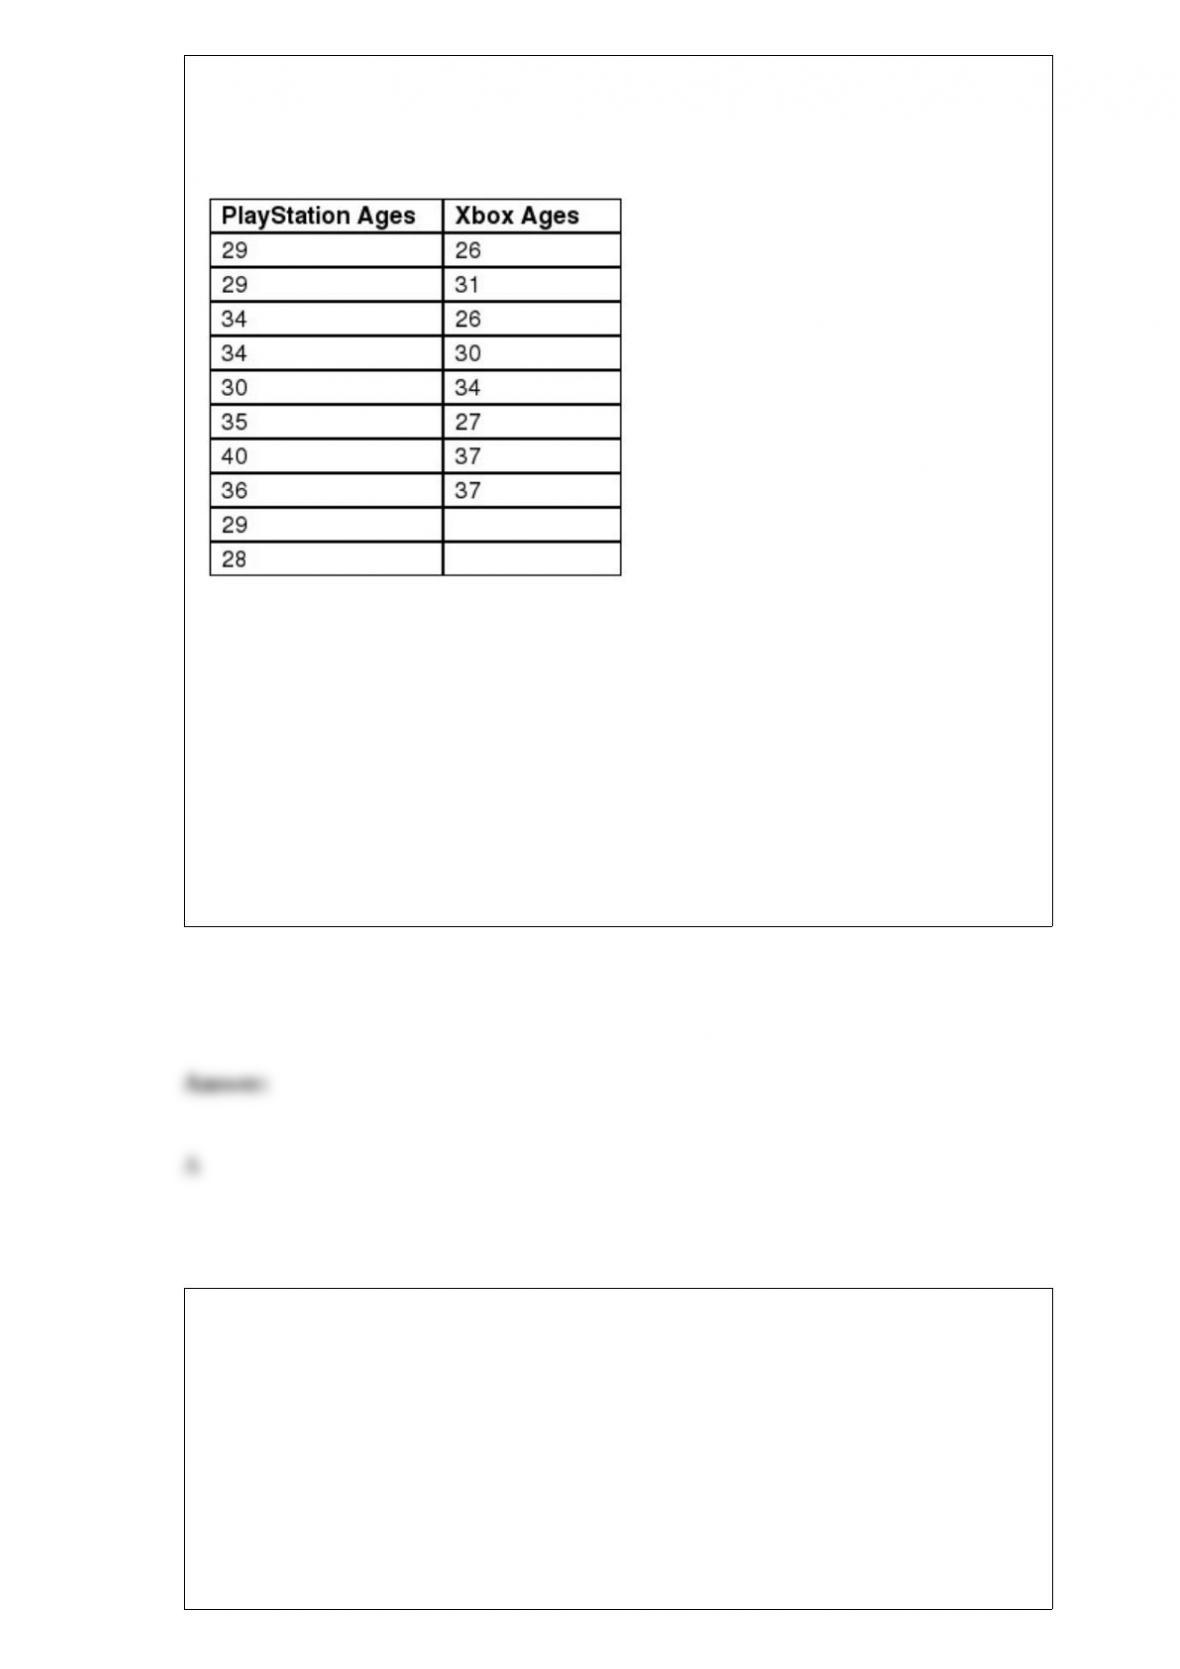
Sony would like to test the hypothesis that the median age of a PlayStation user is
different from the median age of an Xbox user. The following table shows the ages of a
random sample of PlayStation and Xbox users.
The appropriate nonparametric procedure for this analysis is the _________________
test.
A) Wilcoxon rank-sum
B) sign
C) Wilcoxon signed-rank
D) Kruskal-Wallis
A Florida neighborhood is comprised of 250 houses of which 12% are in foreclosure. A
random sample of 91 homes from this neighborhood was selected. The standard error of
the proportion is ________.
A) 0.0272
B) 0.0341
C) 0.0566
D) 0.0748
Calculating the probability of drawing three aces with a random sample of five cards
from a standard 52-card deck is using ________ probability.
A) classical
B) simple
C) empirical
D) subjective
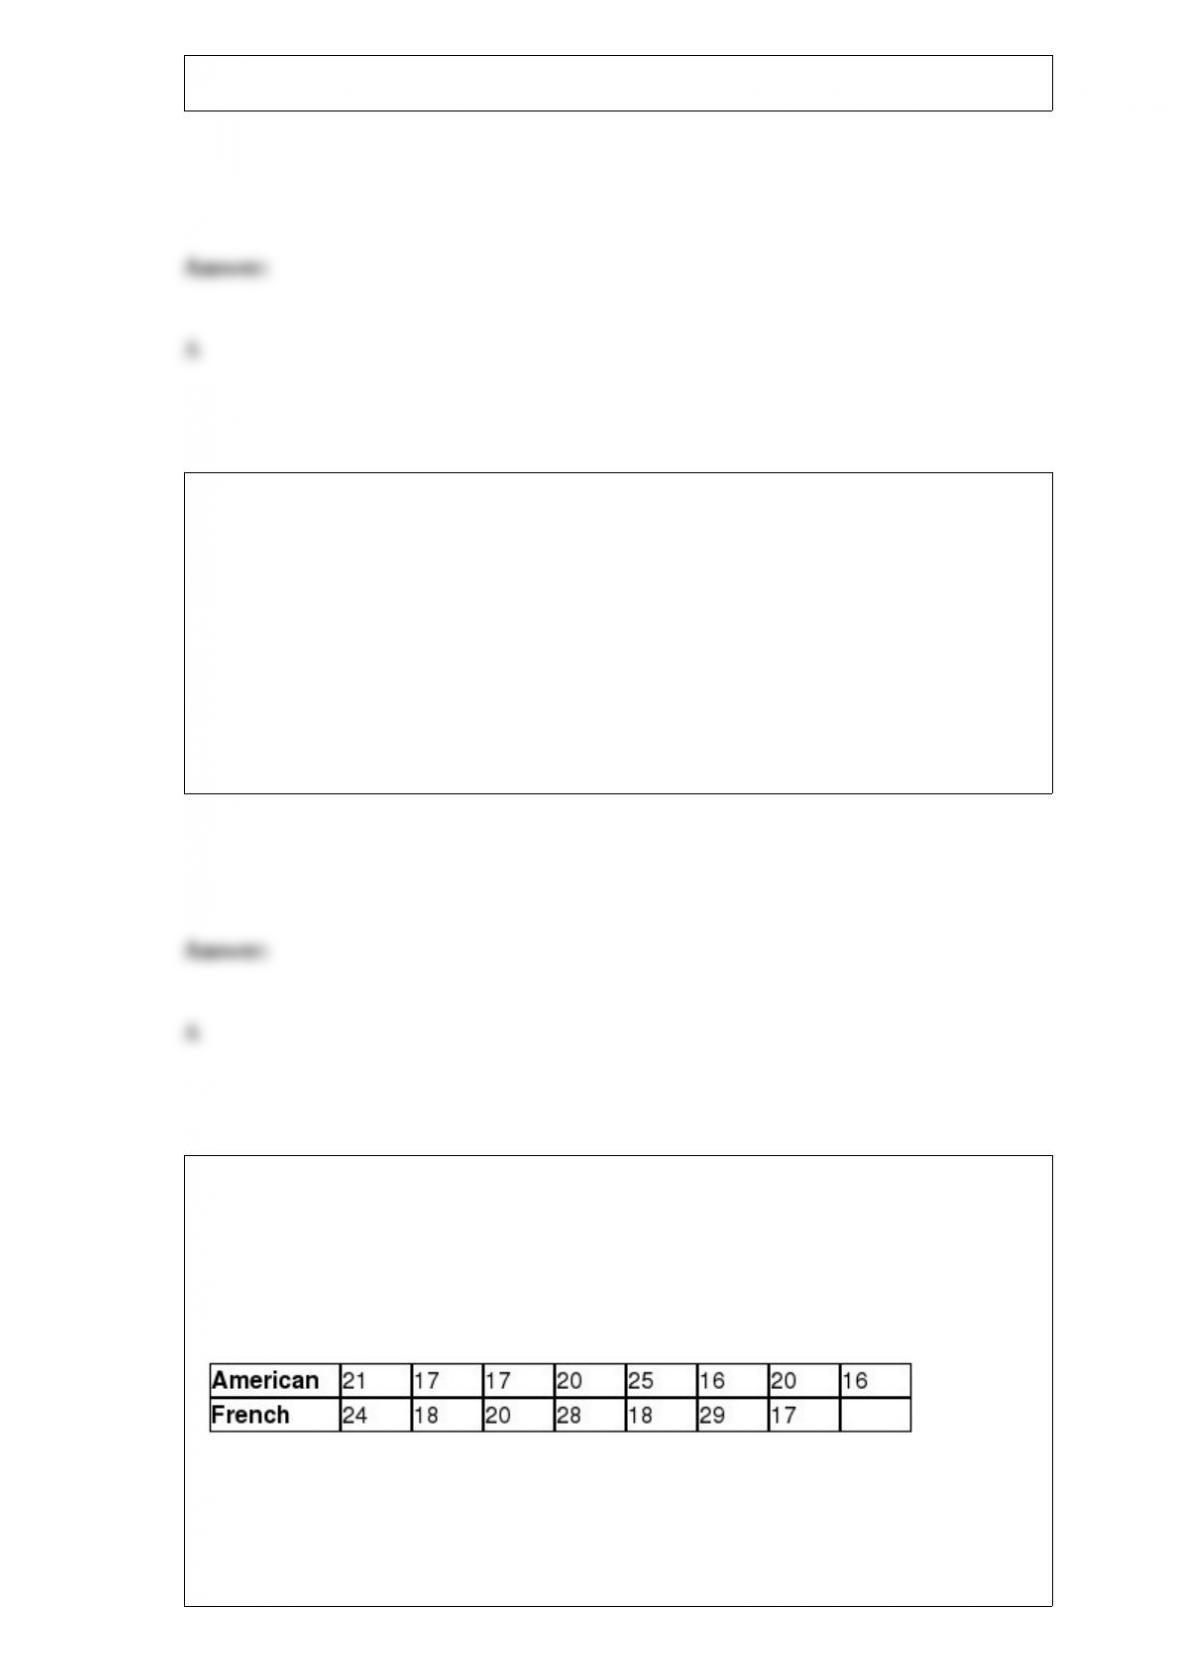
The Wall Street Journal reported that the average amount of time that a French person
spends eating lunch at a restaurant is 22 minutes. Perform a hypothesis test to determine
if a difference exists between the average time an American spends eating lunch when
compared to a person from France. The following data represents the time, in minutes,
that random French and American diners spent at lunch. Assume that the population
variances are equal.
The standard deviation of the American sample is ________.
A) 2.41
B) 3.12
C) 4.00
D) 5.27
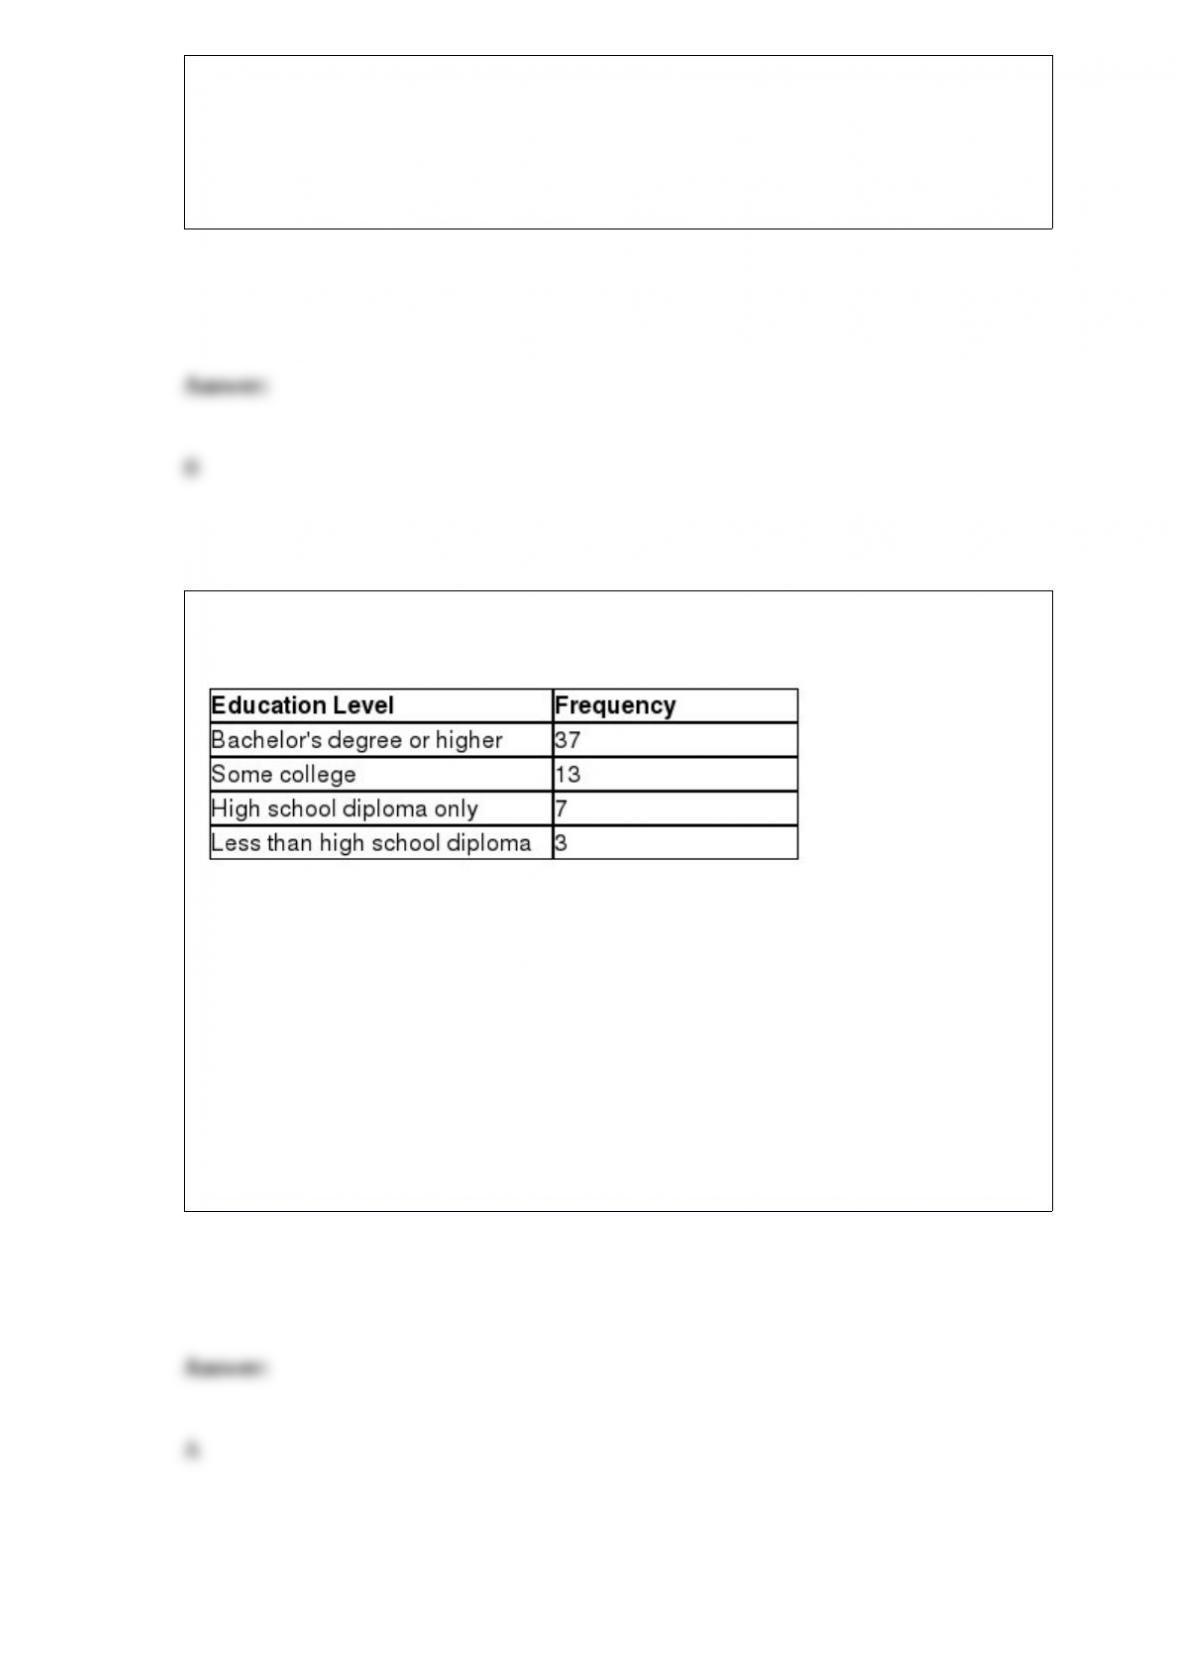
A survey of adults who typically work full-time from home recorded their current
education levels. The results are shown in the table below.
Calculating the probability that a randomly selected adult who works from home and
has a bachelor’s degree or higher is using ________ probability.
A) empirical
B) simple
C) subjective
D) classical