
Prior to computing a Friedman test, the data are ranked within each block from smallest
to largest.
Quality control is the collection of strategies, techniques, and actions taken by an
organization to assure itself that it is producing a quality product.
Statistics is commonly divided into two branches called descriptive statistics and
summary statistics.
A summary of data in which raw data are grouped into different intervals and the
number of items in each group is listed is called a frequency distribution.

In the model y =
0+
1x1+
2x2+
3x3+
is a constant.
A small value of the Durbin”Watson statistic indicates that successive error terms are
positively correlated.
An exponential smoothing technique in which the smoothing constant alpha is equal to
one is equivalent to a regression forecasting model.

The highest level of data measurement is the ratio level.
For grouped data, the mode is the class midpoint of the modal class where the model
class is the class interval with the greatest frequency.
The list of all elementary events for an experiment is called the sample space.
Statistics can be used to predict the business future.

An assumption underlying the use of t-statistic in sample-based estimation is that the
population is normally distributed.
If every unit of the population has the same probability of being selected to the sample,
then the researcher is conducting random sampling.
If the trend equation is quadratic in time t=1″.T, the forecast value for the next time T+1
depends on time T.

Variables and measurement data are interchangeable terms.
In a multiple regression analysis with N observations and k independent variables, the
degrees of freedom for the residual error is given by (N “ k ” 1).
In a decision-making scenario, if it is not known which of the states of nature will occur
but the probabilities of occurrence of the states are known the scenario is called
decision-making under risk.
A Pareto chart and a pie chart are both types of qualitative graphs.

The null and the alternative hypotheses must be mutually exclusive and collectively
exhaustive.
Multiple t-tests are used to determine whether the independent variables in the
regression model are significant.
Forecast error is the difference between the value of the response variable and those of
the explanatory variables.

In many cases a business researcher gathers data to test a hypothesis about a single
population mean and the value of the population standard deviation is unknown. In this
case the researcher cannot use the ztest.
A correction for continuity must be made when approximating the binomial distribution
problems using a normal distribution.
A risk-avoider decision maker will bail out of risky scenario only if the compensation to
bail out is more than the expected monetary payoff from the risky scenario.

The appropriate test for comparing the medians of two populations using ordinal-level
data from two related samples is the Wilcoxon test.
Hypothesis tests conducted on sets of matched samples are sometimes referred to as
correlated t tests.
Gathering data from a sample to reach conclusions about the population from which the
sample was drawn is called descriptive statistics.
The first step in simple regression analysis usually is to construct a scatter plot.

The appropriate test for comparing the means of two populations using ordinal-level
data from two independent samples is the Mann-Whitney Utest.
Regression analysis with two dependent variables and two or more independent
variables is called multiple regression.
When using the chi-square goodness-of-fit test, the type of distribution (uniform,
Poisson, normal) being used does not influence the hypothesis test.

If a null hypothesis was rejected at the 0.025 level of significance, it will be rejected at
a 0.01 level of significance based on the same sample results.
The sampling distribution of the sample means is close to the normal distribution only
if the distribution of the population is close to normal.
The F-value to test the overall significance of a regression model is computed by
dividing the sum of squares regression (SSreg) by the sum of squares error (SSerr).

Numbers which are used only to classify or categorize the observations represent data
measured at the nominal level.
In a histogram, the tallest bar represents the class with the highest cumulative
frequency.
Statistics are used to market vitamins.
Let xbe a binomial random variable withn=35 andp=.20. If we use the normal
distribution to approximate probabilities for this, we would use a mean of _______.
a) 35
b) 20
c) 70
d) 7
e) 3.5
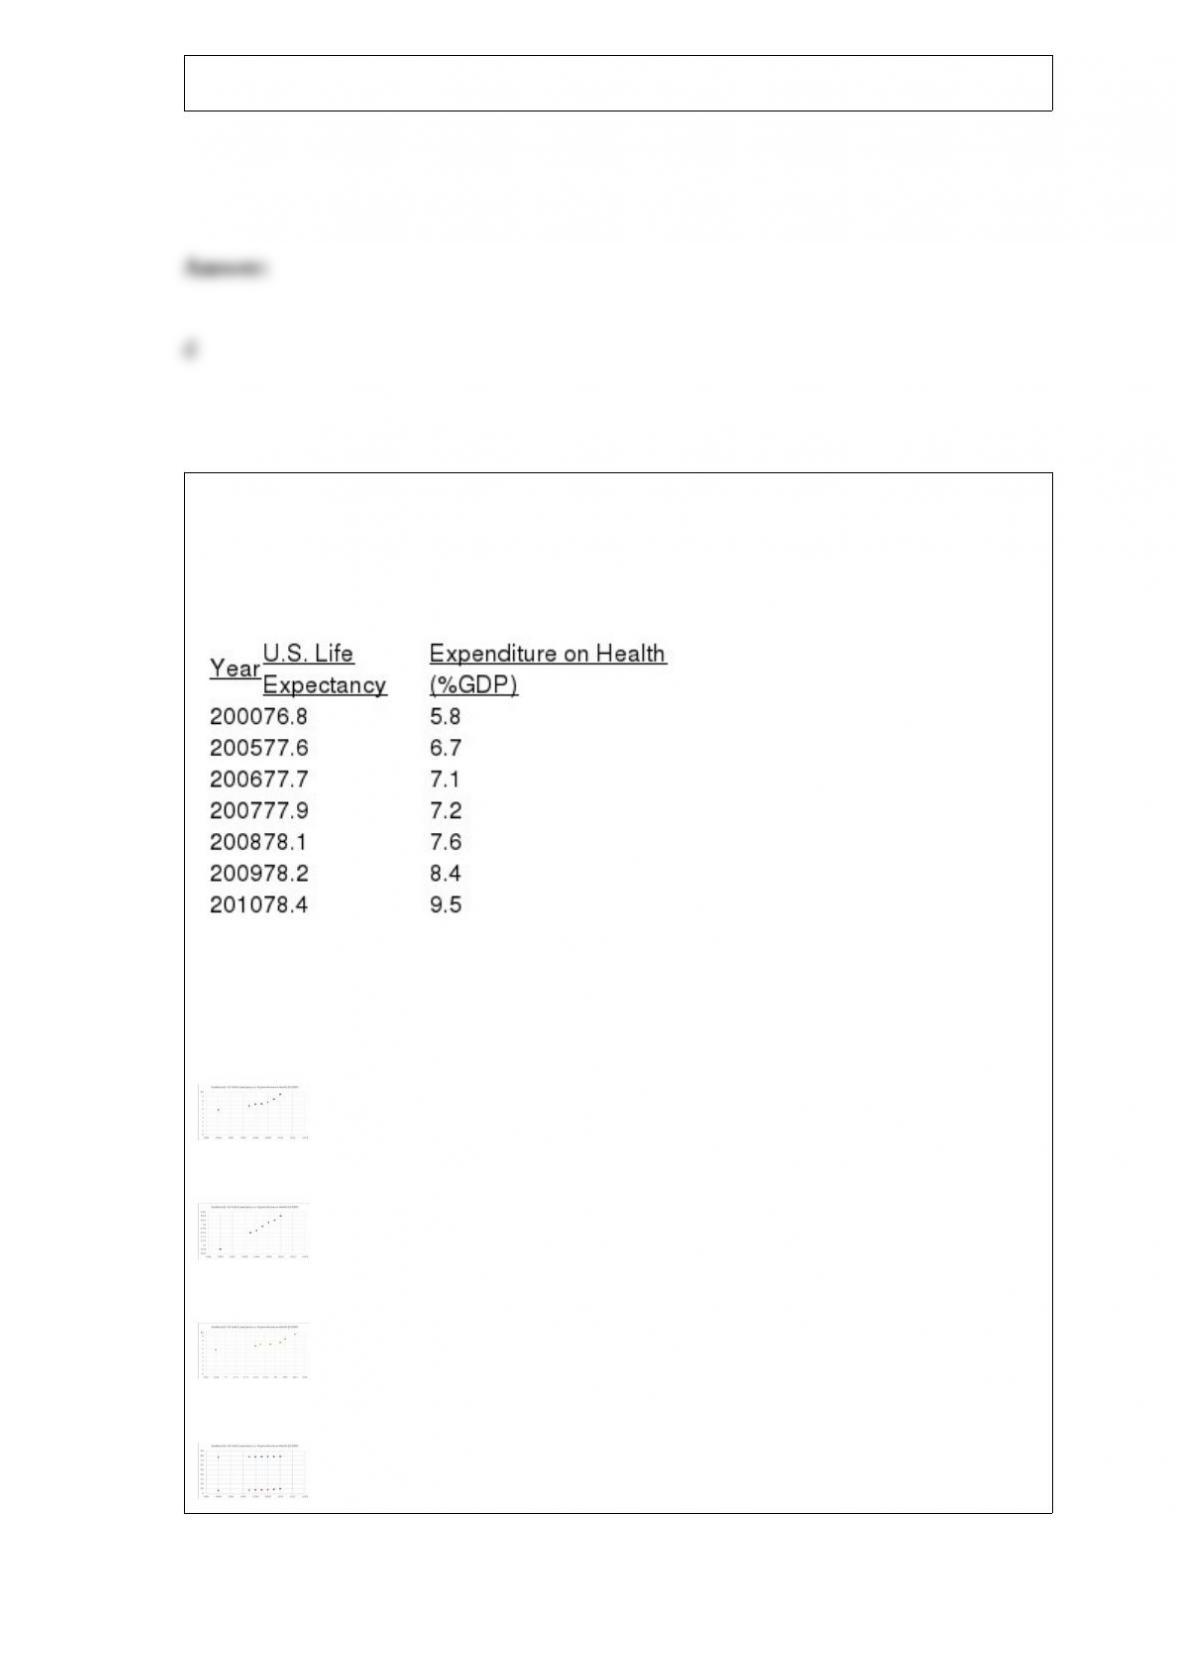
The United Nations Development Programme website provides comparative data by
country on key metrics. Two such metrics are life expectancy and expenditures on
health as a percent of GDP. The table below show data on life expectancy and health
expenditures in the United States.
Which of the following scatterplots best depicts the relationship between life
expectancy and expenditures on health as a percent of GDP?
a.
b.
c.
d.

Catherine Chao, Director of Marketing Research, needs a sample of households to
participate in the testing of a new toothpaste package. She directs the seven members of
her staff to find five households each. Catherine’s sample is a _____________.
a) cluster sample
b) proportionate stratified sample
c) quota sample
d) disproportionate stratified sample
e) simple random sample
While reviewing staffing plans for a new pilot plant, Colin Chenaux, VP of Operations
at Clovis Chemicals, Inc., designed an experiment to test the effects of “supervisor’s
style” and “training method” on the productivity of operators. The treatment levels
were: (1) authoritarian, and participatory for supervisor’s style, and (2) technical
manuals, training films, and multimedia for training method. Three qualified applicants
were randomly selected and assigned to each of the six cells. Colin’s experimental
design is _____________.
a) random block design
b) normalized block design
c) completely randomized design
d) factorial design
e) fractional design

Charles Clayton monitors the daily performance of his investment portfolio by
recording a “+” or a “-“sign to indicate whether the portfolio’s value increased or
decreased from the previous day. His record for the last eighteen business days is “- + +
– – – + – – + + + + + + + + -“. The number of runs in this sample is _________.
a) seven
b) six
c) four
d) three
e) one
Which of the following quality control chart conditions is an indicator that the process
is, potentially, out-of-control?
a) several consecutive data points between the UCL and the LCL
b) a data point above the LCL
c) a data point below the UCL
d) an upward trend of nine data points
e) a data point in the outer 1/3 region

Pinky Bauer, Chief Financial Officer of Harrison Haulers, Inc., suspects irregularities in
the payroll system. She knows that 2,500 payroll vouchers have been issued since
January 1, 2000, and her staff doesn’t have time to inspect each voucher. So, she orders
her staff to inspect the last 200 vouchers. Her sample is a ___________.
a) stratified sample
b) simple random sample
c) convenience sample
d) systematic sample
e) cluster sample
Ophelia O’Brien, VP of Consumer Credit of American First Banks (AFB), monitors the
default rate on personal loans at the AFB member banks. One of her standards is “no
more than 5% of personal loans should be in default.” On each Friday, the default rate
is calculated for a sample of 500 personal loans. Last Friday’s sample contained 30
defaulted loans. Using
= 0.01, observed chi-square value is _______.
a) 13.38
b) 26.29
c) 2.09
d) 1.05
e) 3.98
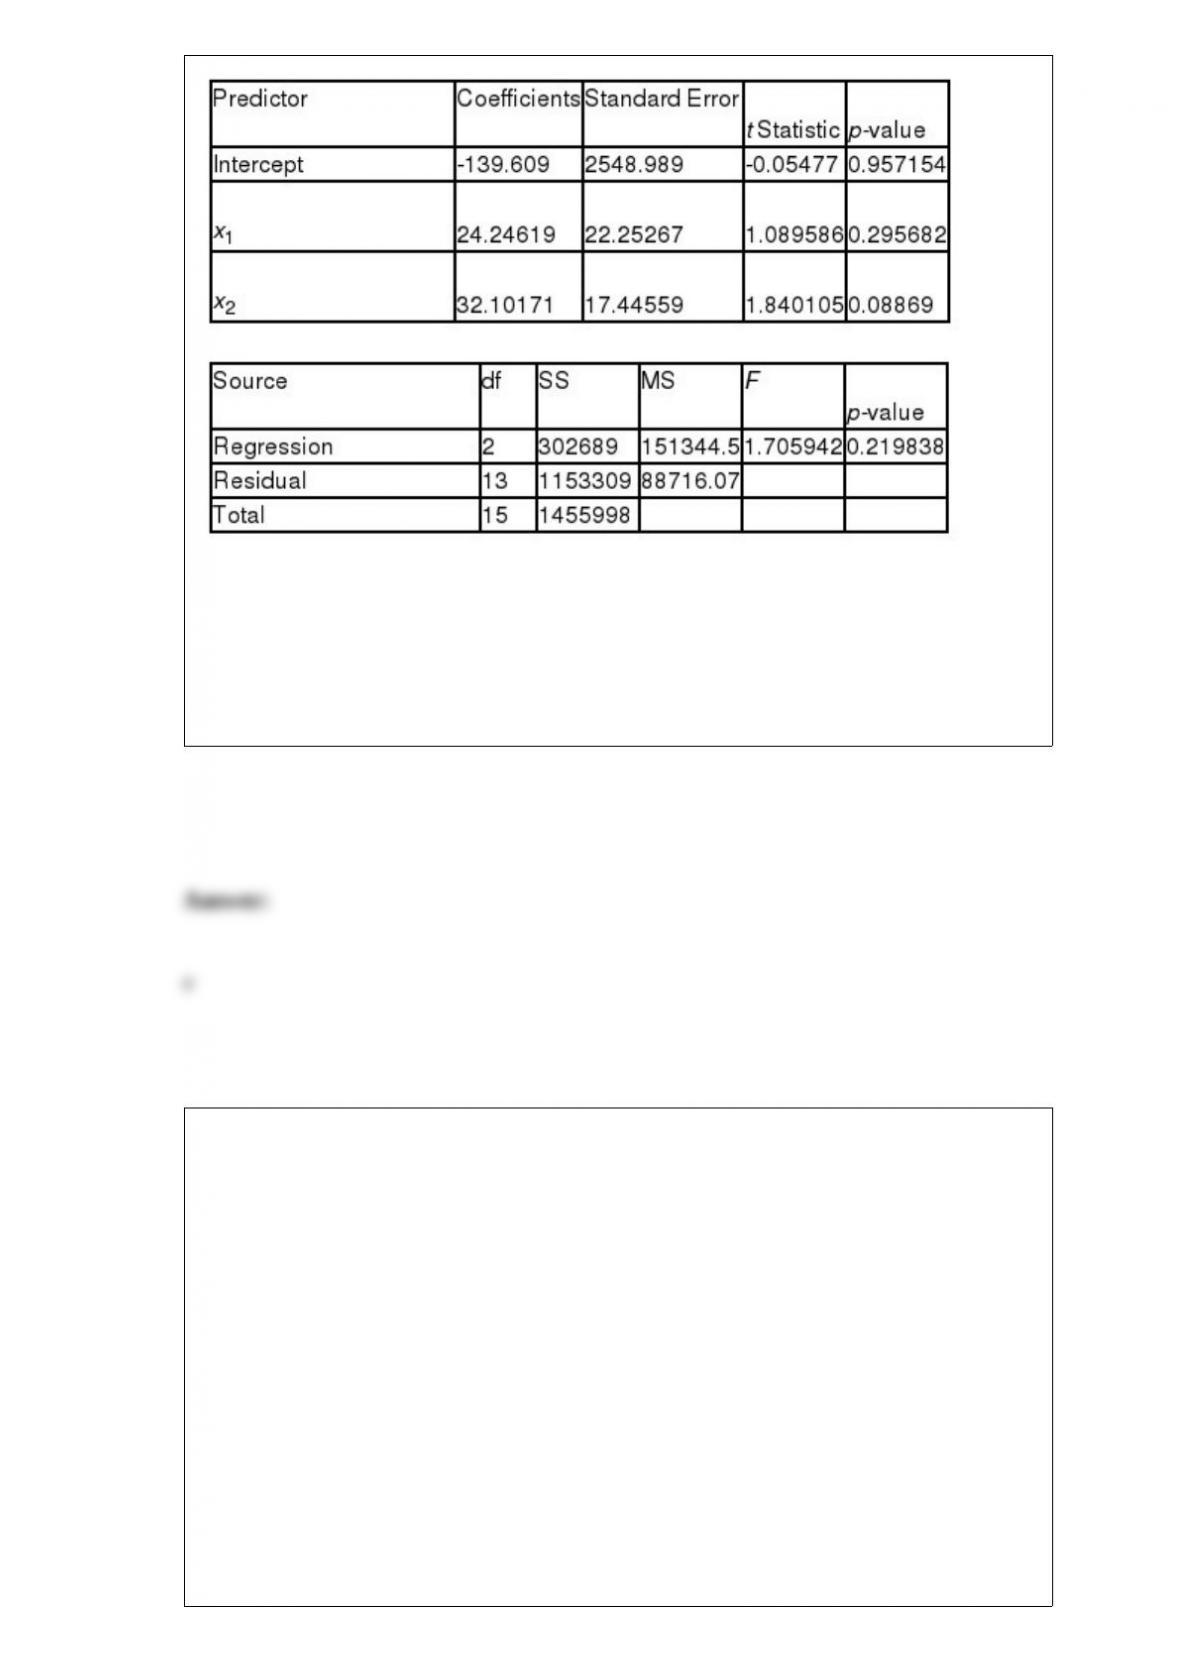
A multiple regression analysis produced the following tables.
Using a = 0.05 to test the null hypothesis H0: b1 = 0, the critical t value is ____.
a) 1.753
b) 2.110
c) 2.131
d) 1.740
e) 2.500
Sarah Soliz, Director of Quality Programs, is designing and R charts for the
rod shearing process at Stockton Steel. She has 26 samples of rod length, and each
sample included measurements of 5 rods. The mean of the 26 sample means is 112
inches, and mean of the 26 ranges is 0.15 inch. The lower control limit for her

chart is ____.
a) 25.913
b) 4.913
c) 111.91
d) 108.10
e) 112.84
A researcher is interested in testing to determine if the mean price of a casual lunch is
different in the city than it is in the suburbs. The null hypothesis is that there is no
difference in the population means (i.e. the difference is zero). The alternative
hypothesis is that there is a difference (i.e. the difference is not equal to zero). He
randomly selects a sample of 9 lunch tickets from the city population resulting in a
mean of $14.30 and a standard deviation of $3.40. He randomly selects a sample of 14
lunch tickets from the suburban population resulting in a mean of $11.80 and a standard
deviation $2.90. He is using an alpha value of .10 to conduct this test. Assuming that
the populations are normally distributed, the critical tvalue from the table is _______.
a) 1.323
b) 1.721
c) 1.717
d) 1.321
e) 2.321
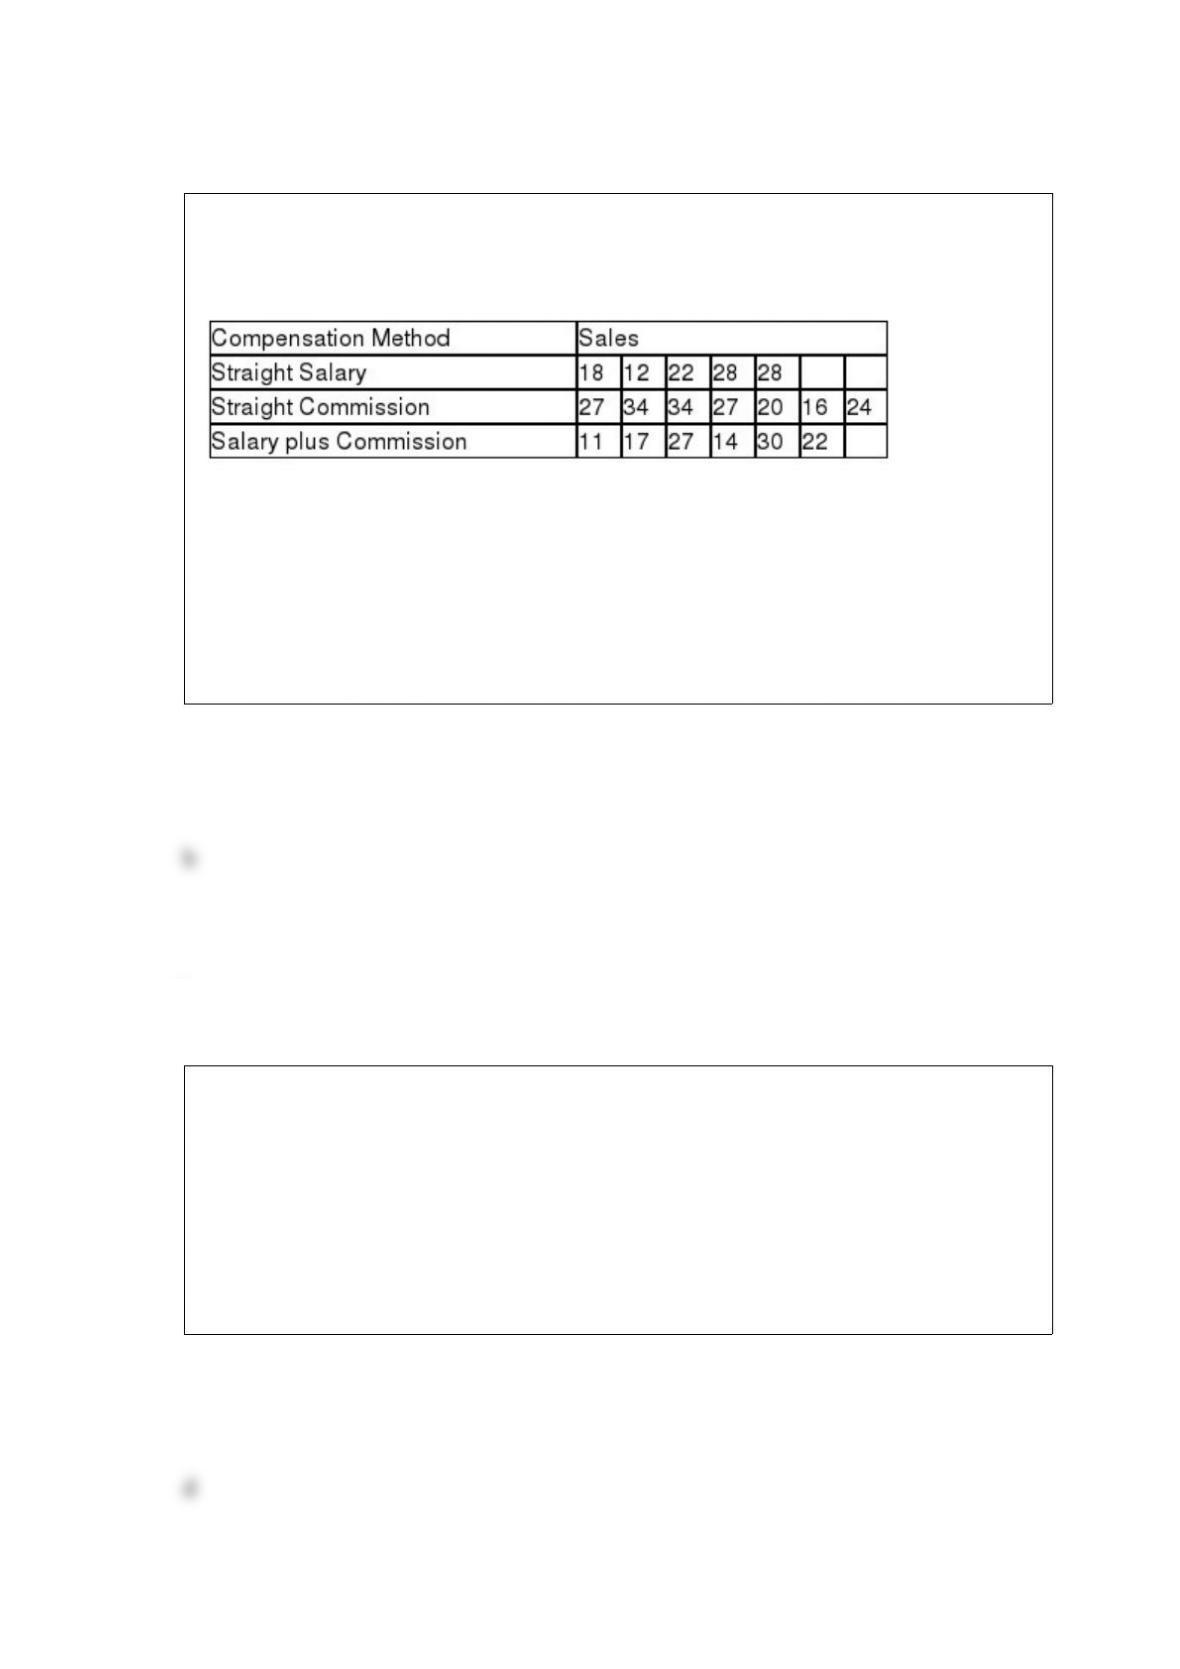
Performance records for 18 salespersons are selected to investigate whether
compensation methods are a significant motivational factor.
A Kruskal-Wallis test is to be performed with
= 0.01. The calculated K value is
_______.
a) 15.086
b) 1.715
c) 7.779
d) 9.210
e) 8.657
Let zbe a normal random variable with mean 0 and standard deviation 1. The
90thpercentile of zis ____________.
a) 1.645
b) -1.254
c) 1.960
d) 1.280
e) 1.650

Ten policyholders file claims with CareFree Insurance. Three of these claims are
fraudulent. Claims manager Earl Evans randomly selects three of the ten claims for
thorough investigation. If x represents the number of fraudulent claims in Earl’s sample,
P(x=1) is _______________.
a) 0.5250
b) 0.4410
c) 0.3000
d) 0.6957
e) 0.9957
A market researcher is studying the use of coupons by consumers of varying ages. She
classifies consumers into four age categories and counts the number of grocery store
customers who use at least one coupon during check out. It is expected that data are
uniformly distributed across the four age categories. The observed data results in
frequencies of 22, 35, 32, and 21. Using
= .05, the observed chi-square value is
_______.
a) 5.418
b) 9.10
c) 20.27
d) 4.51
e) 7.86

Catherine Chao, Director of Marketing Research, is evaluating consumer acceptance of
a new toothpaste package. She randomly selects a sample of 200 households. Forty
households prefer the new package to all other package designs. The 90% confidence
interval for the population proportion is _________.
a) 0.199 to 0.201
b) 0.153 to 0.247
c) 0.164 to 0.236
d) 0.145 to 0.255
e) 0.185 to 0.275
A random sample of 225 items from a population results in 60% possessing a given
characteristic. Using this information, the researcher constructs a 99% confidence
interval to estimate the population proportion. The resulting confidence interval is
_______.
a) 0.54 to 0.66
b) 0.59 to 0.61
c) 0.57 to 0.63
d) 0.52 to 0.68
e) 0.68 to 0.76

An instructor is evaluating the performance of students on a test. He records the number
of points that each student missed and created a frequency distribution. This is provided
below:
What is the standard deviation for this population?
a) 11.43
b) 14.14
c) 12.63
d) 13.17
e) 16.90
Pate’s Pharmacy, Inc. operates a regional chain of 120 pharmacies. Each pharmacy’s
floor plan includes a greeting card department which is relatively isolated. Sandra
Royo, Marketing Manager, feels that the level of lighting in the greeting card
department may affect sales in that department. She chooses three levels of lighting
(soft, medium, and bright) and randomly assigns six pharmacies to each lighting level.
Analysis of Sandra’s data yielded the following ANOVA table.

Using
= 0.05, the appropriate decision is _____________.
a) do not reject the null hypothesis
1
2
3
b) do not reject the null hypothesis
1
2
3
c) reject the null hypothesis
1
2
3
d) reject the null hypothesis
1
2
3
e) inclusive
Ophelia O’Brien, VP of Consumer Credit of American First Banks (AFB), is designing
a p chart to monitor the default rate on personal loans at the AFB member banks. Her
data includes the proportion in default for 30 samples of personal loans. Each sample
contains 50 loans, and the average of the 30 proportions is 0.05. The upper control limit
for Ophelia’s p chart is _____________.
a) 0.0925
b) 0.0500
c) 0.0308
d) 0.1825
e) 0.1425

Elwin Osbourne, CIO at GFS, Inc., is studying employee use of GFS e-mail for
non-business communications. A random sample of 200 e-mail messages was selected.
Thirty of the messages were not business related. The 98% confidence interval for the
population proportion is _________.
a) 0.108 to 0.192
b) 0.153 to 0.247
c) 0.091 to 0.209
d) 0.145 to 0.255
e) 0.250 to 0.275
Which of the following is not a random variable when flipping a coin?
a) Assigning 1 when Tail and 0 when Head
b) Assigning 0 when Head and 1 when Tail
c) The list of outcomes Head and Tail
d) The number of Heads
e) Assigning 1 when Tail or Head

A particular electronic component is produced at two plants for an electronics
manufacturer. Plant A produces 70% of the components used and the remainder are
produced by plant B. The probability that a component is defective is 0.02 if it is
produced at plant A and 0.01 if it is produced at plant B. If the component is defective
the revised probability it is produced at plant B, P (B|D), is ________
a) 0.3
b) 0.01
c) 0.003
d) 0.176
e) 0.017
Ray Crofford is evaluating investment alternatives for the $100,000 which he inherited
from his grandfather. His investment advisor has identified two alternatives and
constructed the following tables which show (1) expected profits (in $10,000’s) for
various market conditions and their probabilities, and (2) the advisor’s track record on
predicting Bull and Bear markets.
If the advisor predicts a Bull market the EMV of the Bonds alternative, using revised
probabilities, is ________.

a) $85,240
b) $25,710
c) $108,450
d) $75,480
One of the assumptions made in simple regression is that ______________.
a) the error terms are exponentially distributed
b) the error terms have unequal variances
c) the model is linear
d) the error terms are dependent
e) the model is nonlinear
A commuter travels many miles to work each morning. She has timed this trip 5 times
during the last month. The time (in minutes) required to make this trip was 44, 39, 41,
35, and 41. What is the mean absolute deviation for this sample data?
a) 0
b) 12
c) 3
d) 2.4

e) 1.2
Dan Hein owns the mineral and drilling rights to a 1,000 acre tract of land. If he drills a
well and does not strike oil his net loss will be $50,000, but if he drills a well and
strikes oil his net gain will be $100,000. If he does not drill, his loss is the cost of the
mineral and drilling rights, which amount to $1000. The probability of the state of
nature “oil in the tract” is unknown. If Dan is a pessimist, he would choose the
____________.
a) maximin criterion
b) maximax criterion
c) Hurwicz criterion
d) minimax regret strategy
e) maximin regret strategy
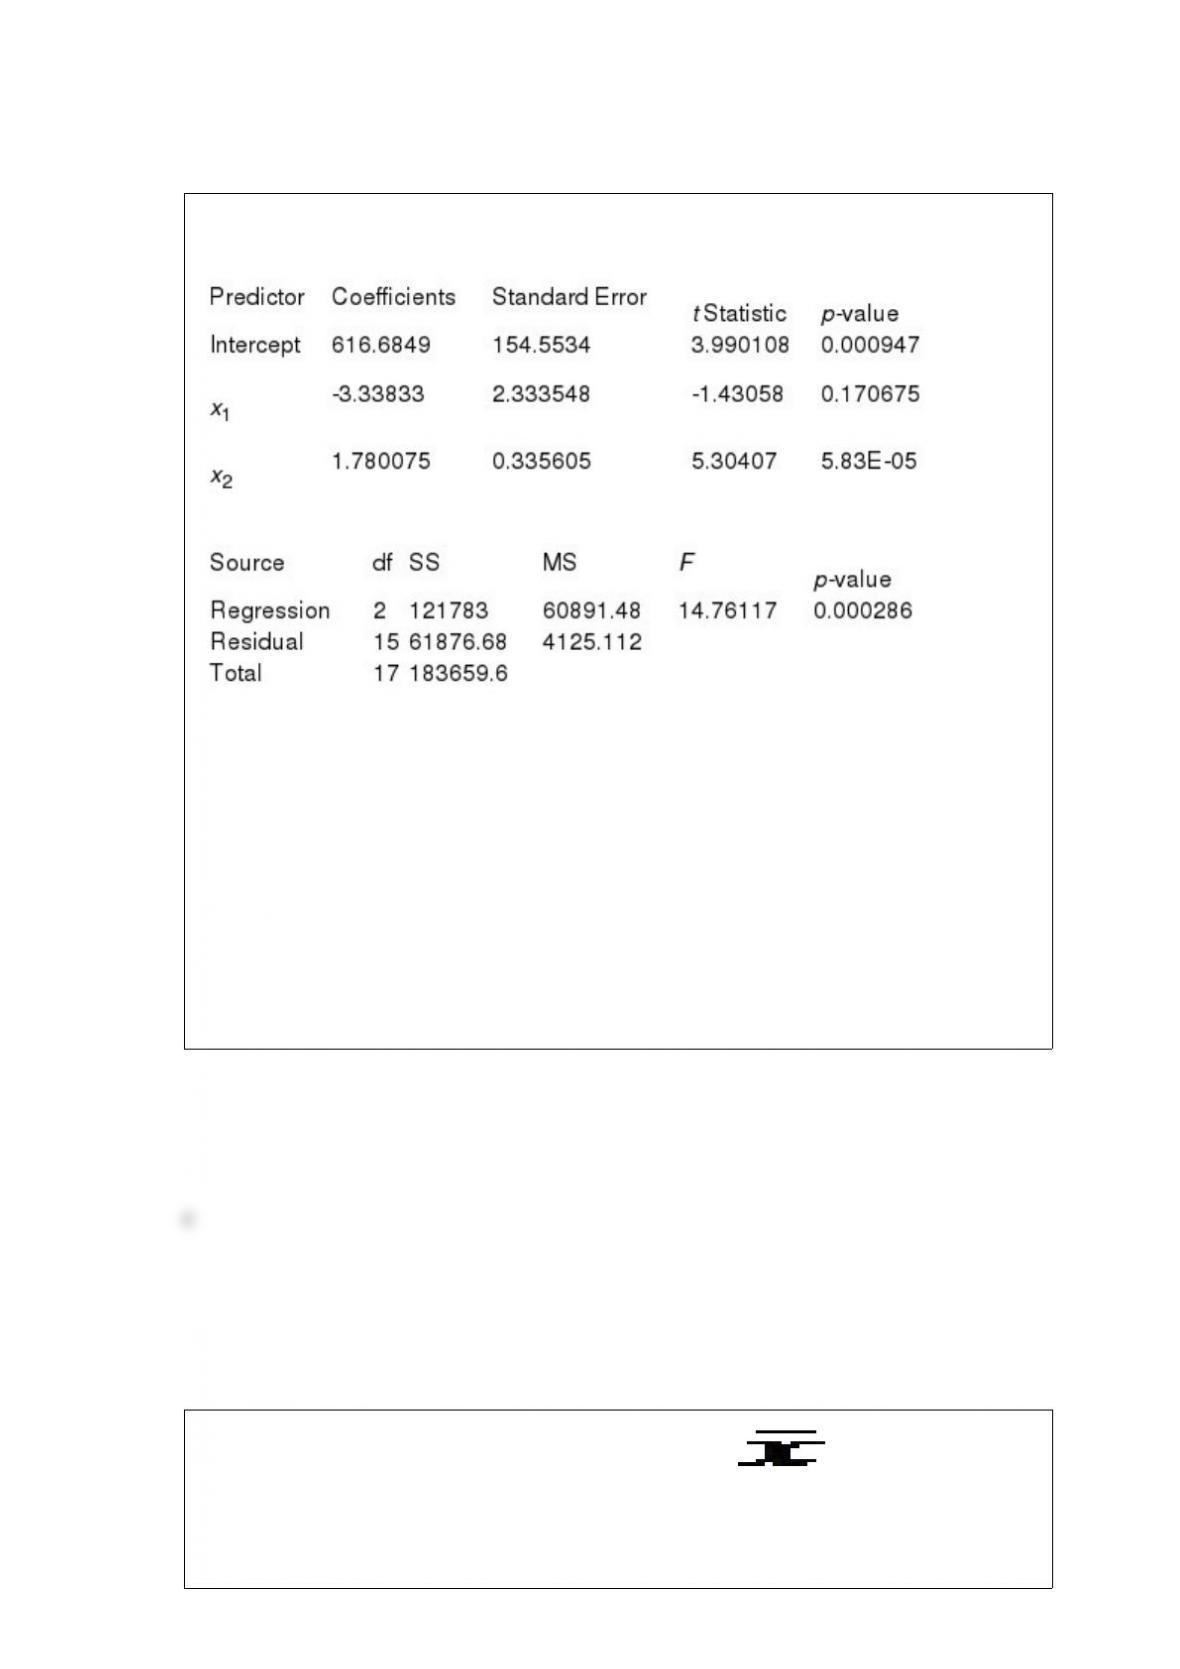
A multiple regression analysis produced the following tables.
Using
= 0.01 to test the null hypothesis H0:
1=
2= 0, the critical F value is ____.
a) 5.99
b) 5.70
c) 1.96
d) 4.84
e) 6.70
Pinky Bauer, Chief Financial Officer of Harrison Haulers, Inc., suspects irregularities in
the payroll system, and orders an inspection of a random sample of vouchers issued
since January 1, 2006. A sample of ten vouchers is randomly selected, without
replacement, from the population of 2,000 vouchers. Each voucher in the sample is
examined for errors and the number of vouchers in the sample with errors is denoted by
x. If 20% of the population of vouchers contain errors, P(x>0) is _______________.
a) 0.8171
b) 0.1074
c) 0.8926
d) 0.3020
e) 1.0000

The area to the left of the mean in any normal distribution is equal to _______.
a) the mean
b) 1
c) the variance
d) 0.5
e) -0.5
The equation of the trend line for the data based on sales (in $1000) of a local restaurant
over the years 2005-2010 is Sales= -265575+132.571 year. The equation of the trend
line when using 1 to 6 for 2005-2010 is ________
a) -265575+132.571x
b) 132,571x
c) 97.284+132.571x
d) -263571+98x
e) 2004+37.2x

Albert Abbasi, VP of Operations at Ingleside International Bank, is evaluating the
service level provided to walk-in customers. Accordingly, he plans a sample of waiting
times for walk-in customers. If the population of waiting times has a mean of 15
minutes and a standard deviation of 4 minutes, the probability that Albert’s sample of 64
will have a mean less than 15 minutes is ________.
a) 0.5000
b) 0.0228
c) 0.9072
d) 0.9544
e) 1.0000
Let zbe a normal random variable with mean 0 and standard deviation 1. What is P(z<
-2.1)?
a) 0.4821
b) -0.4821
c) 0.9821
d) 0.0179
e) -0.0179
Catherine Chao, Director of Marketing Research, is evaluating consumer acceptance of
alternative toothpaste packages. She wonders whether acceptance is influenced by
children in the household. Her staff prepared the following contingency table from a
random sample of 100 households.
Using
= .05, the critical value of chi-square is ______________.
a) 5.02
b) 3.84
c) 7.37
d) 6.09
e) 5.99
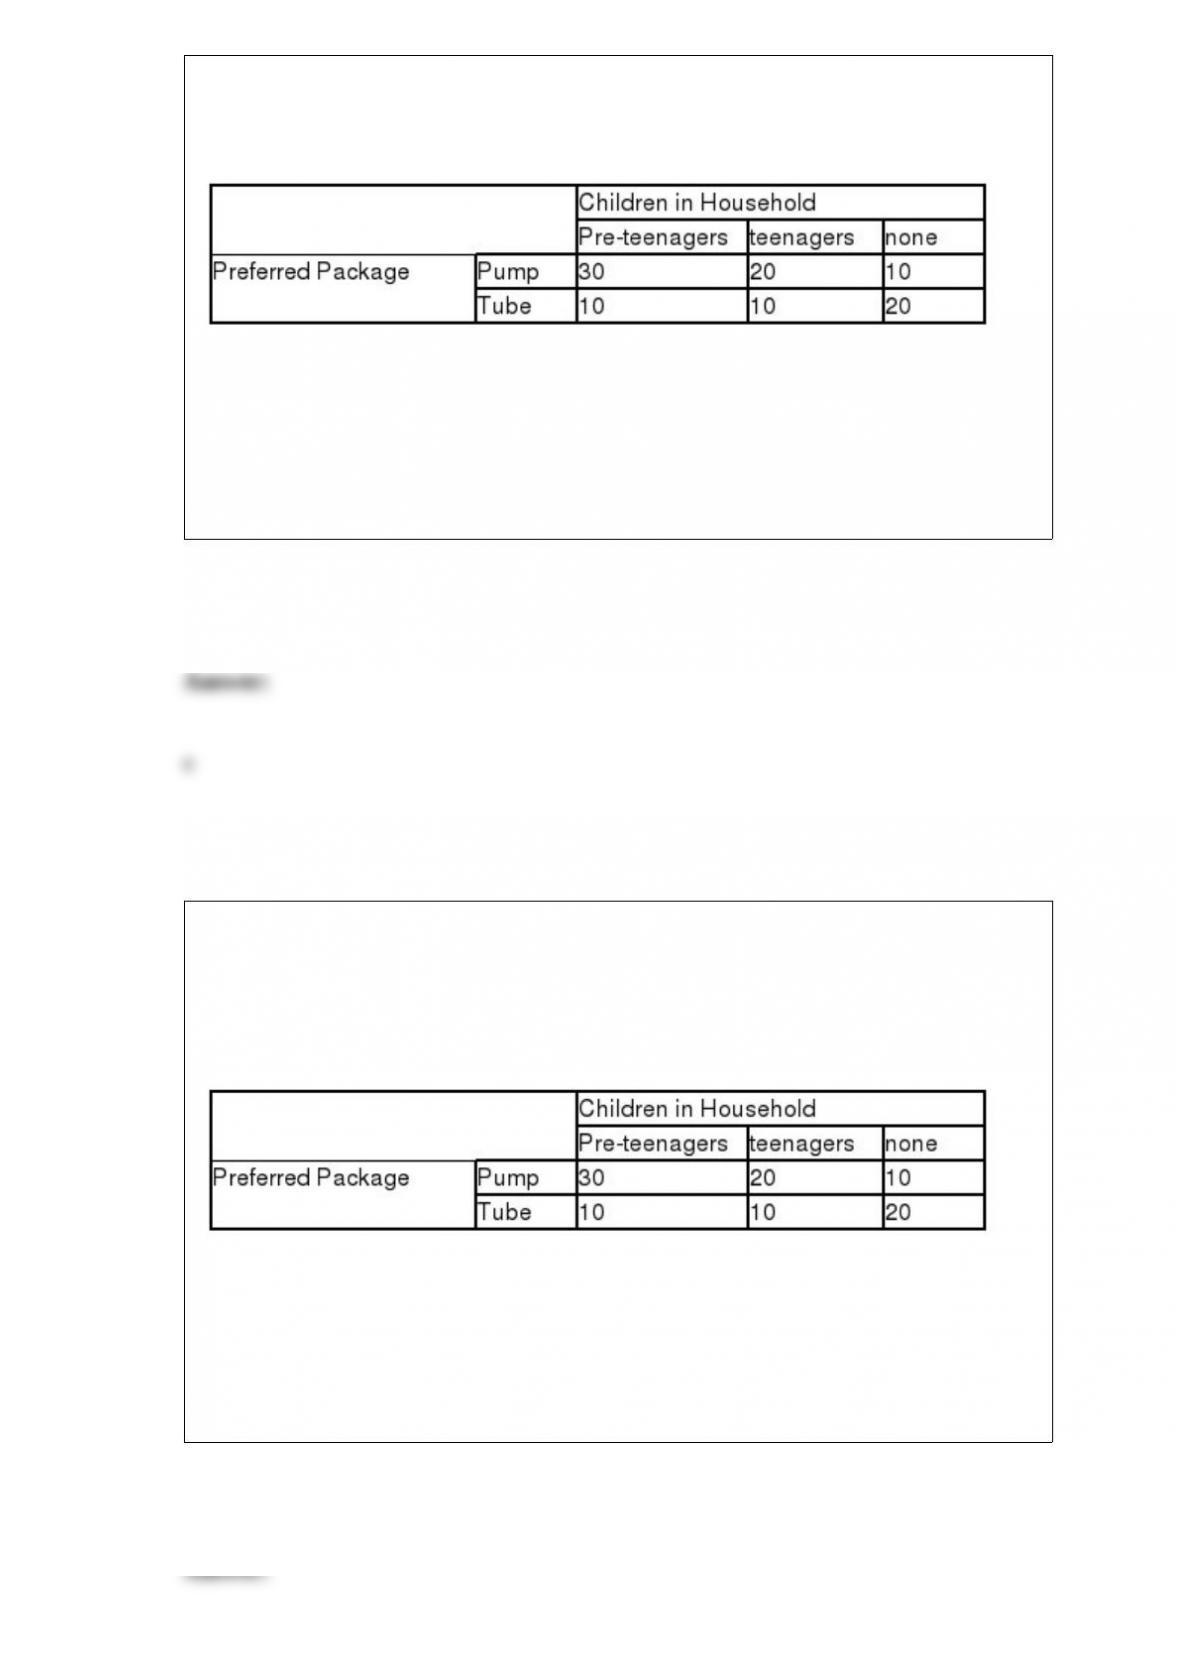
Catherine Chao, Director of Marketing Research, is evaluating consumer acceptance of
alternative toothpaste packages. She wonders whether acceptance is influenced by
children in the household. Her staff prepared the following contingency table from a
random sample of 100 households.
Catherine’s null hypothesis is ______________.
a) “children in household” is not independent of “preferred package”
b) “children in household” is independent of “preferred package”
c) “children in household” is related to “preferred package”
d) “children in household” influences “preferred package”
e) “pump” is independent of “tube”