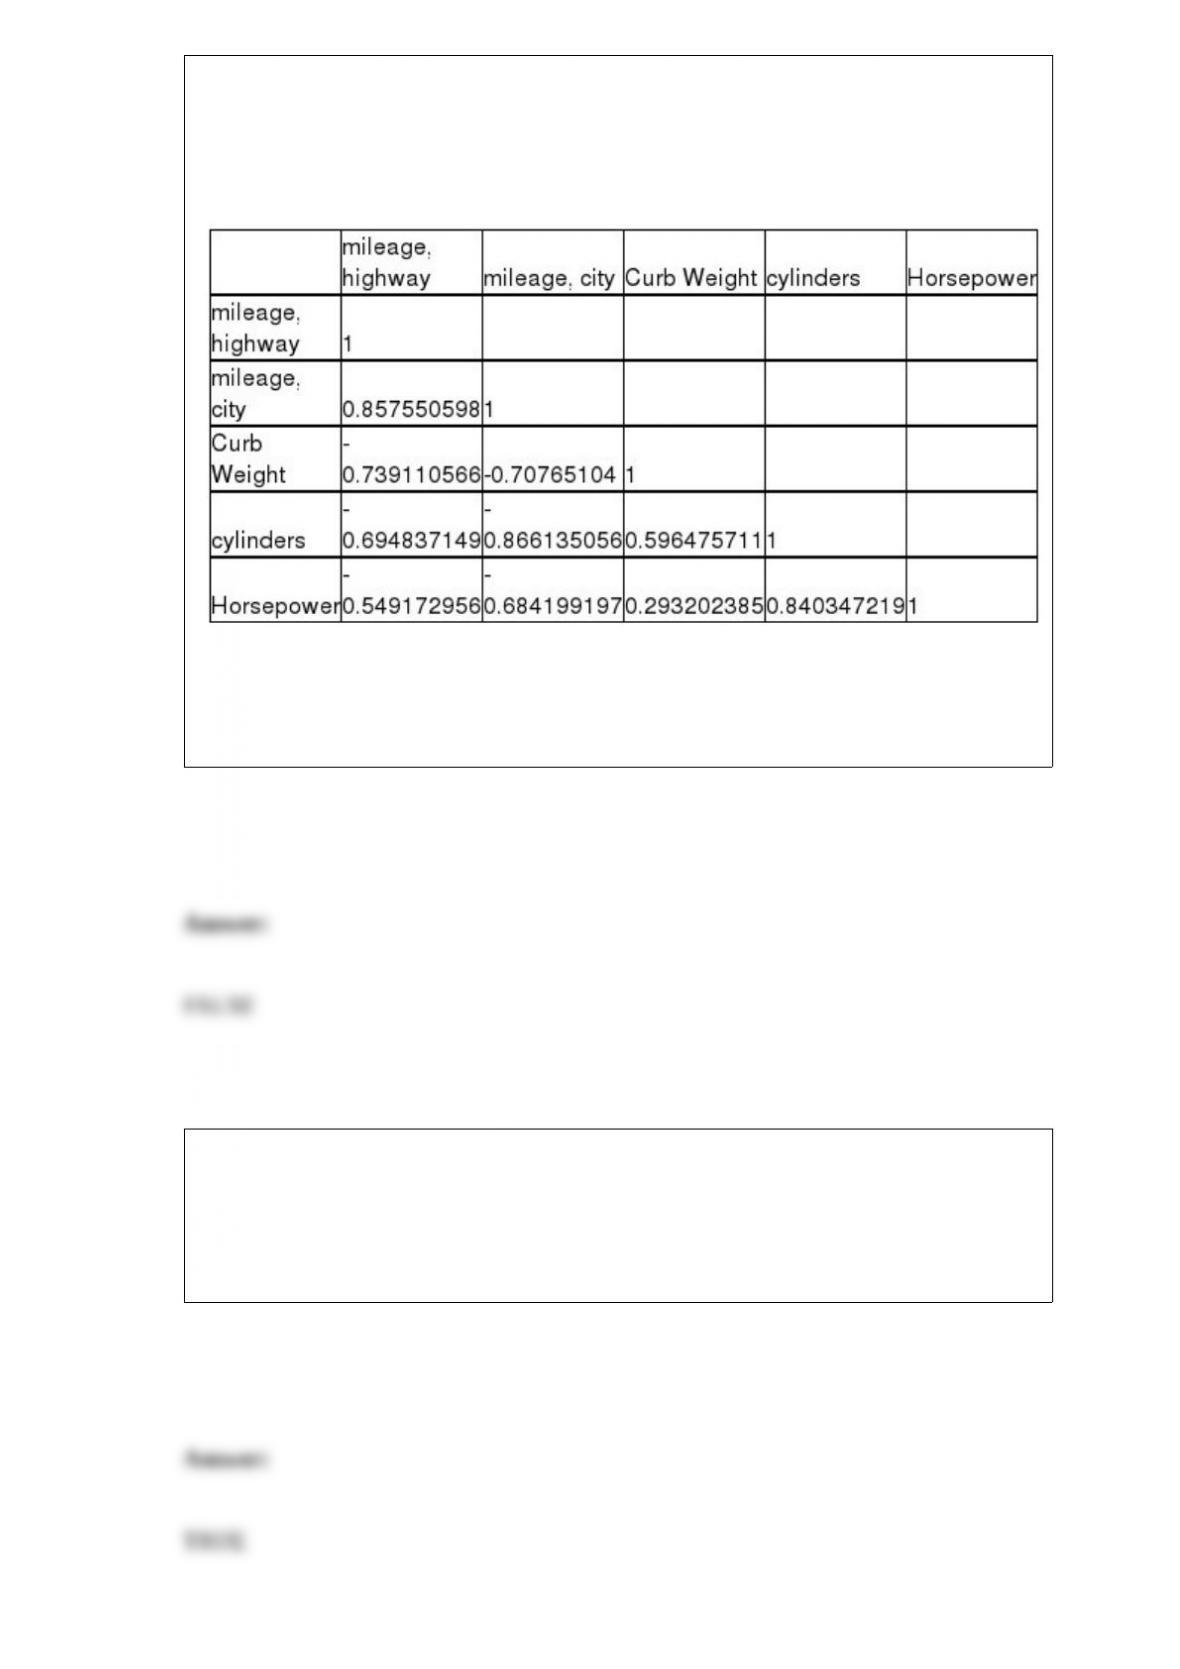
A major car magazine has recently collected data on 30 leading cars in the U.S. market.
It is interested in building a multiple regression model to explain the variation in
highway miles. The following correlation matrix has been computed from the data
collected:
If only one independent variable (ignoring city mileage) is to be used in explaining the
dependent variable in a regression model, the percentage of variation that will be
explained will be nearly 74 percent.
The Nationwide Motel Company has determined that 70 percent of all calls for motel
reservations request nonsmoking rooms. Recently, the customer service manager for the
company randomly selected 25 calls. Assuming that the distribution of calls requesting
nonsmoking rooms is described by a binomial distribution, the probability that more
than 20 customers in the sample will request nonsmoking rooms is approximately 0.09.

Consider the following regression equation: = 356 + 180x1 – 2.5x2. The x1 variable is
a quantitative variable and the x2 variable is a dummy with values 1 and 0. Given this,
we can interpret the slope coefficient on variable x2 as follows: Holding x1 constant, if
the value of x2 is changed from 0 to 1, the average value of y will decrease by 2.5 units.
The population of incomes in a particular community is thought to be highly
right-skewed with a mean equal to $36,789 and a standard deviation equal to $2,490.
Based on this, if a sample of size n = 36 is selected, the sampling distribution would
have a mean equal to the population mean, but the standard deviation of the sampling
distribution will be one-sixth of the population standard deviation.
In simple linear regression, the t-test for the slope and the F-test are both conducting the
same hypothesis test.
To compare one value measured at one point in time with other values measured at
different points in time, index numbers must be used.
Suppose the mean balance of checking accounts at Regions Bank is known to be $4320.
A random sample of 10 accounts yields a total of $41,490. This means the sampling
error is -$171.
One claim states the IRS conducts audits for not more than 5 percent of total tax returns
each year. In order to test this claim statistically, the appropriate null and alternative
hypotheses are:
H0 : μ ≤ 0.05
Ha : μ > 0.05
Harrison Hollow, an upscale eatery in Atlanta, tracks its sales on a daily basis. Recently,
the manager stated that sales over the past three weeks have been very cyclical. Given
the data she has, this statement is not a reasonable one to make.
In a multiple regression model, the adjusted R-square value measures the explained
variation in the dependent variable after taking into account the relationship between
the sample size and the number of independent variables in the model.
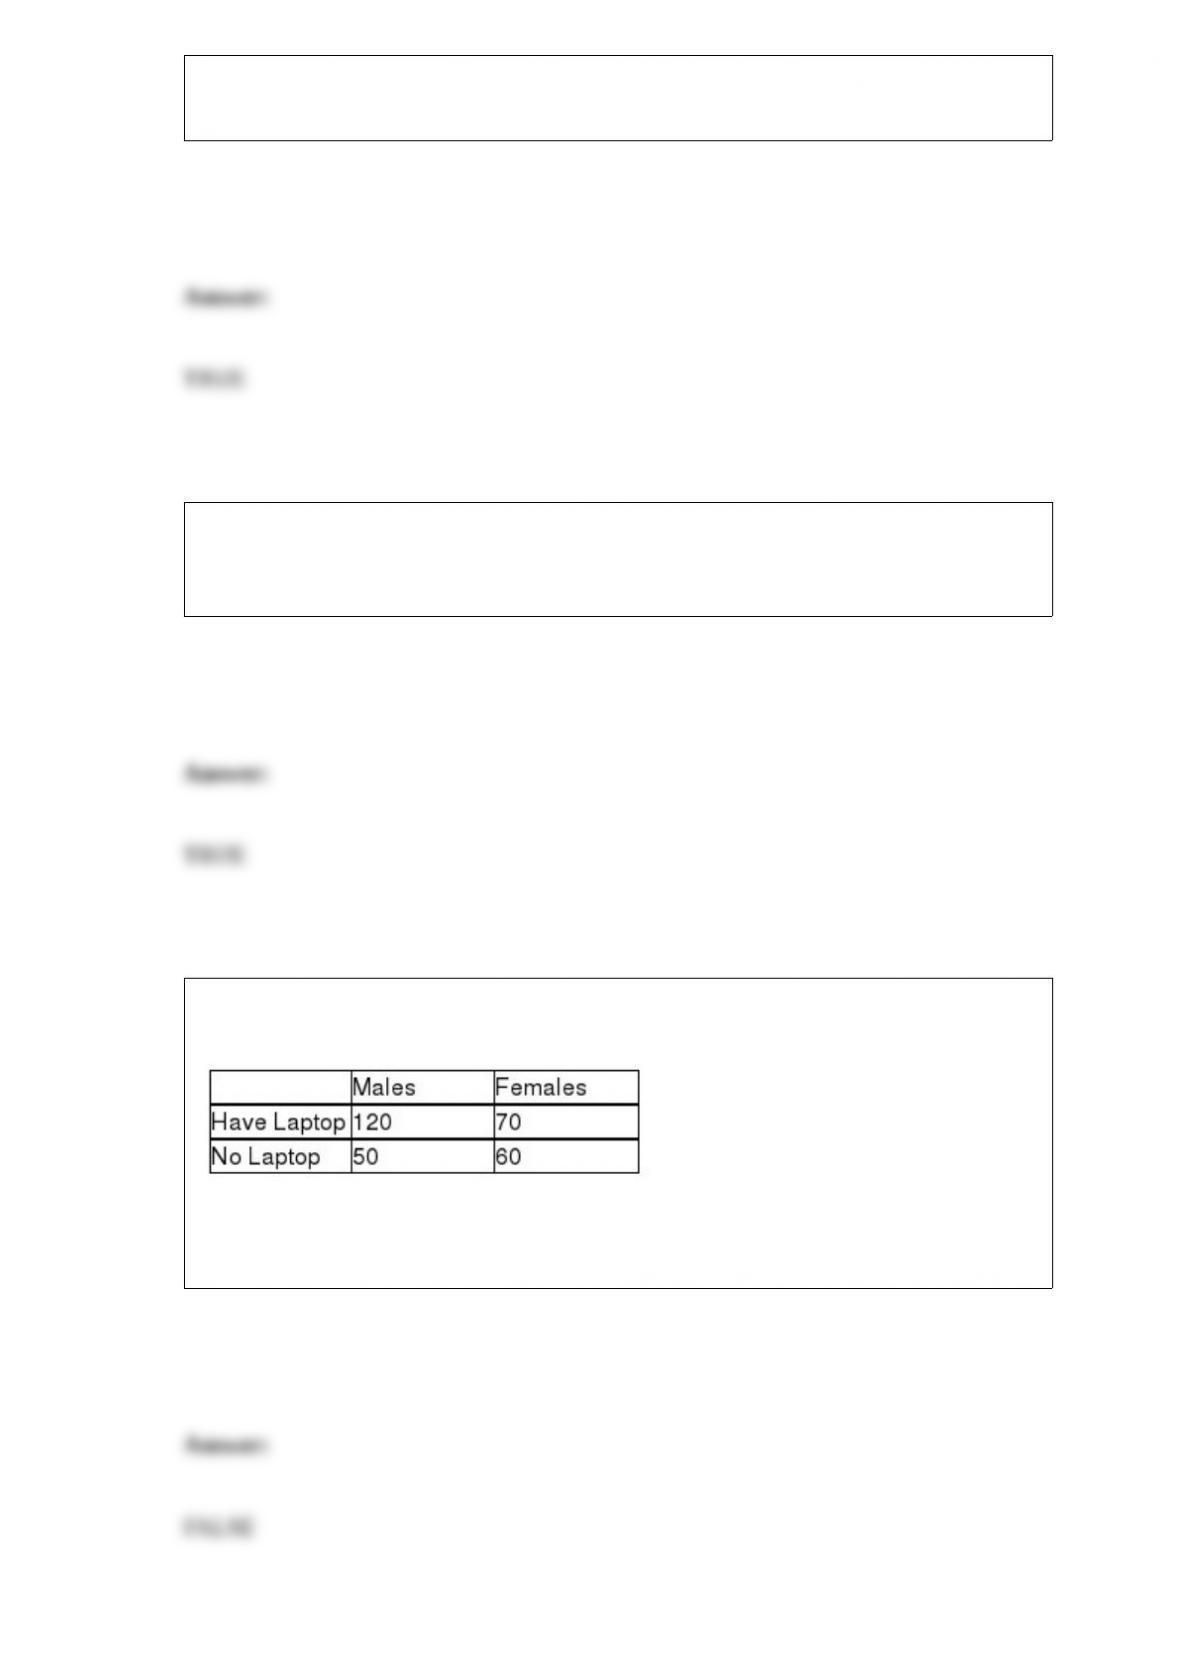
A survey was recently conducted in which males and females were asked whether they
owned a laptop personal computer. The following data were observed:
Given this information, if an alpha level of .05 is used, the test statistic for determining
whether having a laptop is independent of gender is approximately 14.23.

When we say that we wish to determine the aptness of a regression model, we are
actually saying that we wish to check to see whether the resulting model meets the basic
assumptions of regression analysis.
The sample mean is a parameter.
The variance in the diameter of a bolt should not exceed 0.500 mm. A random sample
of n = 12 bolts showed a sample variance of 0.505 mm. The test statistic is χ2 = 11.11.
A large tire manufacturing company has claimed that its top line tire will average more
than 80,000 miles. If a consumer group wished to test this claim, the research
hypothesis would be: Ha : μ > 80,000 miles.

Suppose a single die (a 6-sided cube with sides numbered 1 through 6) is rolled once.
The event of interest is defined as rolling an even number. This can be said to be an
elementary event.
When graphed, the probability distribution for a discrete random variable looks like a
histogram.
A 95 percent confidence interval estimate indicates that there is a 95 percent chance that
the true population value will fall within the range defined by the upper and lower
limits.
When surveyed, a sample of 1,250 patients at a regional hospital provided interviewers
with the following summary statistics pertaining to the hospital charges:
Minimum = $278.00 Q1 = $1,245 Q2 = $3,567 Q3= $4,702.
Based on these data, the distribution is seen to be symmetric.
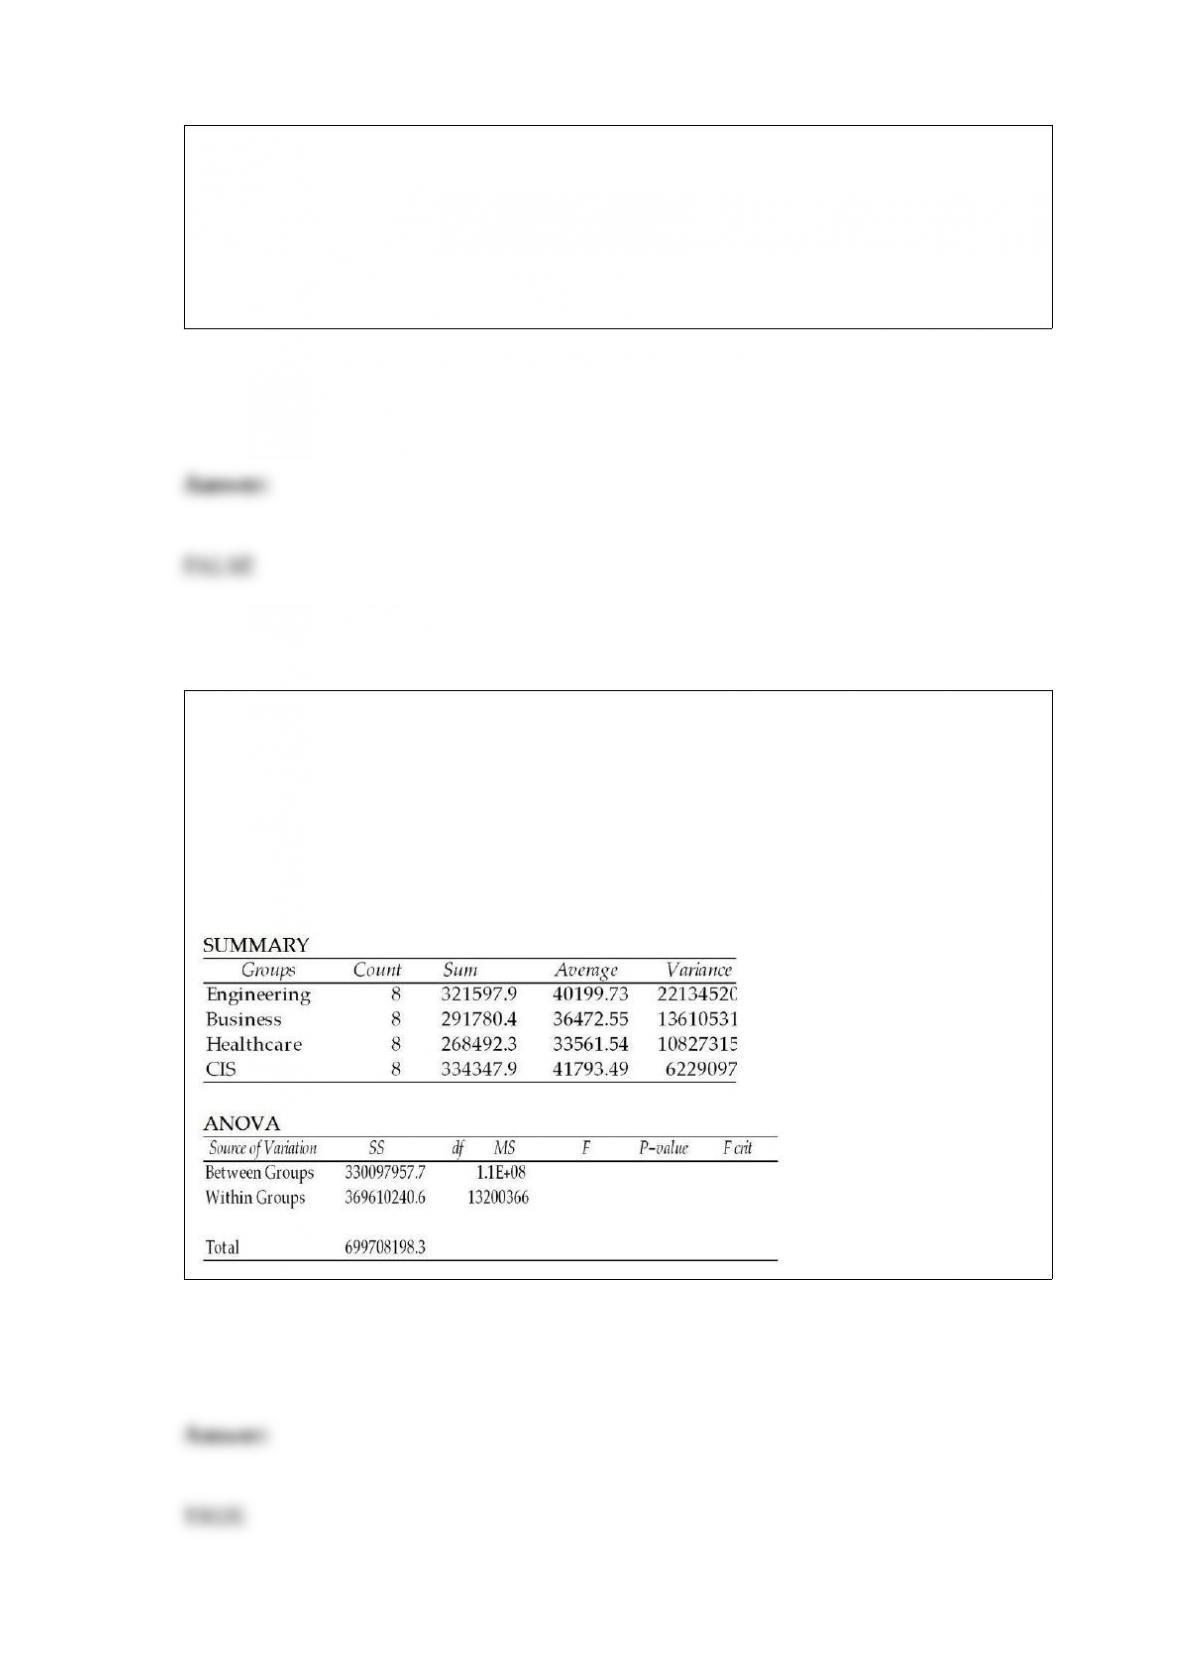
A study was recently conducted to see whether the mean starting salaries for graduates
of engineering, business, healthcare, and computer information systems majors differ. A
random sample of 8 graduates was selected from each major. The following chart shows
some of the results of the ANOVA computations; however, some of the output is
missing. If it had been included, the calculated test statistic would be F = 8.33.
ANOVA: Single Factor

In a forward selection stepwise regression process, the second variable to be selected
from the list of potential independent variables is always the one that has the second
highest correlation with the dependent variable.
When a population is not normally distributed, the Central Limit Theorem states that a
sufficiently large sample will result in the sample mean being normally distributed.
The Hawkins Company randomly samples 10 items from every large batch before the
batch is packaged and shipped. According to the contract specifications, 5 percent of the
items shipped can be defective. If the inspectors find 1 or fewer defects in the sample of
10, they ship the batch without further inspection. If they find 2 or more, the entire
batch is inspected. Based on this sampling plan, the probability that a batch that
contains twice the amount of defects allowed by the contract requirements will be
shipped without further inspection is approximately .3874.
A company that is interested in determining which of three prices to charge for its
products has test marketed the product in three cities, each time using a different price
for the product. The number of products sold in the first week is recorded. In this case,
the data are considered to have been collected using an experiment.
In order to apply the chi-square contingency methodology for quantitative variables, we
must first break the quantitative variable down into discrete categories.
If a set of data has 540 values, the 3rd quartile corresponds to approximately the 135th
value when the data have been arranged in numerical order.
In a recent one-way ANOVA test, SSW was equal to 15,900 and the SSB was equal to
3,100. Therefore, SST is equal to 12,800.
Data collected on marital status (married, divorced, single, other) would be an ordinal
level variable.
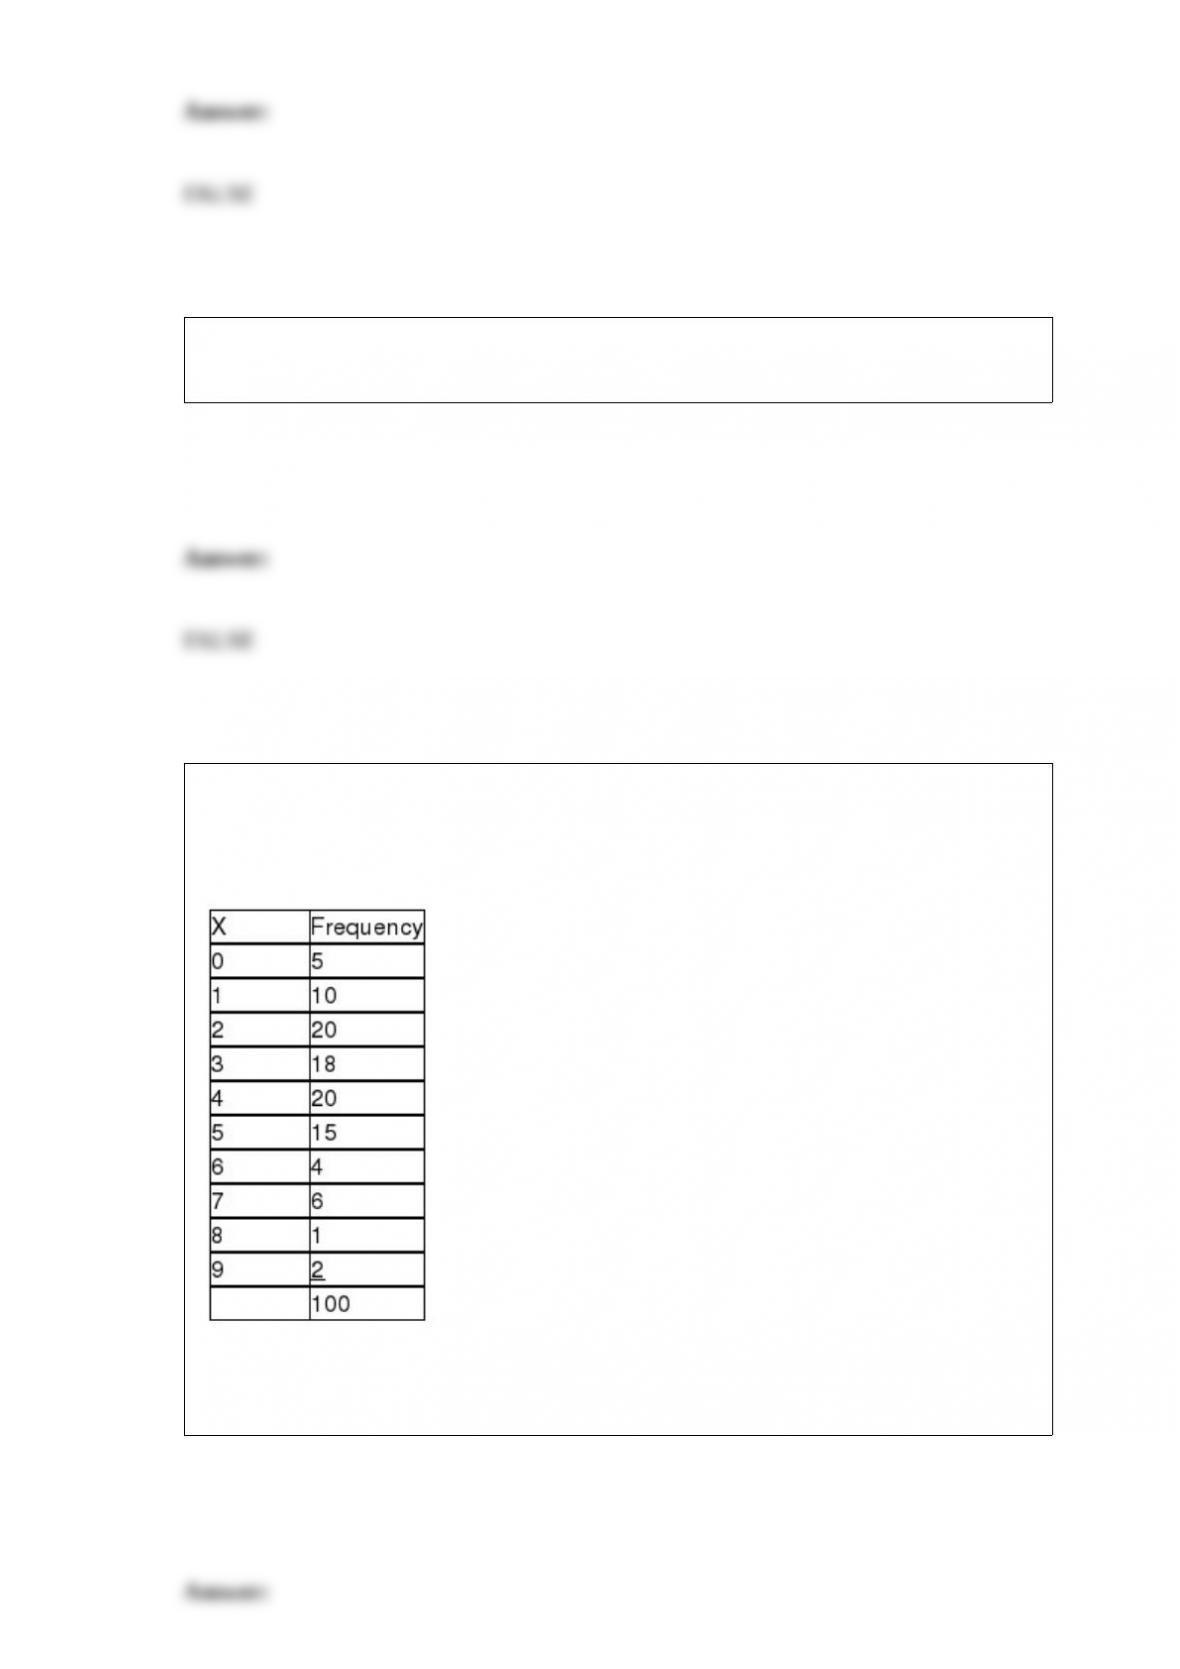
It is believed that the number of drivers who are ticketed for speeding on a particular
stretch of highway is a Poisson distribution with a mean of 3.5 per hour. A random
sample of 100 hours is selected with the following results:
Given this information, it can be seen that the cells will need to be combined since the
actual number of occurrences at some levels of x is less than 5.

A regression equation that predicts the price of homes in thousands of dollars is =
24.6 + 0.055x1 – 3.6x2, where x2 is a dummy variable that represents whether the house
is on a busy street or not. Here
x2 = 1 means the house is on a busy street and x2 = 0 means it is not. From this we can
conclude that on average homes that are on busy streets are worth $3600 more than
homes that are not on busy streets.
You are given the following data:
Assuming that the data reflect the population of interest, the mean of the population is
36.00.
If the null hypothesis that all population means are equal is rejected by the analysis of
variance F-test, the alternative hypothesis that all population means differ is concluded
to be true.

In conducting one-way analysis of variance, the sample size for each group must be
equal.
Assume that 10 people join a weight loss program for 3 months. Each person’s weight
both before and after the program is recorded and the number of pounds each person
lost is found. The following summarizes the results for the 10 people:
Mean weight lost = 9 pounds
Sample standard deviation of weight lost = 4.6 pounds
Assume that the hypothesis test will be conducted to determine whether or not the
weight loss program is effective using a 0.05 level of significance. What is the value of
the test statistic?
A) t = 6.19
B) t = 1.96
C) z = 1.96
D) z = 6.19

If a manager wishes to develop a confidence interval estimate for estimating the
difference between two population means, an increase in the size of the samples used
will result in:
A) an increase in the size of the critical value.
B) a wider confidence interval.
C) a more precise confidence interval.
D) a less precise confidence interval
Recently a shipping company took 30 samples, each of size n = 100, of packages that it
was responsible for delivering. Out of the 3,000 total packages, 300 were delivered late.
In setting up an appropriate process control chart, what would be the correct 3-sigma
upper control limit value?
A) 0.03
B) 0.13
C) 0.19
D) 0.07
After completing sales training for a large company, it is expected that the salesperson
will generate a sale on at least 15 percent of the calls he or she makes. To make sure
that the sales training process is working, a random sample of n = 400 sales calls made
by sales representatives who have completed the training have been selected and the
null hypothesis is to be tested at 0.05 alpha level. Suppose that a sale is made on 36 of
the calls. Based on these sample data, which of the following is true?
A) The null hypothesis should be rejected since the test statistic falls in the lower tail
rejection region.
B) The null hypothesis is supported since the sample results do not fall in the rejection
region.
C) There is insufficient evidence to reject the null hypothesis and the sample proportion
is different from the hypothesized proportion due to sampling error.
D) It is possible that a Type II statistical error has been committed.
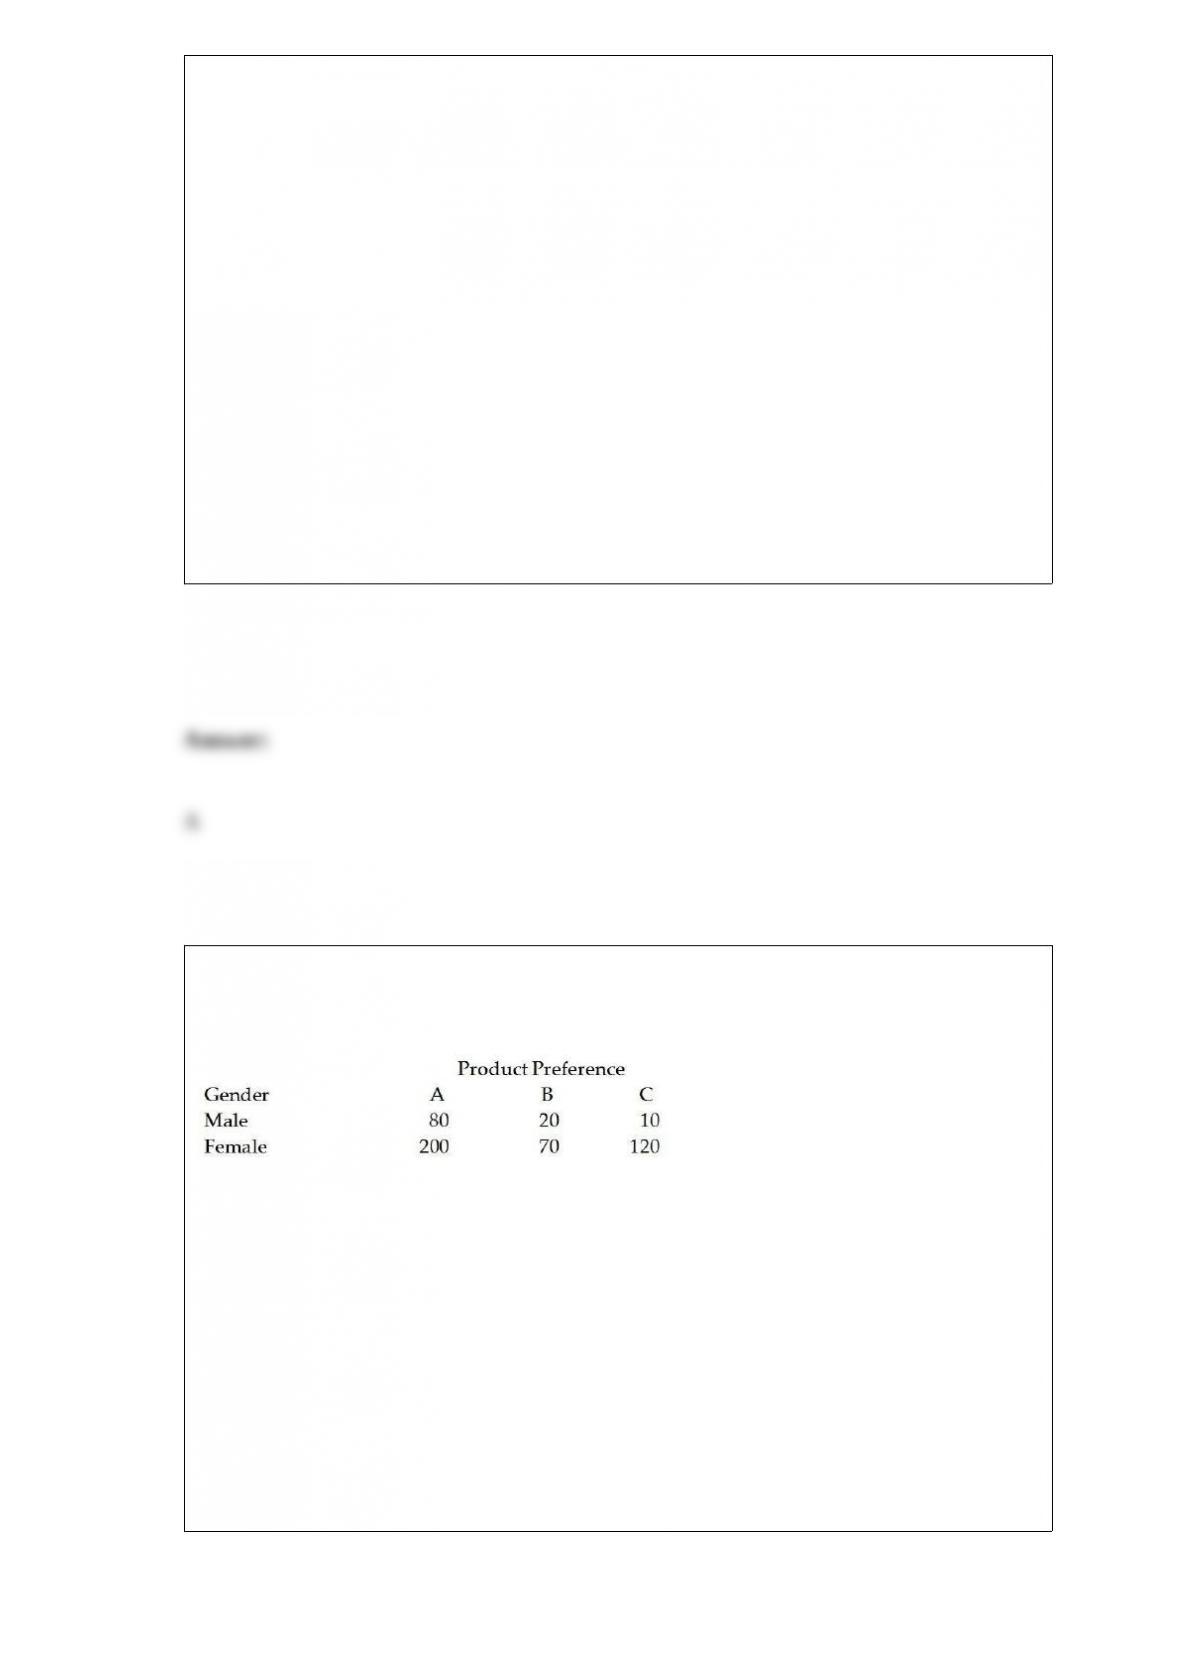
A study was recently done in which 500 people were asked to indicate their preferences
for one of three products. The following table shows the breakdown of the responses by
gender of the respondents.
If the people conducting the study wish to assess the probability that product A will be
preferred by members of the target population, the method of assessment to be used
would most likely be:
A) classical probability assessment.
B) subjective assessment.
C) relative frequency of occurrence.
D) independent events.

For the following hypothesis test
With n = 100 and p = 0.66, state the conclusion.
A) Because the computed value of z = -2.0785 is less than the critical value of z = -1.96,
reject the null hypothesis and conclude that the population proportion is less than 0.75.
B) Because the computed value of z = -0.3412 is less than the critical value of z =
-1.645, reject the null hypothesis and conclude that the population proportion is less
than 0.75.
C) Because the computed value of z = 1.4919 is greater than the critical value of z =
-1.96, accept the null hypothesis and conclude that the population proportion is greater
than 0.75.
D) Because the computed value of z = -0.3412 is greater than the critical value of z =
-1.645, accept the null hypothesis and conclude that the population proportion is greater
than 0.75.
It is often a good idea to convert frequency distributions to relative frequency
distributions when you wish to compare two distributions with different amounts of
data.

For the following hypothesis test:
With n= 0.42 and p = 0.42, state the conclusion
A) Because the calculated value of the test statistic, t=0.4122, is neither greater than
2.013 nor less than -2.013, do not reject the null hypothesis and conclude that the
population proportion is not different from 0.40.
B) Because the calculated value of the test statistic, t=1.7291, is neither greater than
2.013 nor less than -2.013, do not reject the null hypothesis and conclude that the
population proportion is not different from 0.40.
C) Because the calculated value of the test statistic, z = 1.2412, is neither greater than
2.575 nor less than -2.575, do not reject the null hypothesis and conclude that the
population proportion is not different from 0.40.
D) Because the calculated value of the test statistic, z = 0.3266, is neither greater than
2.575 nor less than -2.575, do not reject the null hypothesis and conclude that the
population proportion is not different from 0.40.
The makers of Mini-Oats Cereal have an automated packaging machine that can be set
at any targeted fill level between 12 and 32 ounces. Every box of cereal is not expected
to contain exactly the targeted weight, but the average of all boxes filled should. At the
end of every shift (eight hours), 16 boxes are selected at random and the mean and
standard deviation of the sample are computed. Based on these sample results, the
production control manager determines whether the filling machine needs to be
readjusted or whether it remains all right to operate. Use α= 0.05. At the end of a
particular shift during which the machine was filling 24-ounce boxes of Mini-Oats, the
sample mean of 16 boxes was 24.32 ounces, with a standard deviation of 0.70 ounce.
Assist the production control manager in determining if the machine is achieving its

targeted average using test statistic and critical value t.
A) Since -1.2445 < 1.013 < 1.2445, do not reject H0 and conclude that the filling
machine remains all right to operate.
B) Since -1.2445 < 1.013 < 1.2445, reject H0 and conclude that the filling machine
needs to be moderated.
C) Since -2.1315 < 1.83 < 2.1315, do not reject H0 and conclude that the filling
machine remains all right to operate.
D) Since -2.1315 < 1.83 < 2.1315, reject H0 and conclude that the filling machine needs
to be moderated.
On a survey, amount of education is recorded as some high school, high school
graduate, some college, college graduate, etc. This is an example of ordinal data.
A consumer group plans to test whether a new passenger car that is advertised to have a
mean highway miles per gallon of at least 33 actually meets this level. They plan to test
the hypothesis using a significance level of 0.05 and a sample size of n = 100 cars. It is
believed that the population standard deviation is 3 mpg. Based upon this information,
if the “true” population mean is 32.0 mpg, what is the probability that the test will lead
the consumer group to “accept” the claimed mileage for this car?
A) About 0.45

B) Approximately 0.0455
C) About 0.9545
D) None of the above
If a random sample of 200 items is taken from a population in which the proportion of
items having a desired attribute is p = 0.30, what is the probability that the proportion of
successes in the sample will be less than or equal to 0.27?
A) 0.0841
B) 0.1011
C) 0.1912
D) 0.1762
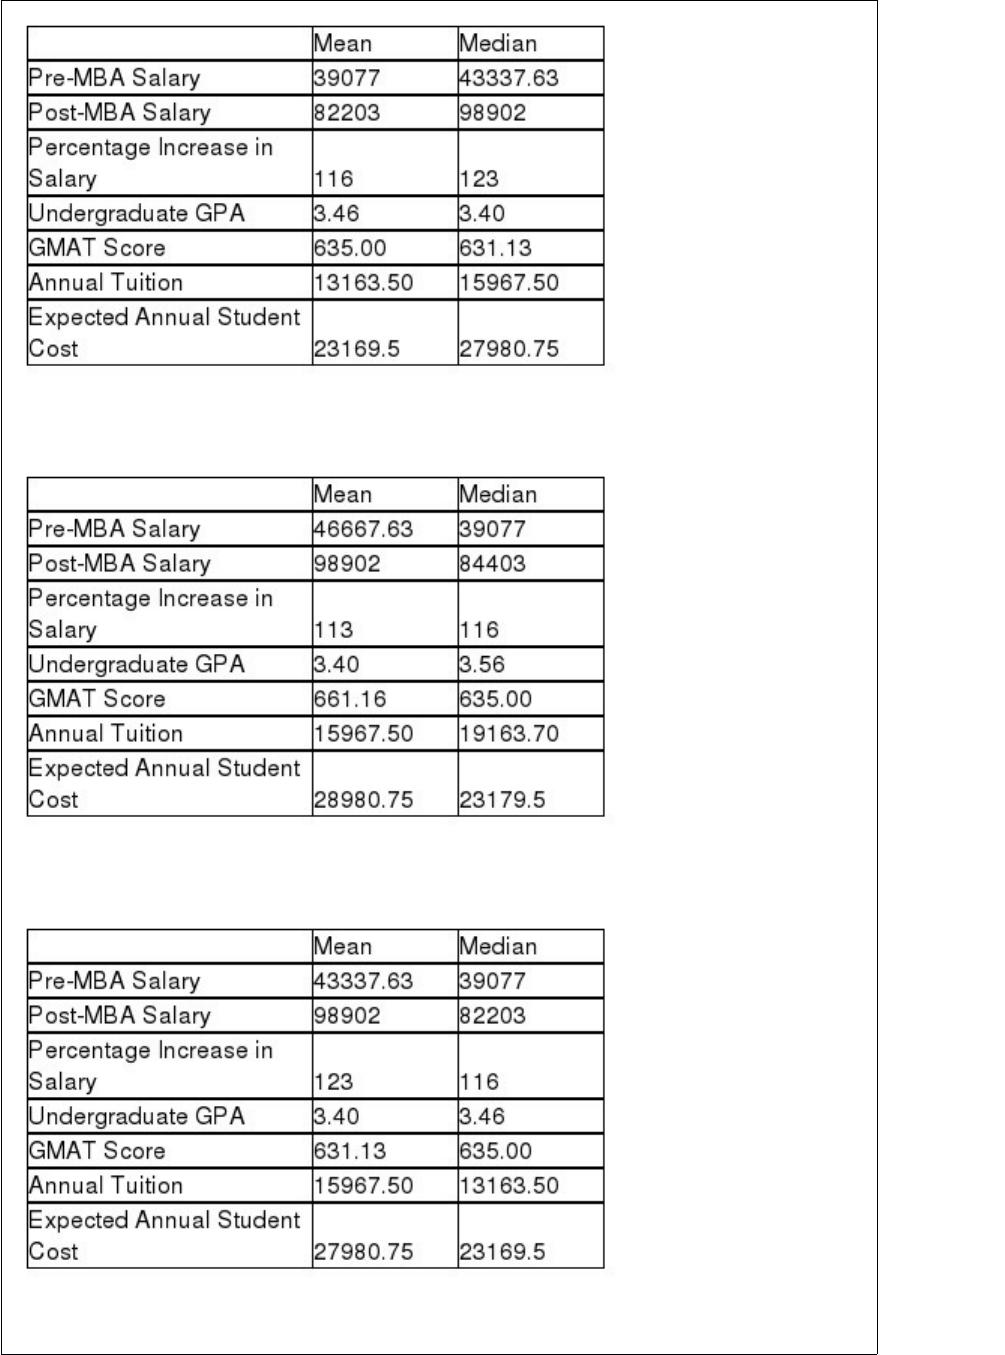
Each year, Business Week publishes information and rankings of master of business
administration (MBA) programs. The data file MBA Analysis contains data on several
variables for eight reputable MBA programs as presented in the October 2, 2000, issue
of Business Week. The variables include pre- and post-MBA salary, percentage salary
increase, undergraduate GPA, average Graduate Management Admission Test (GMAT)
score, annual tuition, and expected annual student cost. Compute the mean and median
for each of the variables in the database.
A)
B)
C)
D)

A hotel chain has four hotels in Oregon. The general manager is interested in
determining whether the mean length of stay is the same or different for the four hotels.
She selects a random sample of n = 20 guests at each hotel and determines the number
of nights they stayed. Assuming that she plans to test this using an alpha level equal to
0.05, which of the following is the appropriate alternative hypothesis?
A) H0 : μ1 = μ2 = μ3 = μ4
B) H0 : μ1 ≠ μ2 ≠ μ3 ≠ μ4
C) Not all population means are equal.
D) σ1 = σ2 = σ3 = σ4
A major cell phone service provider has determined that the number of minutes that its
customers use their phone per month is normally distributed with a mean equal to 445.5
minutes with a standard deviation equal to 177.8 minutes. As a promotion, the company
plans to hold a drawing to give away one free vacation to Hawaii for a customer who
uses between 400 and 402 minutes during a particular month. Based on the information
provided, what proportion of the company’s customers would be eligible for the
drawing?
A) Approximately 0.1026
B) About 0.004
C) Approximately 0.2013
D) About 0.02
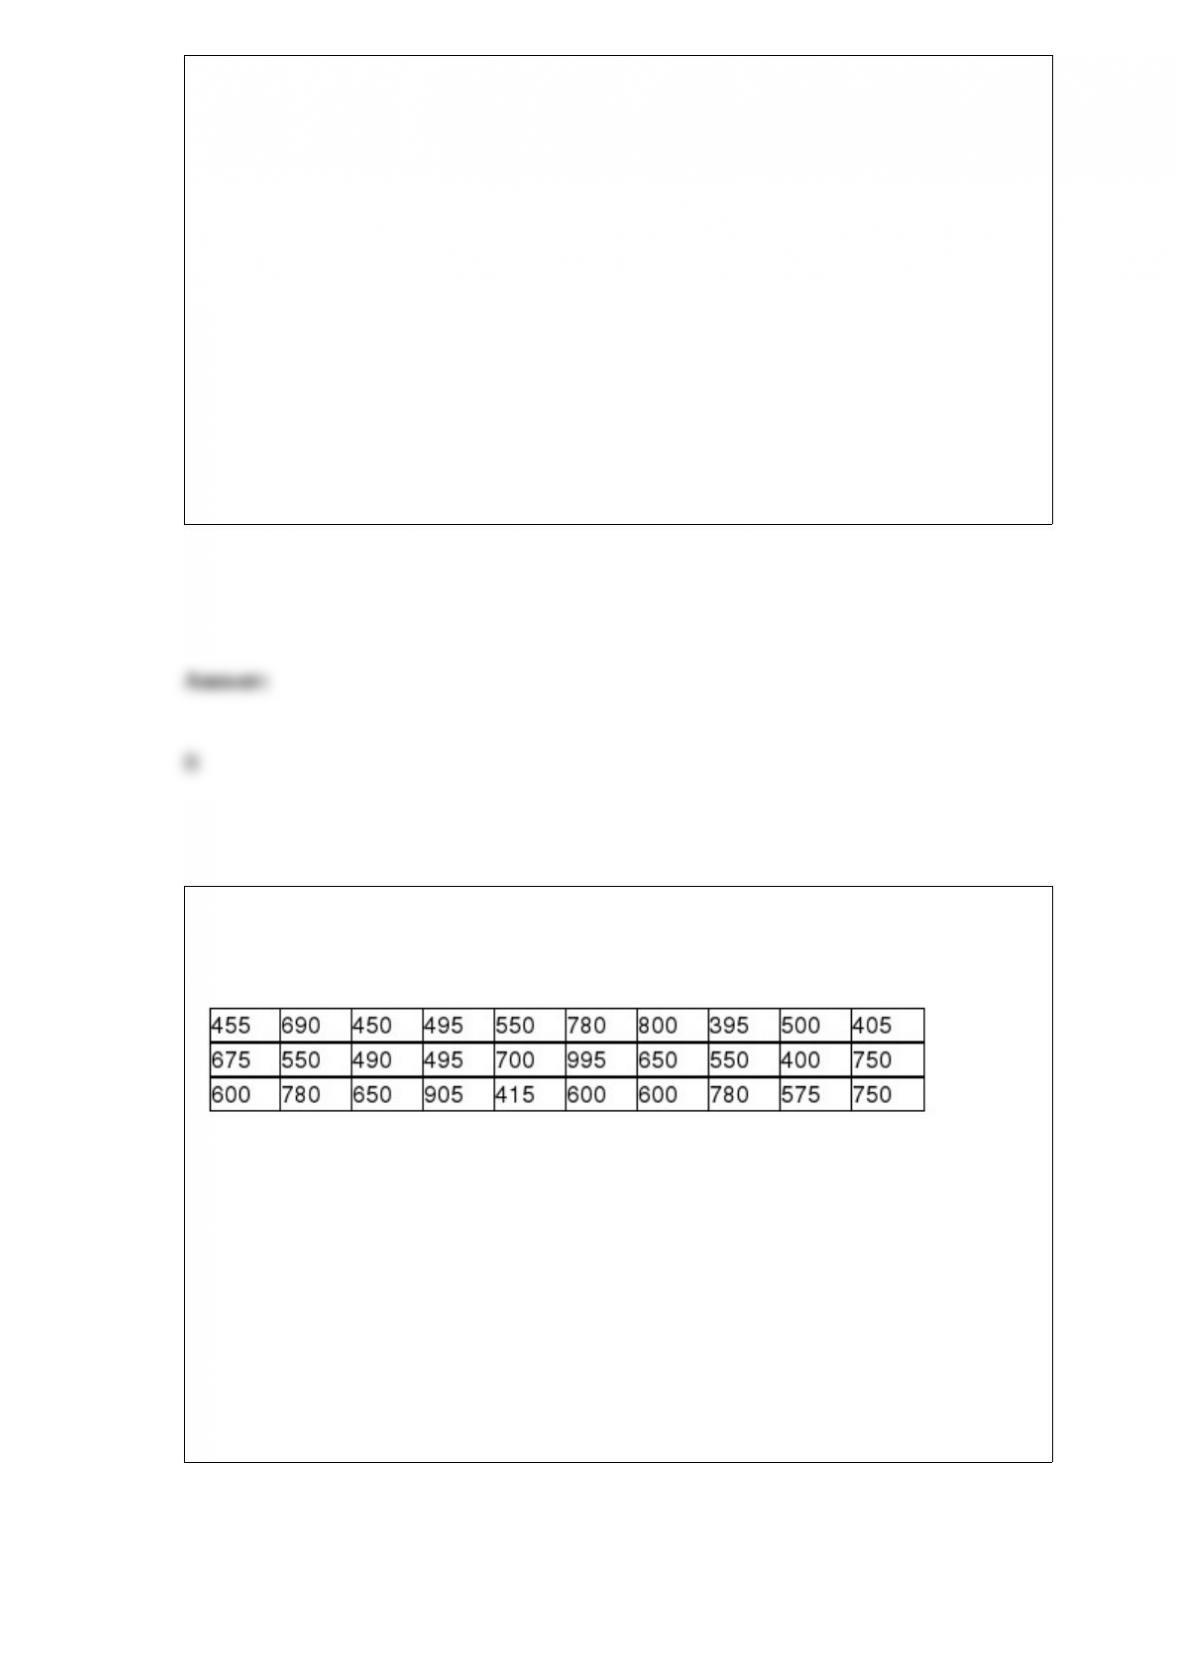
Hillman Management Services manages apartment complexes in Tulsa, Oklahoma.
They currently have 30 units available for rent. The monthly rental prices (in dollars)
for this population of 30 units are:
What is the range of possible sampling error if a random sample of sizen = 10 is
selected?
A) -174.21 to 191.12
B) -182.59 to 169.91
C) -164.33 to 178.67
D) -162.16 to 171.51

The General Electric service department believes that the median time for a service call
should be 30 or fewer minutes. To test this, the following random sample of service
times was collected:
Given that the managers do not wish to make the assumption that the population is
normally distributed, the critical value for the test about median service times, using a .
05 level of significance, is:
A) 5
B) 40
C) 8
D) 37
A potato chip manufacturer has found that in the past the standard deviation of bag
weight has been 0.2 ounce. They want to test whether the standard deviation has

changed. The null hypothesis is:
A) H0 : σ2 = 0.2
B) H0 : σ = 0.2
C) H0 : σ = 0.04
D) H0 : σ2 = 0.04
The director of a state agency believes that the average starting salary for clerical
employees in the state is less than $30,000 per year. To test her hypothesis, she has
collected a simple random sample of 100 starting clerical salaries from across the state
and found that the sample mean is $29,750. Assuming the population standard deviation
is known to be $2,500 and the significance level for the test is to be 0.05, what is the
critical value (stated in dollars)?
A) For alpha = .05 and a one tailed, lower tail test, the critical value is z = -1.645.
Solving for the critical x-bar: -1.645 = (x-bar – 30,000)/250, x-bar = $29,588.75
B) For alpha = .05 and a one tailed, lower tail test, the critical value is z = -1.96.
Solving for the critical x-bar: -1.96 = (x-bar – 30,000)/250, x-bar = $34,211.14
C) For alpha = .05 and a one tailed, lower tail test, the critical value is z = -1.645.
Solving for the critical x-bar: -1.645 = (x-bar – 30,000)/250, x-bar = $34,211.14
D) For alpha = .05 and a one tailed, lower tail test, the critical value is z = -1.96.
Solving for the critical x-bar: -1.96 = (x-bar – 30,000)/250, x-bar = $30,411.25
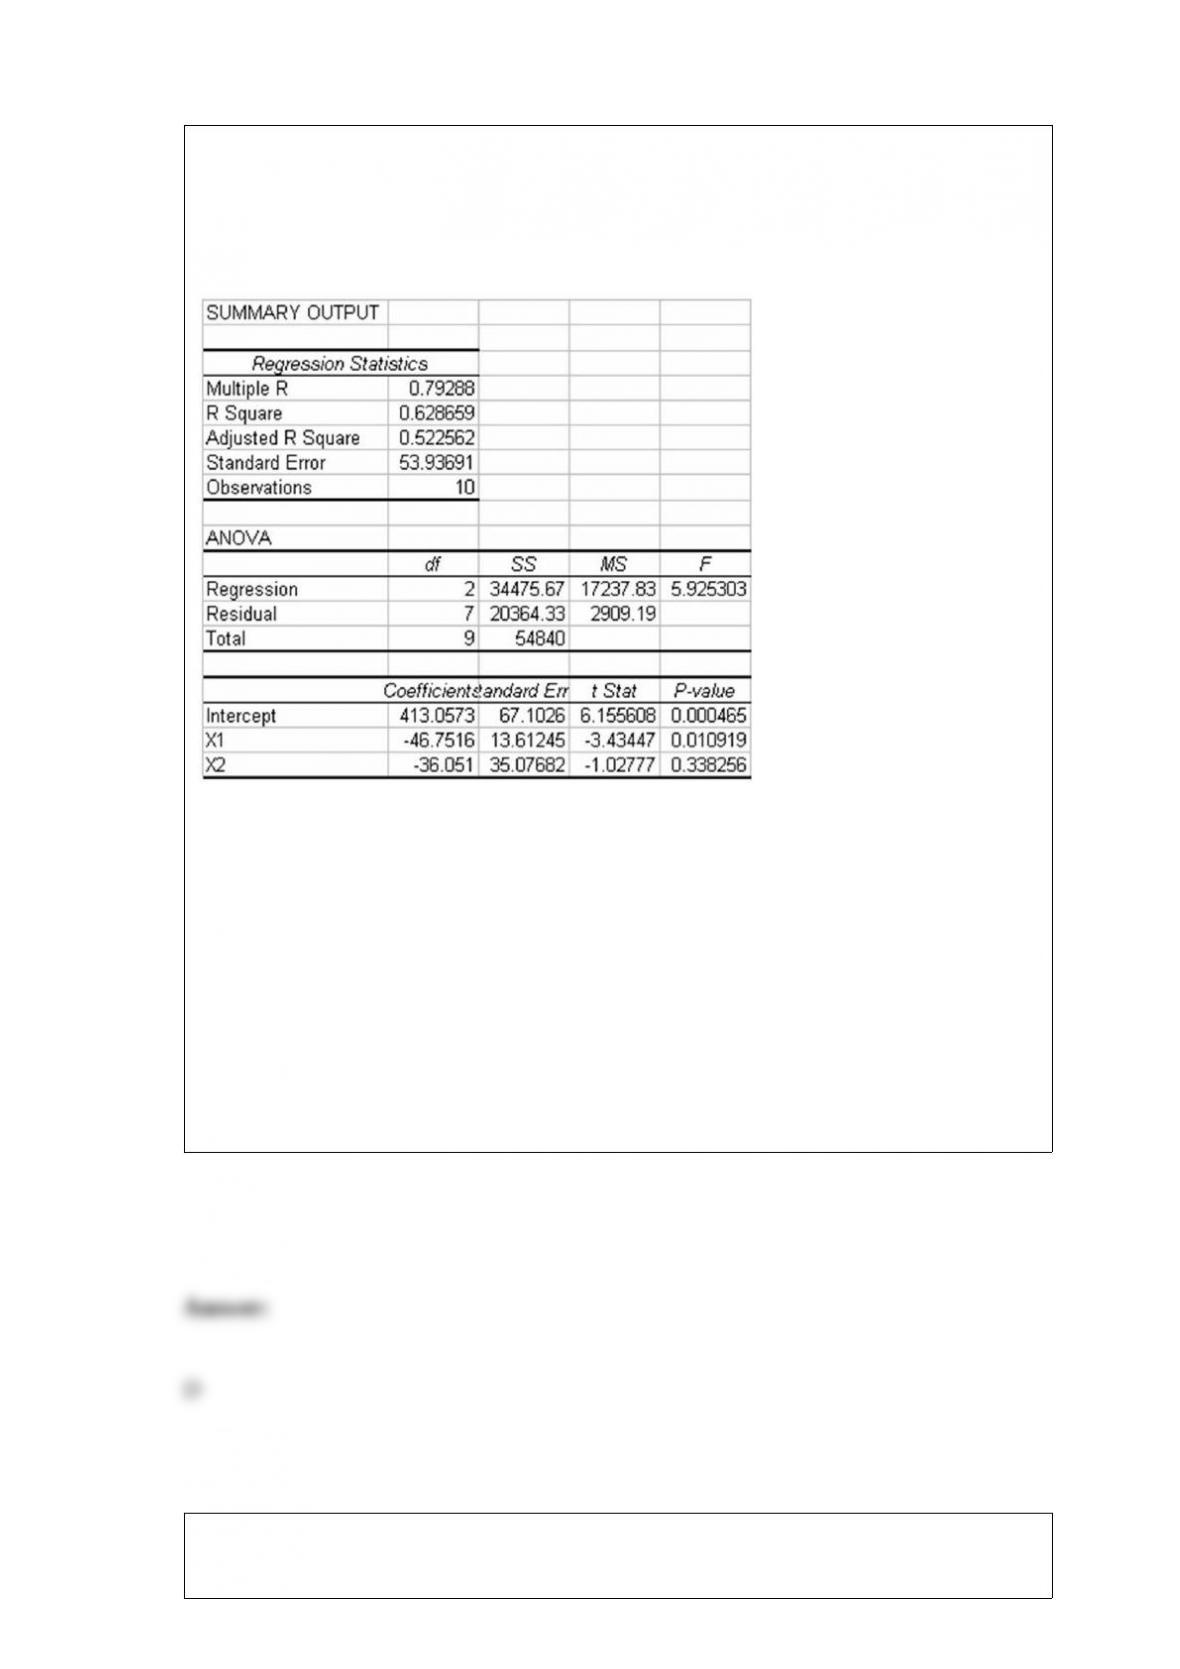
The following multiple regression output was generated from a study in which two
independent variables are included. The first independent variable (X1) is a quantitative
variable measured on a continuous scale. The second variable (X2) is qualitative coded
0 if Yes, 1 if No.
Based on this information, which of the following statements is true?
A) The model explains nearly 63 percent of the variation in the dependent variable
B) If tested at the 0.05 significance level, the overall model would be considered
statistically significant.
C) The variable X1 has a slope coefficient that is significantly different from zero if
tested at the 0.05 level of significance.
D) All of the above are true.
For a standardized normal distribution, calculate P(z < 1.5).

A) 0.9332
B) 0.0668
C) 0.333
D) 0.667
A fast food restaurant that sells burritos is concerned about the variability in the amount
of filling that different employees place in the burritos. To achieve product consistency
it needs this variability to be no more than 1.7 ounces. A sample of n = 18 burritos
showed a sample variance of 2.89 ounces. Using a 0.10 level of significance, what can
you conclude?
A) The standards are being met since (test statistic) < (critical value).
B) The standards are not being met since (test statistic) > (critical value).
C) The standards are being met since (test statistic) > (critical value).
D) The standards are not being met since (test statistic) < (critical value).
A particular subdivision has 20 homes. The number of people living in each of these
homes is listed as follows:

If a sample of size n = 5 is selected, the largest possible sample mean is:
A) 7
B) 6.5
C) 6
D) 5.4
The branch manager for United Savings and Loan in Seaside, Virginia, has worked with
her employees in an effort to reduce the waiting time for customers at the bank.
Recently, she and the team concluded that average waiting time is now down to 3.5
minutes with a standard deviation equal to 1.0 minute. However, before making a
statement at a managers’ meeting, this branch manager wanted to double-check that the
process was working as thought. To make this check, she randomly sampled 25
customers and recorded the time they had to wait. She discovered that mean wait time
for this sample of customers was 4.2 minutes. Based on the team’s claims about waiting
time, what is the probability that a sample mean for n = 25 people would be as large or
larger than 4.2 minutes?
A) 0.0214
B) 0.0512
C) 0.0231
D) 0.0011

One of the advantages that a stem and leaf diagram has over a histogram is:
A) the detail of the data is preserved.
B) it shows the general distribution of a quantitative variable.
C) it can be used with nominal data.
D) There are no advantages.
The manager at a local movie theater has collected data for a long period of time and
has concluded that the revenue from concession sales during the first show each
evening is normally distributed with a mean equal to $336.25 and a variance equal to
1,456. Based on this information, what are the chances that the revenue on the first
show will exceed $800?
A) 0.1255
B) Essentially zero
C) 0.3745
D) 0.9999
Suppose it is known that the income distribution in a particular region is right-skewed
and bi-modal. If bank economists are interested in estimating the mean income, which
of the following is true?
A) Provided that the sample size is sufficiently large, the sampling distribution for
will be approximately normal with a mean equal to the population mean that they wish
to estimate.
B) The sampling distribution will also be right-skewed for large sample sizes.
C) The standard deviation of the sampling distribution for will be proportionally
larger than the population standard deviation, depending on the size of the sample.
D) The sampling distribution will be left-skewed.
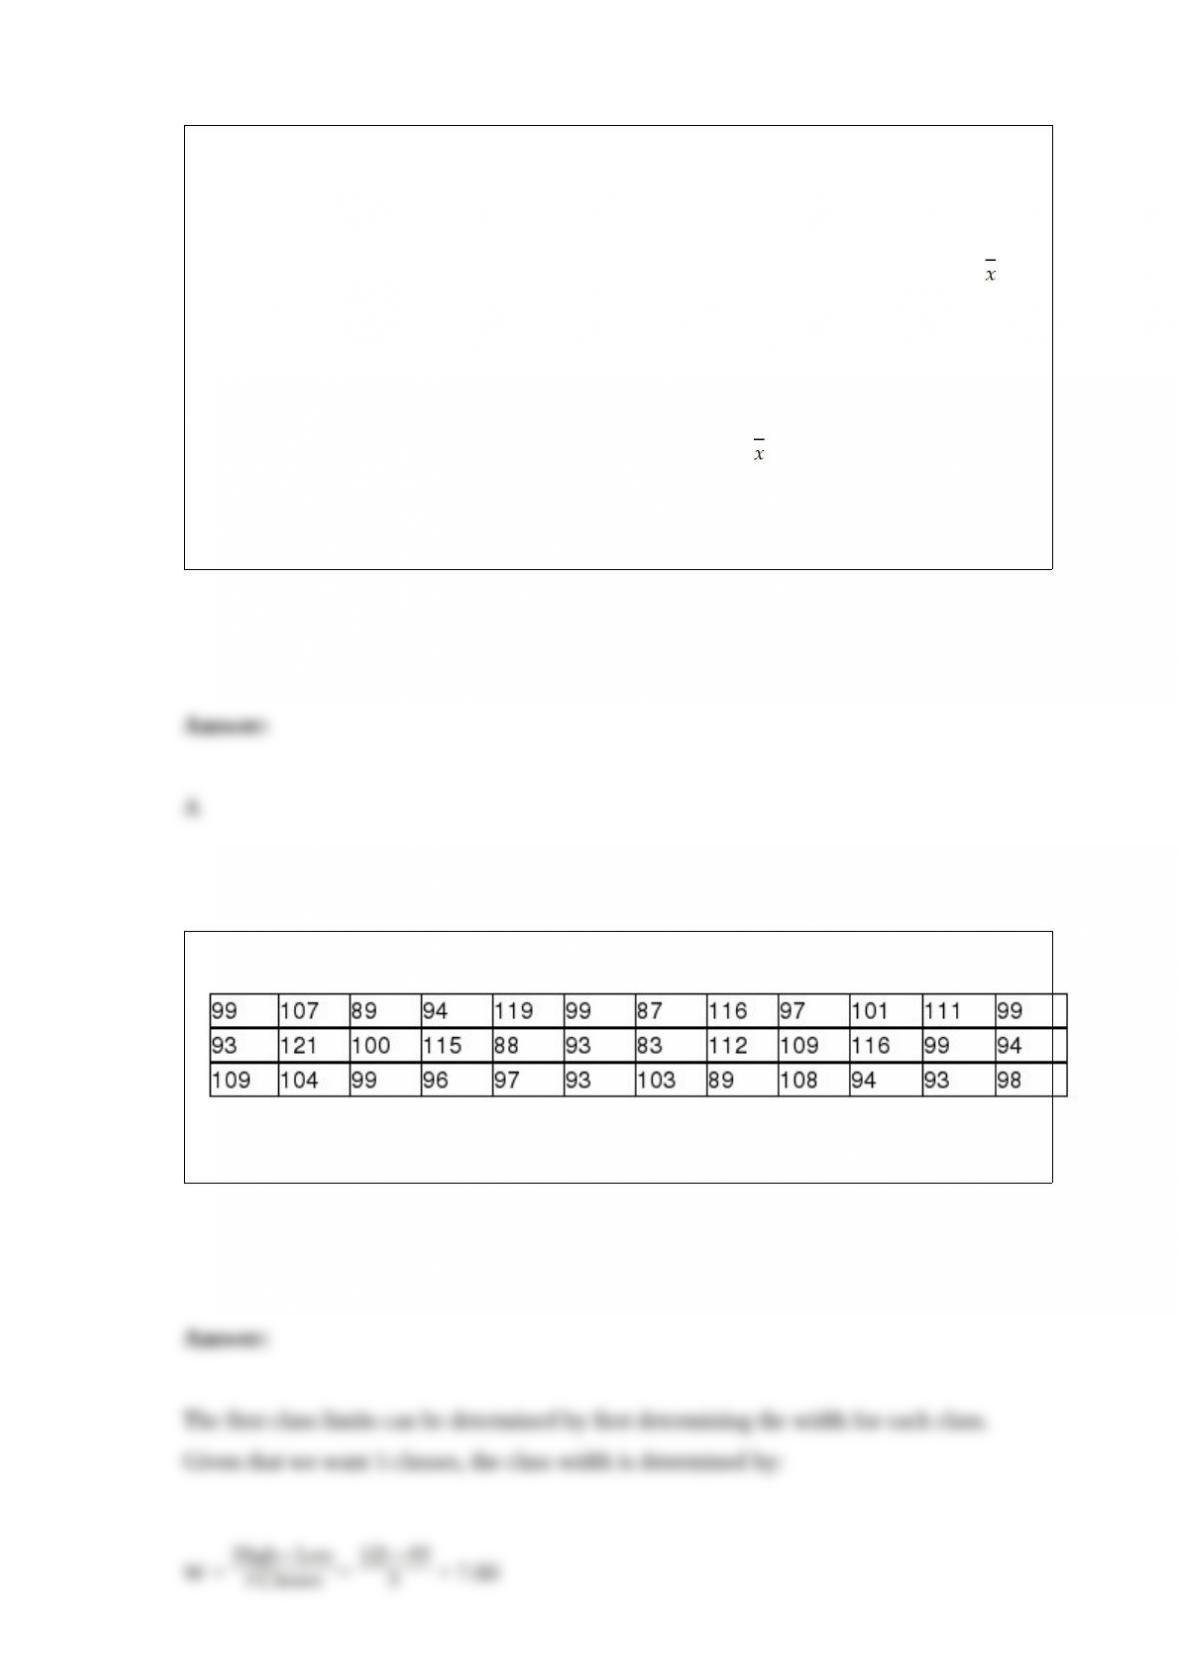
Suppose you are given the following data.
If you wish to have a histogram with five classes, what should the first class limits be?
Woof Chow Dog Food Company believes that it has a market share of 25 percent. It
surveys n = 100 dog owners and ask whether or not Woof Chow is their regular brand
of dog food. The appropriate null and alternate hypotheses are:
A) H0 : ρ = .25
Ha : ρ ≠ .25
B) H0 : p = .25
Ha : p ≠ .25
C) H0 : μ = .25
Ha : μ ≠ .25
D) H0 : p ≤ .25
Ha : p > .25
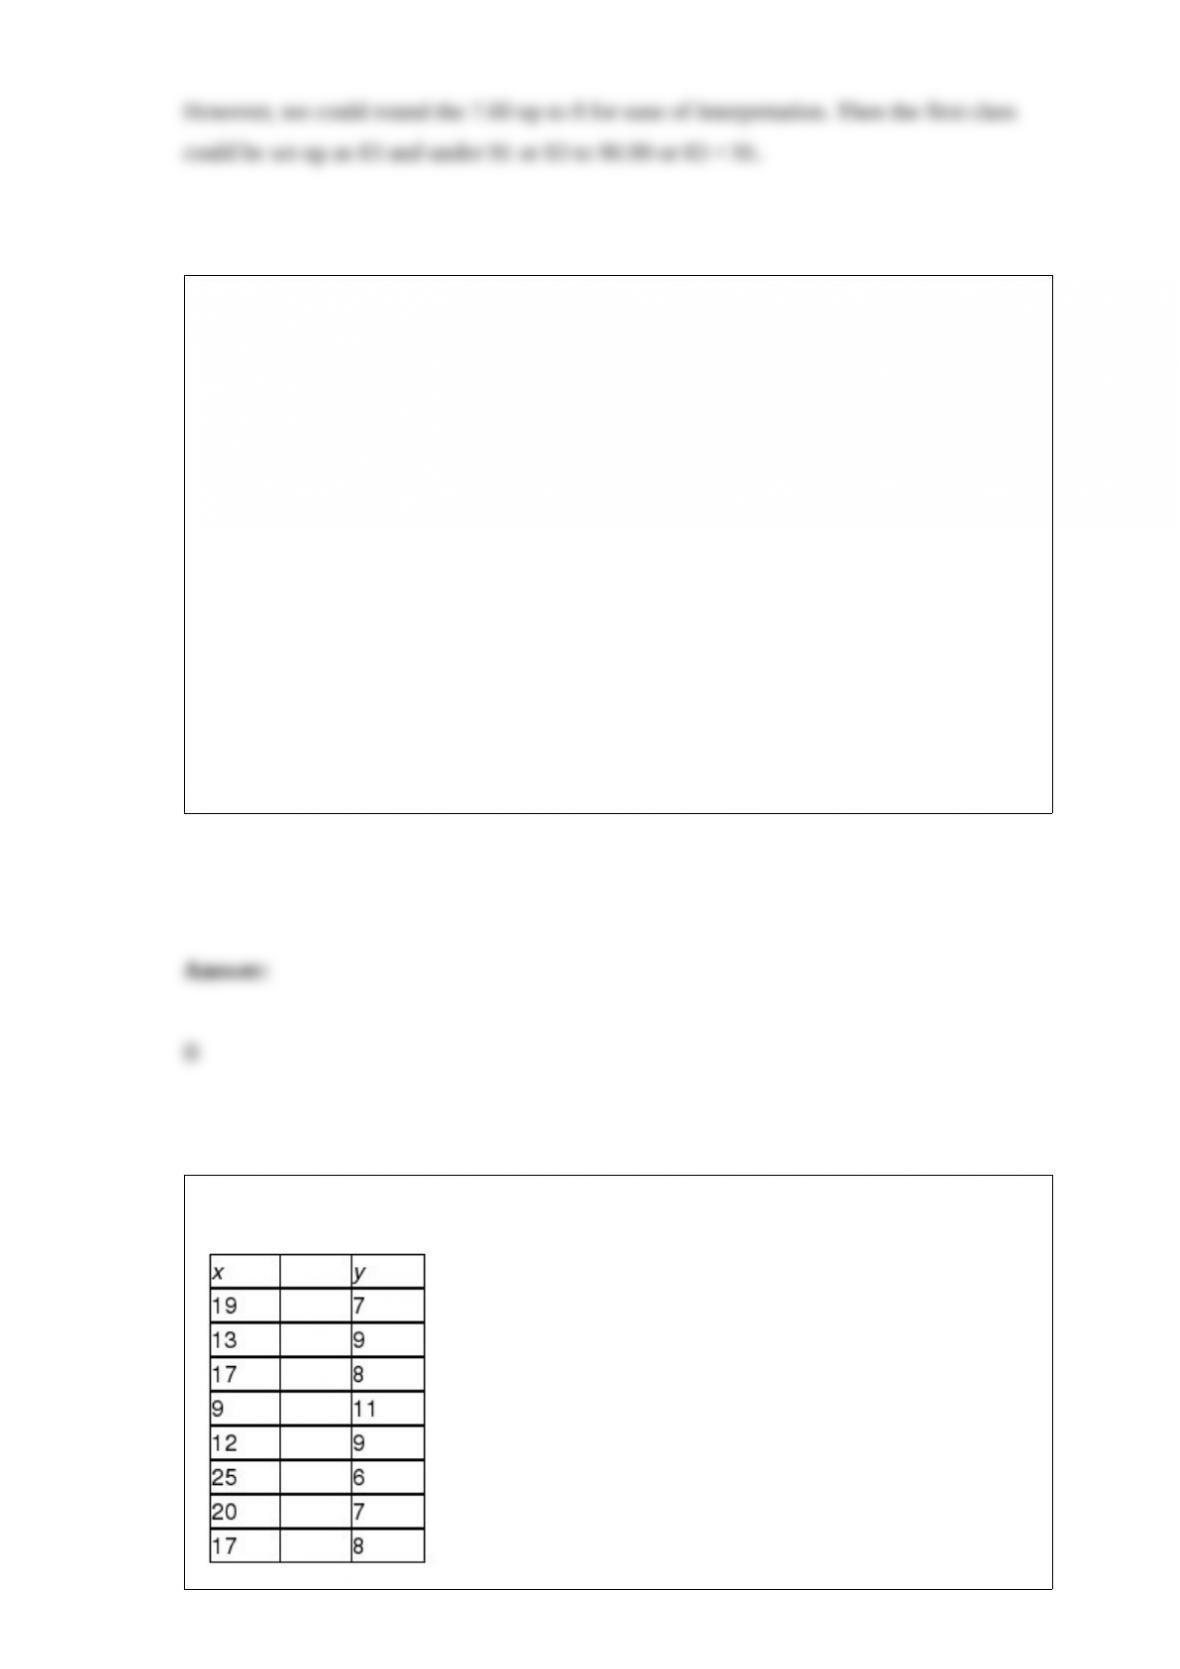
A random sample of two variables, x and y, produced the following observations:

Compute the correlation coefficient for these sample data.
A) -0.9707
B) -0.2141
C) 0.5133
D) 0.8612
For the normal distribution with parameters μ = 0, σ = 3; calculate P(x > 1).
A) 0.5812
B) 0.1214
C) 0.3707
D) 0.4412
When employing a small sample Mann-Whitney U test for a two-tailed test, which of
the following is true?
A) The sample sizes need to be equal.
B) Select as the test statistic the smaller of the two U values.

C) Select either of the U values to be the test statistic.
D) The alpha level should be doubled.