In order to avoid the free-rider problem, which of the following goods is best provided
by the government and paid for with tax dollars?
a. Automobiles.
b. Lighthouses.
c. Bread.
d. Prescription drugs.
e. Windows.
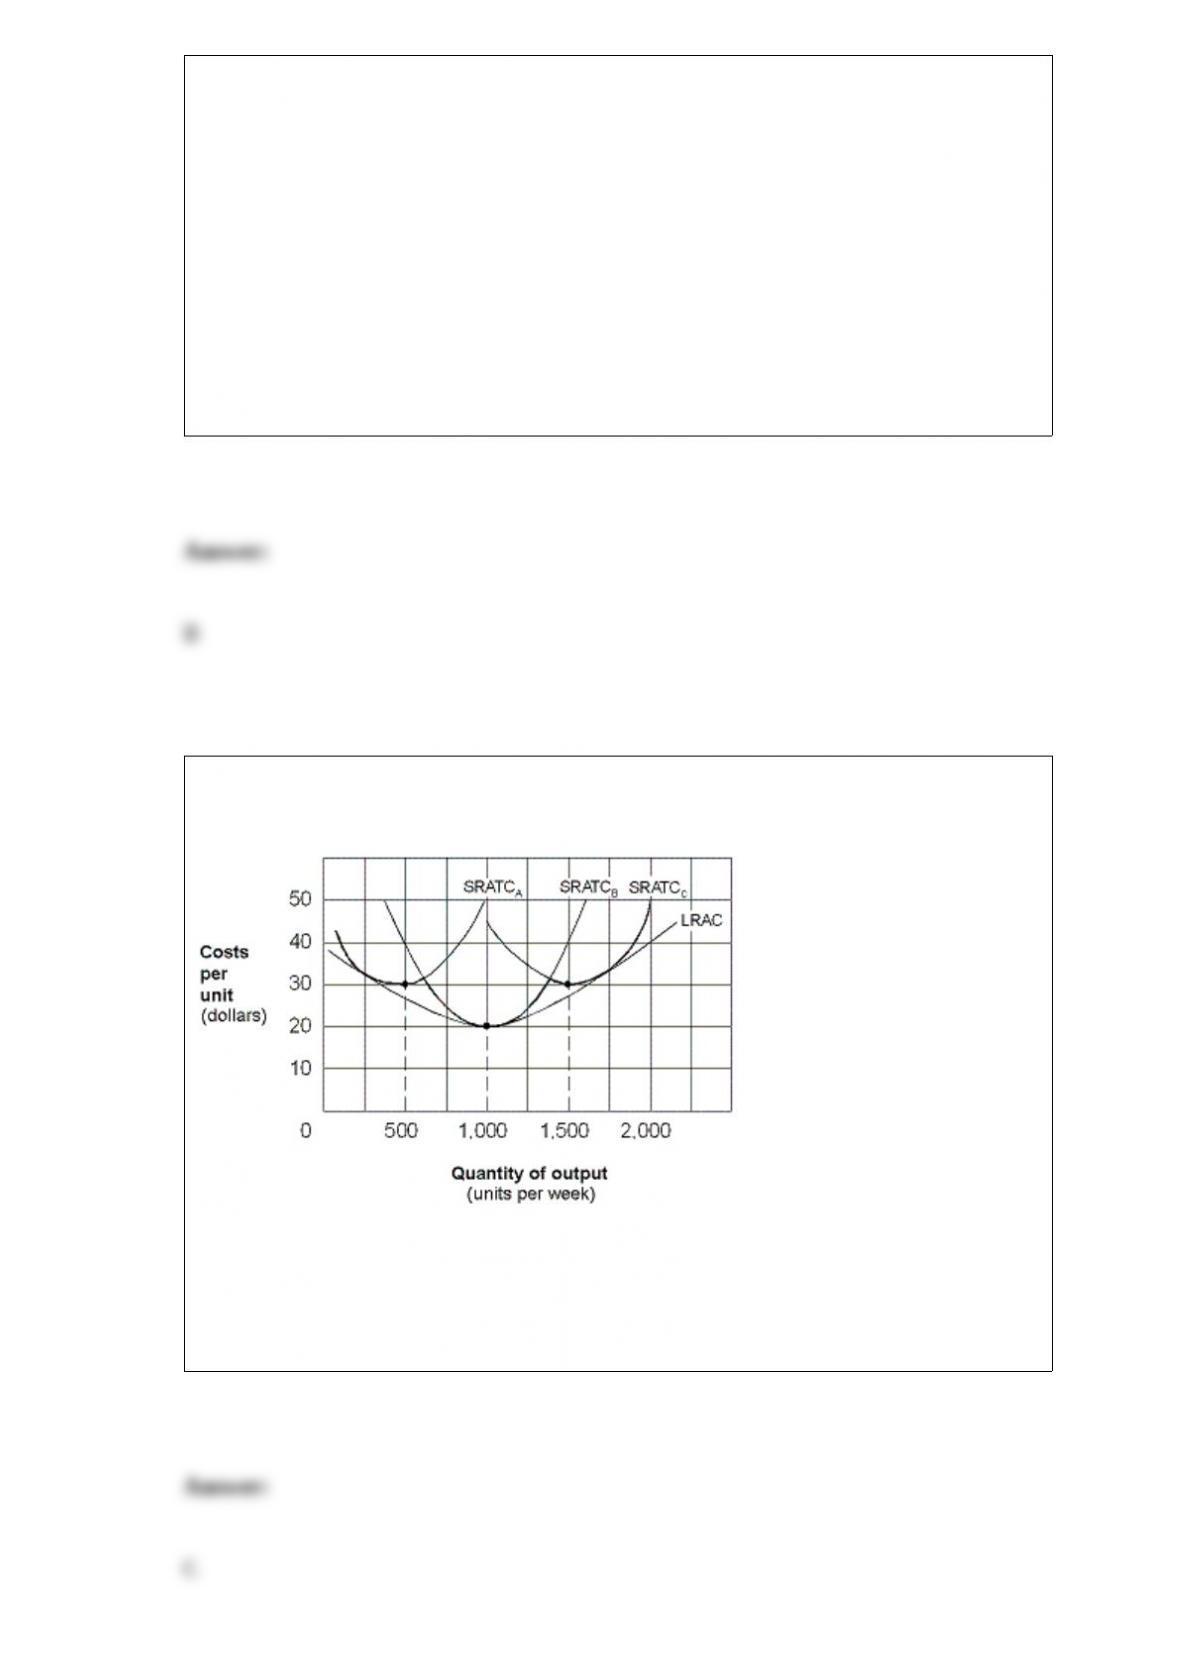
Exhibit 7-15 Long-run average cost
In Exhibit 7-15, diseconomies of scale are shown in the range of:
a. 0 to 500 units per week.
b. 500 to 1,000 units per week.
c. 1,000 to 2,000 units per week.
d. zero per week.
If two steel firms decide to merge, this merger would be classified as:
a. a horizontal merger.
b. a vertical merger.
c. a conglomerate merger.
d. either a vertical or conglomerate merger depending on the nationality of the
companies.
e. either a vertical or conglomerate merger depending on the market shares of the two
companies.
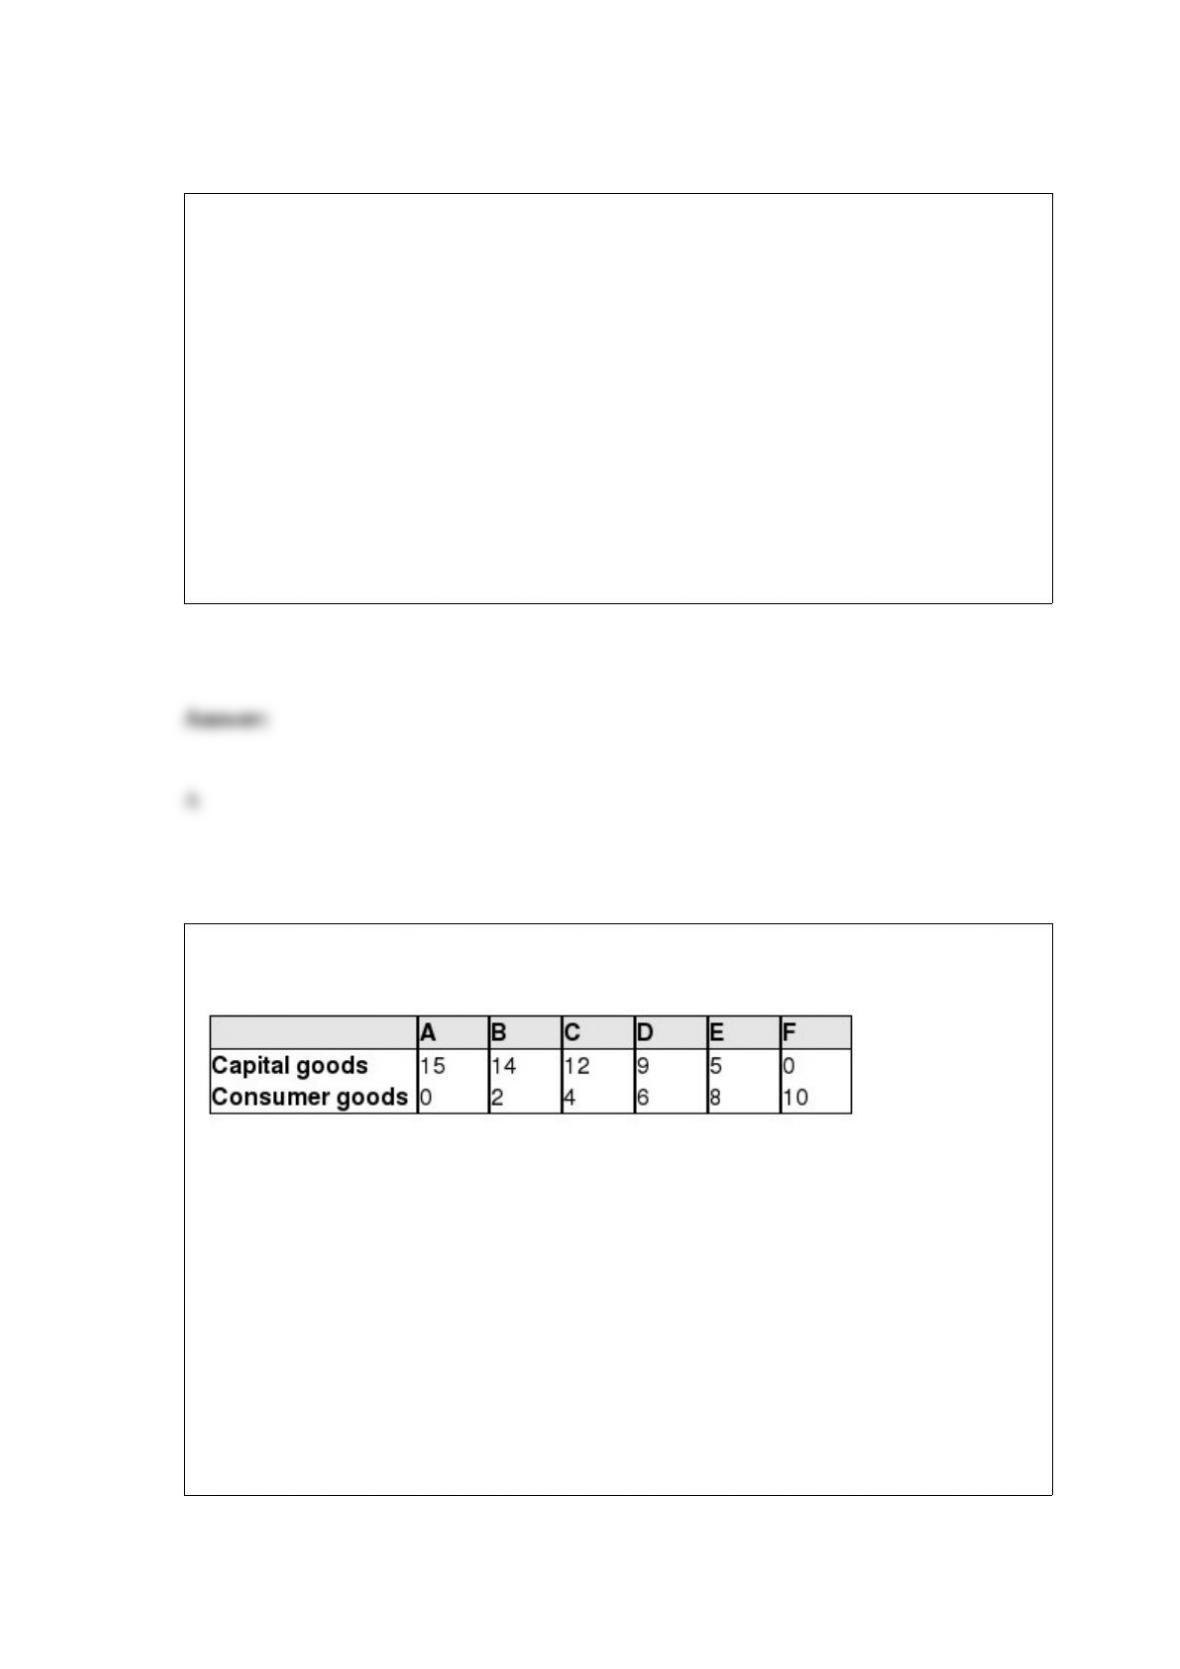
Exhibit 2-8 Production possibilities curve data
As shown in Exhibit 2-8, the concept of increasing opportunity costs is reflected in the
fact that:
a. the quantity of consumer goods produced can never be zero.
b. the labor force in the economy is homogeneous.
c. greater amounts of capital goods must be sacrificed to produce an additional 2 units
of consumer goods.
d. a graph of the production data is a downward-sloping straight line.
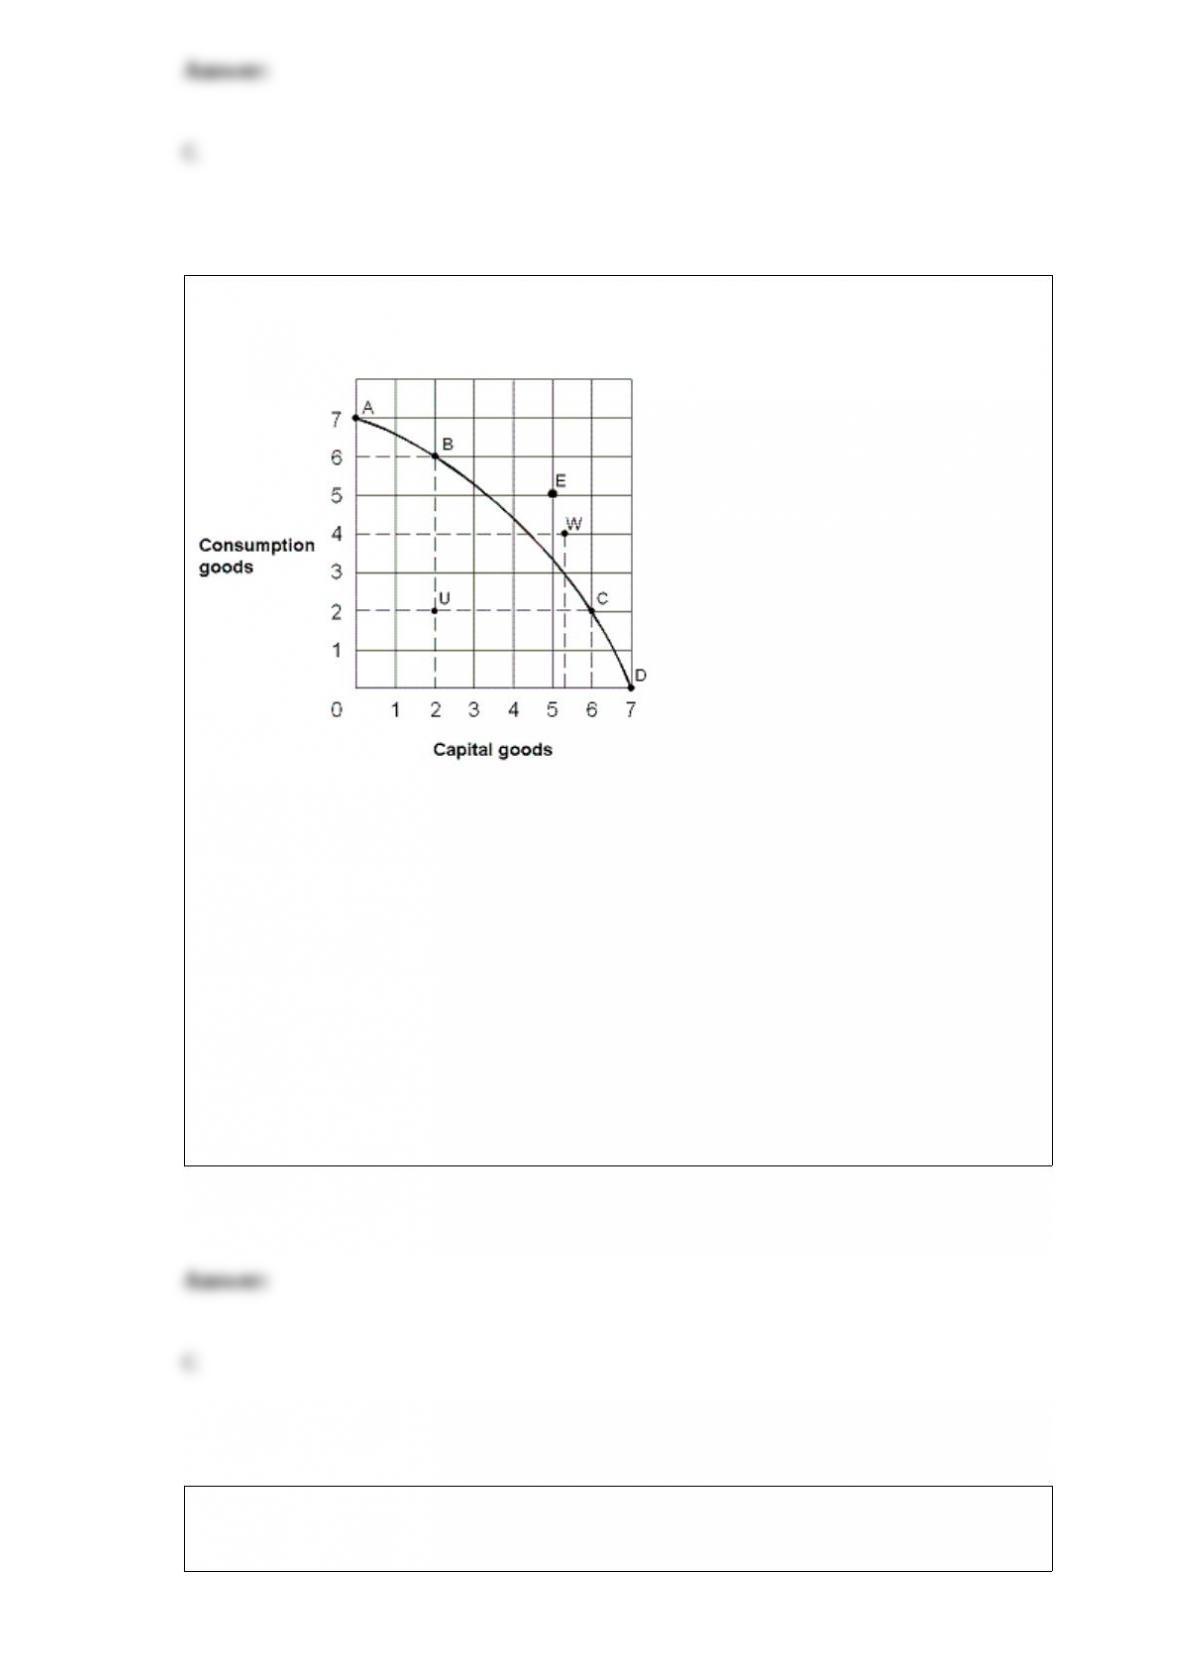
Exhibit 2-16 Production possibilities curve
In Exhibit 2-16, which of the following points on the production possibilities curve are
unattainable with the resources and technology currently available?
a. A, B, C, U
b. A, B, C, D, U
c. E and W
d. B, C, D, U
e. A, B, C, D
Exhibit 6A-6 Consumer equilibrium
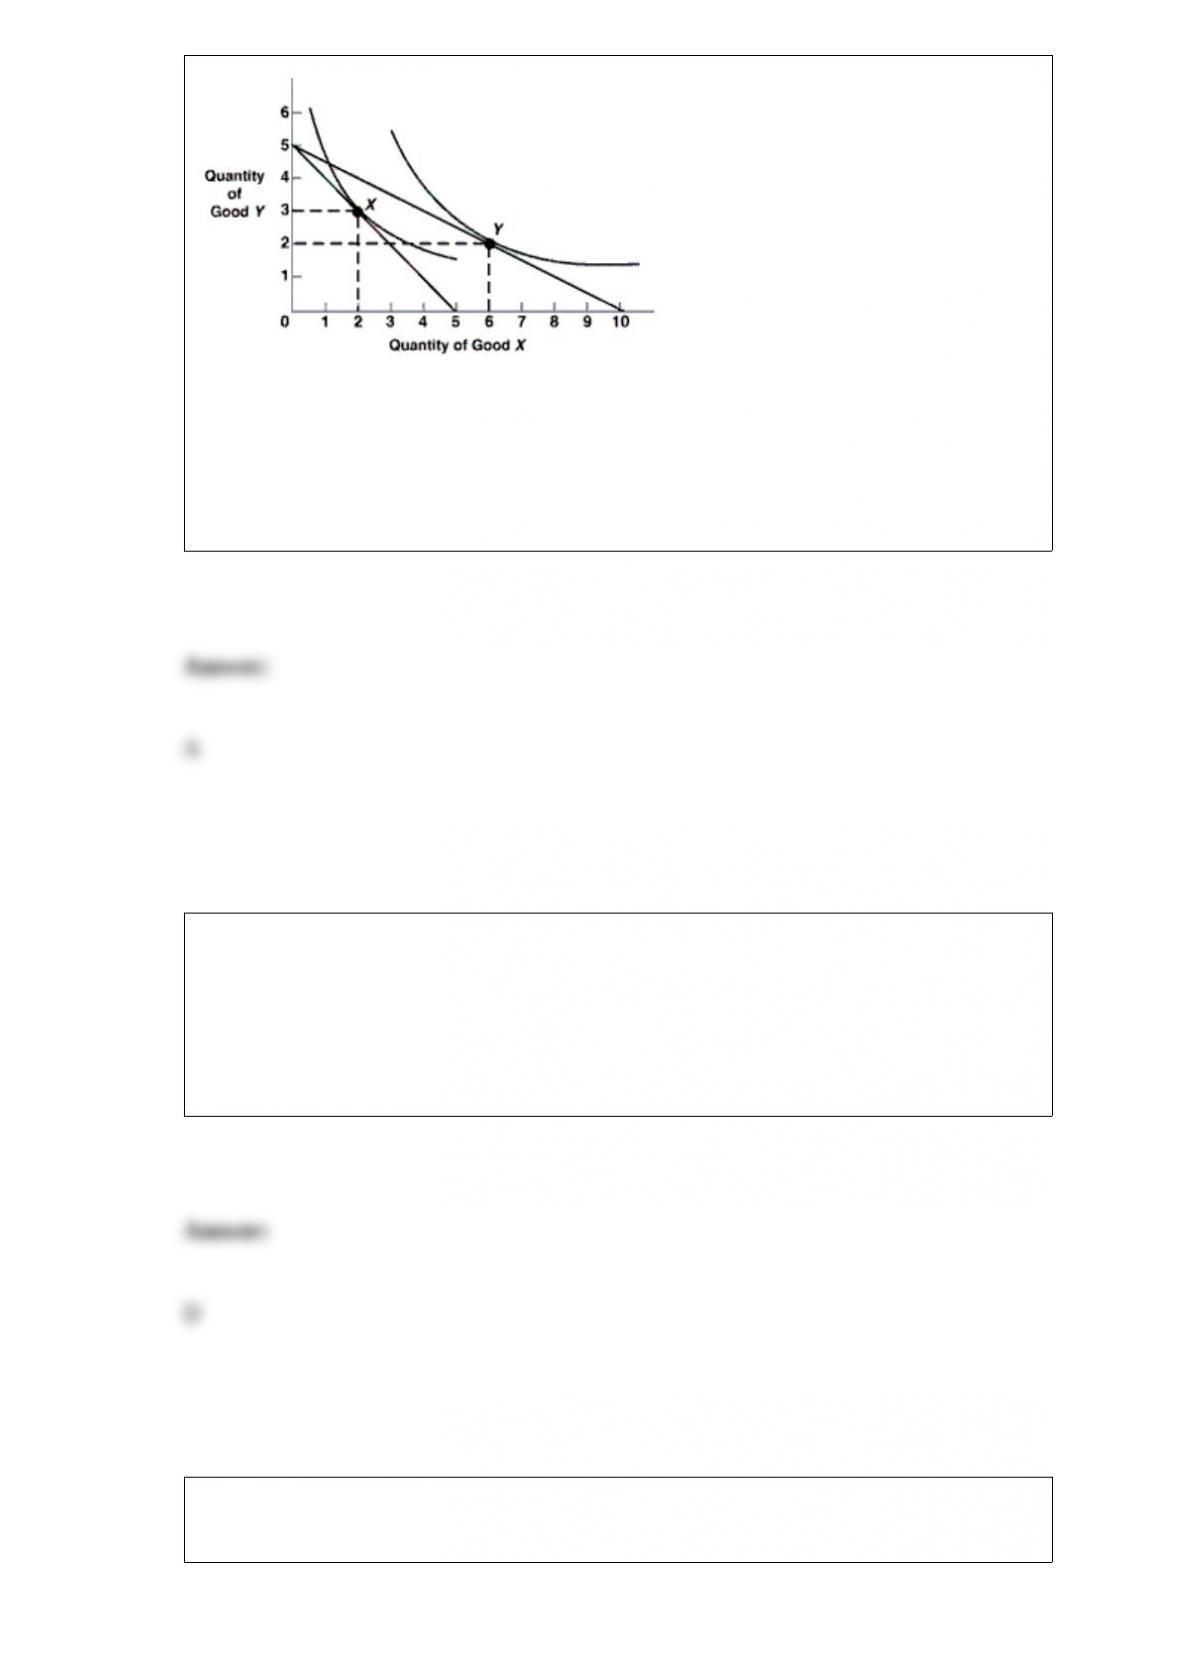
As shown in Exhibit 6A-6, the marginal rate of substitution (MRS) at point B is ____
the marginal rate of substitution at point A.
a. less than
b. greater than
c. equal to
d. twice
Which of the following countries has the largest union membership measured as the
percentage of civilian employees in unions?
a. The United States.
b. Japan.
c. The United Kingdom.
d. Sweden.
Exhibit 8-13 Price and cost per unit curves
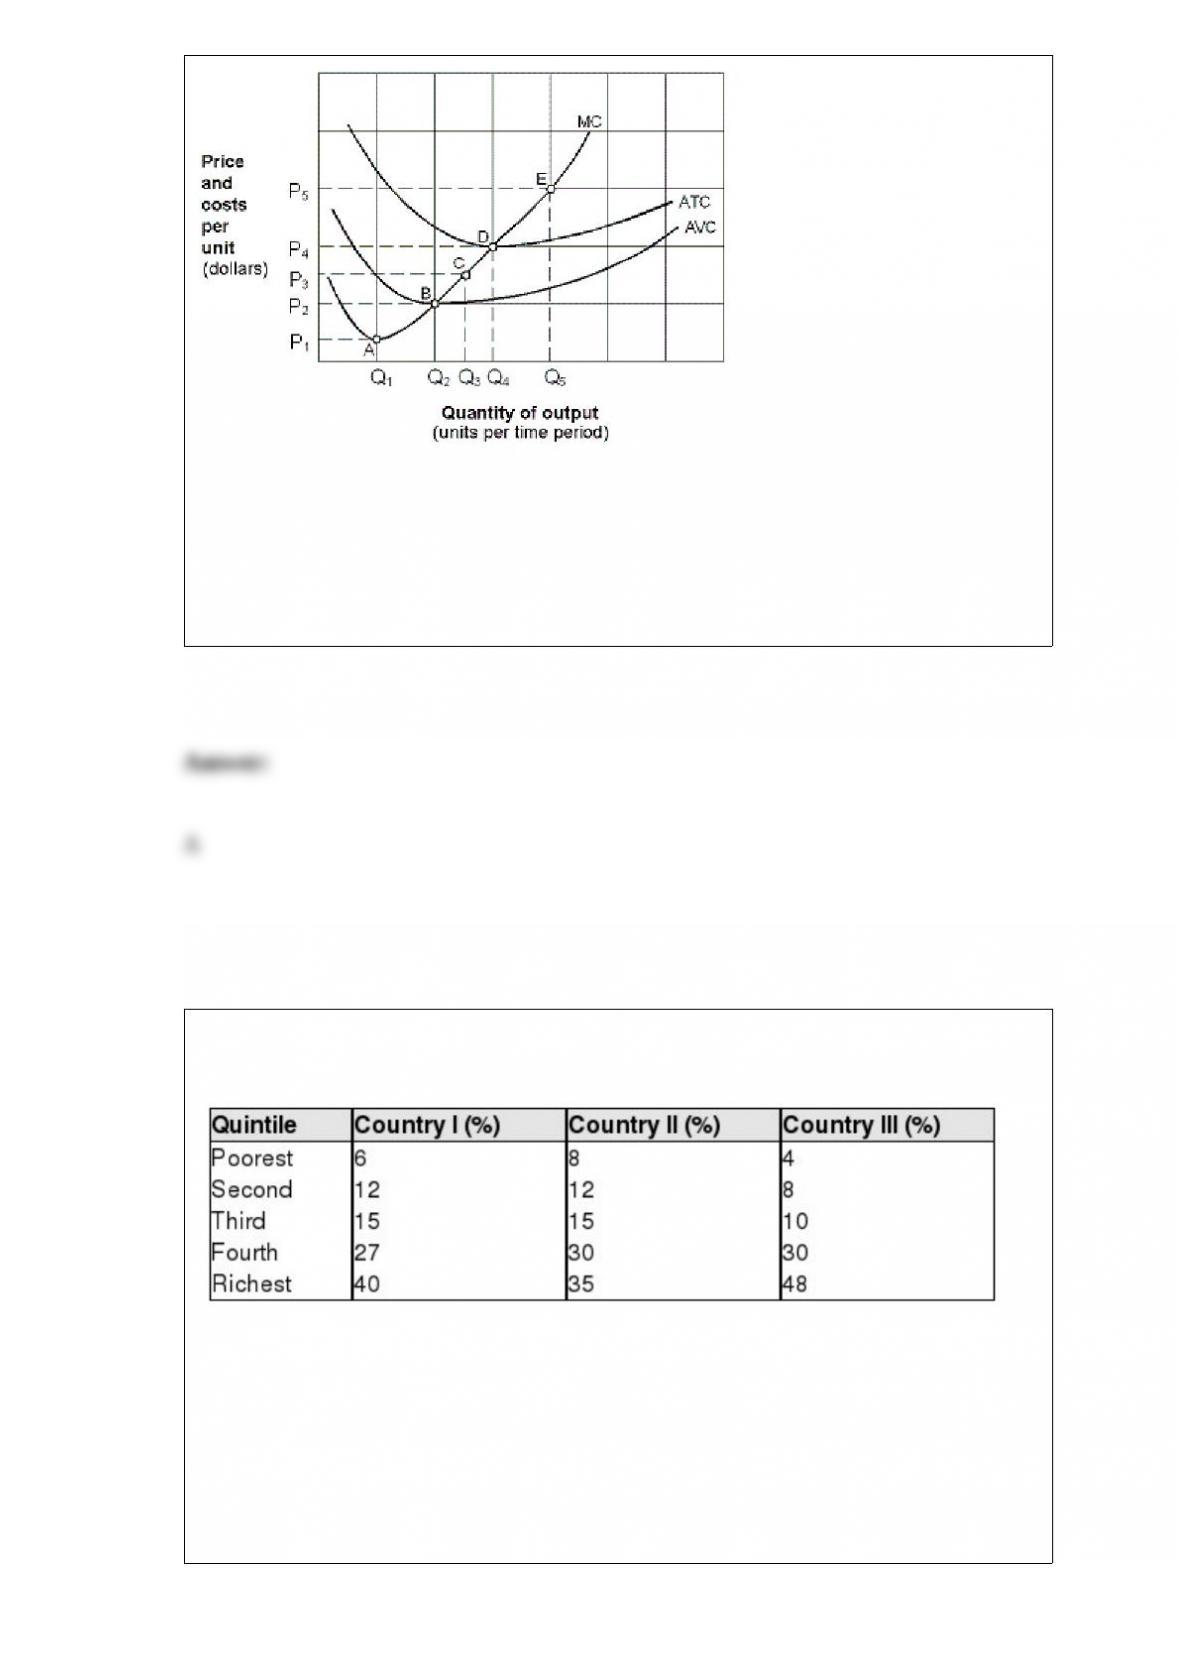
In Exhibit 8-13, the firm will not produce when the price is between:
a. zero and P2.
b. P2 and P3.
c. P3and P4.
d. P4 and P5.
Exhibit 12-1 Income distribution for three countries
Exhibit 12-1 shows the percentage of income received by each population quintile. In
Country I we can conclude that the:
a. richest 20 percent of the population received 25 percent of the economy’s income.
b. richest 20 percent of the population received 40 percent of the economy’s income.
c. richest 20 percent of the population received 80 percent of the economy’s income.
d. least-wealthy 20 percent of the population received 40 percent of the economy’s
income.
e. richest 40 percent of the population received 25 percent of the economy’s income.
A firm’s demand curve for labor coincides with the:
a. marginal cost curve.
b. average cost curve.
c. marginal revenue curve.
d. marginal revenue product curve.
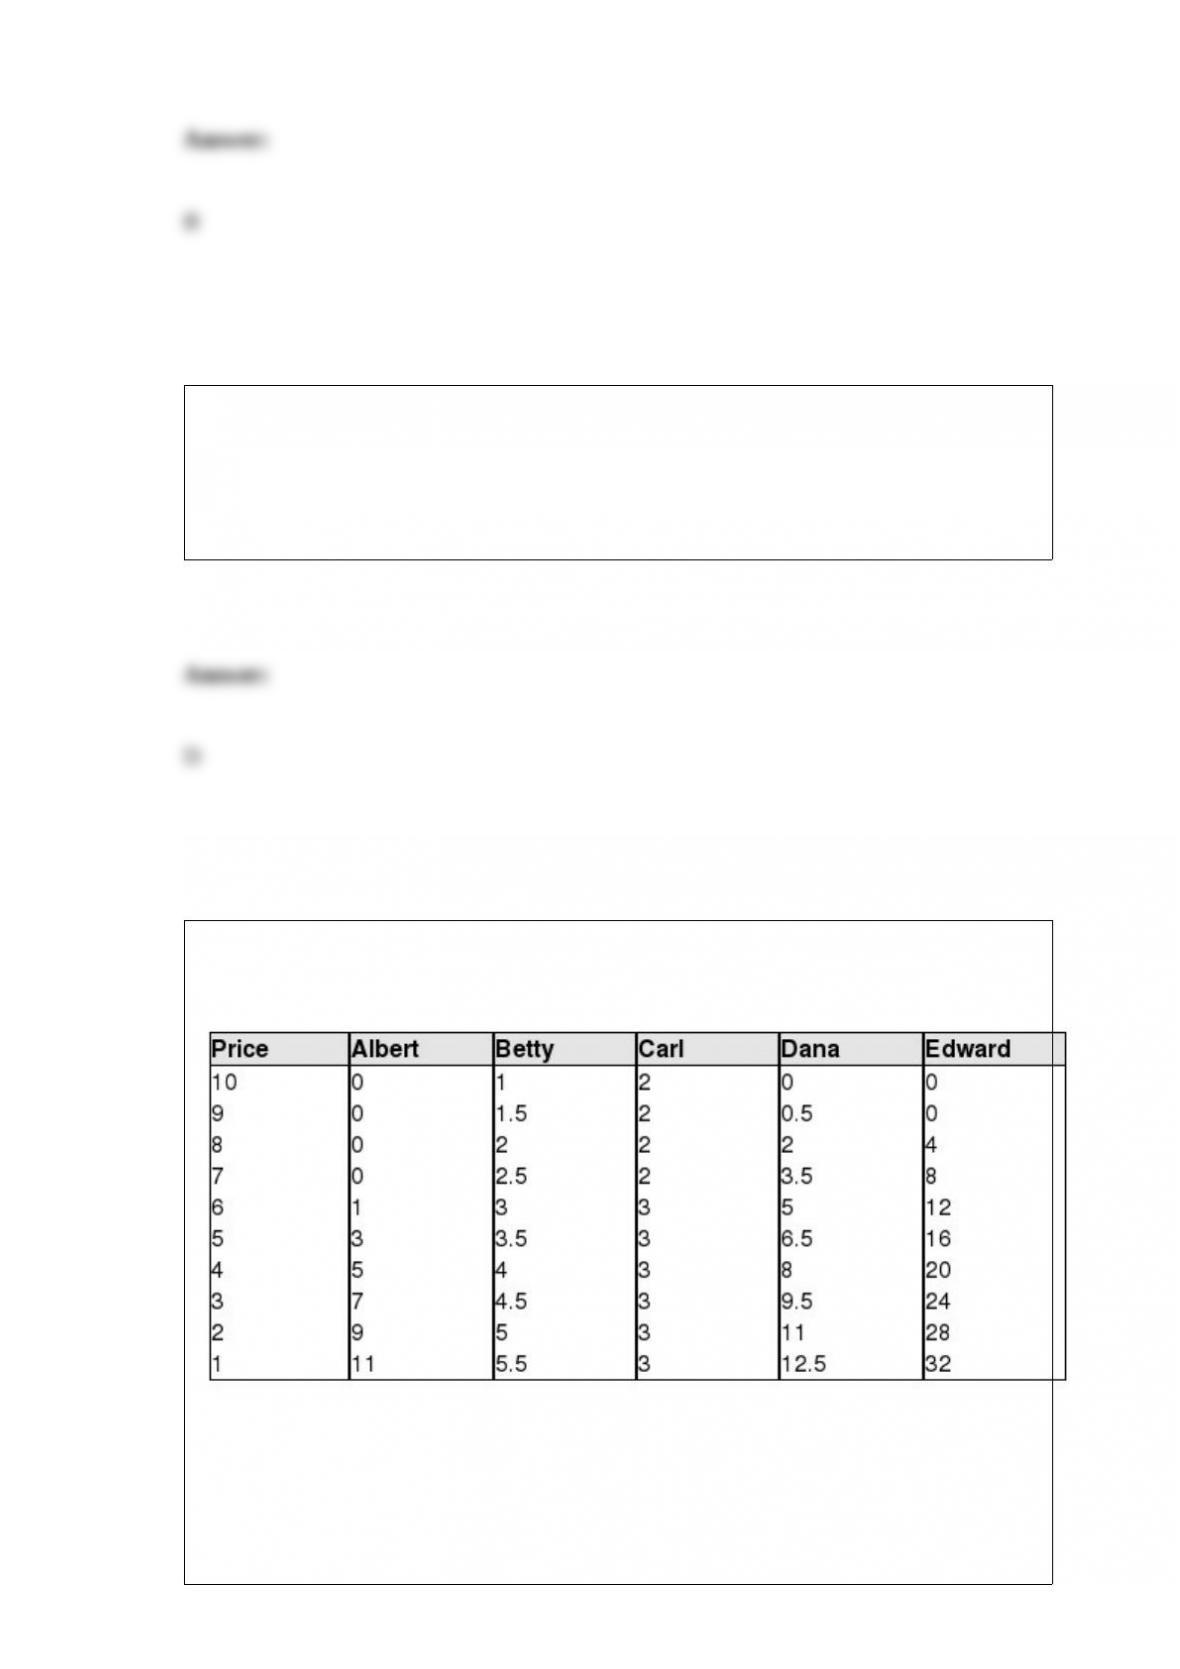
Exhibit 5-3 Demand curves for gallons of orange juice
Using Exhibit 5-3, in general, whose demand for orange juice is the most elastic?
a. Albert
b. Betty
c. Carl
d. Dana
e. Edward

An indifference curve consists of quantity combinations of two goods that yield:
a. equal marginal utilities.
b. negative marginal utilities.
c. the same price ratios.
d. the same total satisfaction.
At the level of output where the marginal cost and marginal revenue curves intersect, a
monopolist’s demand curve passes above its average total cost curve. The firm will:
a. be able to make a pure economic profit.
b. stay in operation in the short-run, but shut down.
c. shut down in the short-run.
d. increase its price.
Which of the following is true about long-run equilibrium in a monopolistically
competitive market?

a. Firms earn zero economic profit because price equals long-run average cost, but the
equilibrium is not allocatively efficient because price exceeds the marginal cost of the
last unit produced.
b. They may earn negative, zero, or positive economic profit because monopolistically
competitive firms are price takers.
c. Each firm faces a perfectly elastic demand curve and earns zero economic profit
because price equals long-run average cost, and are allocatively efficient because price
equals marginal cost for the last unit sold.
d. None of the above are correct.
Which of the following is true about advertising by a firm?
a. It is not always successful in increasing demand for a firm’s product.
b. It attempts to increase demand and to make demand more inelastic.
c. It may reduce per unit costs of production when economies of scale are experienced.
d. All of these.
Tennessee emits sulfur dioxide that flows into North Carolina. In meeting sulfur
emissions regulations, the Tennessee Valley Authority (TVA), which produces
electricity, buys sulfur emission permits from Wyoming. The resulting hot spot problem
is:
a. The citizens of Wyoming will experience higher sulfur emissions as a result of the
emissions trading program.

b. The citizens of Wyoming will experience lower sulfur emissions as a result of the
emissions trading program.
c. The citizens of Tennessee will pay more to reduce sulfur emissions than if the
government used a command-and-control approach.
d. The citizens of North Carolina will suffer higher emissions as a result of the
emissions trading program.
JoAnn considers cola and plain sparkling water to be good substitutes. Suppose the
price of sugar, a key ingredient used to produce cola, falls. According to the income
effect, which of the following is most likely to occur?
a. JoAnn will purchase less cola and more sparkling water.
b. JoAnn will purchase more cola and less sparkling water.
c. JoAnn will purchase more of most goods due to her higher real income.
d. JoAnn’s demand curve will decrease (shift in), causing her to purchase less cola.
The “kinked” oligopoly demand curve is a result of the assumption by an oligopolist
that:
a. price increases will be matched, but price reductions will not.
b. price increases will not be matched, but price reductions will.
c. both price increases and price reductions will be matched.
d. neither price increases, nor price reductions will be matched.