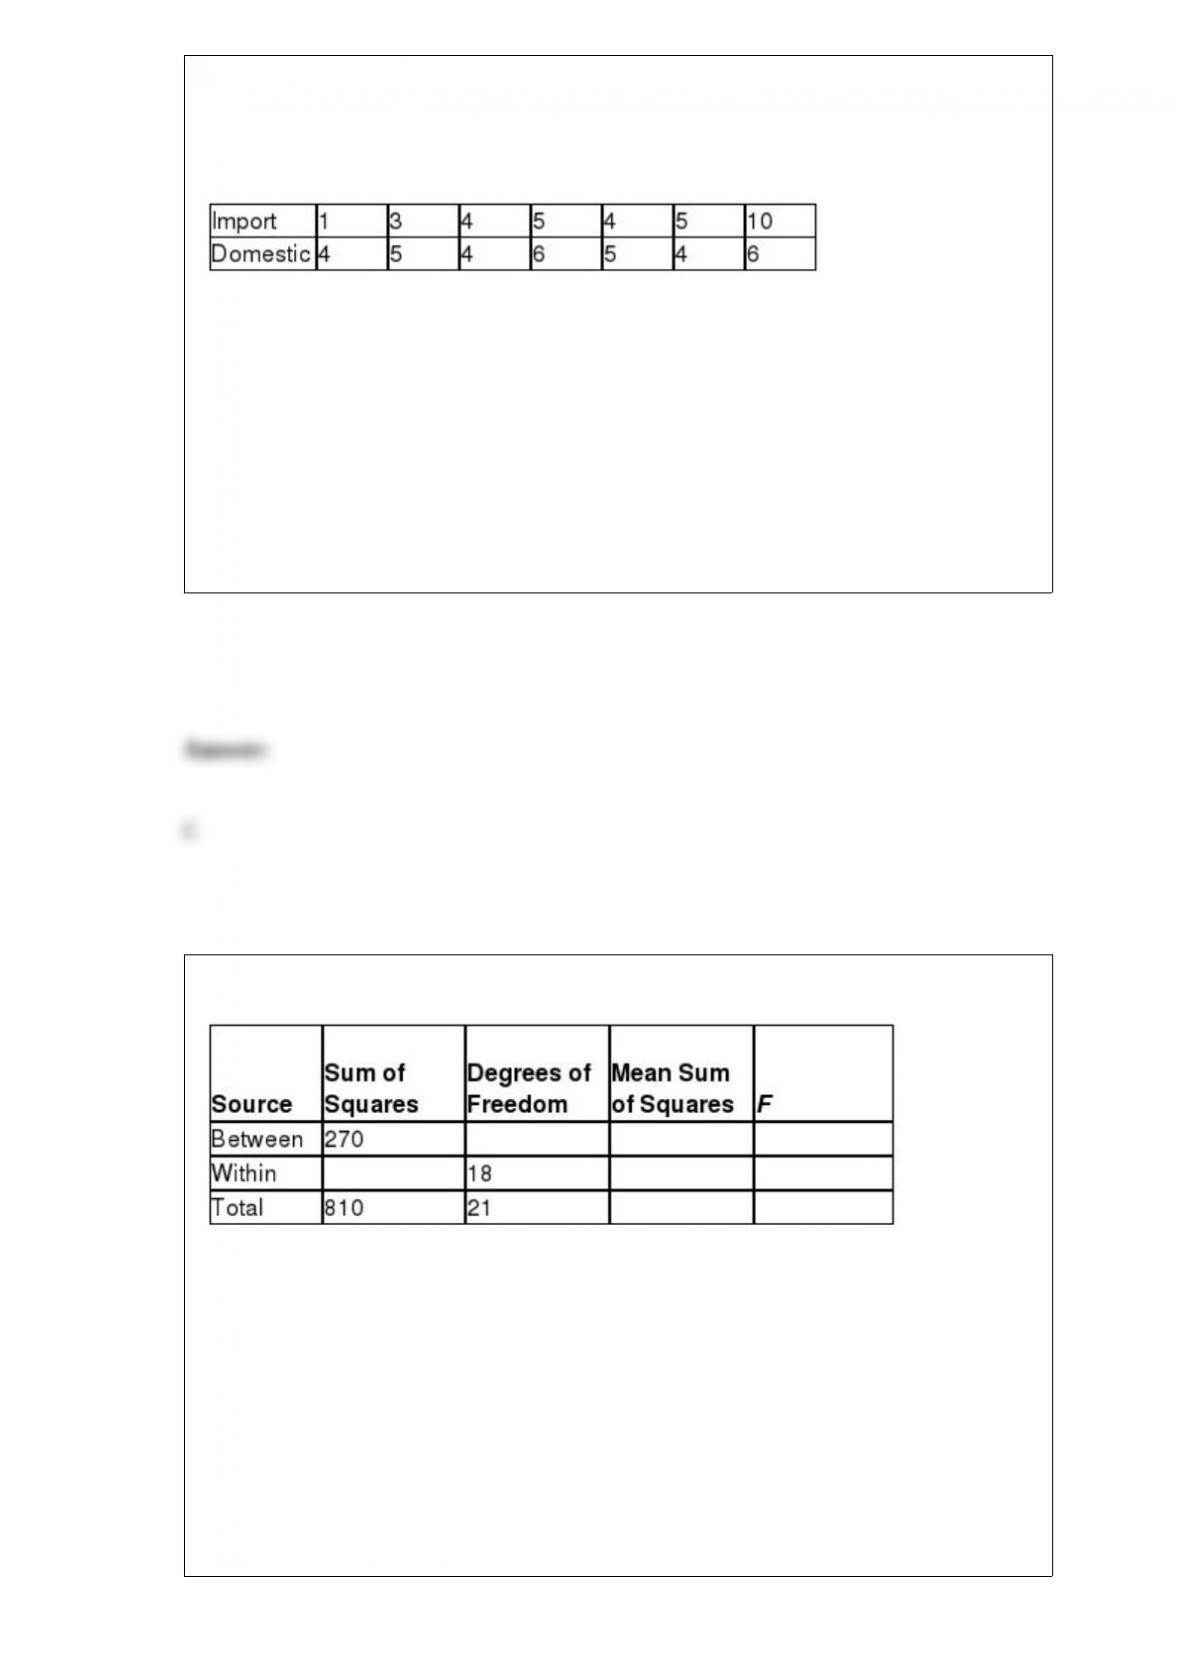
Edmunds.com would like to test the hypothesis that the standard deviation for the age
of an imported car on the road is greater than the standard deviation for the age of a
domestic car. The following data shows the ages of a random sample of import and
domestic cars.
The degrees of freedom for the critical value for domestic cars would be ________.
A) 4
B) 5
C) 6
D) 7
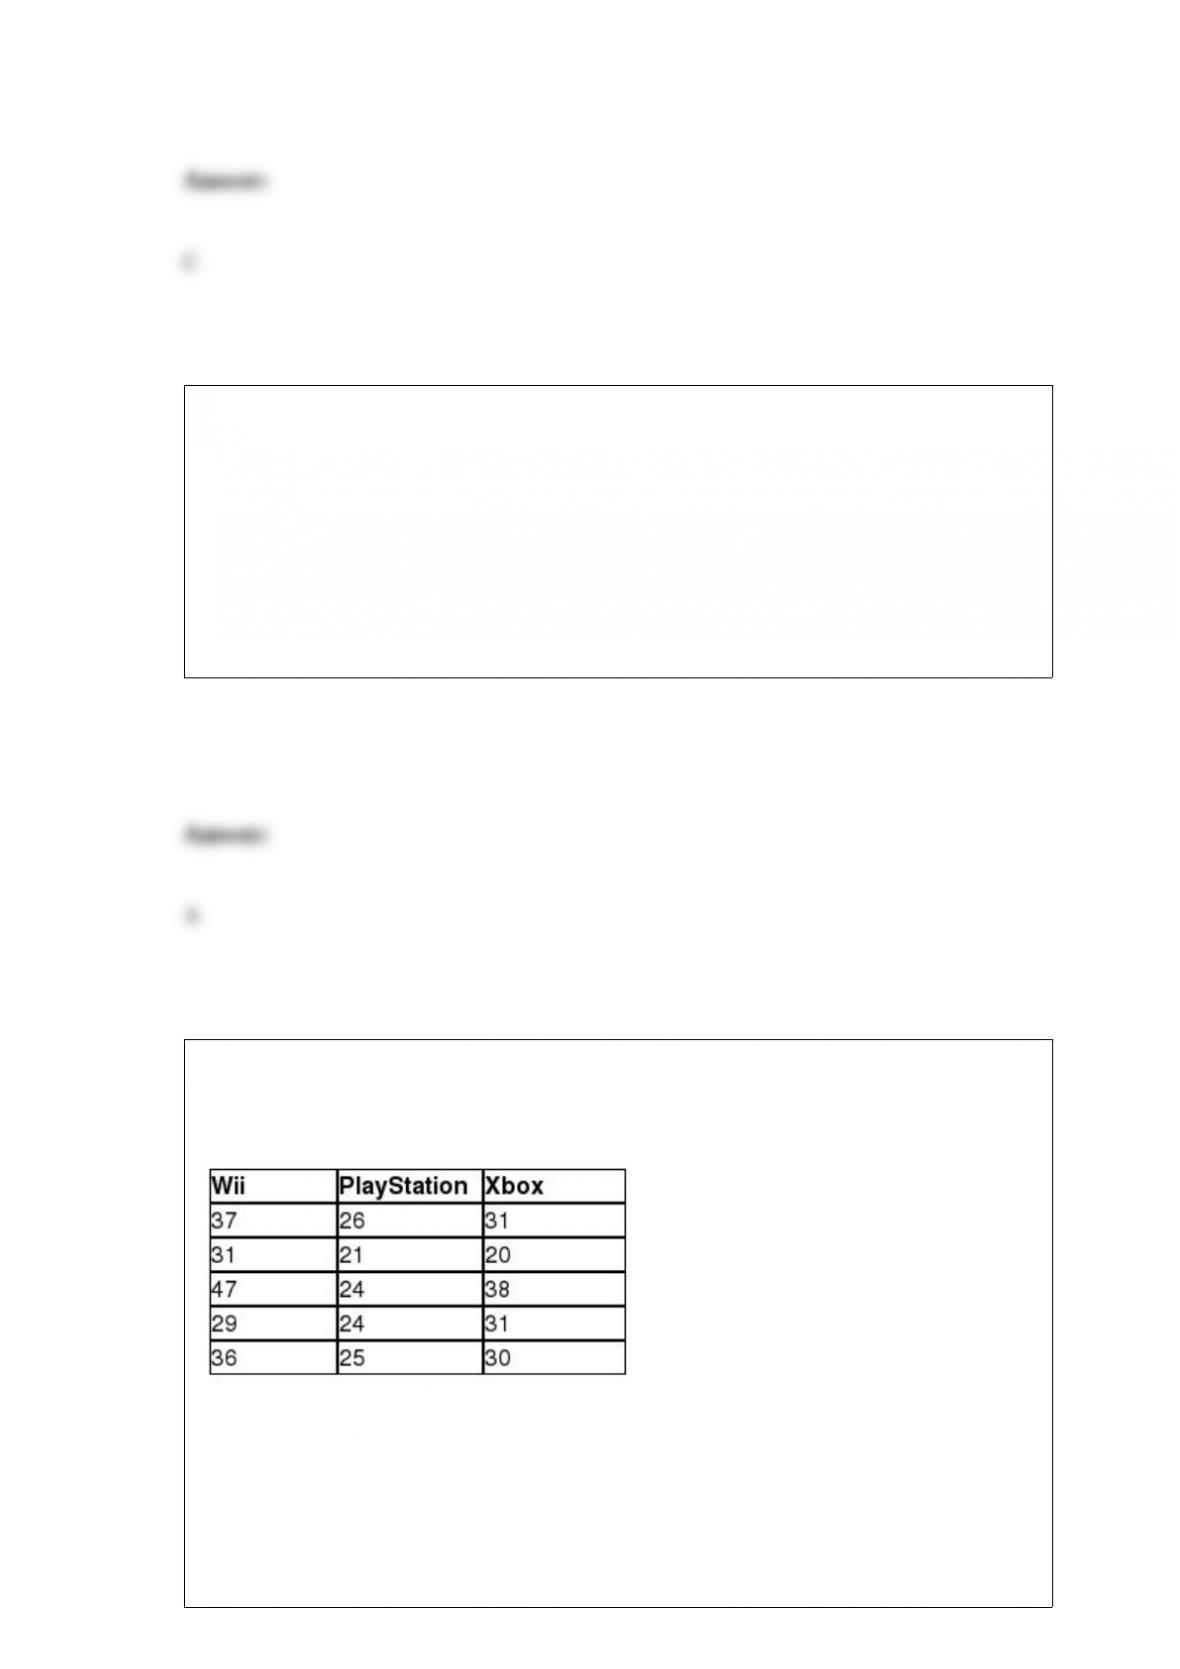
Consider the partially completed one-way ANOVA summary table.
The degrees of freedom for the sum of squares between for this ANOVA procedure is
____.
A) 1.
B) 2.
C) 3.
D) 4.
The ________ is another term for the variance of the sample data.
A) mean square total
B) mean square between
C) mean square within
D) total sum of squares
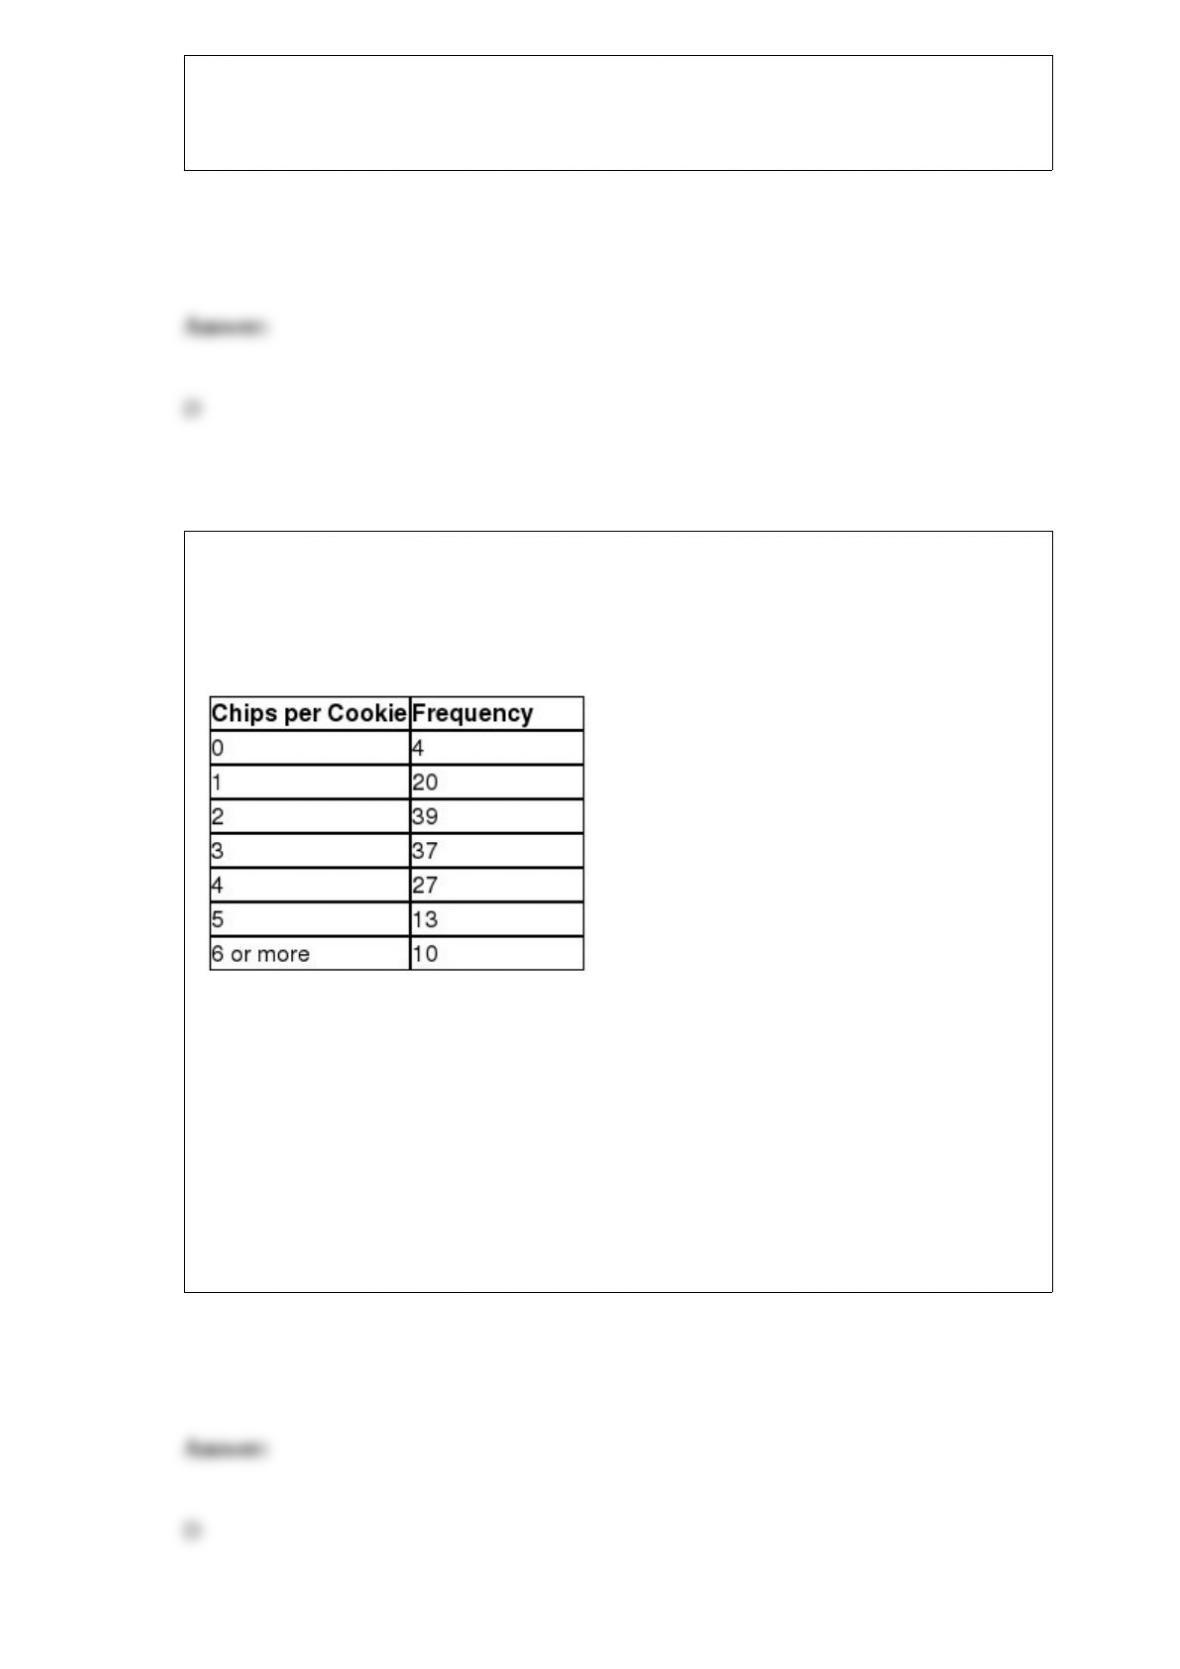
Nintendo Sony would like to test the hypothesis that a difference exists in the average
age of users of a Wii, a PlayStation, or an Xbox console game. The following data
represent the age of a random sample of Wii, PlayStation, and Xbox users.
The mean square total for these observations is ________.
A) 29.8
B) 33.2
C) 45.9
D) 52.6
A chocolate chip cookie producer claims that its cookies average 3 chocolate chips and
that the distribution follows the Poisson. A consumer group wanted to test this claim
and randomly sampled 150 cookies. The resulting frequency distribution is shown
below.
The degrees of freedom for the critical value is ________.
A) 3
B) 4
C) 5
D) 6
Suppose a one-way ANOVA procedure is being used to compare the means of five
different populations. The number of sample means to examine using the
Tukey-Kramer multiple comparisons test is ____.
A) 5.
B) 6.
C) 8.
D) 10.
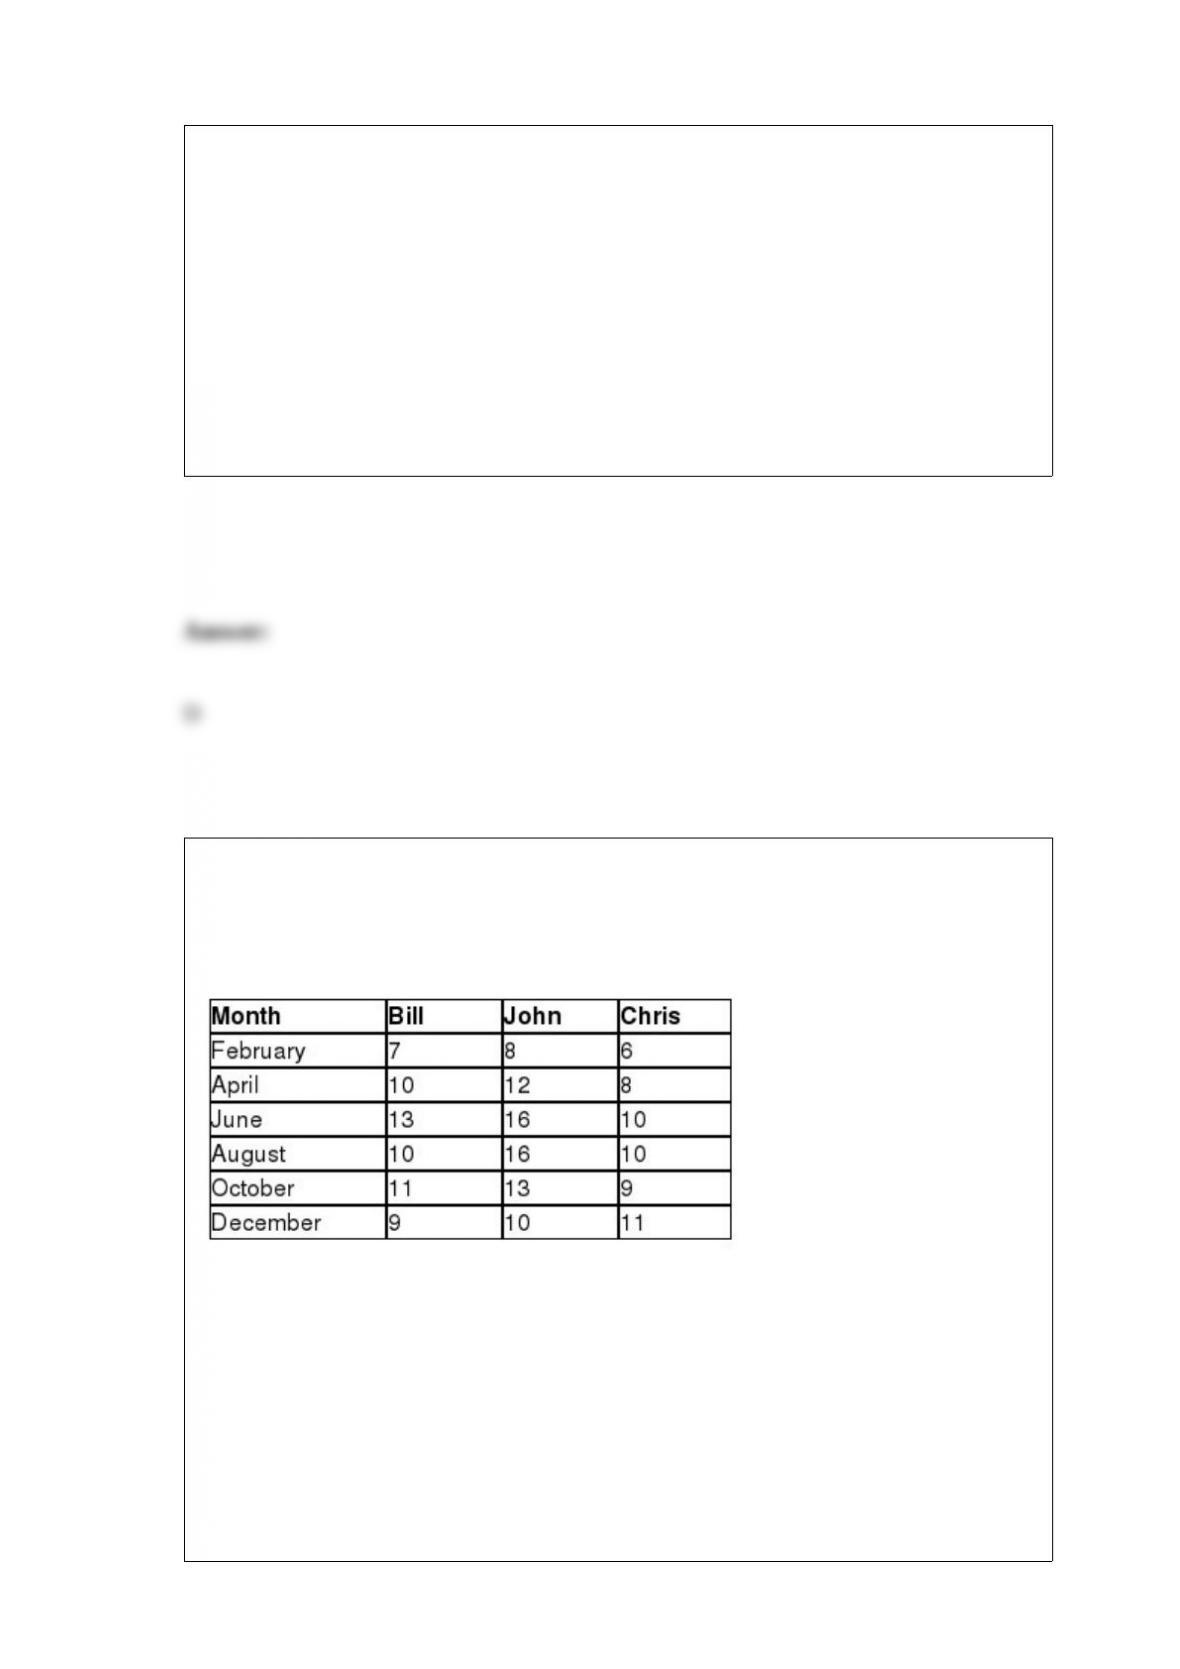
Sheridan Motors is a car dealership that would like to investigate if there is a difference
in the average number of car sales per month between three sales employees using a
randomized block ANOVA. The following data represent the number of car sales last
year for these employees for six different months.
The main factor test statistic for this hypothesis test would be ________.
A) 5.06
B) 6.55
C) 8.48
D) 9.12
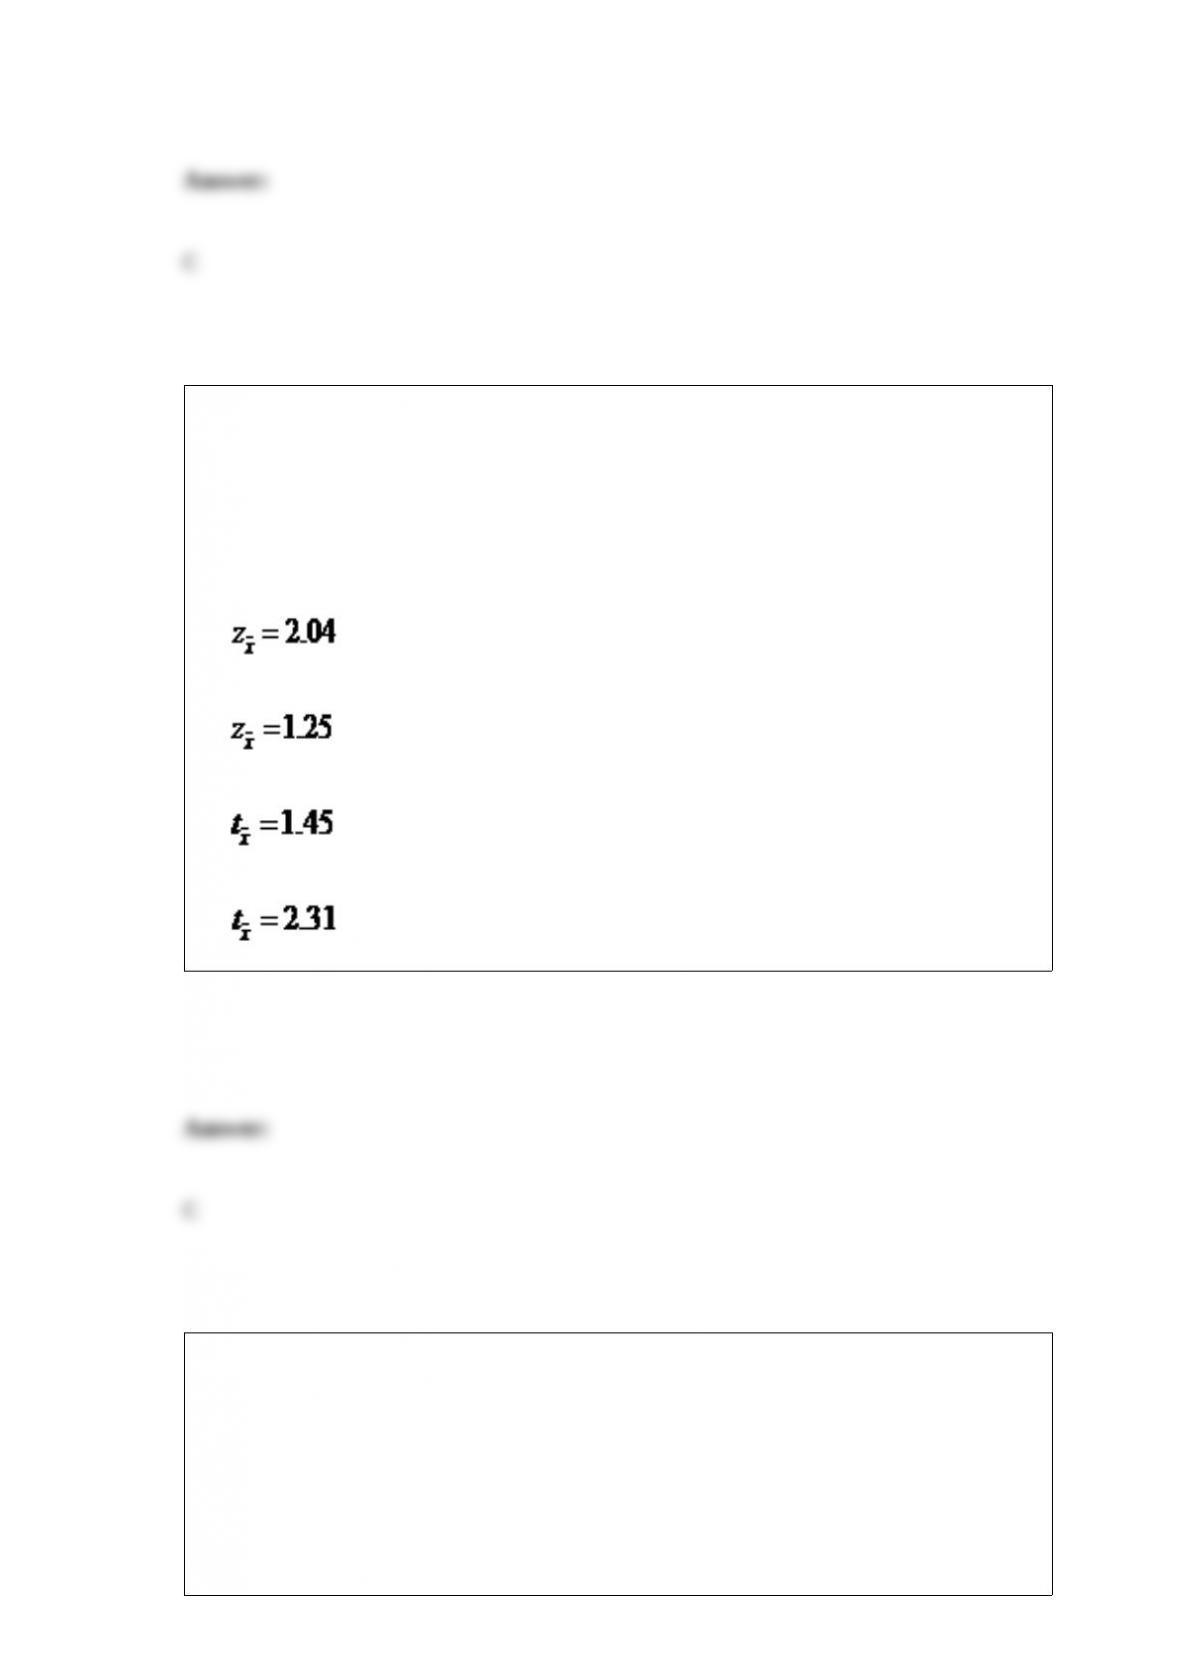
Recently, Experian reported that the average credit score for a new-car loan was 753.
Suppose Ally Financial, a bank holding company that finances car loans, would like to
test the hypothesis that the average credit score has increased since the Experian report.
A random sample of 20 new-car loans had an average credit score of 764.2 with a
sample standard deviation of 34.5. Ally Financial would like to set α = 0.05. The test
statistic for this hypothesis test would be ________.
A) .
B) .
C) .
D) .
Steve’s average golf score at his local course is 92.9 from a random sample of 60 rounds
of golf. Assume that the population standard deviation for his golf score is 4.2. The
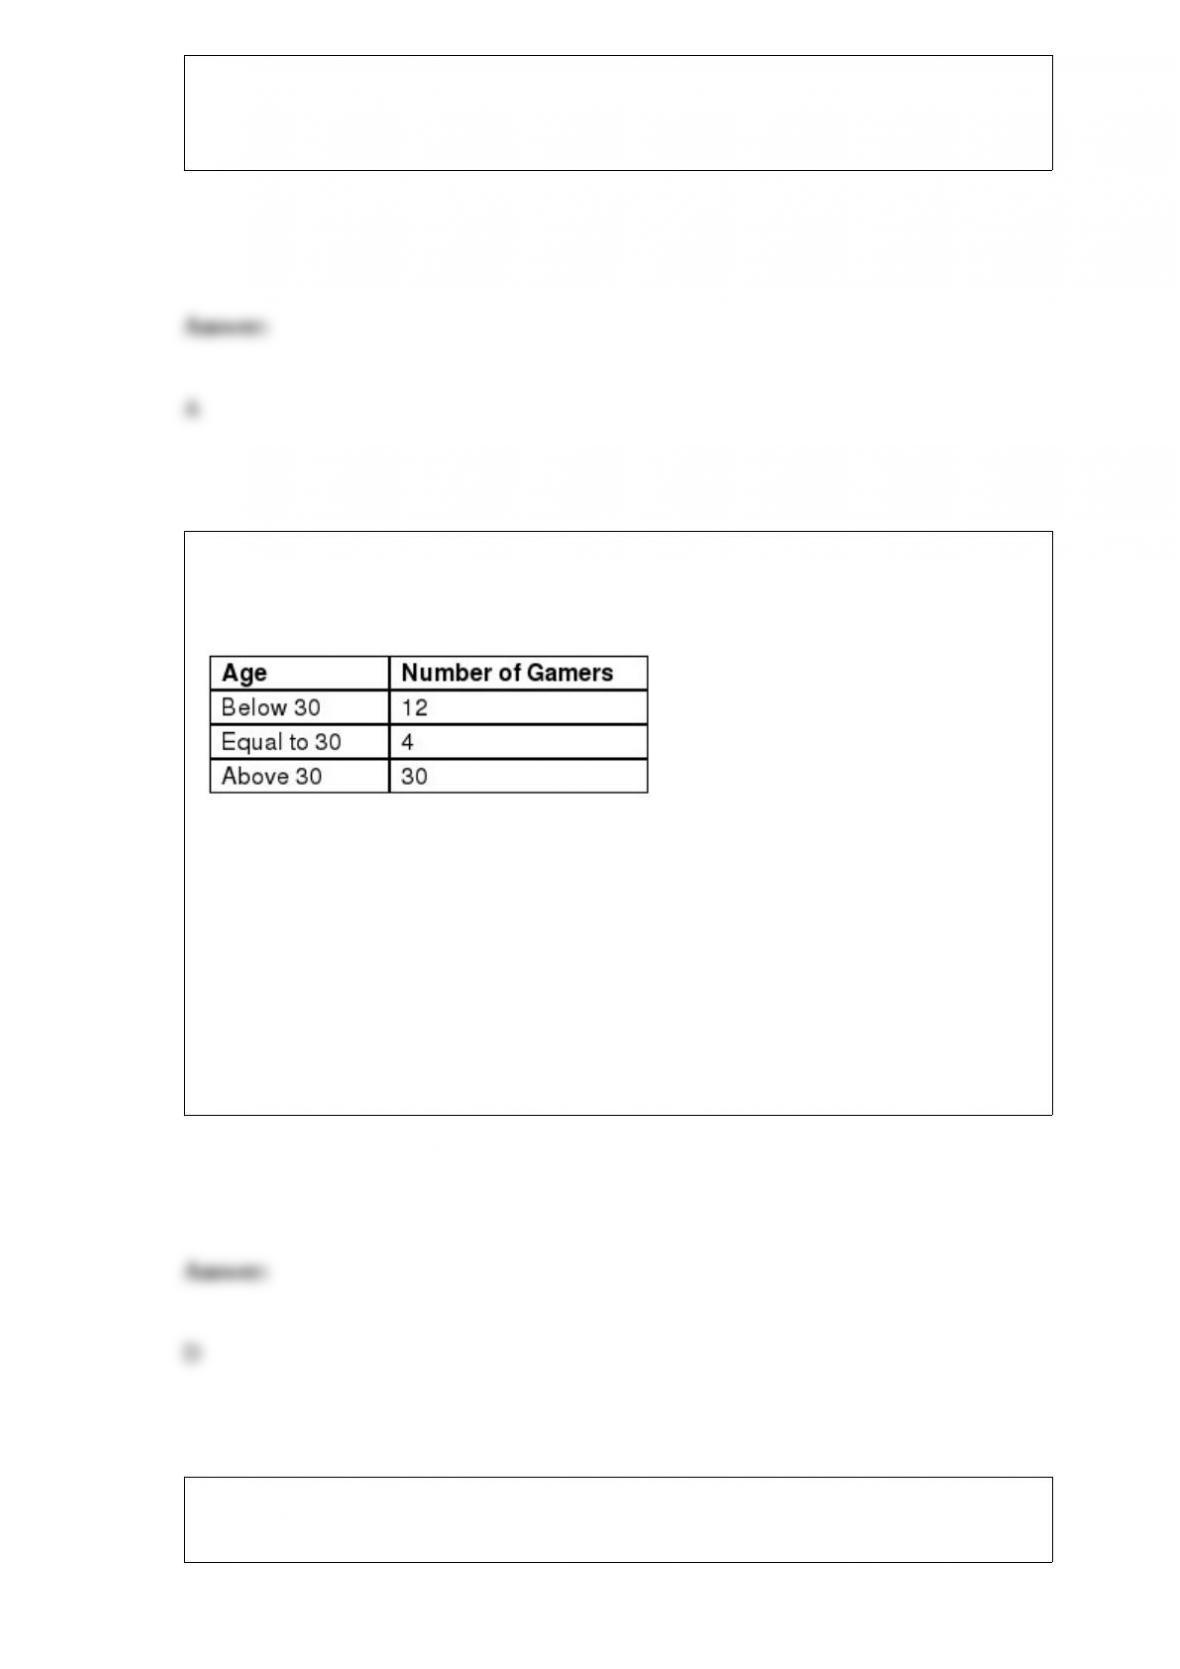
standard error of the mean for this sample is ________.
A) 0.54
B) 1.17
C) 1.56
D) 2.30
Entertainment Software Association would like to test if the median age of “gamers”
(those that routinely play video games) is more than 30 years old. The following table
summarizes the ages of a random sample of gamers.
The test statistic for this hypothesis test is ________.
A) 1.60
B) 1.89
C) 2.11
D) 2.62
The following data represent the number of sweatshirts sold for each of the past six
days for Hoys Department Store at the beach in Avalon, New Jersey.
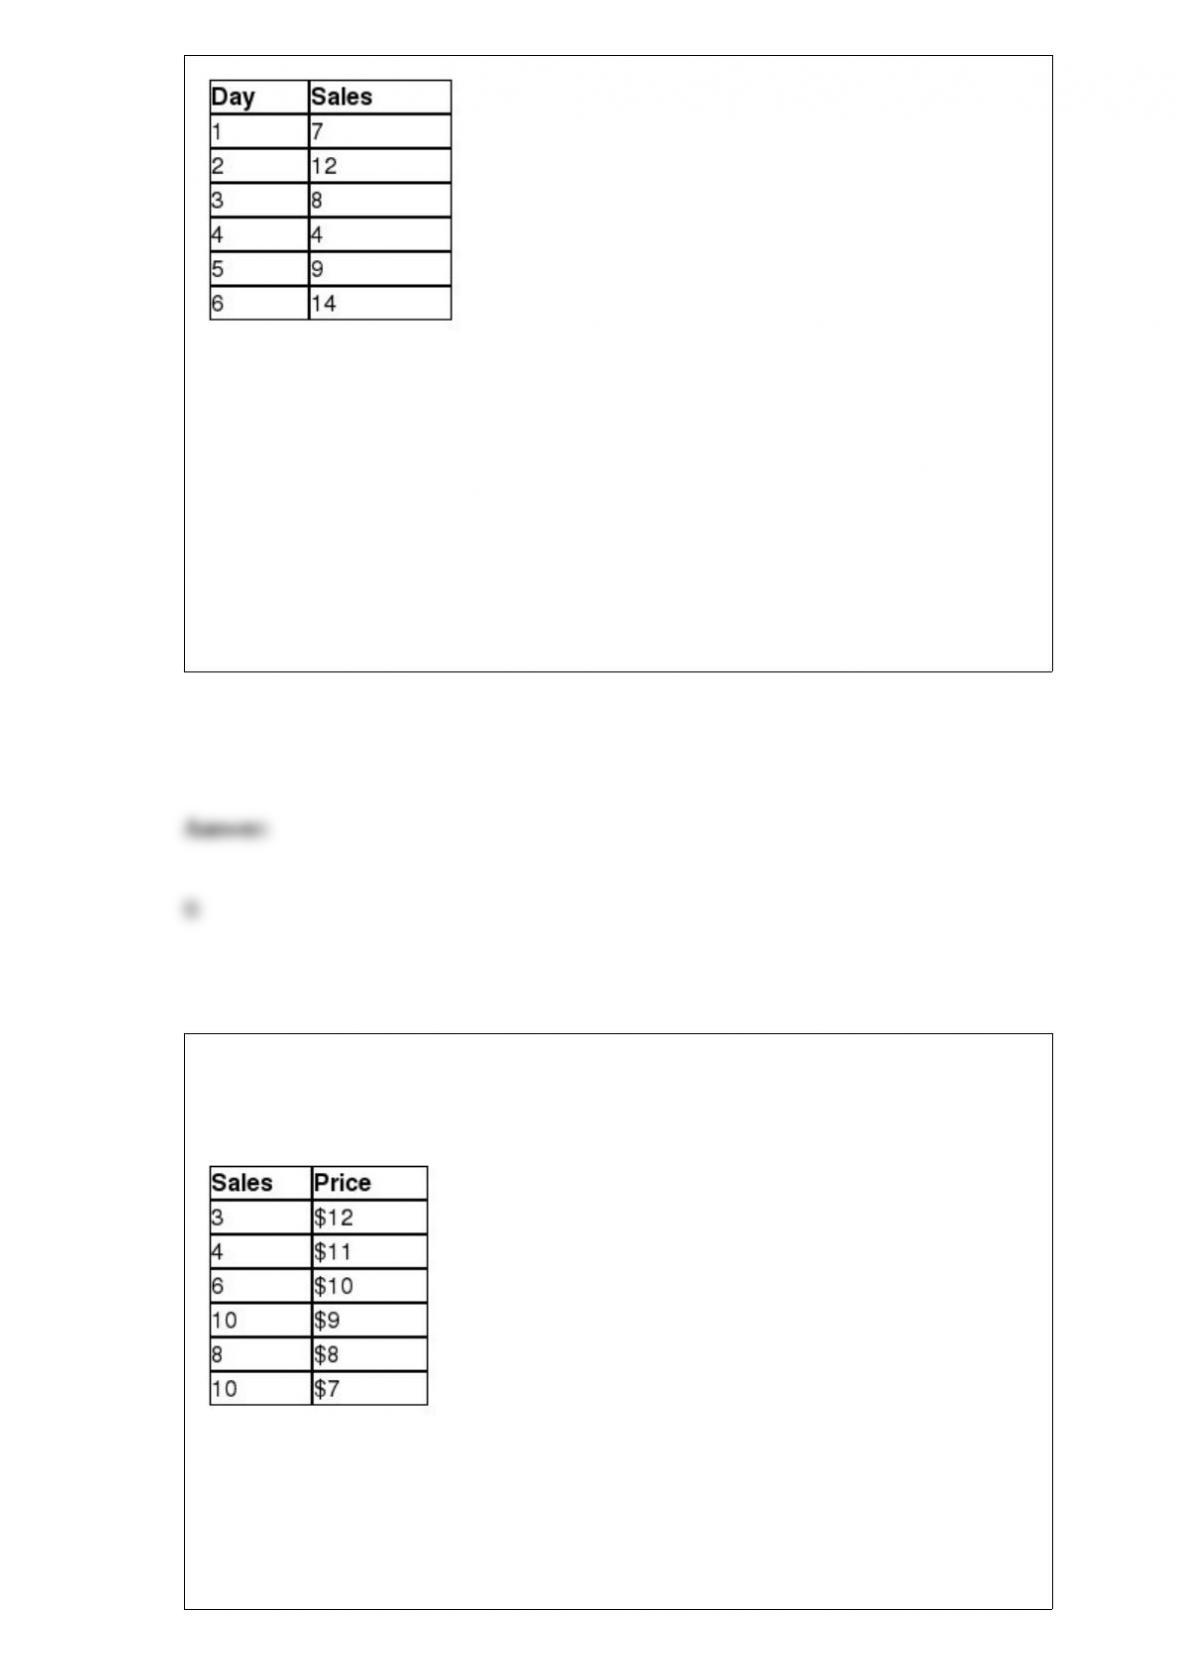
Using an exponential smoothing technique with alpha equal to 0.4, the forecasting error
for Day 4 is ________.
A) 6.0
B) -4.6
C) -7.1
D) 8.8
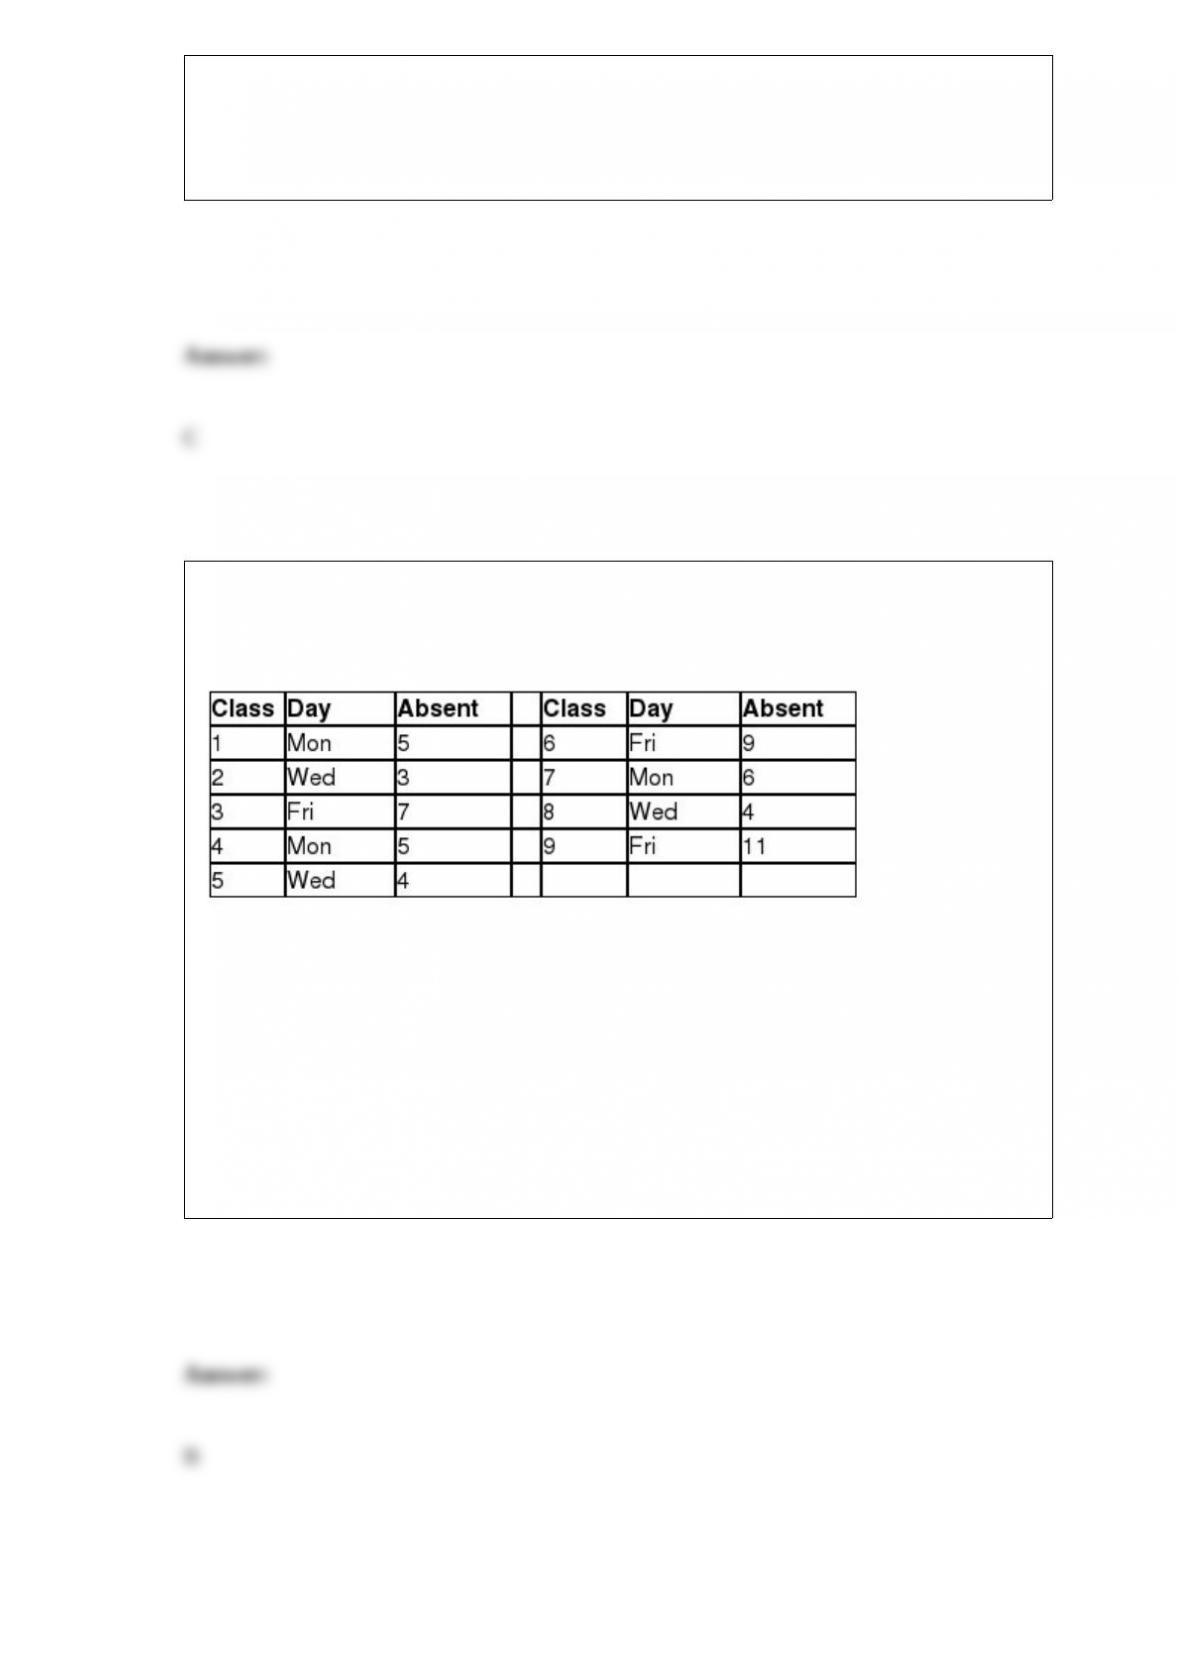
Costco sells paperback books in their retail stores and wanted to examine the
relationship between price and demand. The price of a particular novel was adjusted
each week and the weekly sales were recorded in the table below.
The correlation coefficient for this data is ________.
A) “0.402
B) “0.623
C) “0.910
D) 0.197
A large statistics class meets on Monday, Wednesday, and Friday each week during the
semester. The following data shows the number of absent students for the last nine
classes.
The ratio-to-moving-average for Class 4 is ________.
A) 0.6667
B) 0.9434
C) 1.1403
D) 1.4262
Use the information below to answer the following question(s).
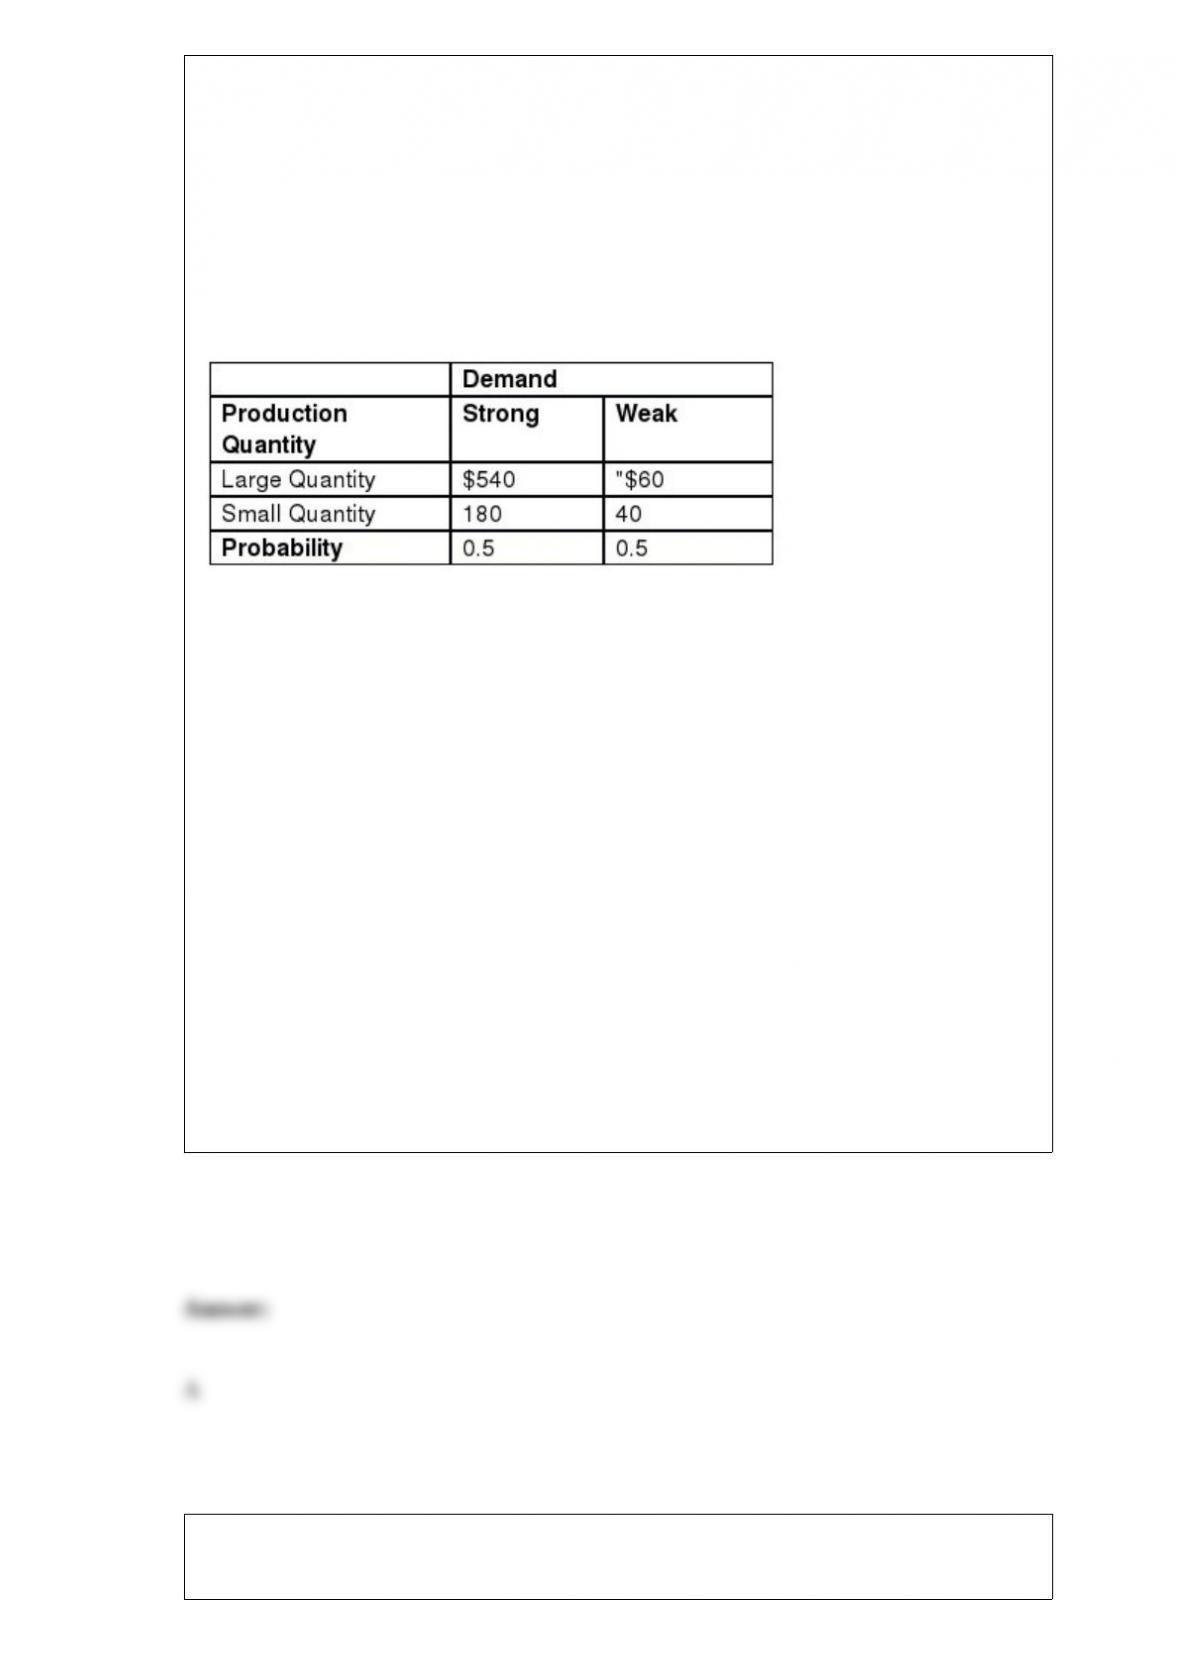
Hats-R-Us would like to produce a new design of hats for the upcoming Major league
Baseball World Series. They need to decide to produce a large quantity or small
quantity of hats prior to the event starting. Eventual demand for this new design will be
strong or weak with a 50/50 chance of each level occurring. The following table shows
the payoff for each combination of production size and demand level, in thousands of
dollars.
Hats-R-Us also has the option of conducting a market survey at a cost of $10,000 to
acquire more accurate information about the likelihood of each demand level. If the
survey results are positive, there is an 83% probability that the eventual demand for the
new hat design will be strong. If the survey results are negative, there is a 23%
probability that the eventual demand for the new hat design will be strong.
Construct a decision tree to answer the following set of questions.
The expected monetary value, in thousands of dollars, for a large production quantity if
Hats-R-Us conducts a market survey and the survey results are negative is _________.
A) $78.0
B) $161.2
C) $226.3
D) $319.5
The Department of Transportation would like to test the hypothesis that the average age
of cars on the road is less than 12 years. A random sample of 45 cars had an average age
of 10.6 years. It is believed that the population standard deviation for the age of cars is
4.1 years. The Department of Transportation would like to set α = 0.05. Which one of
the following statements is true?
A) Because the p-value is greater than α, we reject the null hypothesis and cannot
conclude that the average age of cars on the road is less than 12 years.
B) Because the p-value is greater than α, we fail to reject the null hypothesis and cannot
conclude that the average age of cars on the road is less than 12 years.
C) Because the p-value is less than α, we fail to reject the null hypothesis and conclude
that the average age of cars on the road is less than 12 years.
D) Because the p-value is less than α, we reject the null hypothesis and conclude that
the average age of cars on the road is less than 12 years.
The test statistic for the large sample case of the Wilcoxon rank-sum test can be
approximated by the _____________ probability distribution.
A) binomial
B) Student’s t
C) chi-square
D) normal
The first quartile represents the ________ percentile of the data set.
A) 10th
B) 25th
C) 50th
D) 75th
Assume that the amount of time that it takes an employee to service a car at an oil
change facility follows the uniform probability distribution between 21 and 38 minutes.
What is the probability that a randomly selected car will require more than 30 minutes
to service?
A) 0.1687
B) 0.2244
C) 0.3720
D) 0.4706
The ________ probability distribution is bell-shaped and symmetrical.
A) Poisson
B) normal
C) exponential
D) uniform
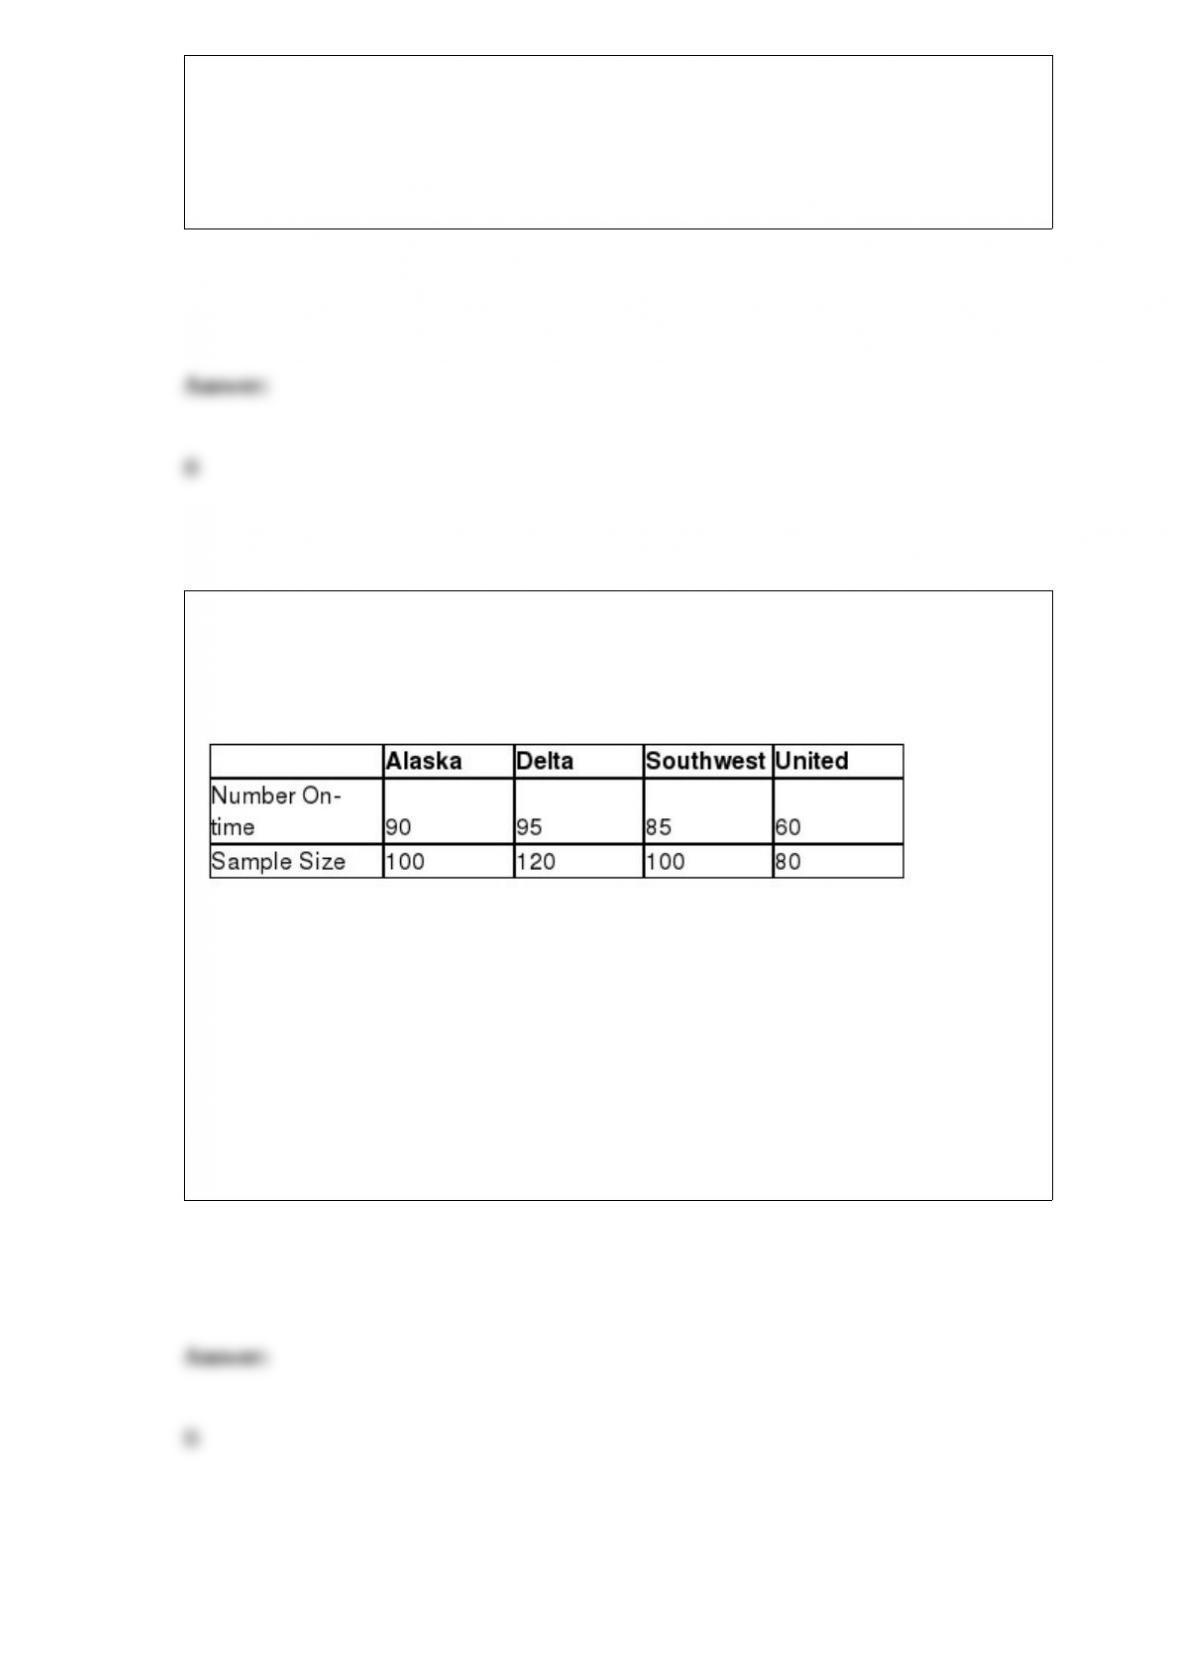
The Department of Transportation would like to investigate if a difference exists in the
proportion of flights that arrive on-time between Alaska Airlines, Delta Airlines,
Southwest Airlines, and United Airlines. The following data represent the number of
on-time flights from random samples taken from each airline.
The expected frequency of on-time flights from the Southwest sample is ________.
A) 66
B) 82.5
C) 90
D) 99
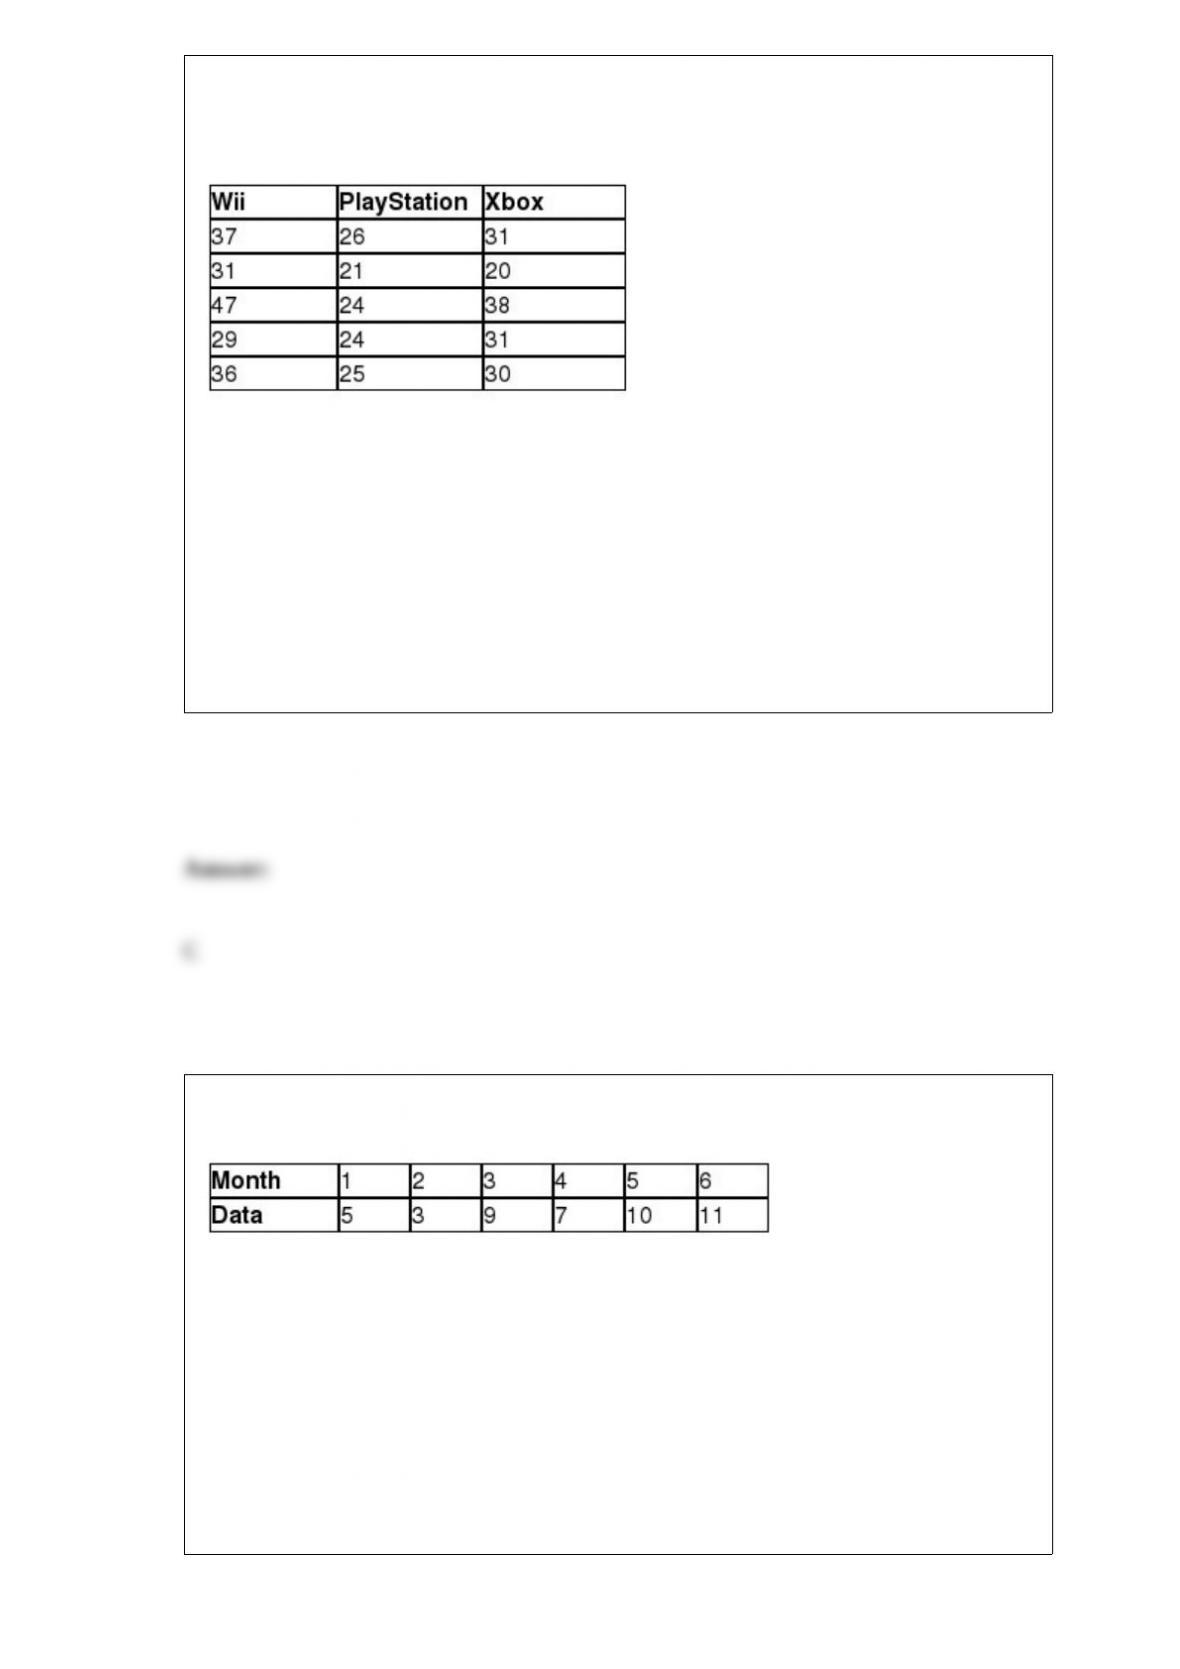
Nintendo Sony would like to test the hypothesis that a difference exists in the average
age of users of a Wii, a PlayStation or an Xbox console game. The following data
represent the age of a random sample of Wii, PlayStation, and Xbox users.
The critical value for the Tukey-Kramer critical range using α = 0.05 is ________.
A) 3.08
B) 3.11
C) 3.77
D) 3.83
The following table displays the amount of data that Steve has used each month, in GB,
with his iPhone during the past six months.
The mean absolute deviation using trend projection is ________.
A) 0.89
B) 1.20
C) 2.74
D) 3.15

According to LIMRA, 77% of husband-wife families with kids under 18 years old have
life insurance. A random sample of six husband-wife families was selected. What is the
mean of this distribution?
A) 3.50
B) 4.62
C) 5.28
D) 5.86
________ forecasting is a subjective technique that relies primarily on a knowledgeable
person’s intuition and judgment to predict future events.
A) Quantitative
B) Time series
C) Qualitative
D) Exponential

Measures of variability show how much spread is in your data.
Progressive Insurance would like to test the hypothesis that a difference exists in the
proportion of students in 12th grade who text while driving when compared to the
proportion of 11th grade drivers who text. A random sample of 160 12th grade students
found that 84 texted while driving. A random sample of 175 11th grade students found
that 70 texted while driving. If Population 1 is defined as 12th grade drivers and
Population 2 is defined as 11th grade drivers, the 95% confidence interval for the
difference in population proportions is ________.
A) (0.103, 0.147)
B) (0.018, 0.231)
C) (“0.037, 0.287)
D) (“0.119, 0.369)
AT&T would like to investigate if brand of smartphone and income level are
independent variables. The following contingency table shows the number of customers
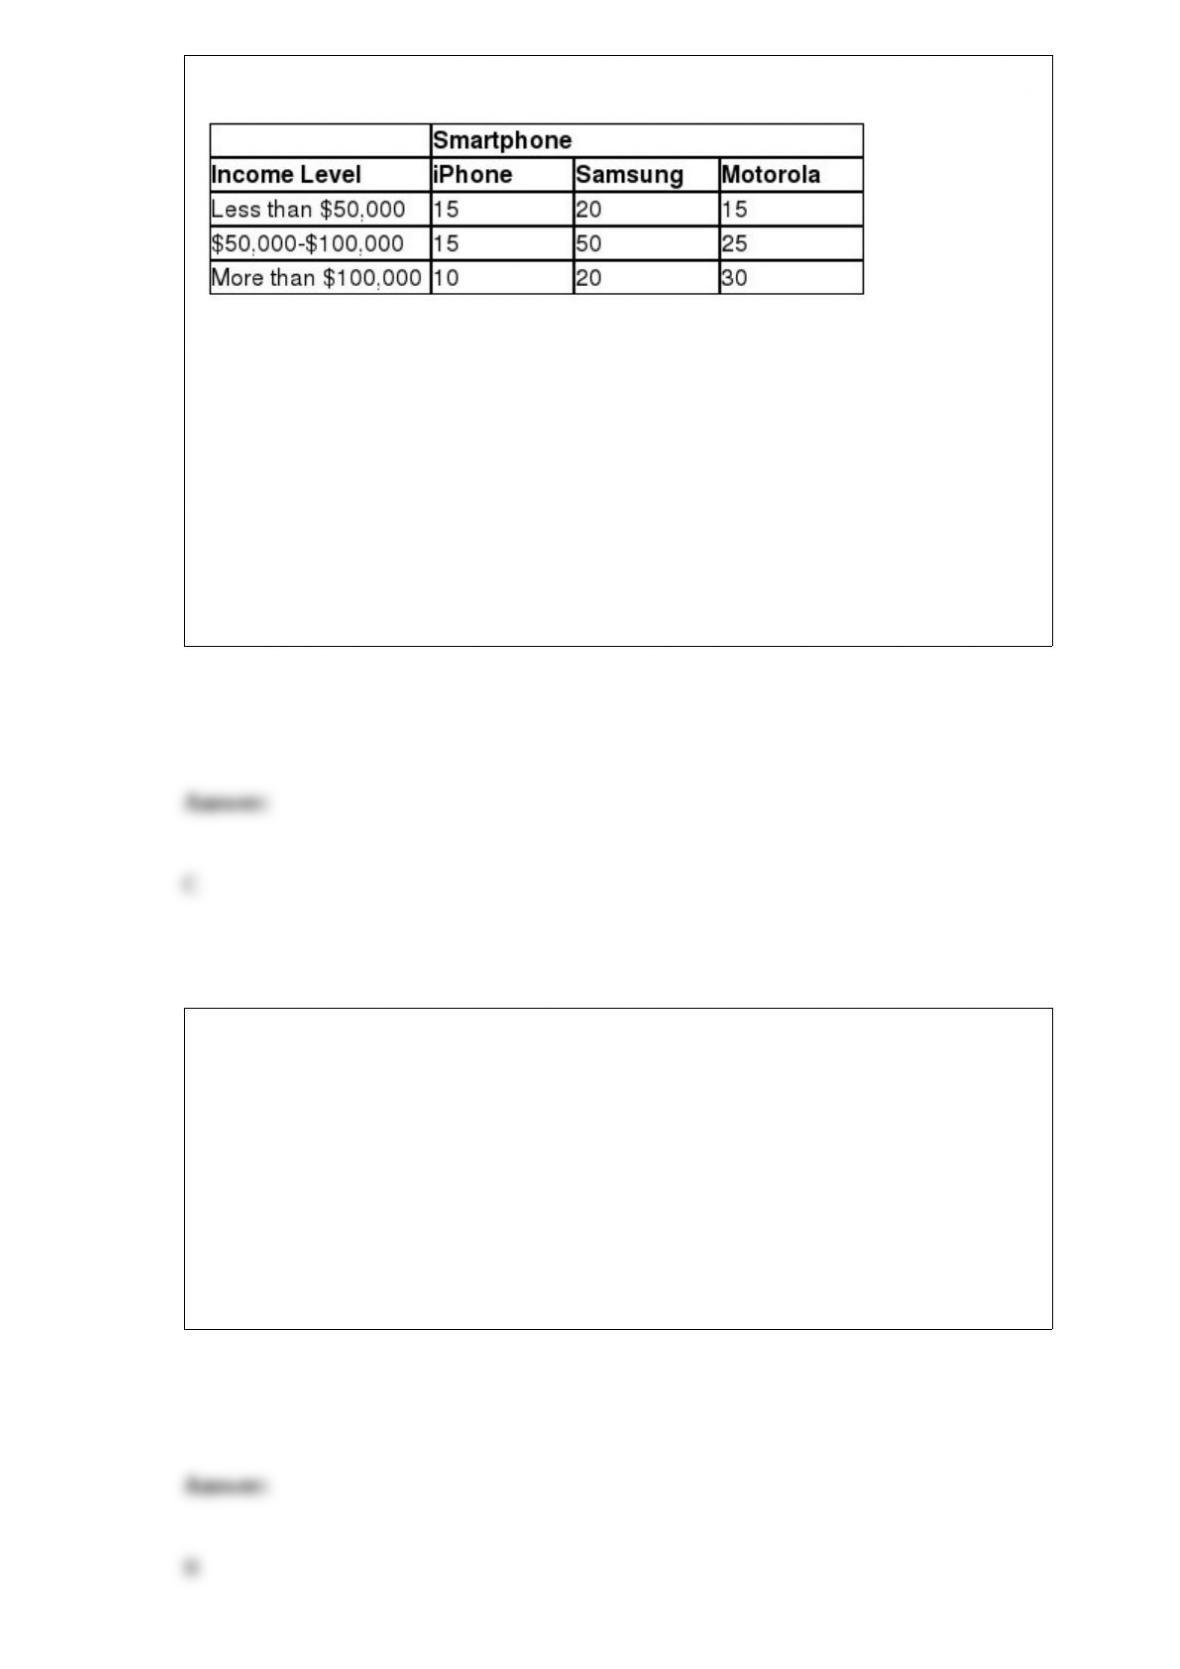
who own three brands of smartphones along with their income level.
The expected number of customers who own Motorola smartphone and earn less than
$50,000 is ________.
A) 12.0
B) 18.0
C) 17.5
D) 40.5
________ ANOVA relies on matched samples in a similar way to the matched-pairs
hypothesis testing that compares two population means.
A) One-way
B) Randomized block
C) Two-way
D) Three-way
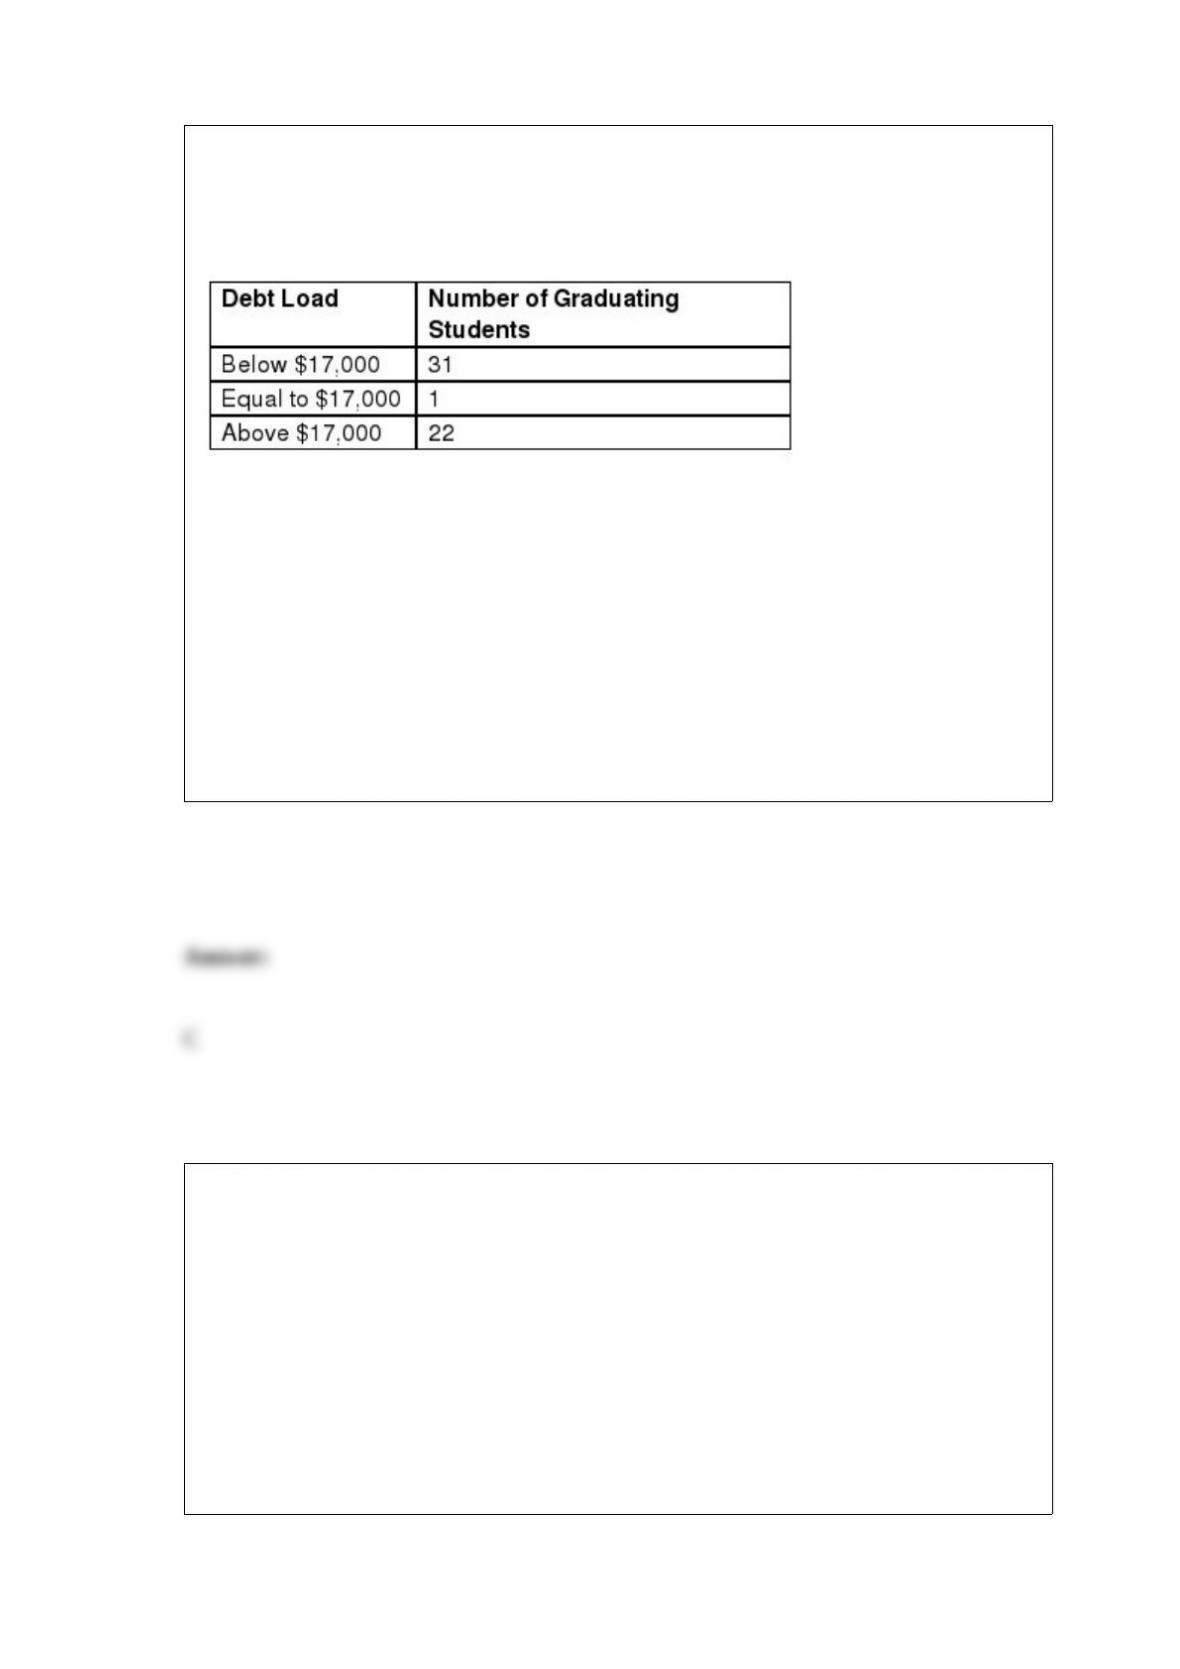
The Department of Education would like to test the hypothesis that the median debt
load of graduating students with a Bachelor’s degree is equal to $17,000. The following
table summarizes the debt load of a random sample of graduating students with a
Bachelor’s degree.
The standard deviation for the sampling distribution for this hypothesis test is
________.
A) 2.875
B) 3.056
C) 3.640
D) 4.217
A discrete random variable that follows the Poisson distribution with a mean equal to λ
has a counterpart continuous random variable that follows the ________ distribution
with a mean equal to μ = 1/λ.
A) exponential
B) normal
C) uniform
D) discrete
The test statistics for one-way ANOVA follows the _______________________.
A) normal distribution
B) Student ‘s t-distribution
C) binomial distribution
D) F-distribution
Use the information below to answer the following question(s).
The following decision tree is partially completed for a company that is deciding to
build a large or small facility for a new product that will face demand that is strong or
weak. The company has an option to perform a market survey that will cost $4,000 that
will predict a strong or weak market. The payoffs for each combination of facility size
and demand are also shown.
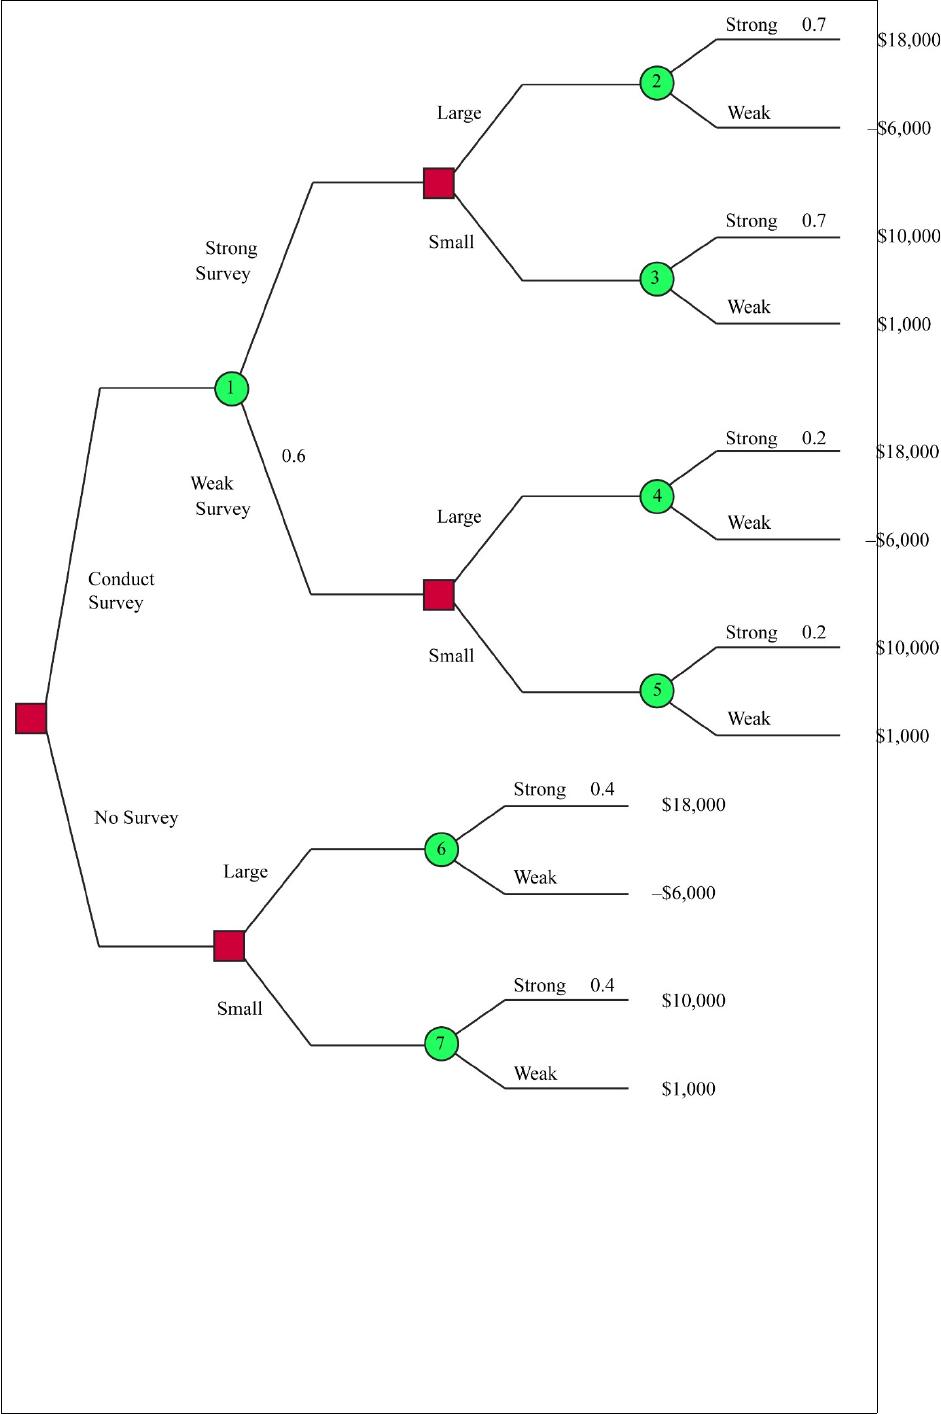
The expected value without sample information, in thousands of dollars is _________.
A) $3,700
B) $4,000
C) $4,600
D) $5,300
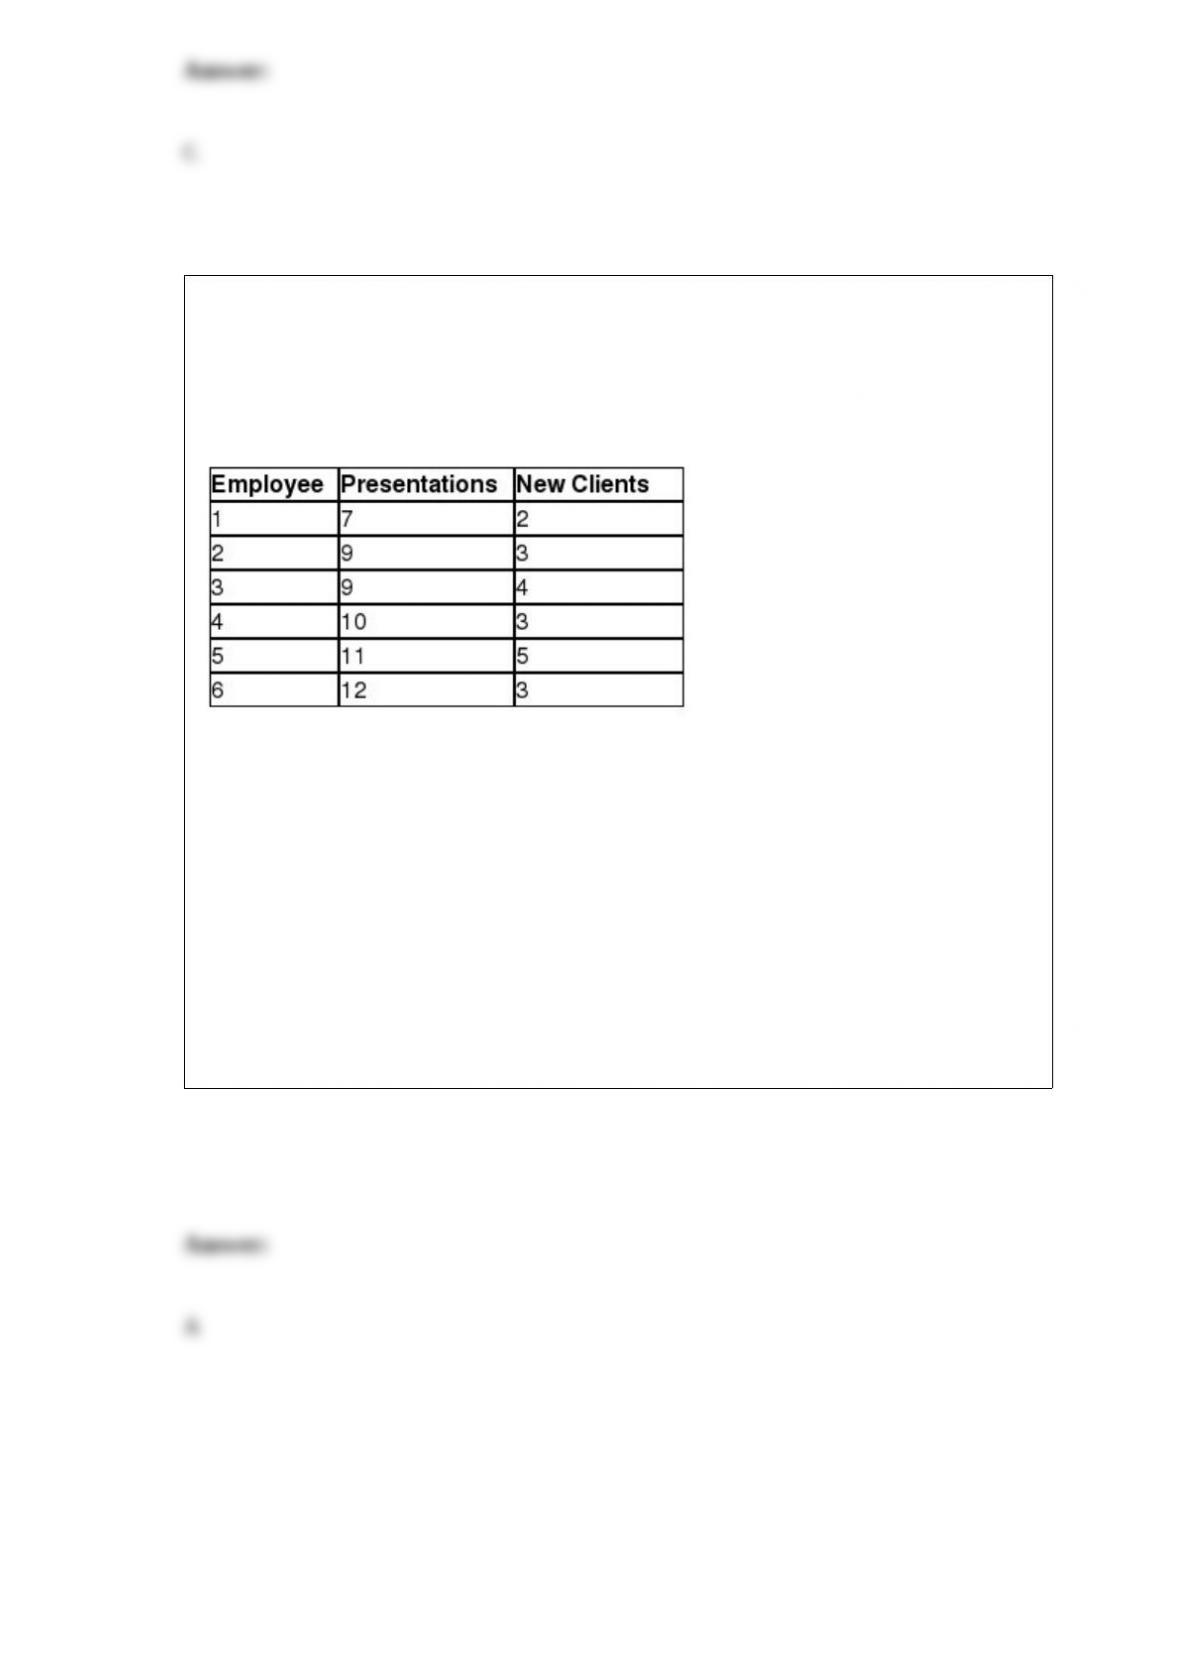
Sarah is the office manager for a group of financial advisors who provide financial
services for individual clients. She would like to investigate whether a relationship
exists between the number of presentations made to prospective clients in a month and
the number of new clients per month. The following table shows the number of
presentations and corresponding new clients for a random sample of six employees.
Sarah would like to use simple regression analysis to estimate the number of new
clients per month based on the number of presentations made by the employee per
month. The y-intercept for the regression equation is ________.
A) 0.3913
B) 2.4510
C) 4.9825
D) 6.7500