
If the MPC is 0.5, then a $10 million increase in disposable income will increase
consumption by
A) $2 million.
B) $5 million.
C) $15 million
D) $50 million.
According to the World Bank, in 2006, China’s GDP was approximately $2.7 trillion (or
$2,700 billion). That same year, India’s GDP was approximately $906.3 billion. With
which of the following populations would China’s standard of living have been
considered higher than India’s that year?
A) China’s population = 1.3 billion; India’s population = 1.1 billion
B) China’s population = 8.3 billion; India’s population = 1.1 billion
C) China’s population = 500 million; India’s population = 125 million
D) China’s population = 3.5 billion; India’s population = 1.1 billion
The willingness of consumers to buy a product at different prices is shown on a
A) demand curve.
B) supply curve.

C) production possibilities frontier.
D) marginal cost curve.
Which of the following individuals would be most negatively affected by anticipated
inflation?
A) a retired railroad engineer who receives a fixed income payment every month
B) a union contractor whose pay is adjusted based on changes in the CPI
C) a full-time employee at a pizza parlor who makes more than the minimum wage
D) a student who borrows $10,000 at a nominal interest rate of 5% to finance
educational expenses
The economic growth model predicts that ________ across countries will converge
over time.
A) income levels
B) GDP per capita
C) foreign direct investment rates
D) growth rates
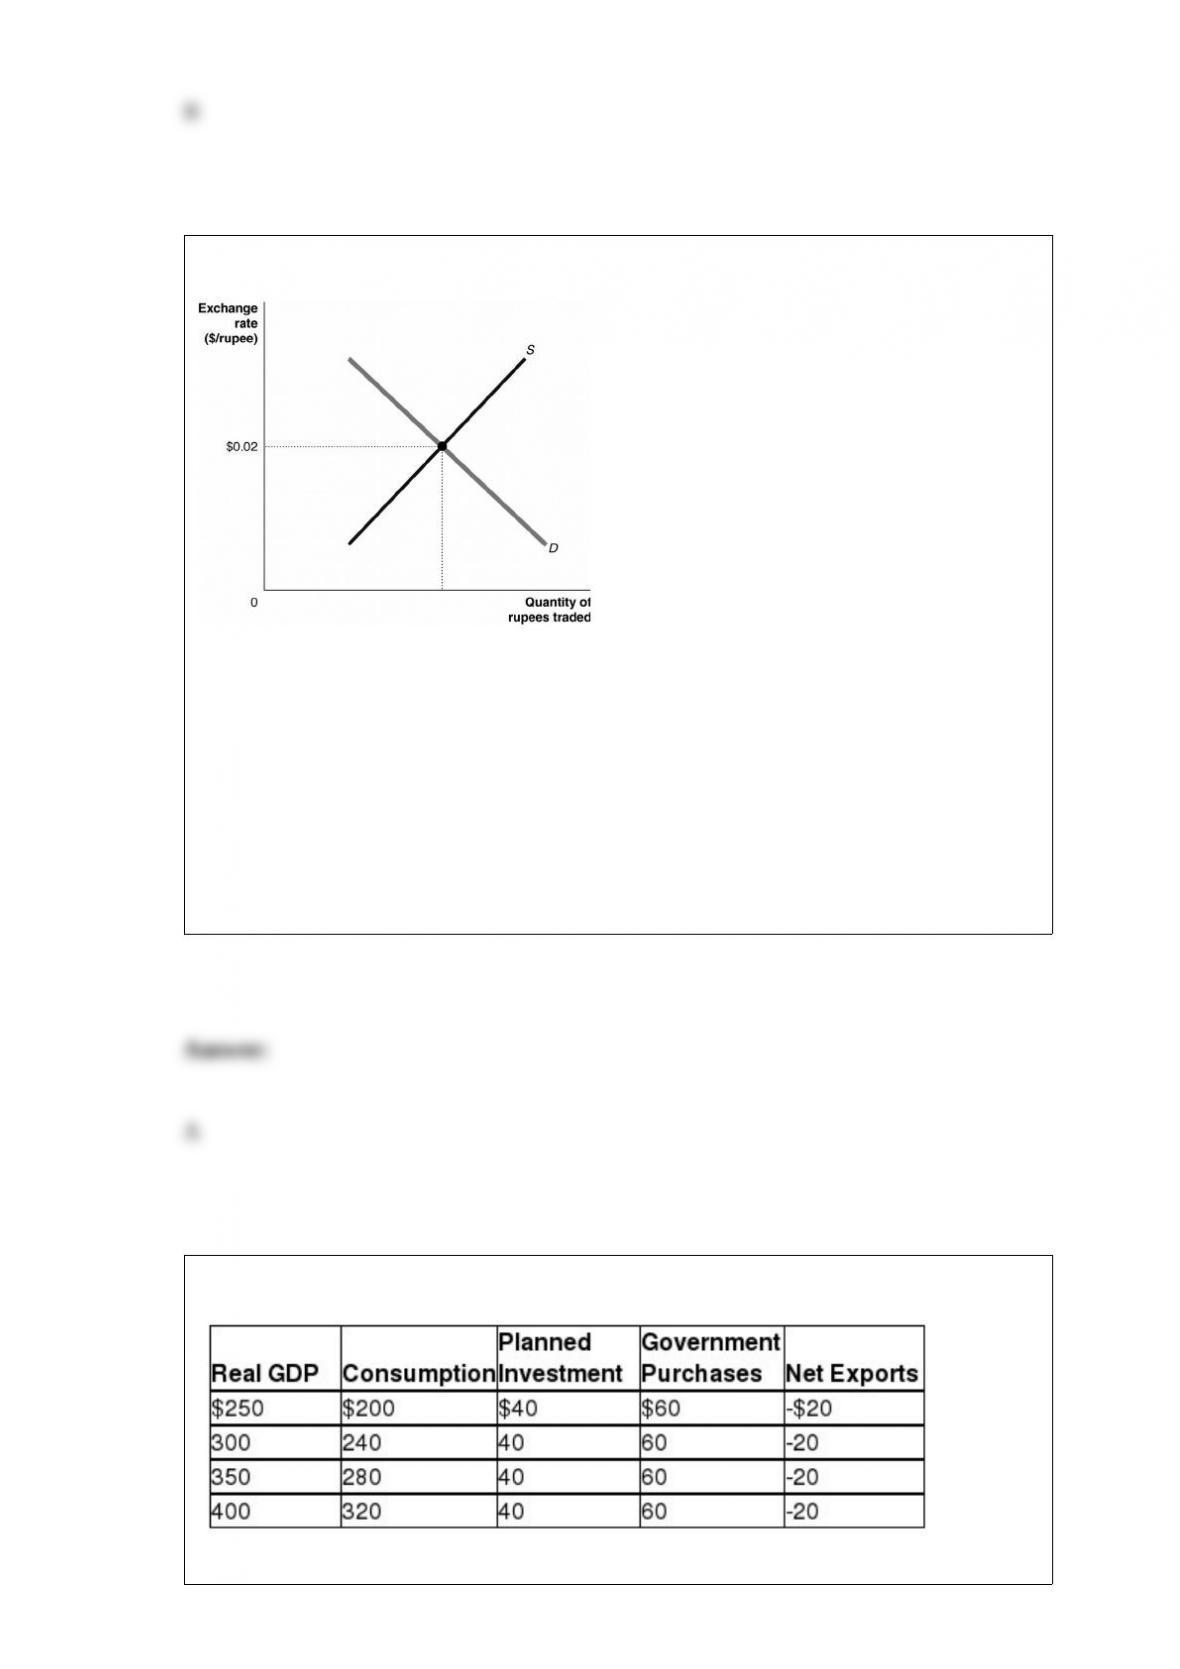
Figure 19-7
Refer to Figure 19-7. At what level should the Indian government peg its currency to
the dollar to make U.S. imports cheaper in India?
A) greater than $.02/rupee
B) less than $.02/rupee
C) equal to $.02/rupee
D) $1/rupee
Table 12-15
Refer to Table 12-15. Using the table above, answer the following questions. The
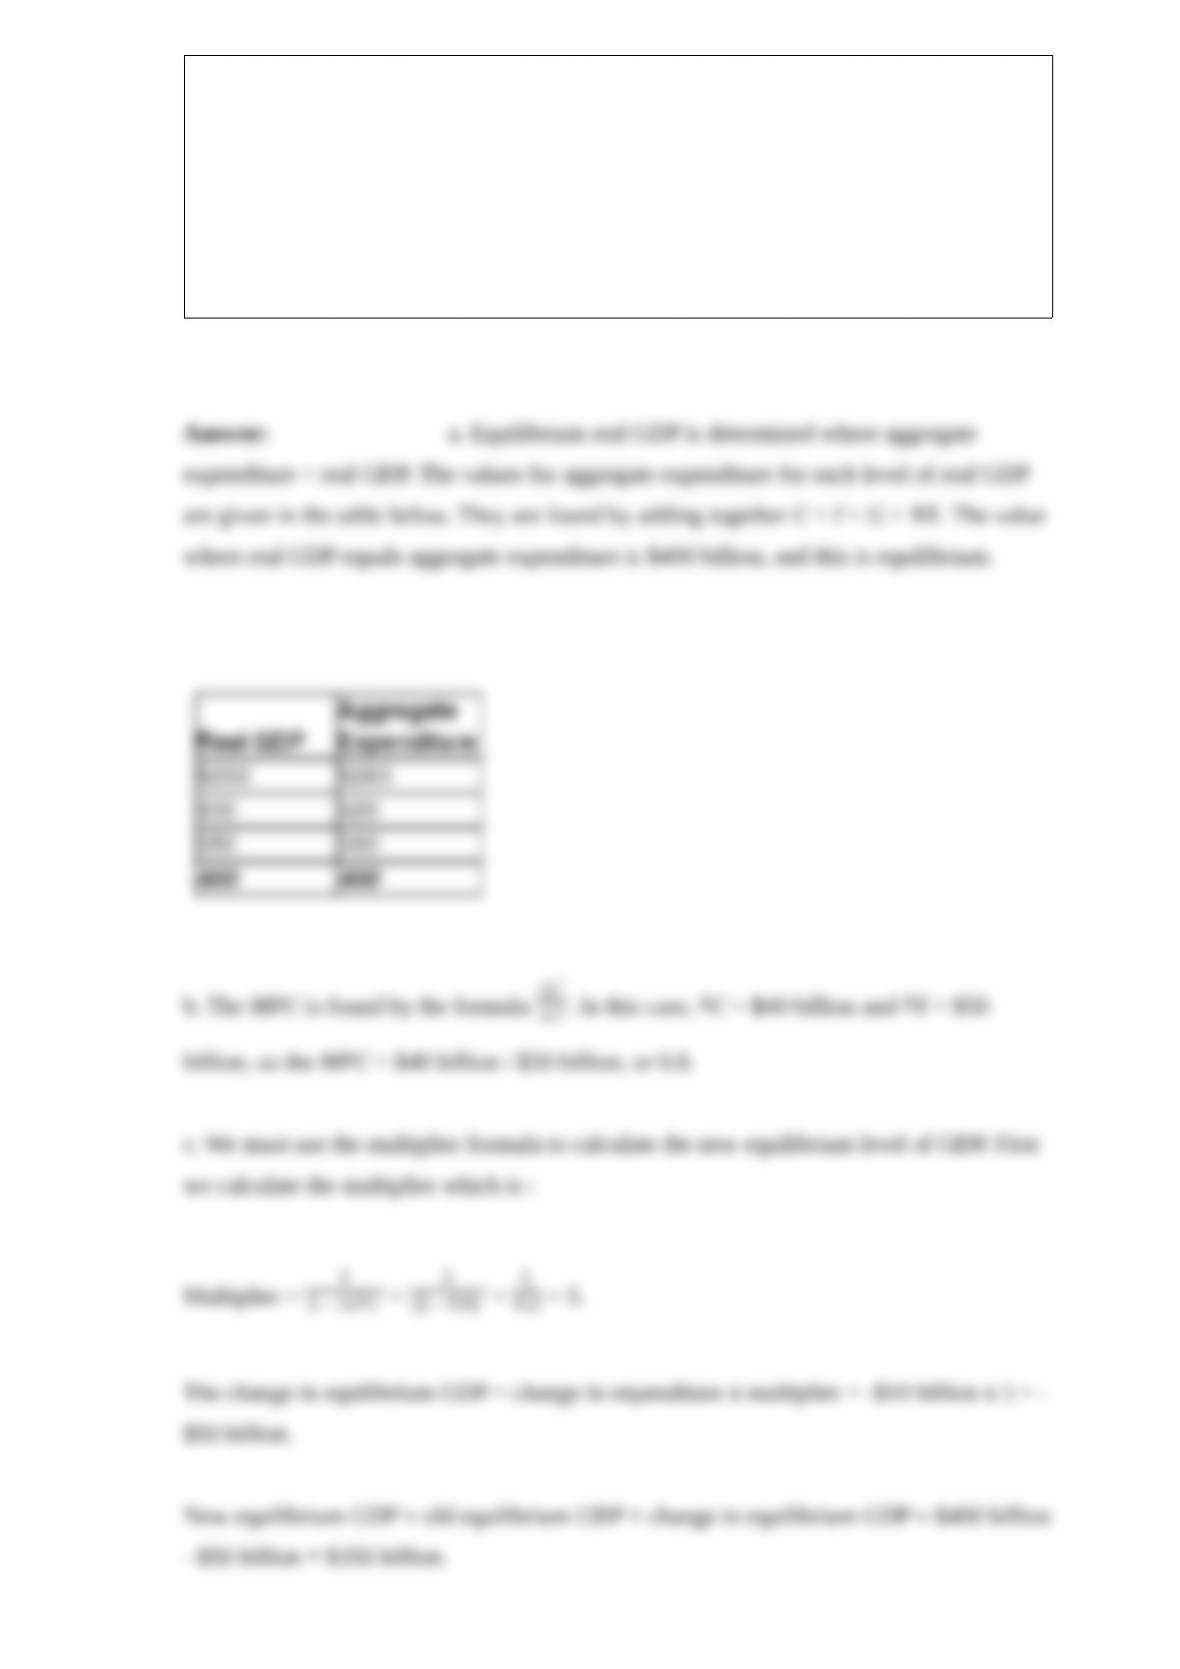
numbers in the table are in billions of dollars.
a. What is the equilibrium level of real GDP?
b. What is the MPC?
c. If investment spending declines by $10 billion, what will happen to equilibrium
GDP?

“Because Coke and Pepsi are substitutes, a decrease in the price of Pepsi will cause the
demand for Coke to decrease. This initial shift in demand for Coke results in a lower
price for Coke; this lower price will cause the demand curve for Coke to shift to the
left.” Which of the following correctly comments on this statement?
A) The statement will be true if consumer tastes for Coke and Pepsi do not change.
B) The statement is false because a change in the price of Coke would not change the
demand for Coke.
C) The statement is false because Pepsi is an inferior good; Coke is a normal good.
D) The statement is false because one cannot assume that Coke and Pepsi are
substitutes for all consumers.
What two measures of macroeconomic activity are often referred to as the “twin
deficits”?
A) net capital flows and net exports
B) the foreign exchange deficit and net foreign investment
C) the budget deficit and the trade balance
D) the saving-investment deficit and the export deficit
The natural rate of unemployment equals

A) the rate of structural unemployment.
B) structural plus frictional unemployment.
C) structural plus frictional plus cyclical unemployment.
D) the rate of unemployment we observe in any given period of measurement.
An increase in capital inflows will
A) increase net foreign investment.
B) increase capital outflows.
C) decrease capital outflows.
D) increase the value of the domestic currency.
Which of the following is not a tool the Fed uses to manage the money supply?
A) open market operations
B) setting the discount rate
C) expanding and contracting deposit insurance
D) setting reserve requirements for deposits in the banking system

If national income increases by $20 million and consumption increases by $5 million,
the marginal propensity to consume is
A) 4.
B) 0.75.
C) 0.5.
D) 0.25.
When unemployment is above its natural rate, the inflation rate will eventually
A) increase.
B) decrease.
C) move to its natural rate.
D) become equal to the natural rate of unemployment.
Table 8-29
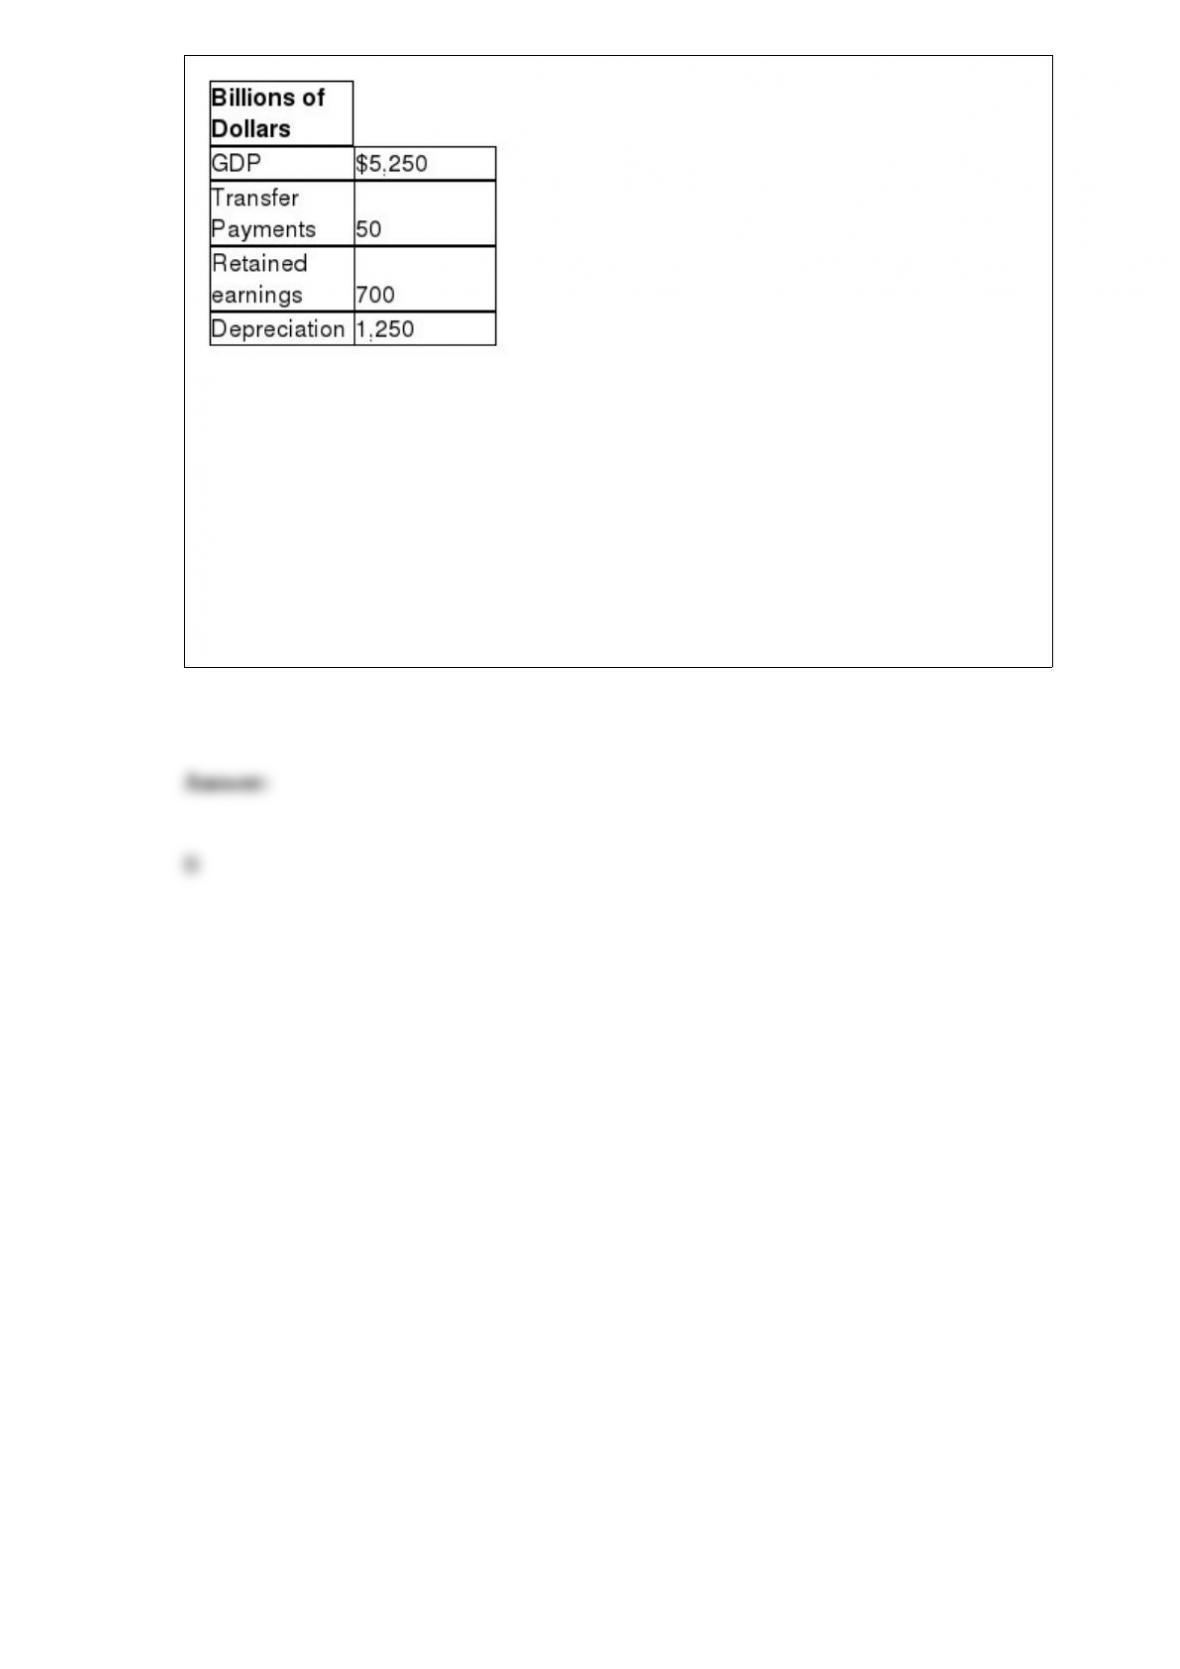
Refer to Table 8-29. Based on the table above, what is national income for this
economy?
A) $4,700 billion
B) $4,000 billion
C) $3,150 billion
D) $2,450 billion