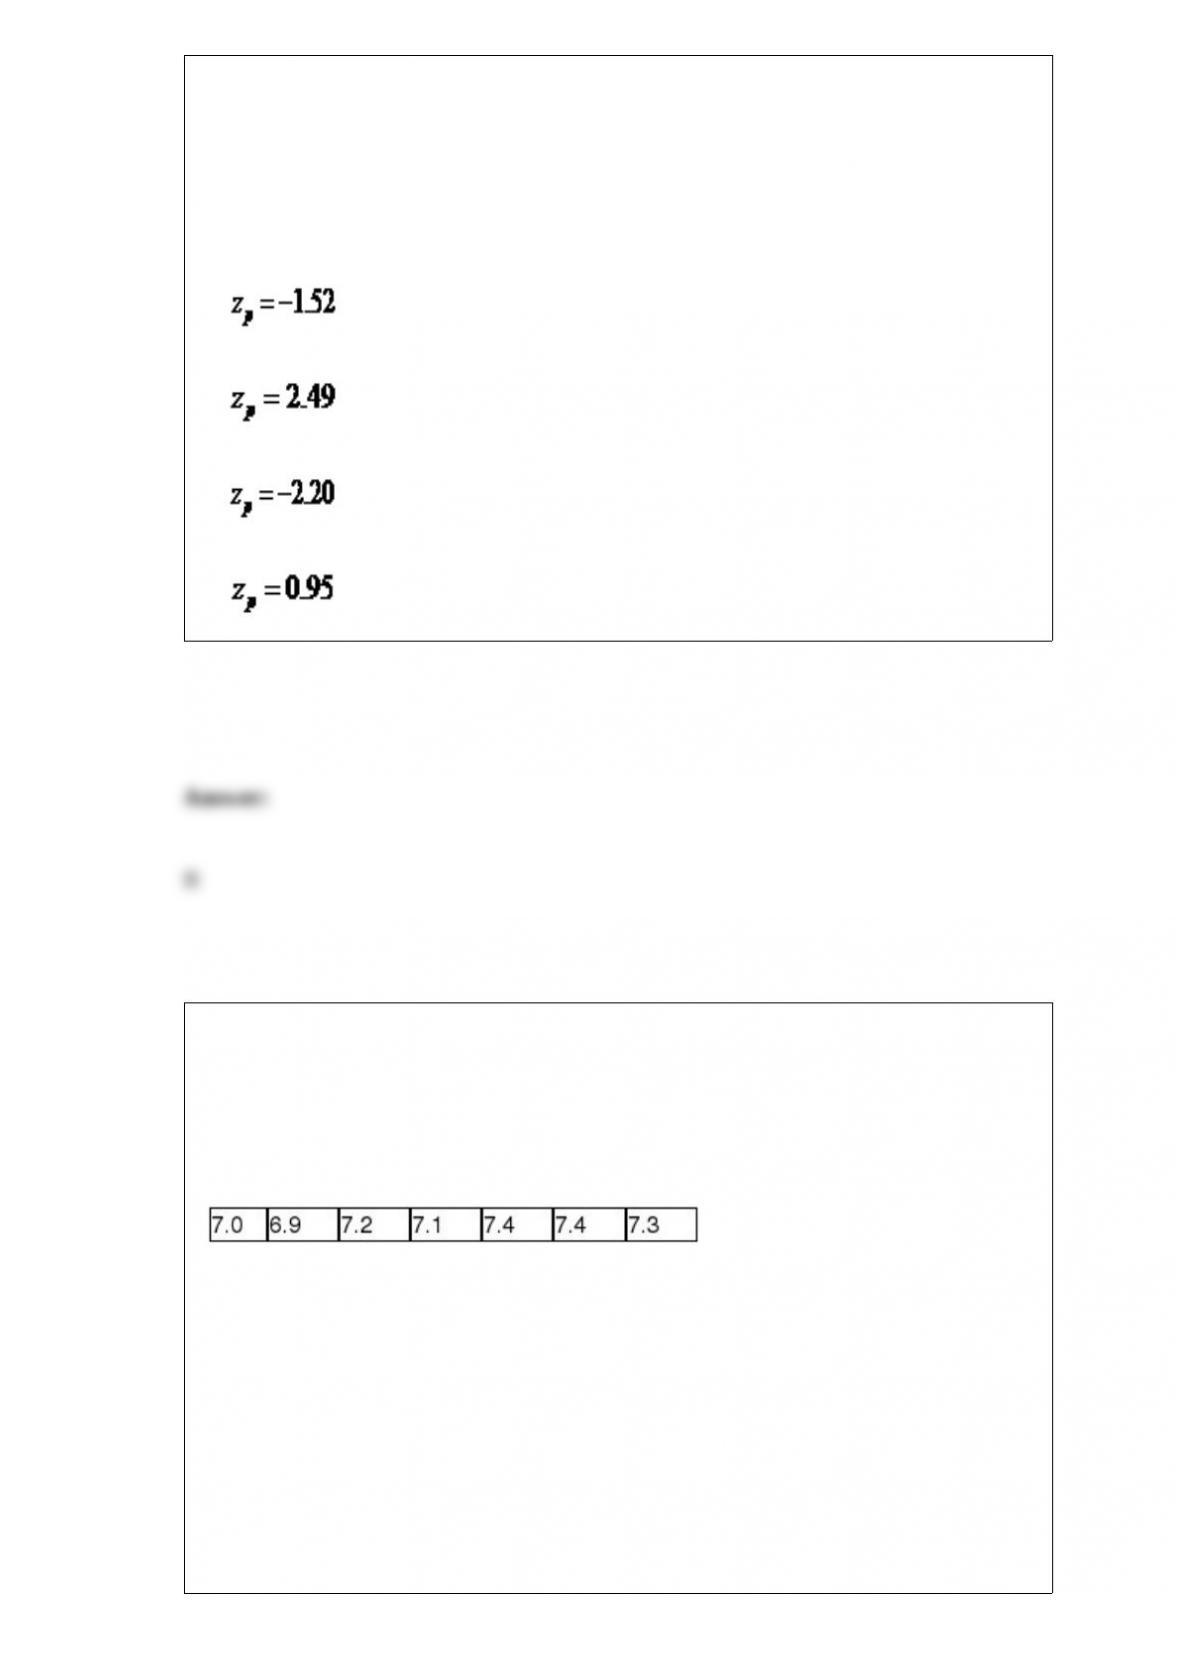
The Centers for Disease Control (CDC) would like to test the hypothesis that the
proportion of obese adults in the U.S. has increased this year when compared to last
year. A random sample of 125 adults this year found that 56 were obese. Last year, a
random sample of 140 adults found that 42 were obese. If Population 1 is defined as
this year and Population 2 is defined as last year, the test statistic for this hypothesis test
would be ________.
A)
B)
C)
D)
The pH scale measures the amount of alkalinity or acidity in a liquid and ranges from
0-14. The ideal pH for a swimming pool is 7.2. A pH that is too high or low can cause
discomfort for the swimmers, especially in the eyes. High variability in the pH readings
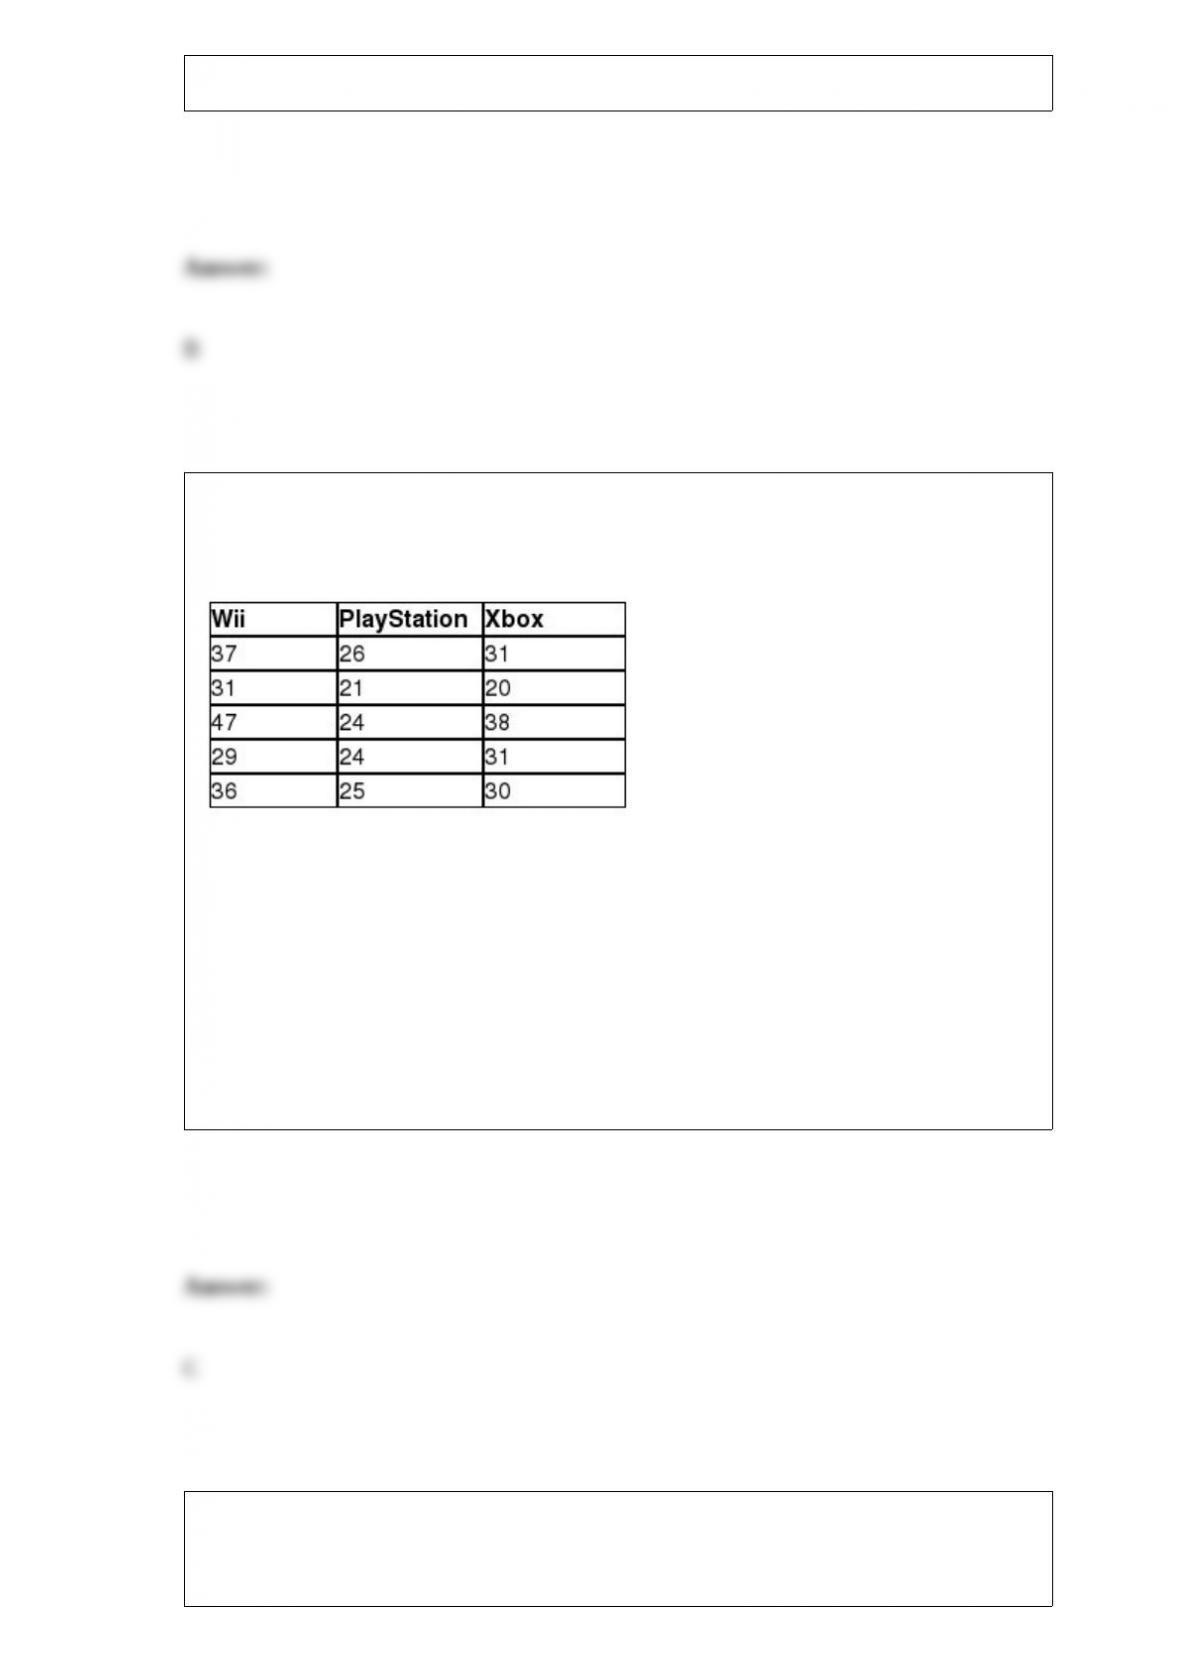
across the swimming pool can be problematic. The following data shows seven pH
readings that were taken at the Wilson Community Pool from different locations at 10
a.m. this morning.
The pool management would like to test the hypothesis that the standard deviation of
the pH readings across the pool is less than 0.40. The test statistic for this hypothesis
test would be ________.
A) 1.11
B) 1.43
C) 2.06
D) 2.69
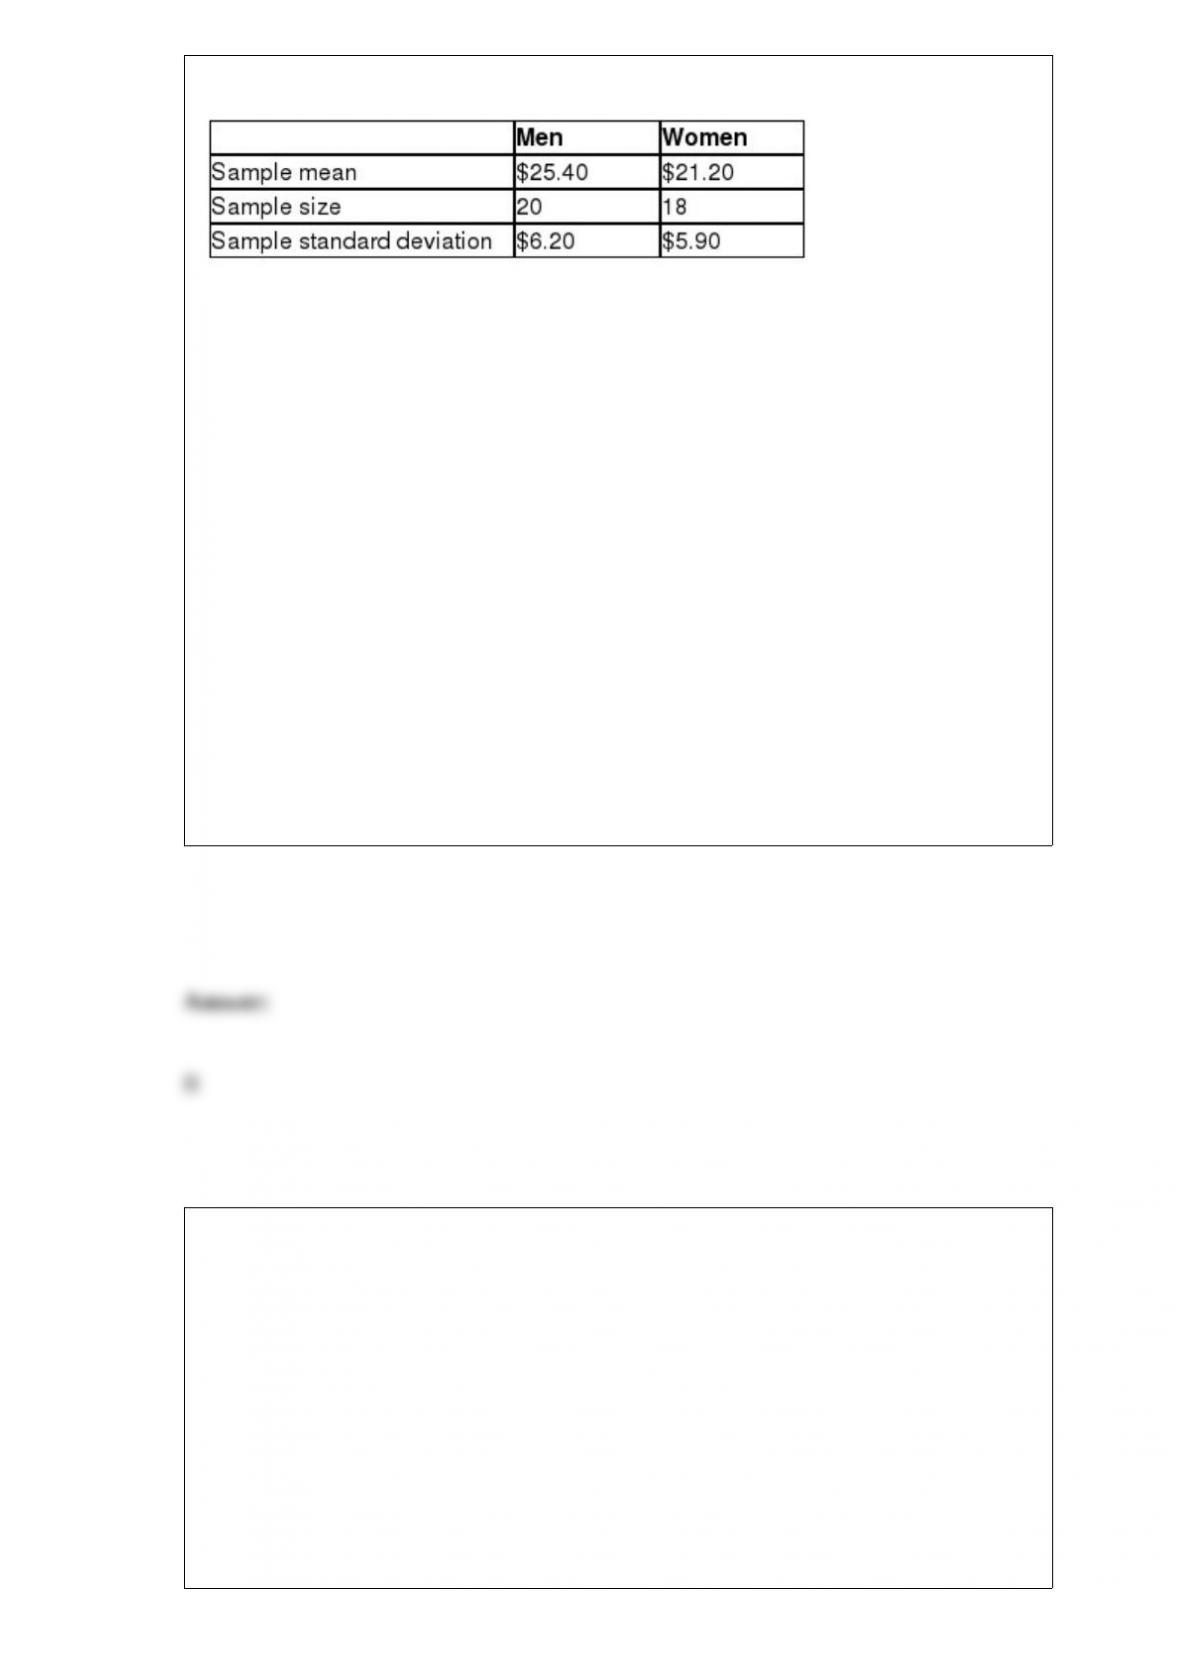
Nintendo Sony would like to test the hypothesis that a difference exists in the average
age of users of a Wii, a PlayStation, or an Xbox console game. The following data
represent the age of a random sample of Wii, PlayStation, and Xbox users.
The mean square between for these observations is ________.
A) 92.4
B) 137.0
C) 180.0
D) 244.7
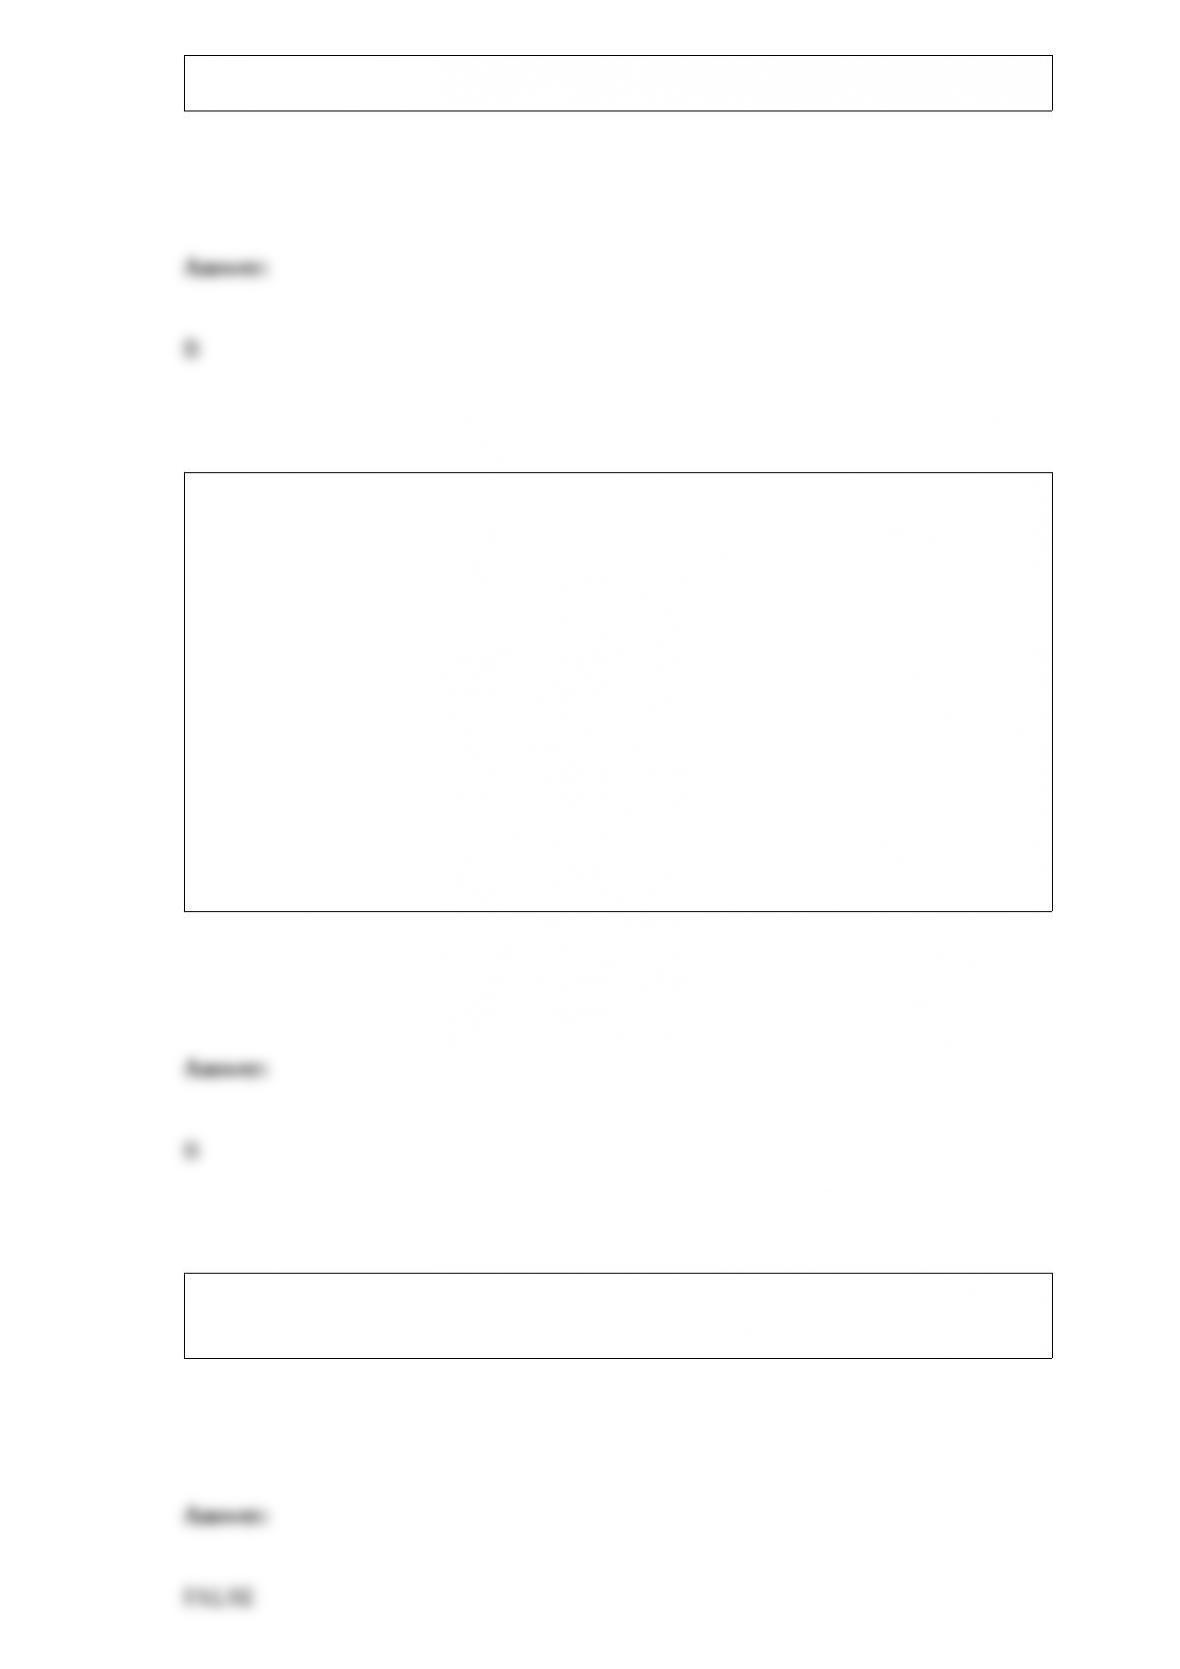
The Canadian government would like to test the hypothesis that the average hourly
wage for men is more than $2.00 higher than the average hourly wage for women. The
following data summarizes the sample statistics for hourly wages for men and women.
Assume that the population variances are equal.
If Population 1 is defined as men and Population 2 is defined as women, and using α =
0.025, which one of the following statements is true?
A) Because the p-value is greater than α, the Canadian government can conclude that
the average hourly wage for men is more than $2.00 higher than the average hourly
wage for women.
B) Because the p-value is greater than α, the Canadian government cannot conclude that
the average hourly wage for men is more than $2.00 higher than the average hourly
wage for women.
C) Because the p-value is less than α, the Canadian government cannot conclude that
the average hourly wage for men is more than $2.00 higher than the average hourly
wage for women.
D) Because the p-value is less than α, the Canadian government can conclude that the
average hourly wage for men is more than $2.00 higher than the average hourly wage
for women.
Deanna has been hired to visit the local shopping mall to conduct a survey about the
upcoming political election. She needs to select respondents at the mall and ask them
questions about their voting tendencies. Deanna decides to walk around the mall and
select shoppers to participate. Which of the following sampling techniques best
describes Deanna’s method?
A) systematic
B) convenience
C) simple random
D) stratified
The Department of Education would like to test the hypothesis that the average debt
load of graduating students with a Bachelor’s degree is equal to $17,000. A random
sample of 34 students had an average debt load of $18,200. It is believed that the
population standard deviation for student debt load is $4,200. The Department of
Education would like to set α = 0.05. The p-value for this hypothesis test would be
________.
A) 0.1310
B) 0.0950
C) 0.0475
D) 0.0219
The primary goal of a seasonal forecasting technique is to remove the random
movements in a time series by averaging the historical data.
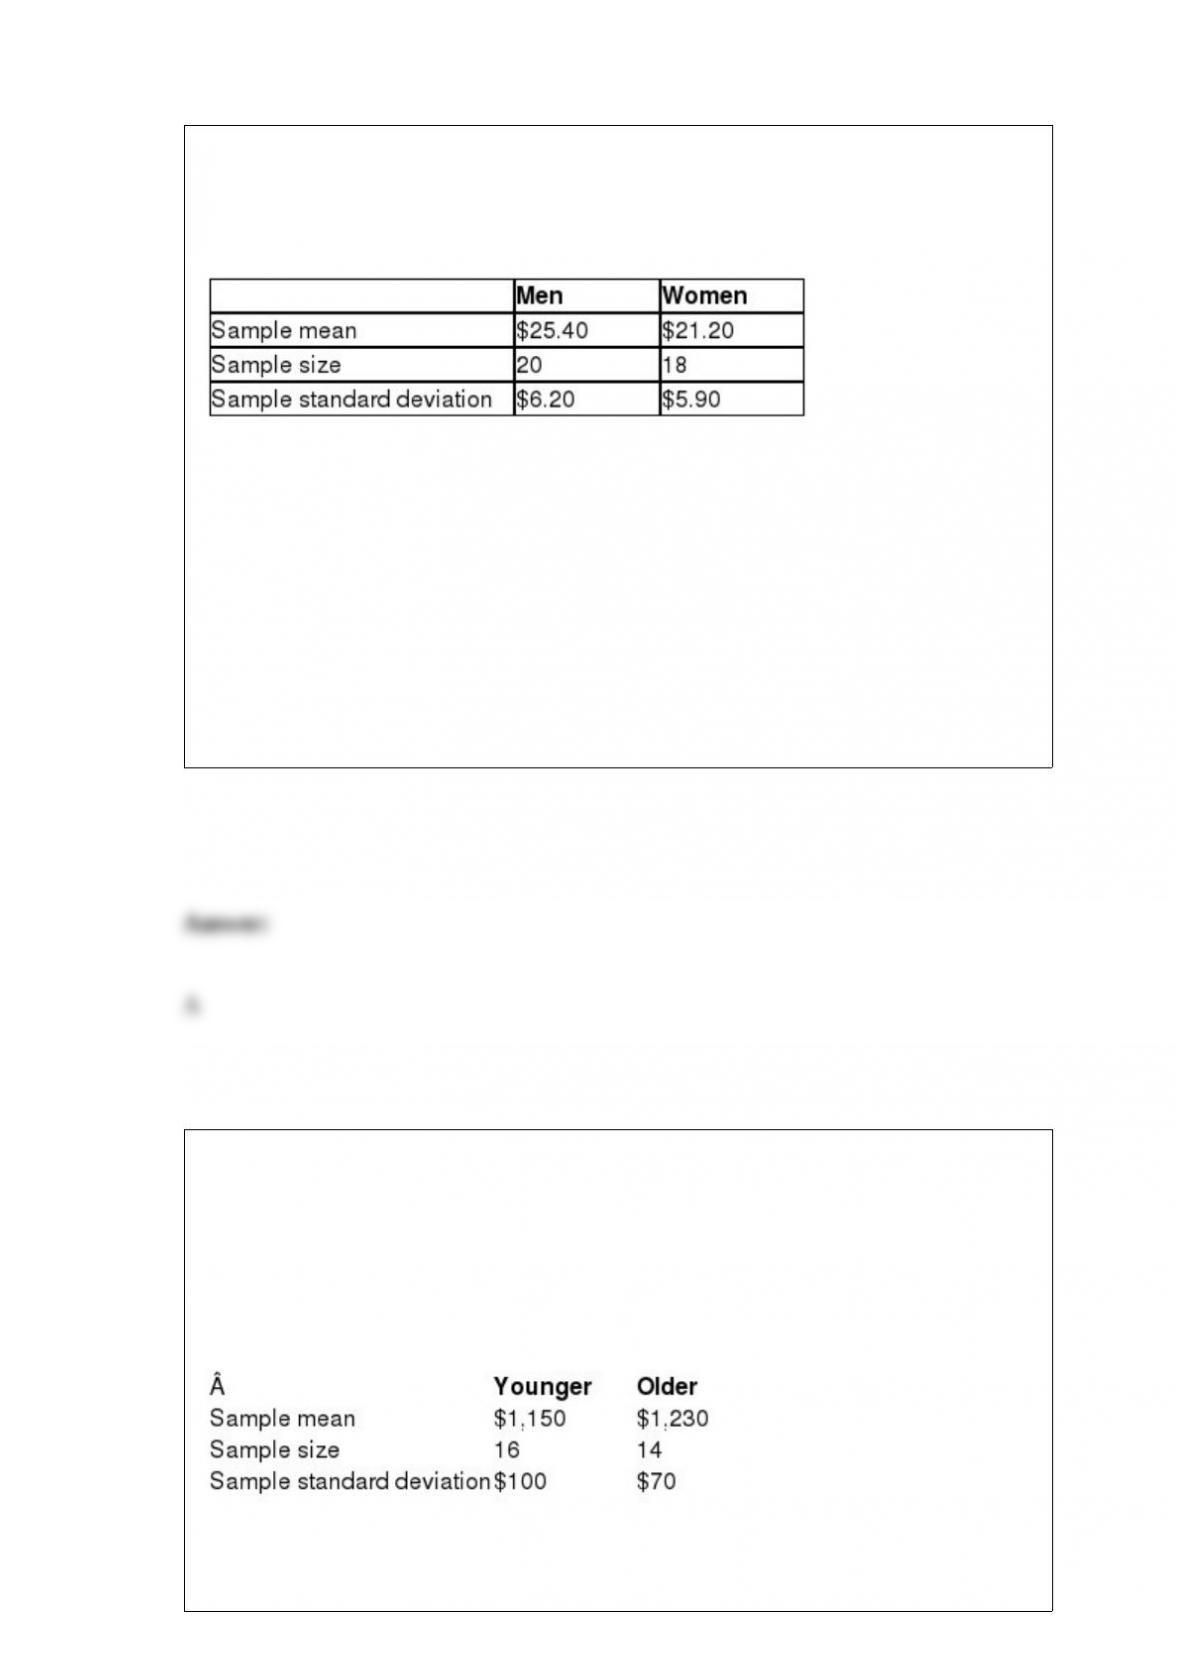
The Canadian government would like to test the hypothesis that the average hourly
wage for men is more than $2.00 higher than the average hourly wage for women. The
following data summarizes the sample statistics for hourly wages for men and women.
Assume that the population variances are equal.
If Population 1 is defined as men and Population 2 is defined as women, the pooled
variance for this hypothesis test would be ________.
A) 36.73
B) 45.19
C) 58.80
D) 64.33
Bank of New York would like to test the hypothesis that the average checking account
balance for younger customers (under 40 years old) is different from the average
checking account balance for older customers (40 or more years old). The following
data summarizes the sample statistics of the checking account balances for customers in
each age group. Assume that the population variances are unequal.
Define Population 1 as younger customers and Population 2 as older customers and use
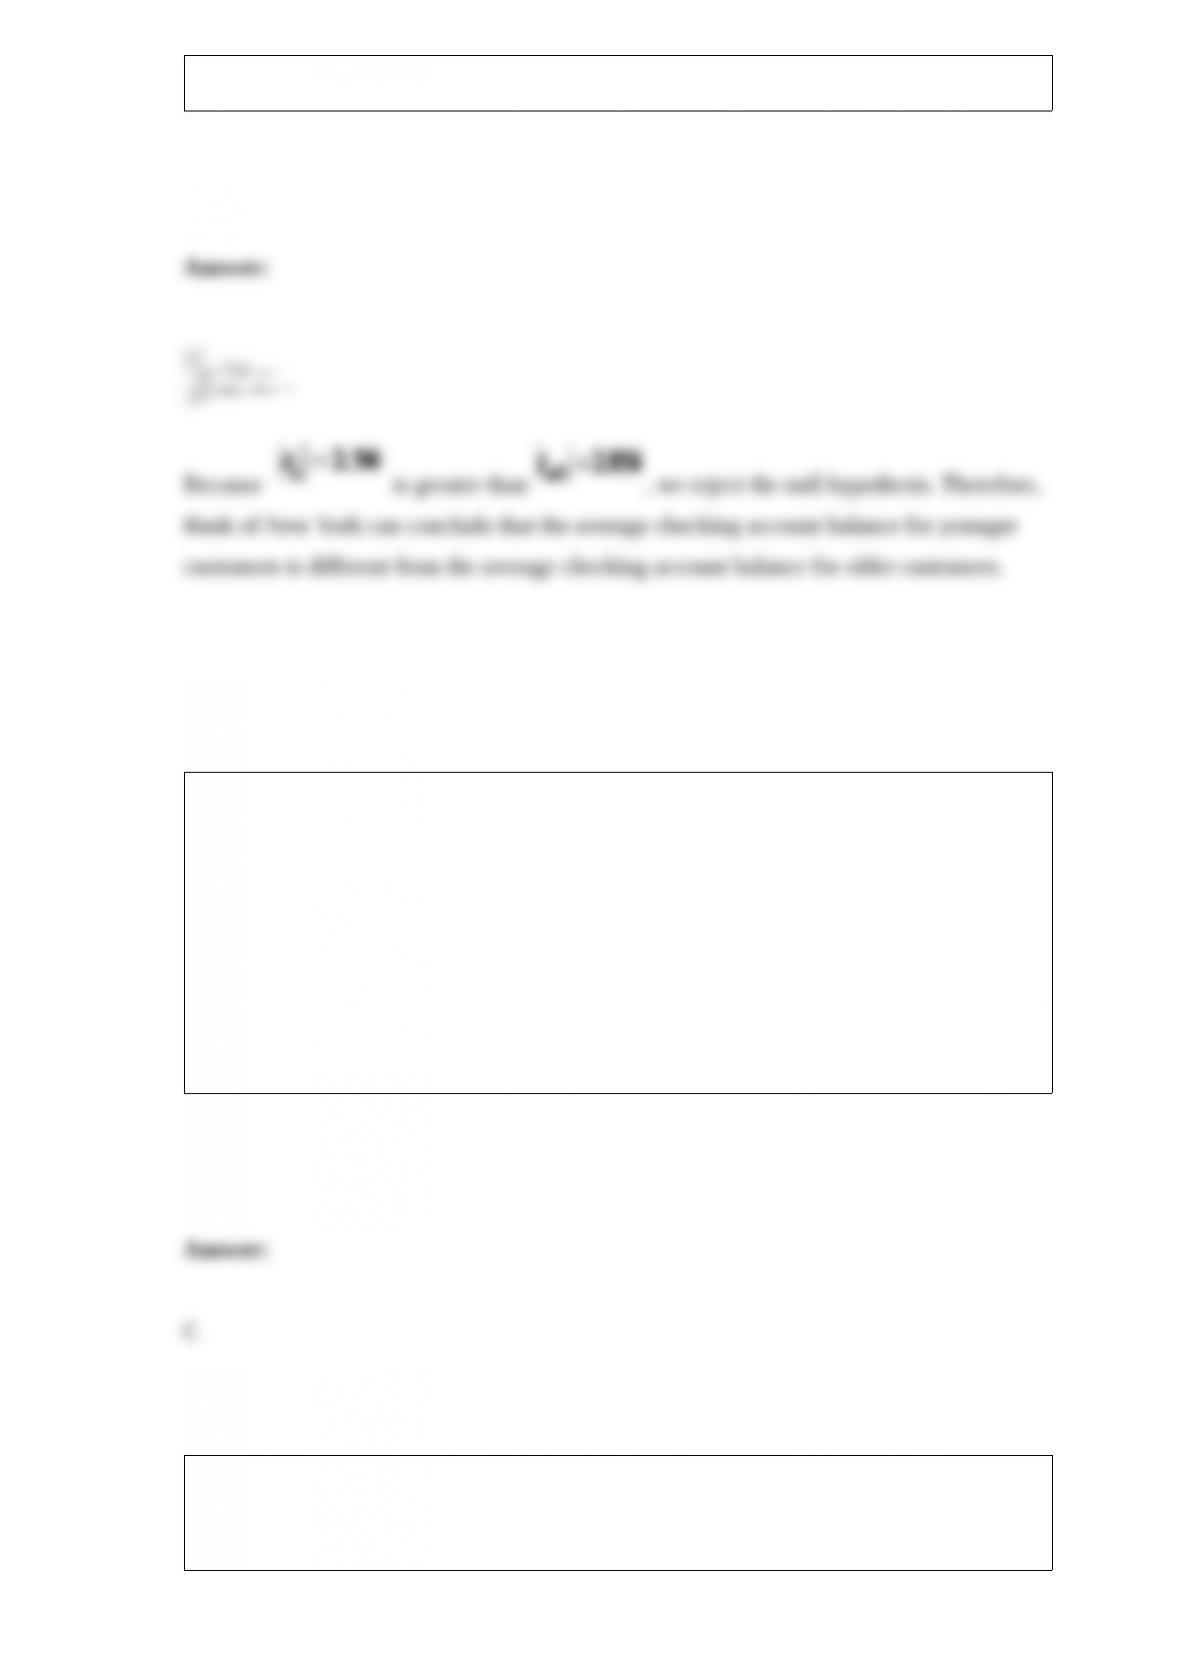
the critical value approach to test this hypothesis with α = 0.05.
The time series component that is often referred to as “noise” because it has no
detectable pattern is the ________ component.
A) cyclical
B) seasonal
C) random
D) trend
Entertainment Software Association would like to test if the median age of “gamers”
(those that routinely play video games) is more than 30 years old. The following table
summarizes the ages of a random sample of gamers.
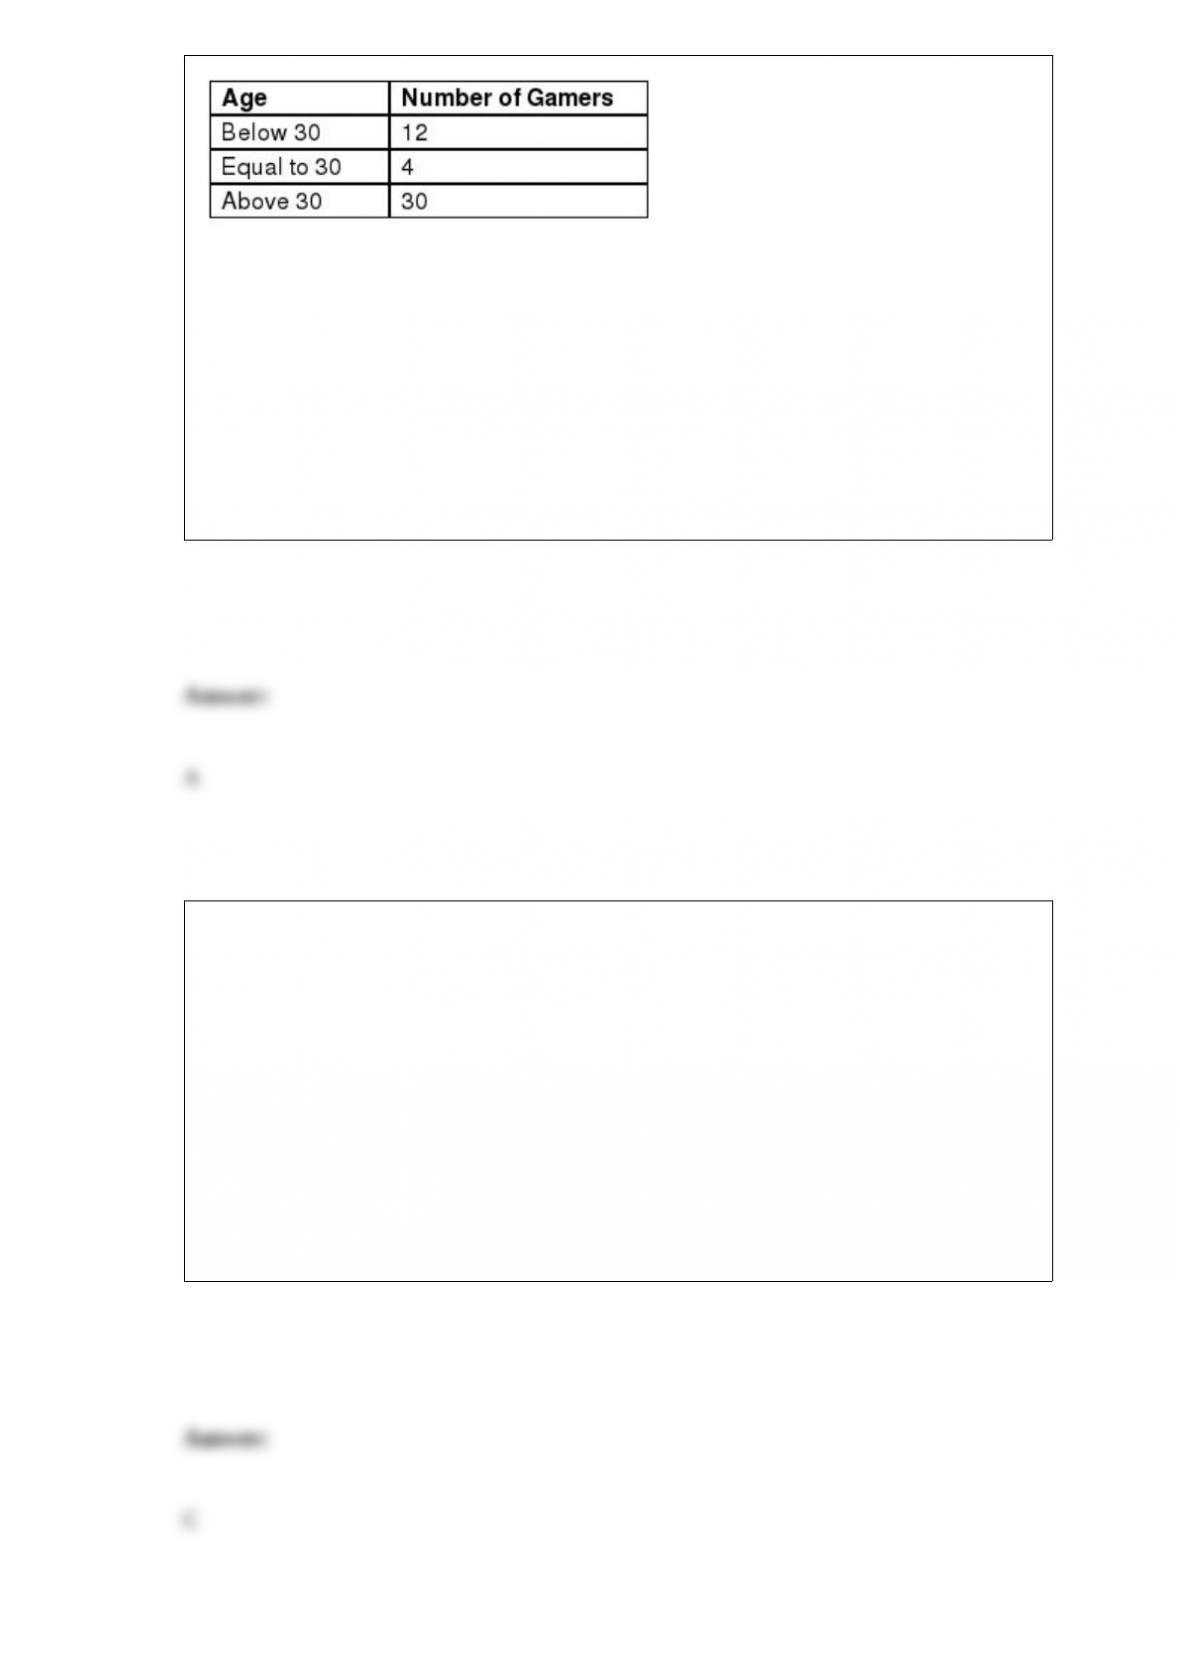
The mean for the sampling distribution for this hypothesis test is ________.
A) 21.0
B) 22.5
C) 25.0
D) 34.0
According to Experian, the average FICO credit score for residents of El Paso, Texas, is
710. Suppose the standard deviation for this population is 46.1. A random sample of 60
El Paso residents has been selected. The standard error of the mean for this sample is
________.
A) 1.96
B) 3.28
C) 5.95
D) 8.44
The Girl Scouts would like to estimate the proportion of people who consider Thin
Mints to be their favorite Girl Scout cookie. A pilot sample of 60 cookie customers
found that 15 favored Thin Mint cookies. The total sample size needed to construct a
90% confidence interval for the proportion of customers who favor Thin Mint cookies
with a margin of error equal to 6% is ________.
A) 141
B) 187
C) 235
D) 270
The finite population correction factor for the standard error of the mean should be used
when the ratio of the sample size to the size of the population exceeds ________.
A) 1%
B) 2%
C) 3%
D) 5%
Verizon Wireless would like to estimate the proportion of households that use cell
phones for their phone service without a land line. A random sample of 150 households
was selected and 48 relied strictly on cell phones for their service. The 95% confidence
interval for the proportion based on this sample is ________.
A) (0.257, 0.383)
B) (0.223, 0.417)
C) (0.185, 0.456)
D) (0.165, 0.475)
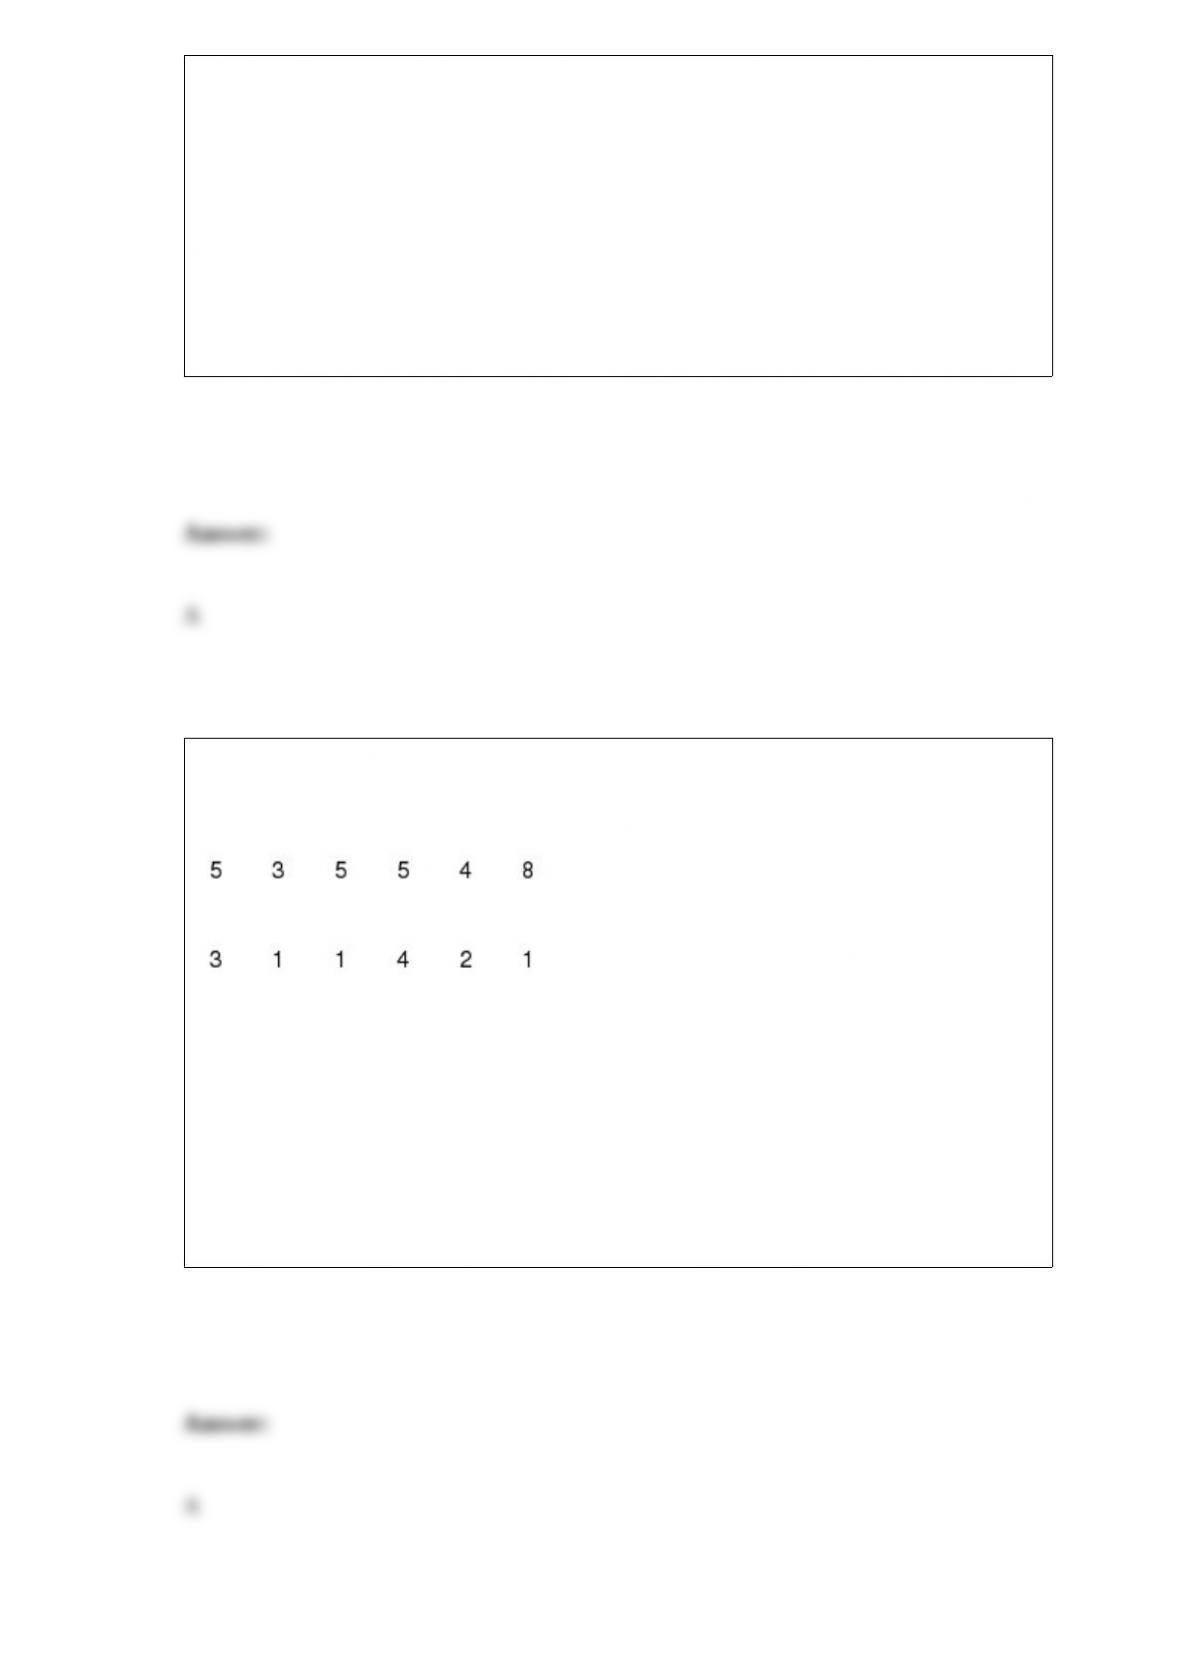
Consider the following data set:
Variable 1:
Variable 2:
The sample covariance for this data set is
A) “0.20
B) 0.65
C) “1.77
D) 2.30
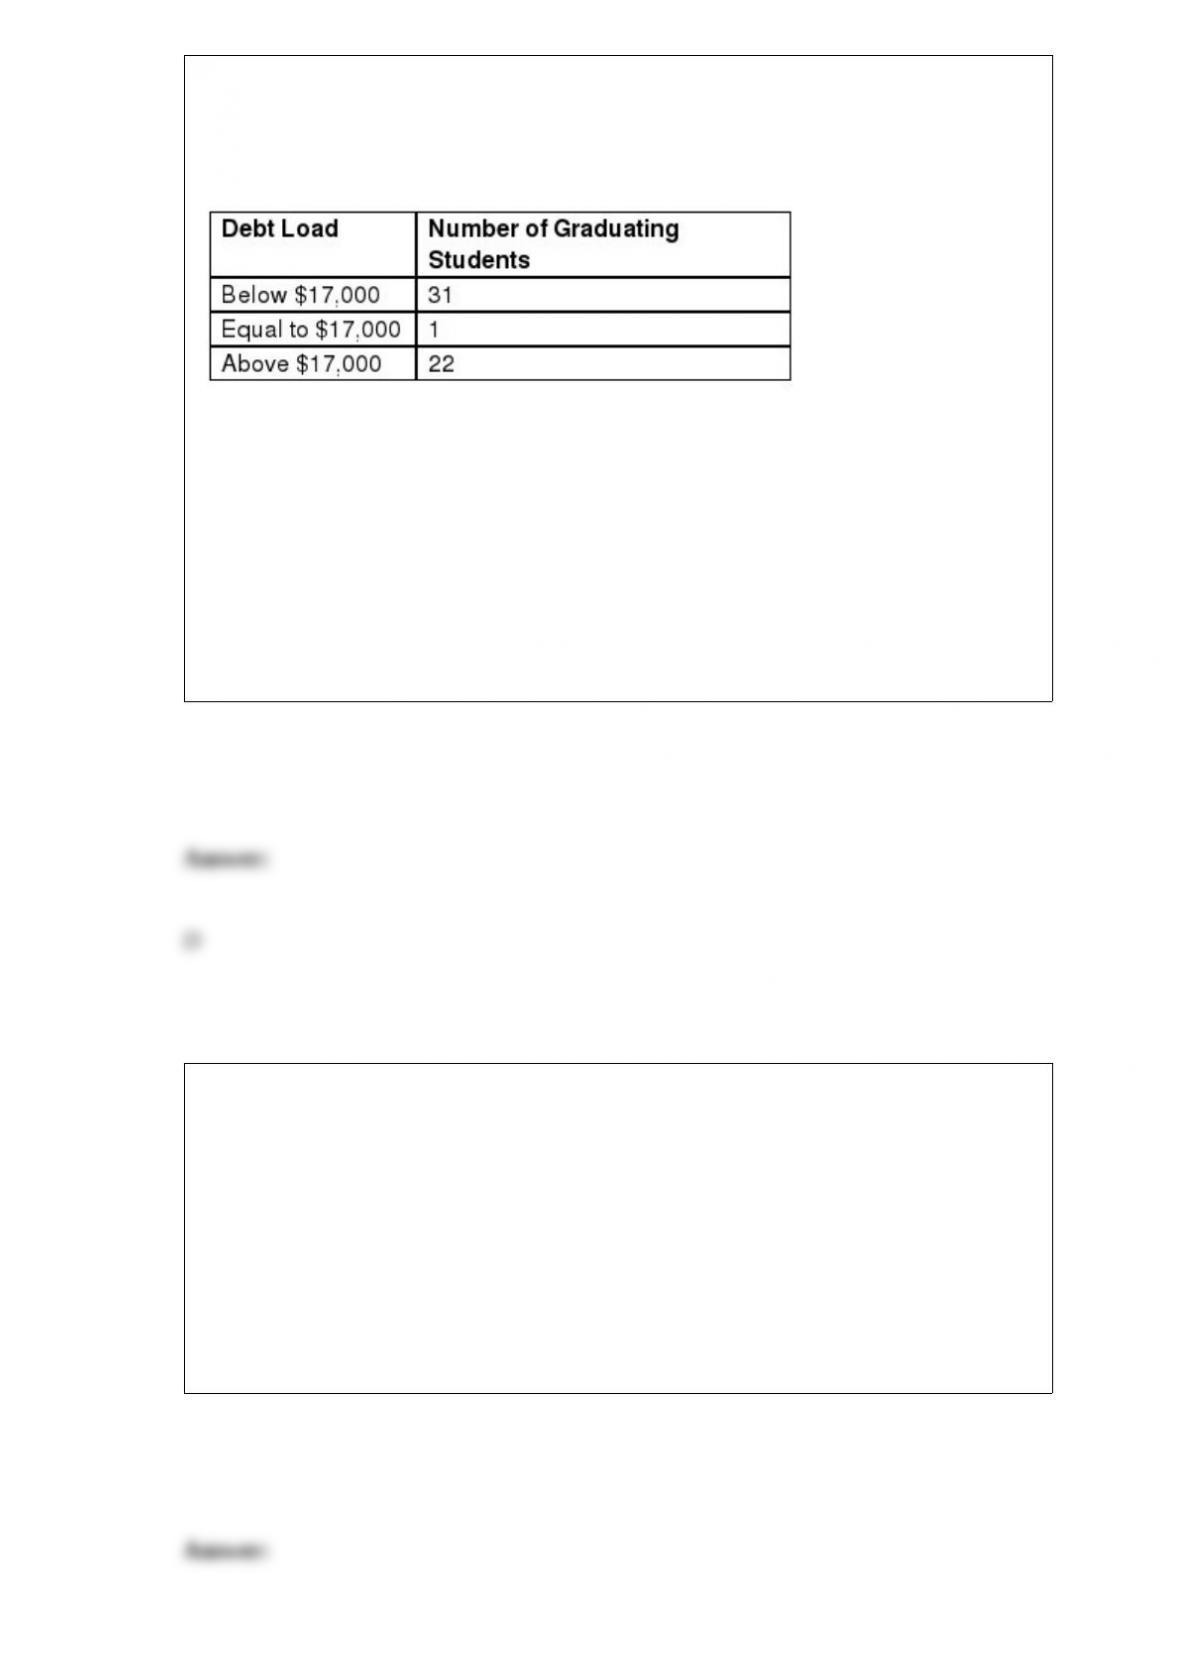
The Department of Education would like to test the hypothesis that the median debt
load of graduating students with a Bachelor’s degree is equal to $17,000. The following
table summarizes the debt load of a random sample of graduating students with a
Bachelor’s degree.
The mean for the sampling distribution for this hypothesis test is ________.
A) 18.5
B) 20.0
C) 24.0
D) 26.5
If the purpose of the hypothesis test is to establish that a population parameter is equal
to or not equal to a specific value, the ______________________________________.
A) equality statement is always assigned to the null hypothesis
B) equality statement is always assigned to the alternative hypothesis
C) ≠ statement is always assigned to the null hypothesis
D) ≤ or ≥ statement is always assigned to the alternative hypothesis
The test statistic for the two-tail Wilcoxon signed-rank test is the
__________________.
A) smaller of the sum of the negative signed ranks (R-) and the sum of the positive
signed ranks (R+).
B) larger of the sum of the negative signed ranks (R-) and the sum of the positive
signed ranks (R+).
C) sum of the positive signed ranks (R+)
D) sum of the negative signed ranks (R-)
According to CTIA, the U.S. wireless industry handles more subscribers than any other
country in the world, averaging 793 minutes per month per customer. Assume that the
standard deviation for the number of minutes used per customer per month is 270. To
confirm these results, a random sample of 65 wireless customers was selected and
found to have a sample average of 822 minutes. Determine the interval that contains
95% of the sample means from this sampling distribution and conclude whether or not
this sample supports the findings of CTIA.
________ group several values side by side within the same category in a vertical
direction.
A) Stacked bar charts
B) Clustered bar charts
C) Pie charts
D) Scatter plots
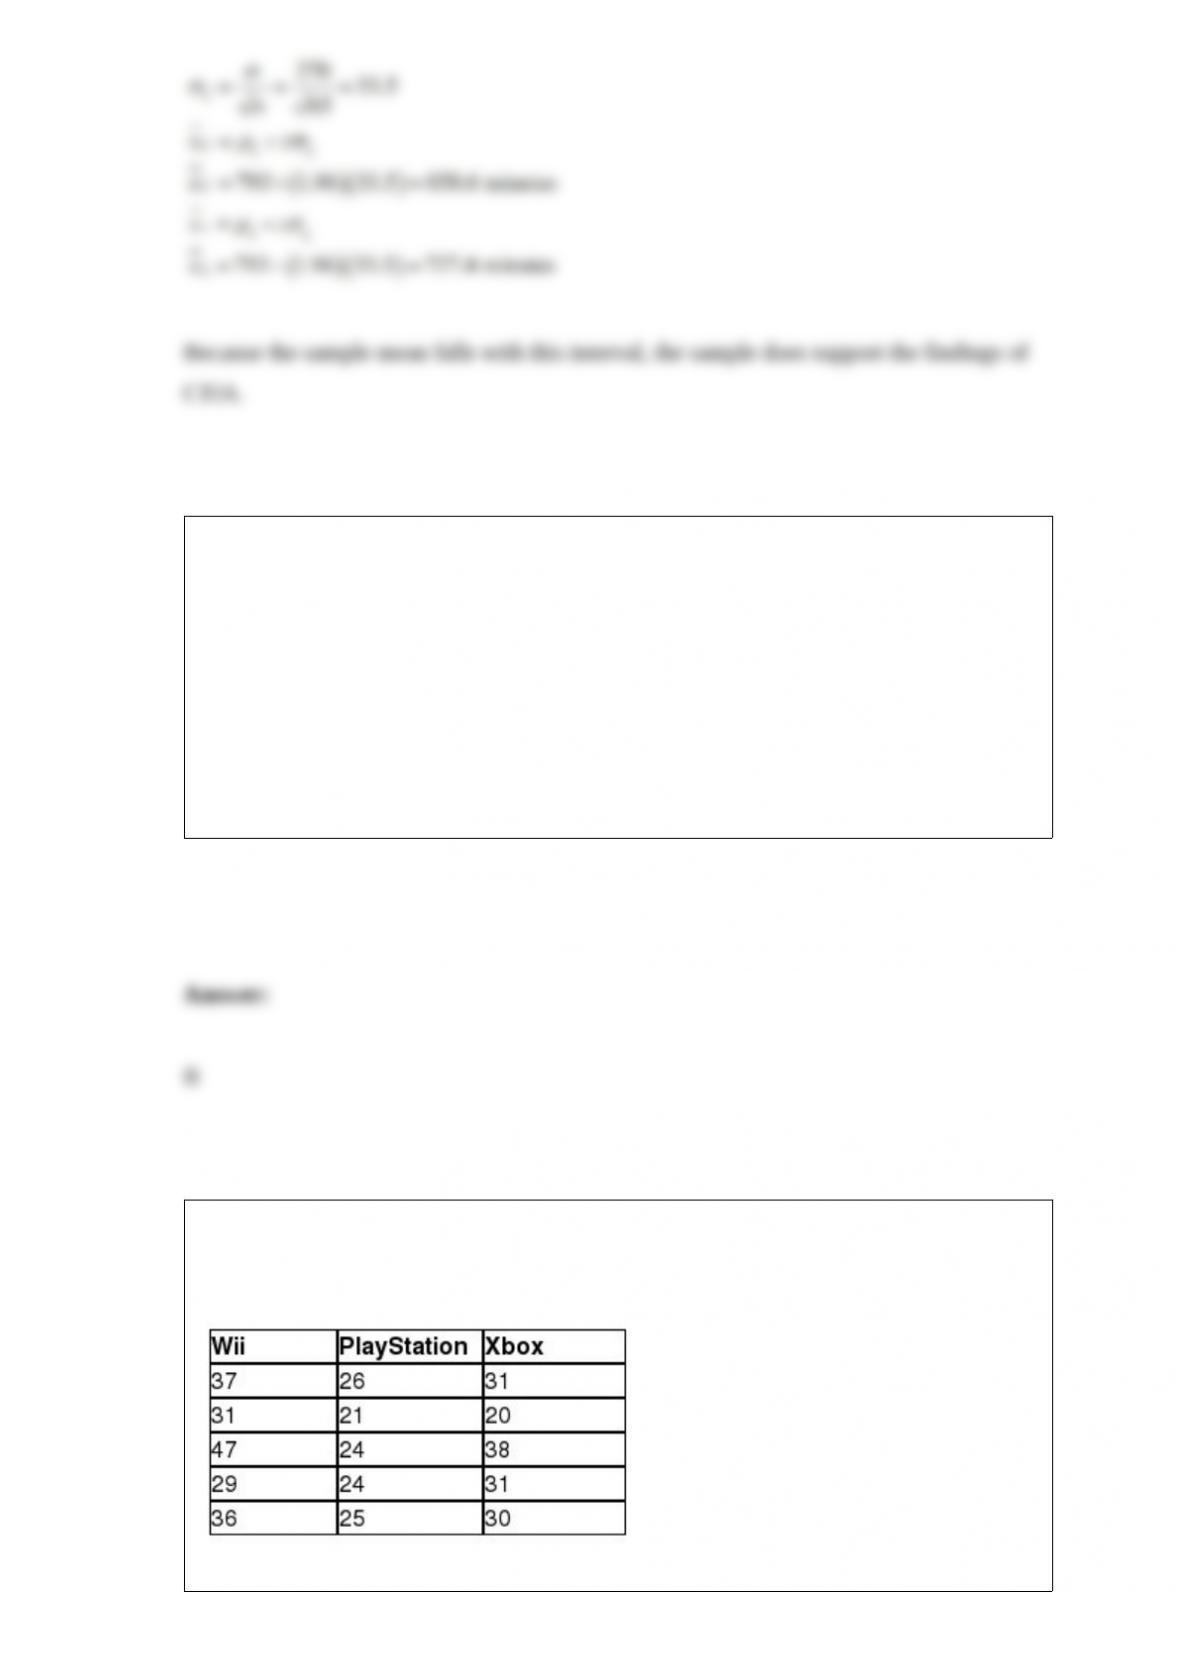
Nintendo Sony would like to test the hypothesis that a difference exists in the average
age of users of a Wii, a PlayStation, or an Xbox console game. The following data
represent the age of a random sample of Wii, PlayStation, and Xbox users.
The total sum of squares for these observations is ________.
A) 594.7
B) 652.6
C) 736.0
D) 881.5
________ probability is the probability of Event A occurring without any additional
information that could influence the event.
A) Posterior
B) Conditional
C) Subjective
D) Prior
The Department of Education would like to test the hypothesis that the average debt
load of graduating students with a Bachelor’s degree is equal to $17,000. A random
sample of 34 students had an average debt load of $18,200. It is believed that the
population standard deviation for student debt load is $4,200. The Department of
Education would like to set α = 0.05. The conclusion for this hypothesis test would be
that because the absolute value of the test statistic is

_________________________________________________.
A) more than the absolute value of the critical value, we can conclude that the average
student debt load is not equal to $17,000
B) less than the absolute value of the critical value, we can conclude that the average
student debt load is not equal to $17,000
C) more than the absolute value of the critical value, we cannot conclude that the
average student debt load is not equal to $17,000
D) less than the absolute value of the critical value, we cannot conclude that the average
student debt load is not equal to $17,000
Susan would like to conduct a survey of homeowners in the Meadowbrook
neighborhood to get their opinions on proposed road modifications in the area. Which
of the following is an example of a simple random sample?
A) Susan randomly chooses two streets in the neighborhood and selects every home on
these streets.
B) Susan selects the first 20 homes that she passes as she walks into the entrance of the
neighborhood.
C) Susan selects every third house on each street in the neighborhood.
D) None of these choices describes a simple random sample.
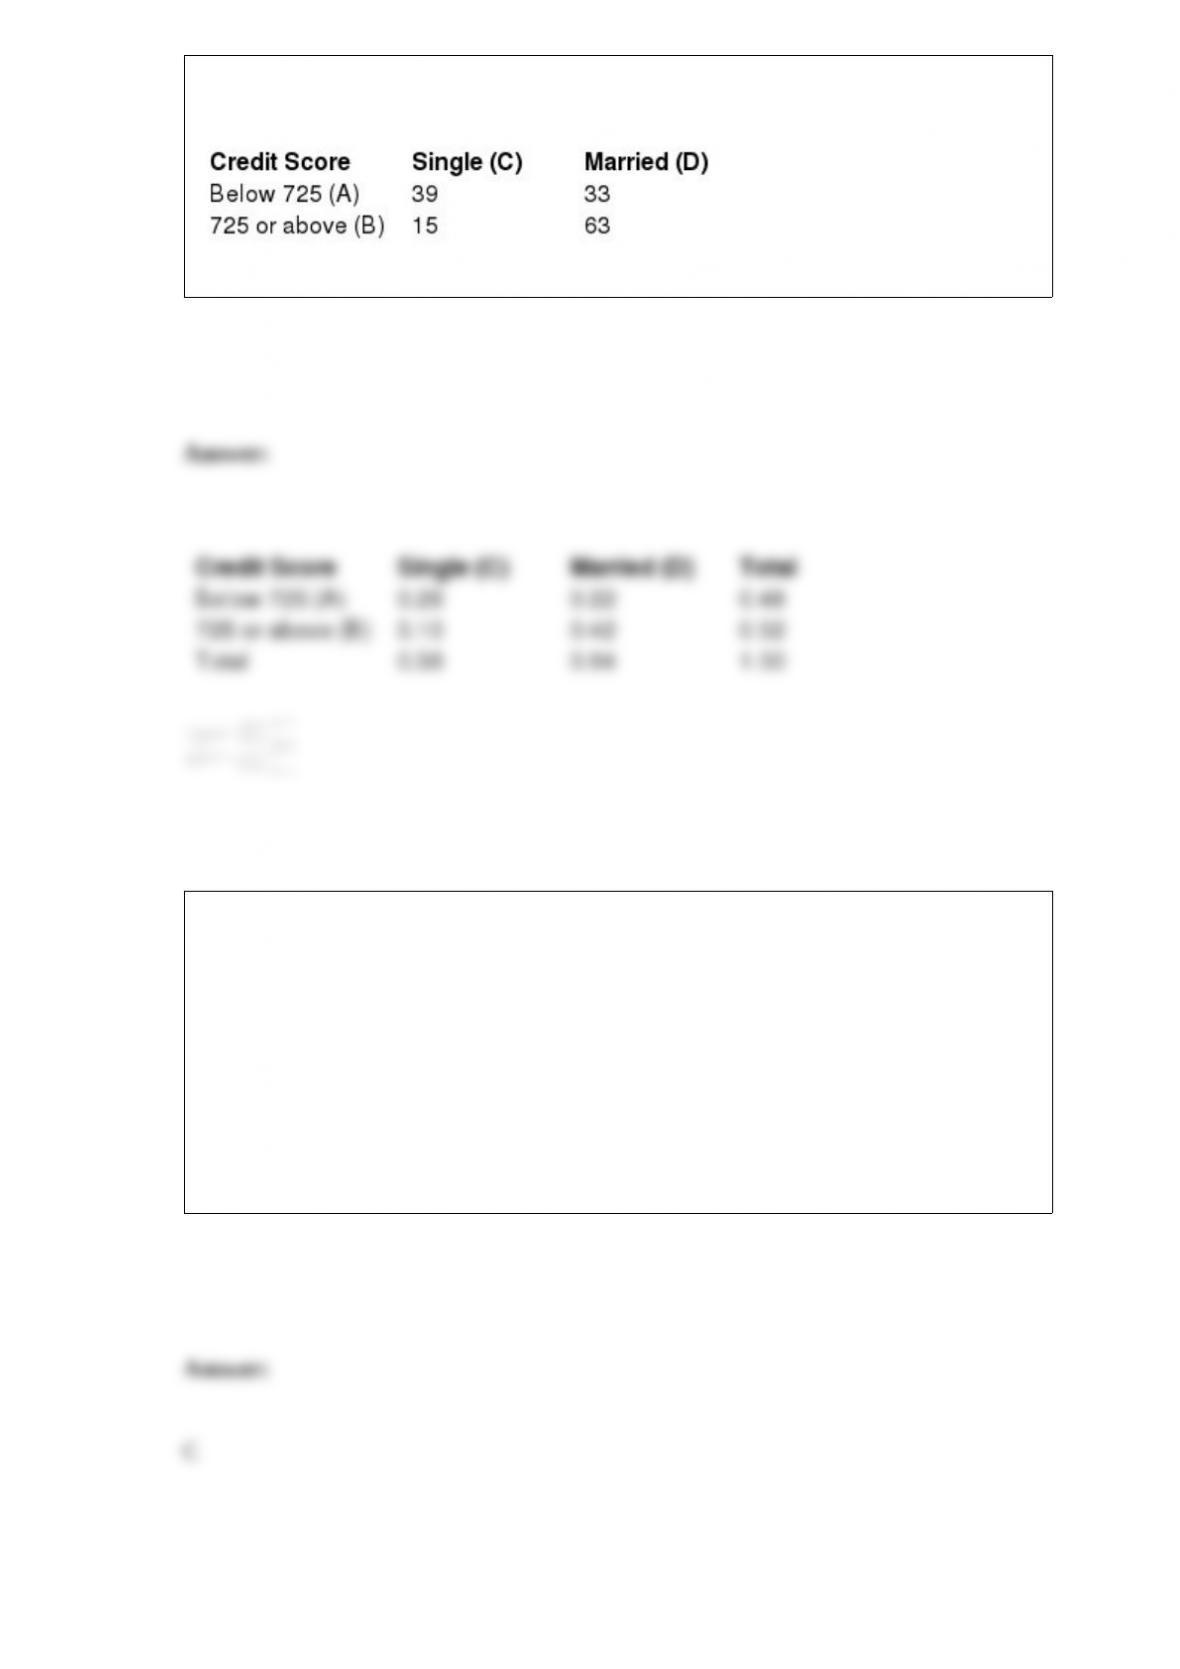
The following contingency table shows the number of adults with credit scores 725 or
above and below 725 as well as their marital status.
Construct a decision tree for this table.
The _________________________ represents the lower limit of how much you should
pay to gather a sample to acquire additional information about the alternatives.
A) expected value with sample information
B) expected value without sample information
C) expected value of sample information
D) expected value of perfect information
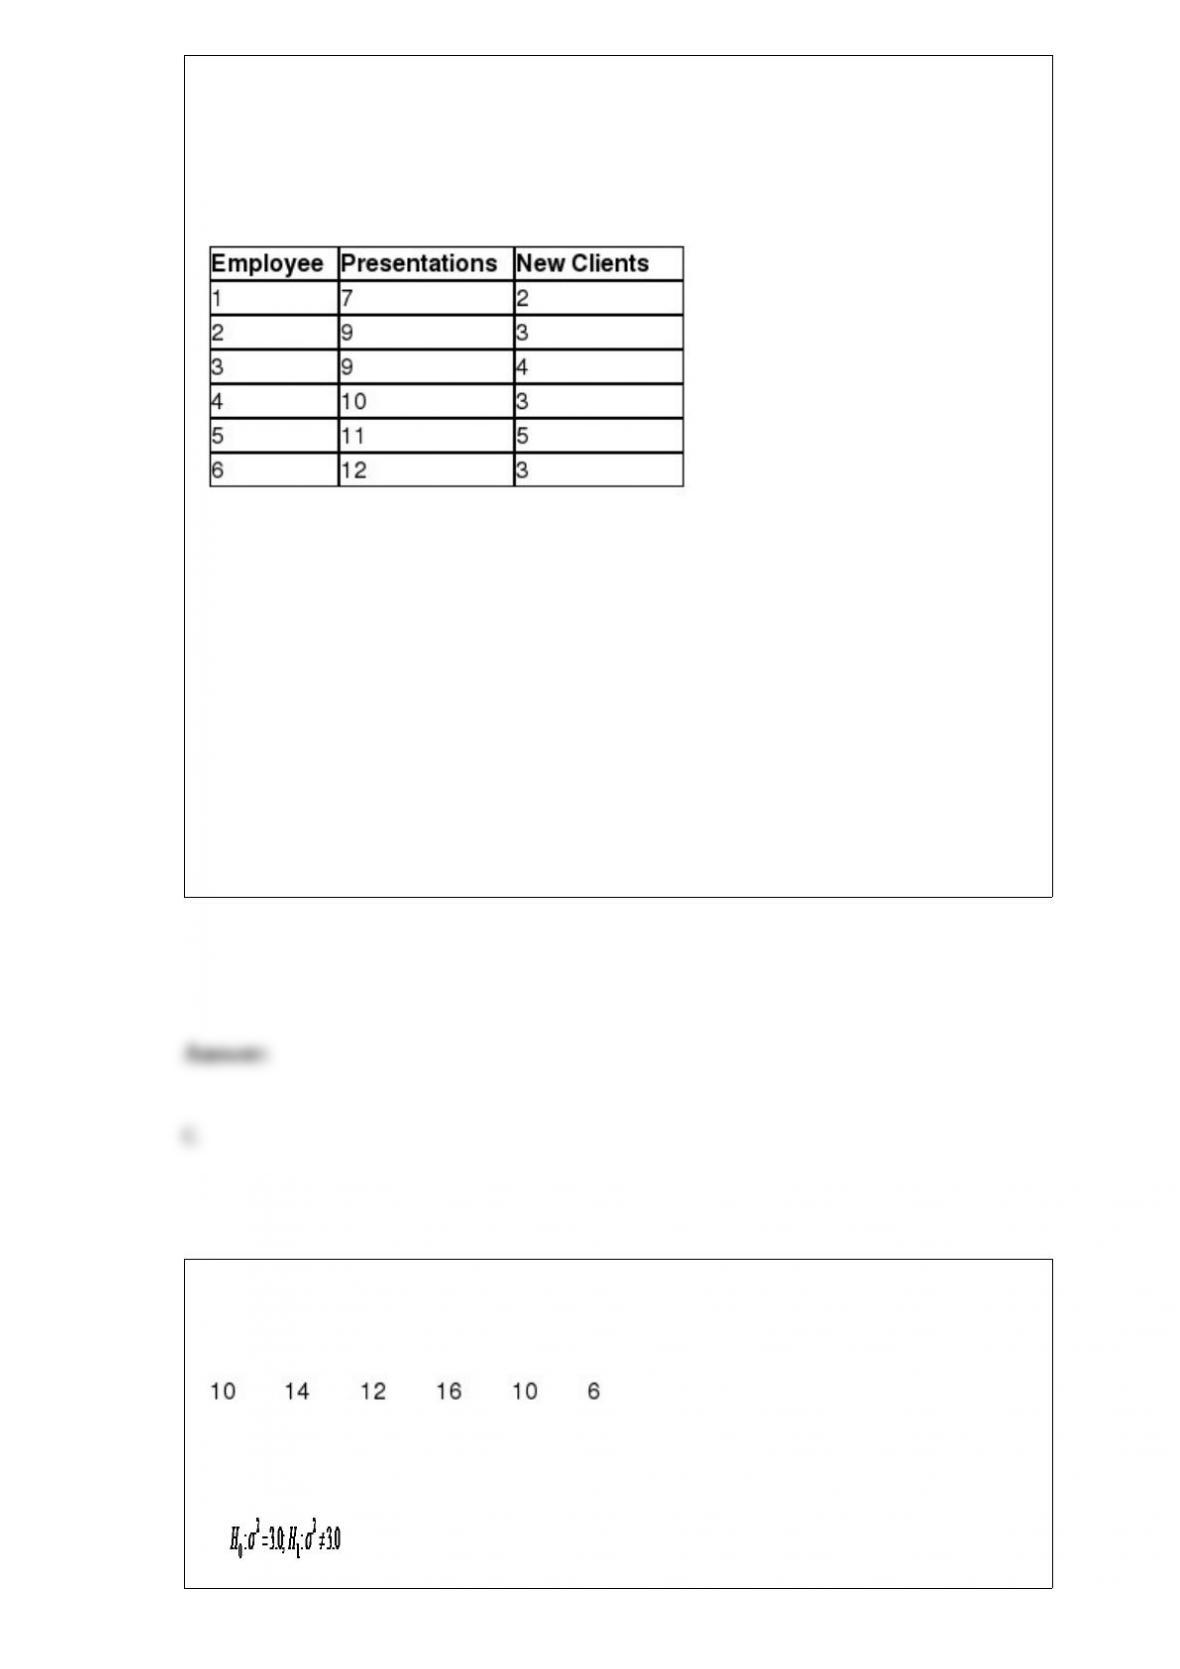
Sarah is the office manager for a group of financial advisors who provide financial
services for individual clients. She would like to investigate whether a relationship
exists between the number of presentations made to prospective clients in a month and
the number of new clients per month. The following table shows the number of
presentations and corresponding new clients for a random sample of six employees.
Sarah would like to use simple regression analysis to estimate the number of new
clients per month based on the number of presentations made by the employee per
month. The 90% prediction interval that estimates the number of new clients per month
for an employee who makes nine presentations per month is ________.
A) (2.90, 3.97)
B) (1.83, 5.04)
C) (0.82, 5.44)
D) (0.00, 6.86)
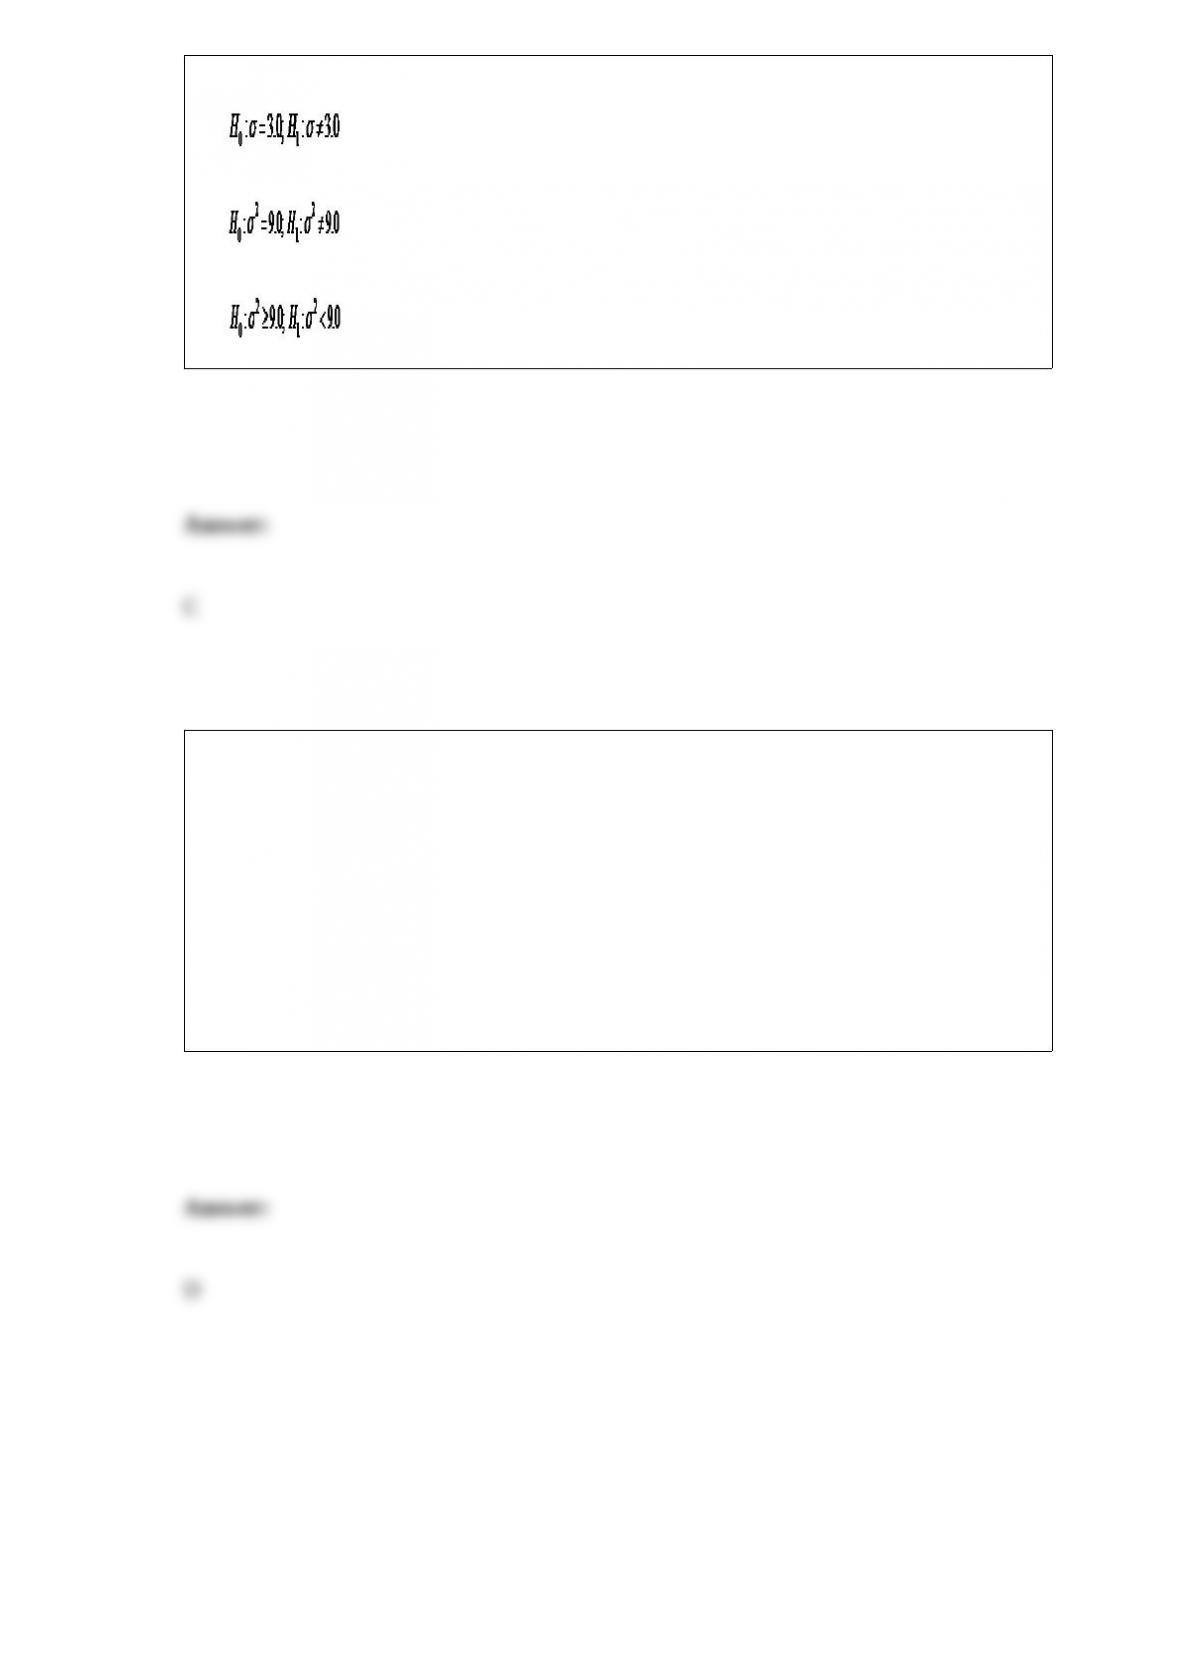
Suppose Apple would like to test the hypothesis that the standard deviation for the web
browsing battery life of the iPad equals 3.0 hours. The following data represents the
battery life, in hours, experienced by a random sample of six users.
The correct hypothesis statement would be _____________.
A)
B)
C)
D)
________ charts are a specific type of bar chart used in quality control programs by
businesses to graphically display the causes of problems.
A) Stacked bar
B) Clustered bar
C) Pie
D) Pareto