
Labor resources:
a. include only physical activities.
b. are only counted as a resource if used in the production of other resources.
c. include only skilled labor.
d. include both physical and mental activities.
e. include human effort involved in the production of goods, but not services.
A supply schedule shows the relationship between:
a. demand and supply.
b. supply and income.
c. price and income.
d. quantity supplied and price.
e. income and quantity supplied.
The subject of economics is primarily the study of:
a. the government decision-making process.
b. how to operate a business successfully.
c. decision-making because of the problem of scarcity.
d. how to make money in the stock market.

Which of the following is a statement of positive economics?
a. Government control of rent is a fair way to help poor people afford housing.
b. Government control of rent keeps landlords from charging too much rent.
c. Government control of rent decreases the number of new apartments constructed.
d. Government control of rent is an injustice.
Assume that brand X is an inferior good and name brand Y is a normal good. An
increase in consumer income, other things being equal, will cause a(n):
a. upward movement along the demand curve for name brand Y.
b. downward movement along the demand curve for brand X.
c. rightward shift in the demand curve for brand X.
d. leftward shift in the demand curve for brand X.
The total cost curve is the sum of the:
a. total fixed and total variable cost curves.
b. total fixed and marginal cost curves.
c. marginal cost and total variable cost curves.
d. none of these.

The production possibilities curve shows different combinations of goods that:
a. can be consumed by households.
b. can be consumed by firms.
c. can be produced with the available technology.
d. are produced and consumed by firms.
e. are bought and sold in the market.
In a market economy, buyers and sellers communicate their intentions to one another
through:
a. government planners.
b. negotiations overseen by government agencies.
c. elected officials.
d. prices.
The production possibilities curve shows that:

a. some of one good must be given up to get more of another good in an economy that
is operating efficiently.
b. no output combination is impossible.
c. an economy that is operating efficiently can have more of one good without giving up
some of another good.
d. scarcity can be eliminated.
As the economy recovers from a recession, we should expect that demand for:
a. inferior goods will fall and demand for non-inferior goods will rise.
b. all goods will rise.
c. inferior goods will rise and demand for non-inferior goods will fall.
d. all goods will fall.
e. complements will fall.
Exhibit 5-1 Demand curve
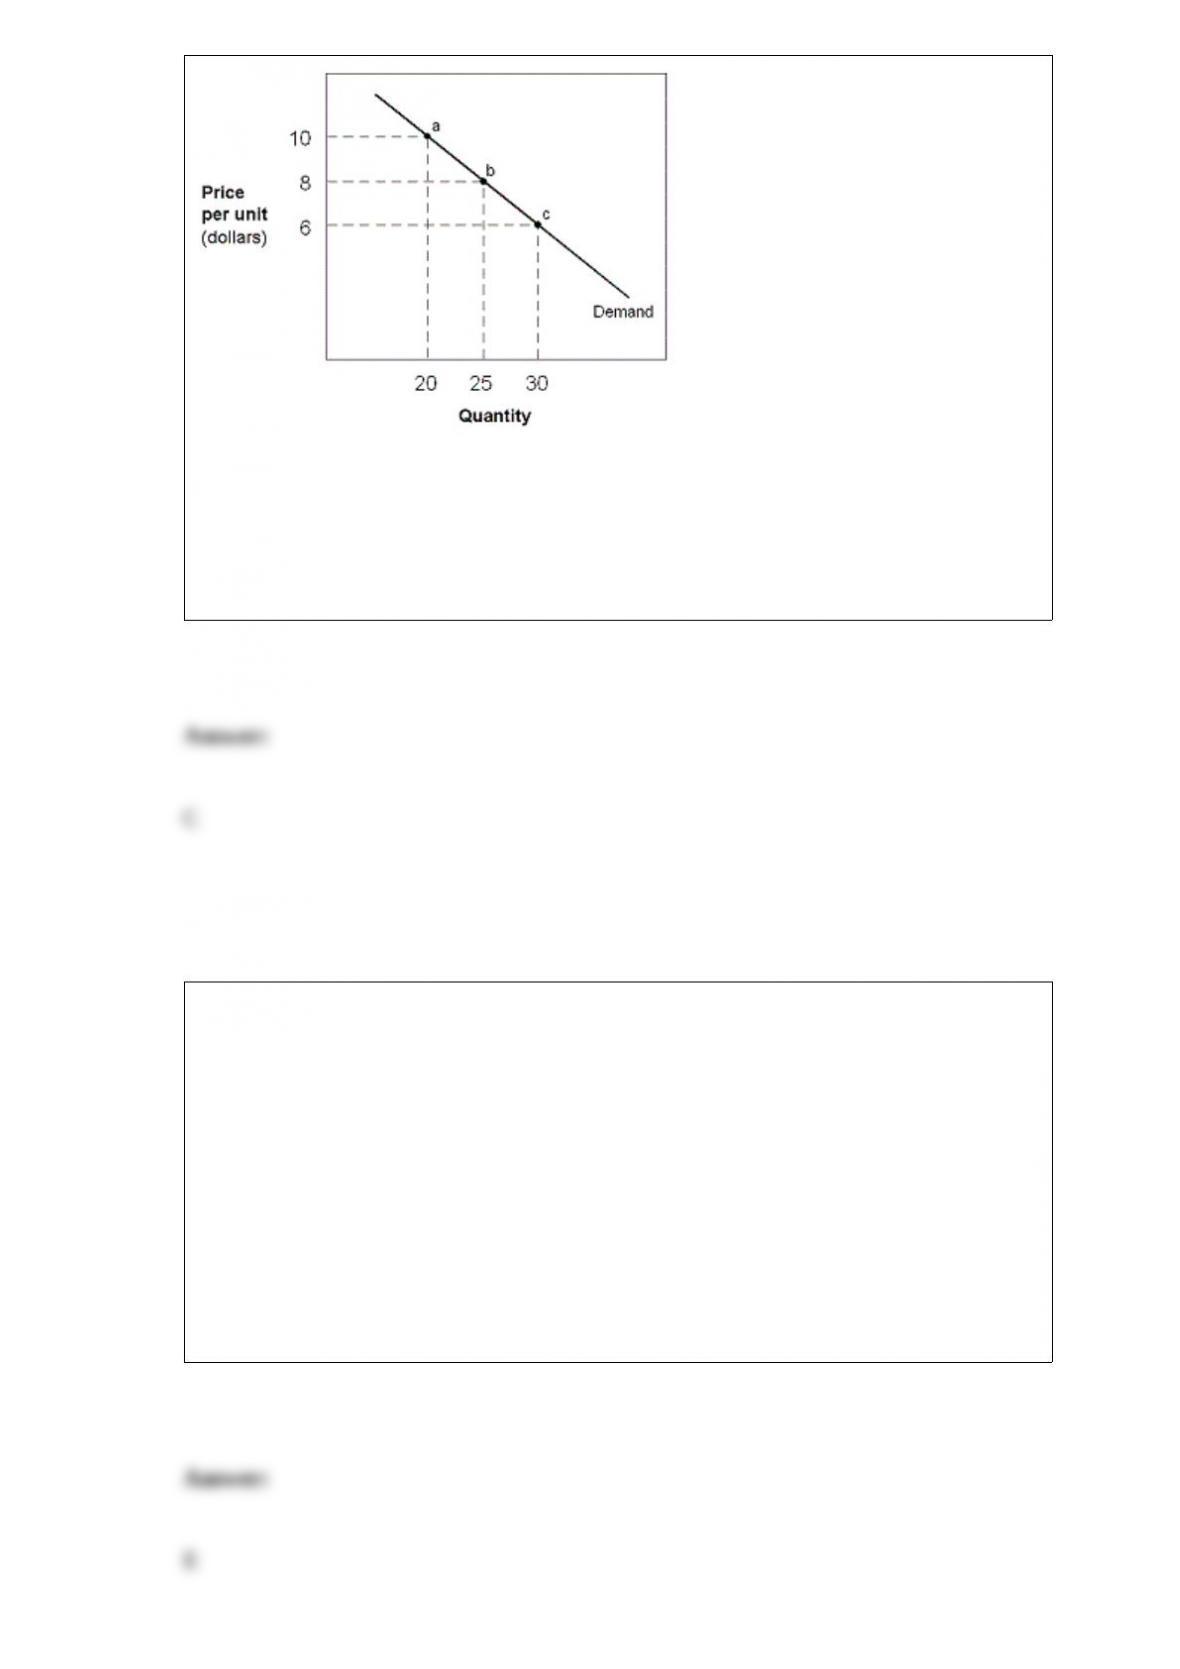
In Exhibit 5-1, the demand curve between points a and b is:
a. price elastic.
b. price inelastic.
c. unit elastic.
d. perfectly elastic.
e. perfectly inelastic.
Albert and Betty hire Christine and David to play music at their wedding. Elizabeth,
who lives behind the church, cannot study because of the loud music. The third party is:
a. Albert.
b. Betty.
c. Christine.
d. David.
e. Elizabeth.

Which of the following is true, according to the law of diminishing marginal utility?
a. The marginal utility of Diane’s second Coke is greater than the marginal utility of her
third pretzel, other things constant.
b. The marginal utility of Diane’s second Coke is greater than the marginal utility of
Ken’s third pretzel, other things constant.
c. The marginal utility of Diane’s second Coke is greater than the marginal utility of her
third Coke, other things constant.
d. The total utility of two Cokes is greater than the total utility of three Cokes, other
things constant.
e. The marginal utility of Diane’s second Coke is greater than the marginal utility of
Ken’s third Coke, other things constant.
If national real GDP grows at twice the rate of population growth,
a. c and e.
b. eventually there will be too much GDP.
c. per real capita GDP will double each year.
d. per real capita GDP will be reduced by half each year.
e. per real capita GDP growth will double each year.
The marginal revenue product of a resource is:
a. the marginal product of the resource multiplied by the price of the product it helps to

produce.
b. the price of the product times the price of the resource.
c. larger when the product price is smaller.
d. larger when the marginal product is smaller.
Assume the price of pizza decreases. As a result, your real income increases and you
increase the quantity of pizza purchased each month. This is an example of the:
a. substitution effect.
b. income effect.
c. revenue effect.
d. consumer price effect.
Exhibit 7-16 Long-run average cost curves
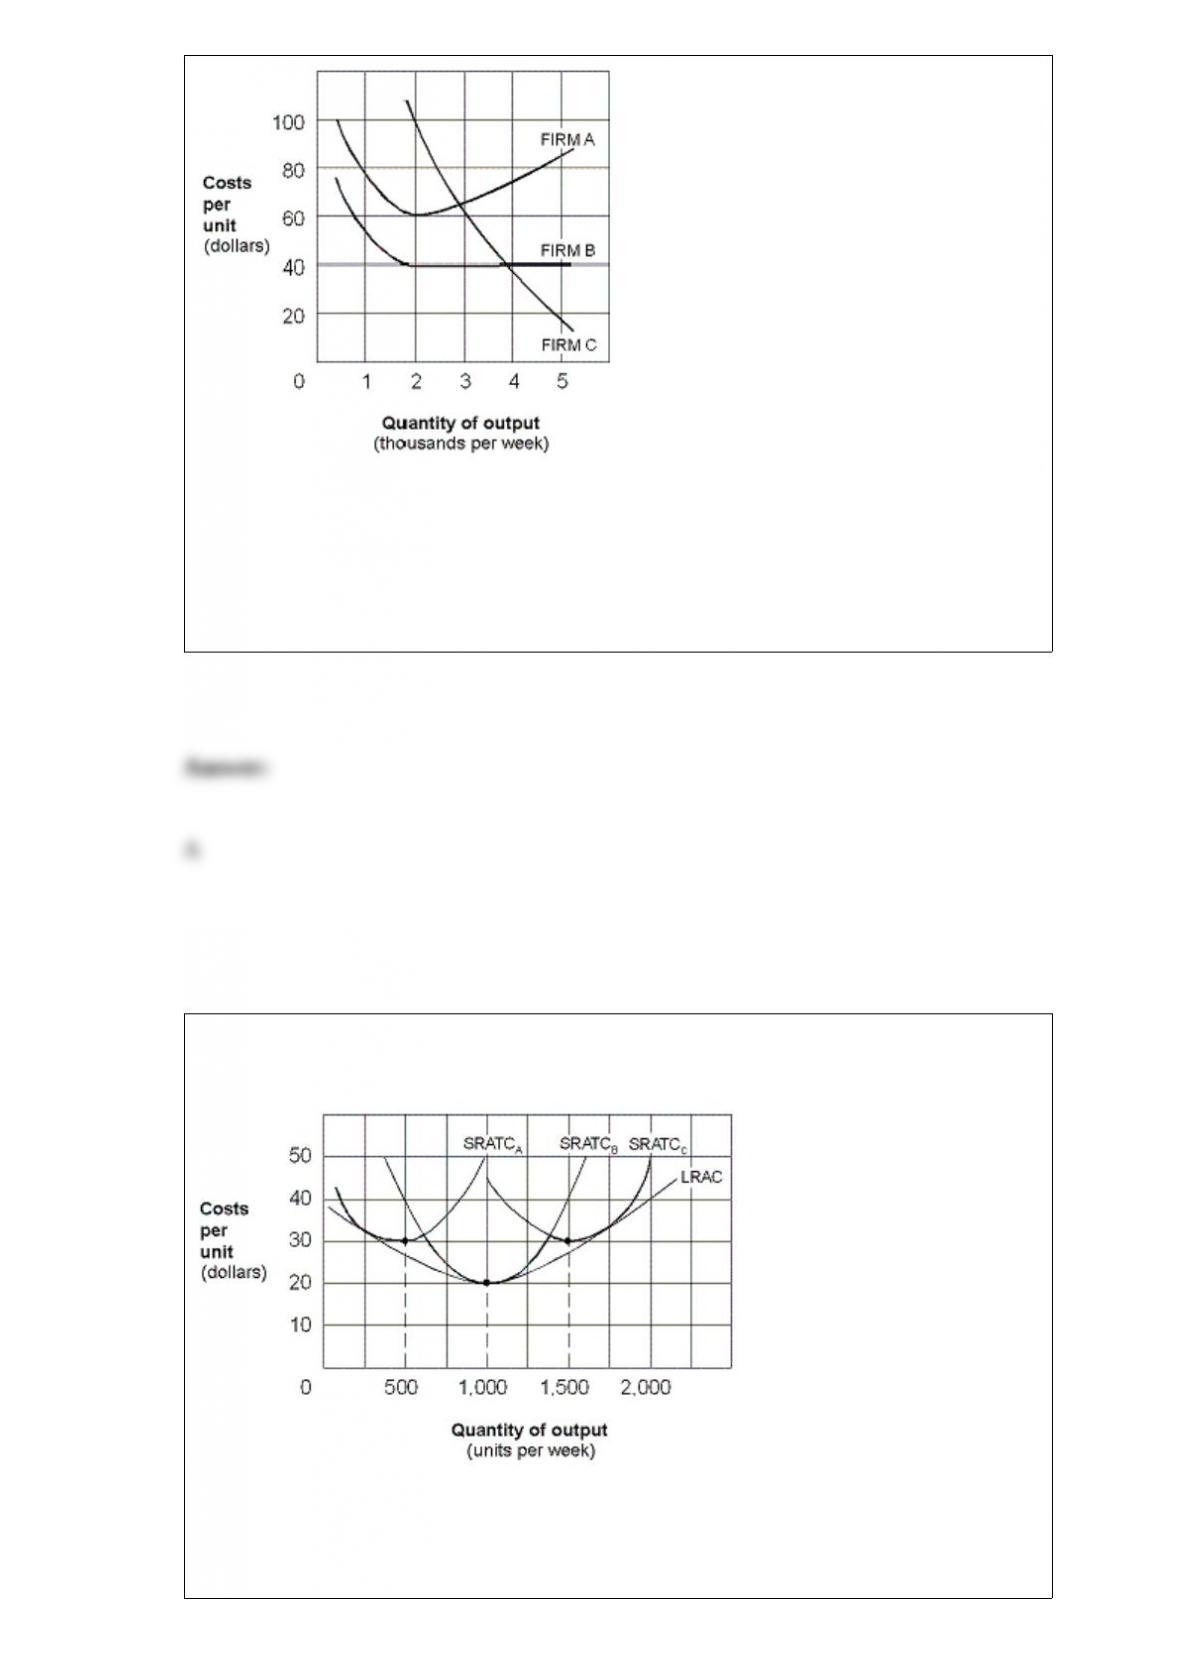
Which firm in Exhibit 7-16 displays a long-run average cost curve with diseconomies
beginning at 2,000 units of output per week?
a. Firm A.
b. Firm B.
c. Firm C.
d. Firms A and C.
Exhibit 7-15 Long-run average cost
Given the short-run average total cost curves in Exhibit 7-15, what level of output per
week minimizes average total cost?
a. 500 units.
b. 1,000 units.

c. 1,500 units.
d. 2,000 units.
A firm estimates that when output is 10, its total costs are $900. It also finds that when
output is 11, its total costs are $920. The marginal cost of the eleventh unit of output is:
a. $1.
b. $20.
c. $90.
d. $900.
e. $920.
If a country’s goods exports are less than its goods imports, then it experiences a:
a. balance of payments surplus. c. balance of trade surplus.
b. balance of payments deficit. d. balance of trade deficit.
According to the income effect, when the price of automobiles rises, people buy fewer

automobiles because:
a. they substitute other forms of transportation for driving.
b. the nominal amount of their paychecks is smaller.
c. the purchasing power of their income is reduced.
d. their demand for automobiles is very elastic.
If a supplier faces a perfectly horizontal demand curve and sets his price slightly higher
than the demand curve itself, he can expect:
a. no change in his total revenues.
b. everyone to begin buying his product.
c. a complete loss of revenues.
d. a new demand curve.
e. a relative increase in income.
Exhibit 7-11 Short-run cost curves schedule for pizzeria’s hourly production
In Exhibit 7-11, what is the marginal cost of increasing production from 10 to 20 pizzas
per hour?

a. $2 per pizza.
b. $3 per pizza.
c. $4 per pizza.
d. $5 per pizza.