
In a contingency table, we describe the relationship between ________.
A. Two variables measured at the ordinal or nominal level
B. Two variables, one measured as an ordinal variable and the other as a ratio variable
C. Two variables measured at the interval or ratio level
D. A variable measure on the interval or ratio level and time
The mean of a normal distribution is 400 pounds. The standard deviation is 10 pounds.
What is the probability of a weight between 415 pounds and the mean of 400 pounds?
A. 0.5000
B. 0.1932
C. 0.4332
D. 0.3413

A hypothesis regarding the weight of newborn infants at a community hospital is that
the mean is 6.6 pounds. A sample of seven infants is randomly selected and their
weights at birth are recorded as 9.0, 7.3, 6.0, 8.8, 6.8, 8.4, and 6.6 pounds. What is the
decision for a statistical significant change in average weights at birth at the 5% level of
significance?
A. Fail to reject the null hypothesis.
B. Reject the null hypothesis and conclude the mean is higher than 6.6 lb.
C. Reject the null hypothesis and conclude the mean is lower than 6.6 lb.
D. Cannot calculate because the population standard deviation is unknown.
A survey of an urban university (population of 25,450) showed that 870 of 1,100
students sampled supported a fee increase to fund improvements to the student
recreation center. Using the 99% level of confidence, what is the confidence interval for
the proportion of students supporting the fee increase?
A. [0.751, 0.829]
B. [0.759, 0.823]
C. [0.767, 0.814]
D. [0.771, 0.811]
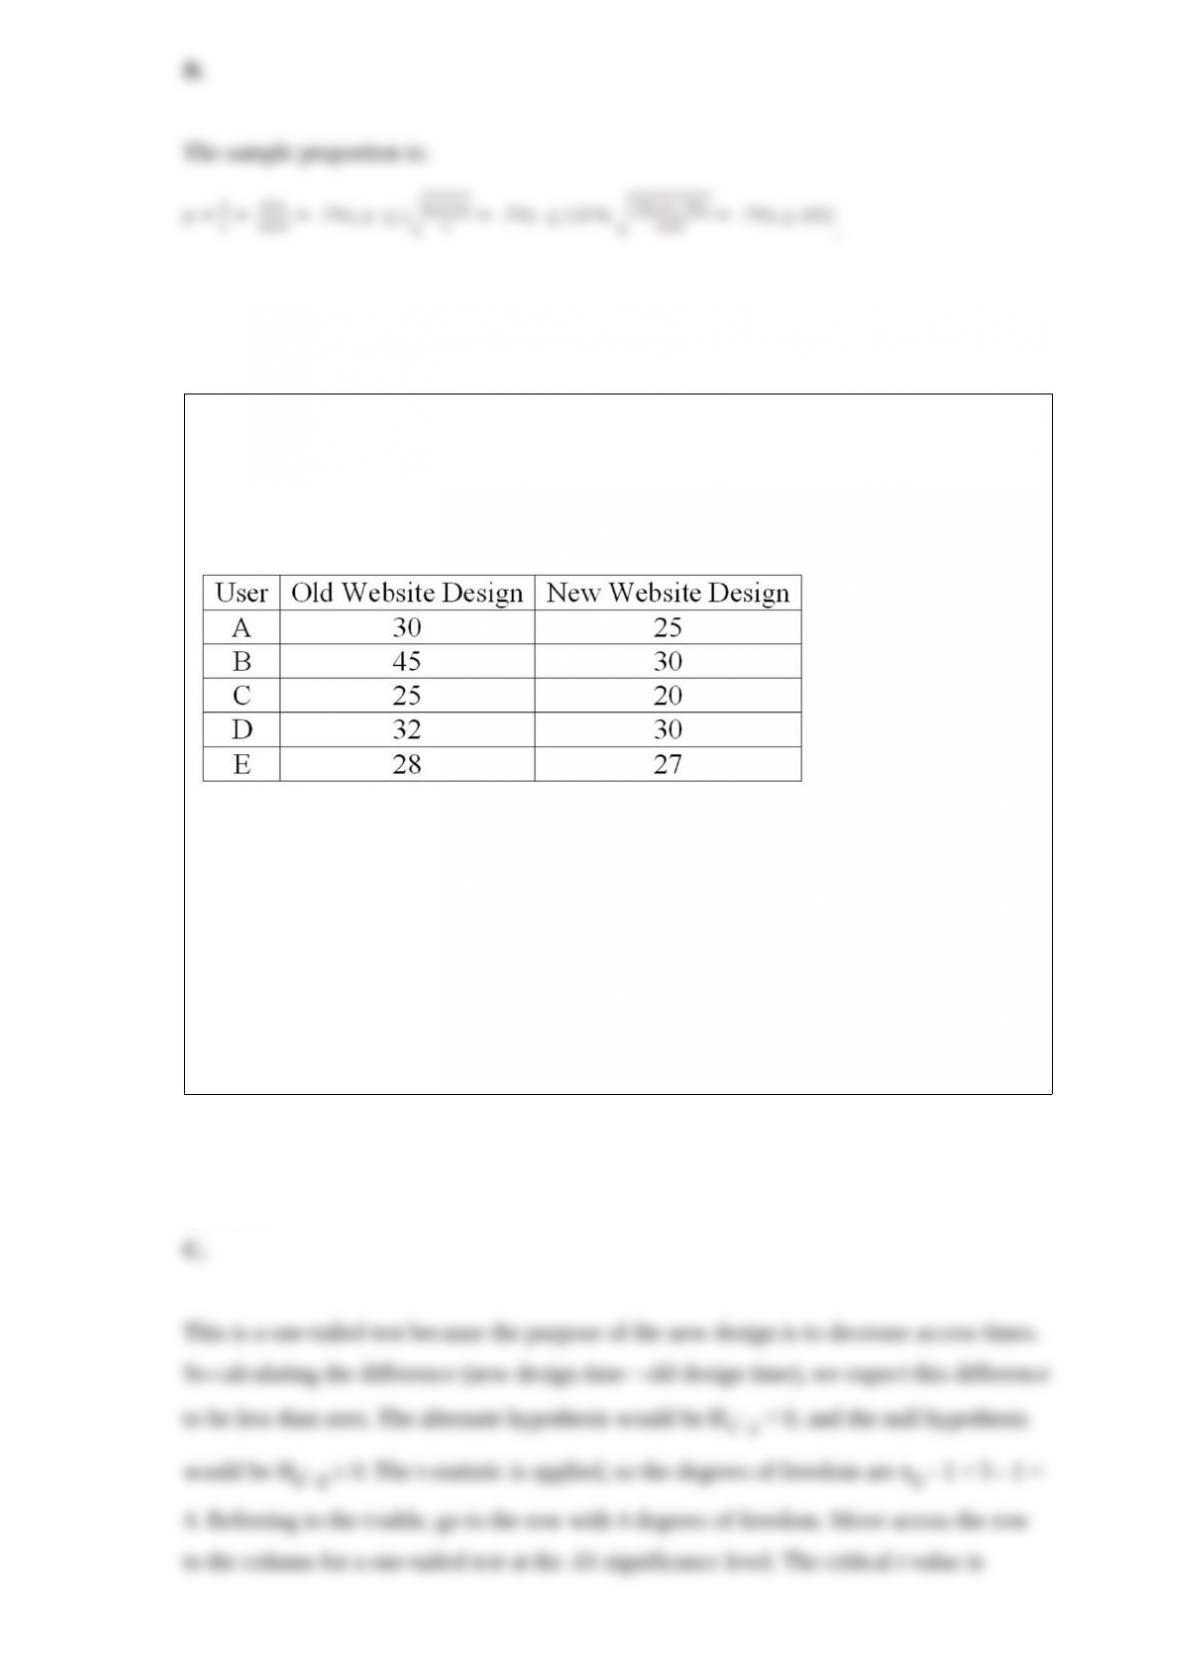
A company is researching the effectiveness of a new website design to decrease the
time to access a website. Five website users were randomly selected, and their times (in
seconds) to access the website with the old and new designs were recorded. To compare
the times, they computed (new website design time – old website design time). The
results follow.
For a 0.01 significance level, what is the critical value?
A. 2.256
B. 1.895
C. 3.747
D. 2.447
Which of the following is true about the standard error of estimate?
A. It is a measure of the accuracy of the prediction.
B. It is based on squared vertical deviations between Y and X.
C. It can be negative.
D. It is calculated using the regression mean square.
The variance inflation factor can be used to reduce multicollinearity by _________.
A. Eliminating variables for a multiple regression model
B. Decreasing homoscedasticity
C. Evaluating the distribution of residuals
D. Testing the null hypothesis that all regression coefficients equal zero

For the most recent seven years, the U.S. Department of Education reported the
following number of bachelor’s degrees awarded in computer science: 4,033; 5,652;
6,407; 7,201; 8,719; 11,154; 15,121. What is the annual arithmetic mean number of
degrees awarded?
A. About 12,240
B. About 8,327
C. About 6,217
D. About 15,962
When an event’s probability depends on the likelihood of another event, the probability
is a(n) ___________.
A. Conditional probability
B. Empirical probability
C. Joint probability
D. Mutually exclusive probability

For the following distribution:
What is the variance of the distribution?
A. 1.1616
B. 0.964
C. 0.982
D. 1.000
When testing for differences between treatment means, a confidence interval is
computed with __________________.
A. The mean square error
B. The standard deviation
C. The sum of squared errors
D. The standard error of the mean

The probability of an event that is affected by two or more different events is called a(n)
___________.
A. Conditional probability
B. Empirical probability
C. Joint probability
D. Tree diagram
A manufacturer wants to increase the shelf life of a line of cake mixes. Past records
indicate that the average shelf life of the mix is 216 days. After a revised mix has been
developed, a sample of nine boxes of cake mix gave these shelf lives (in days): 215,
217, 218, 219, 216, 217, 217, 218, and 218. Using α = 0.025, has the shelf life of the
cake mix increased?
A. Yes, because computed t is greater than the critical value.
B. Yes, because computed t is less than the critical value.
C. No, because computed t lies in the region of acceptance.
D. No, because 217.24 is quite close to 216.

What level of measurement is a person’s “favorite sport”?
A. Ratio
B. Ordinal
C. Interval
D. Nominal
What is the range of values for a coefficient of correlation?
A. 0 to +1.0
B. -3 to +3 inclusive
C. -1.0 to +1.0 inclusive
D. Unlimited range

Based on the Nielsen ratings, the local CBS affiliate claims its 11 p.m. newscast reaches
41% of the viewing audience in the area. In a survey of 100 viewers, 36% indicated that
they watch the late evening news on this local CBS station. What is the critical value if
the level of significance is 0.10?
A. -1.282
B. 1.645
C. -2.576
D. +2.576
The following table classifies 100 individuals using two variables, gender and college
attended.
What is this two-way classification called?

A. Goodness-of-fit test
B. Frequency table
C. ANOVA table
D. Contingency table
The time to fly between New York City and Chicago is uniformly distributed with a
minimum of 120 minutes and a maximum of 150 minutes. What is the distribution’s
mean?
A. 120 minutes
B. 150 minutes
C. 135 minutes
D. 270 minutes
A manufacturer of automobile transmissions uses two different processes. Management
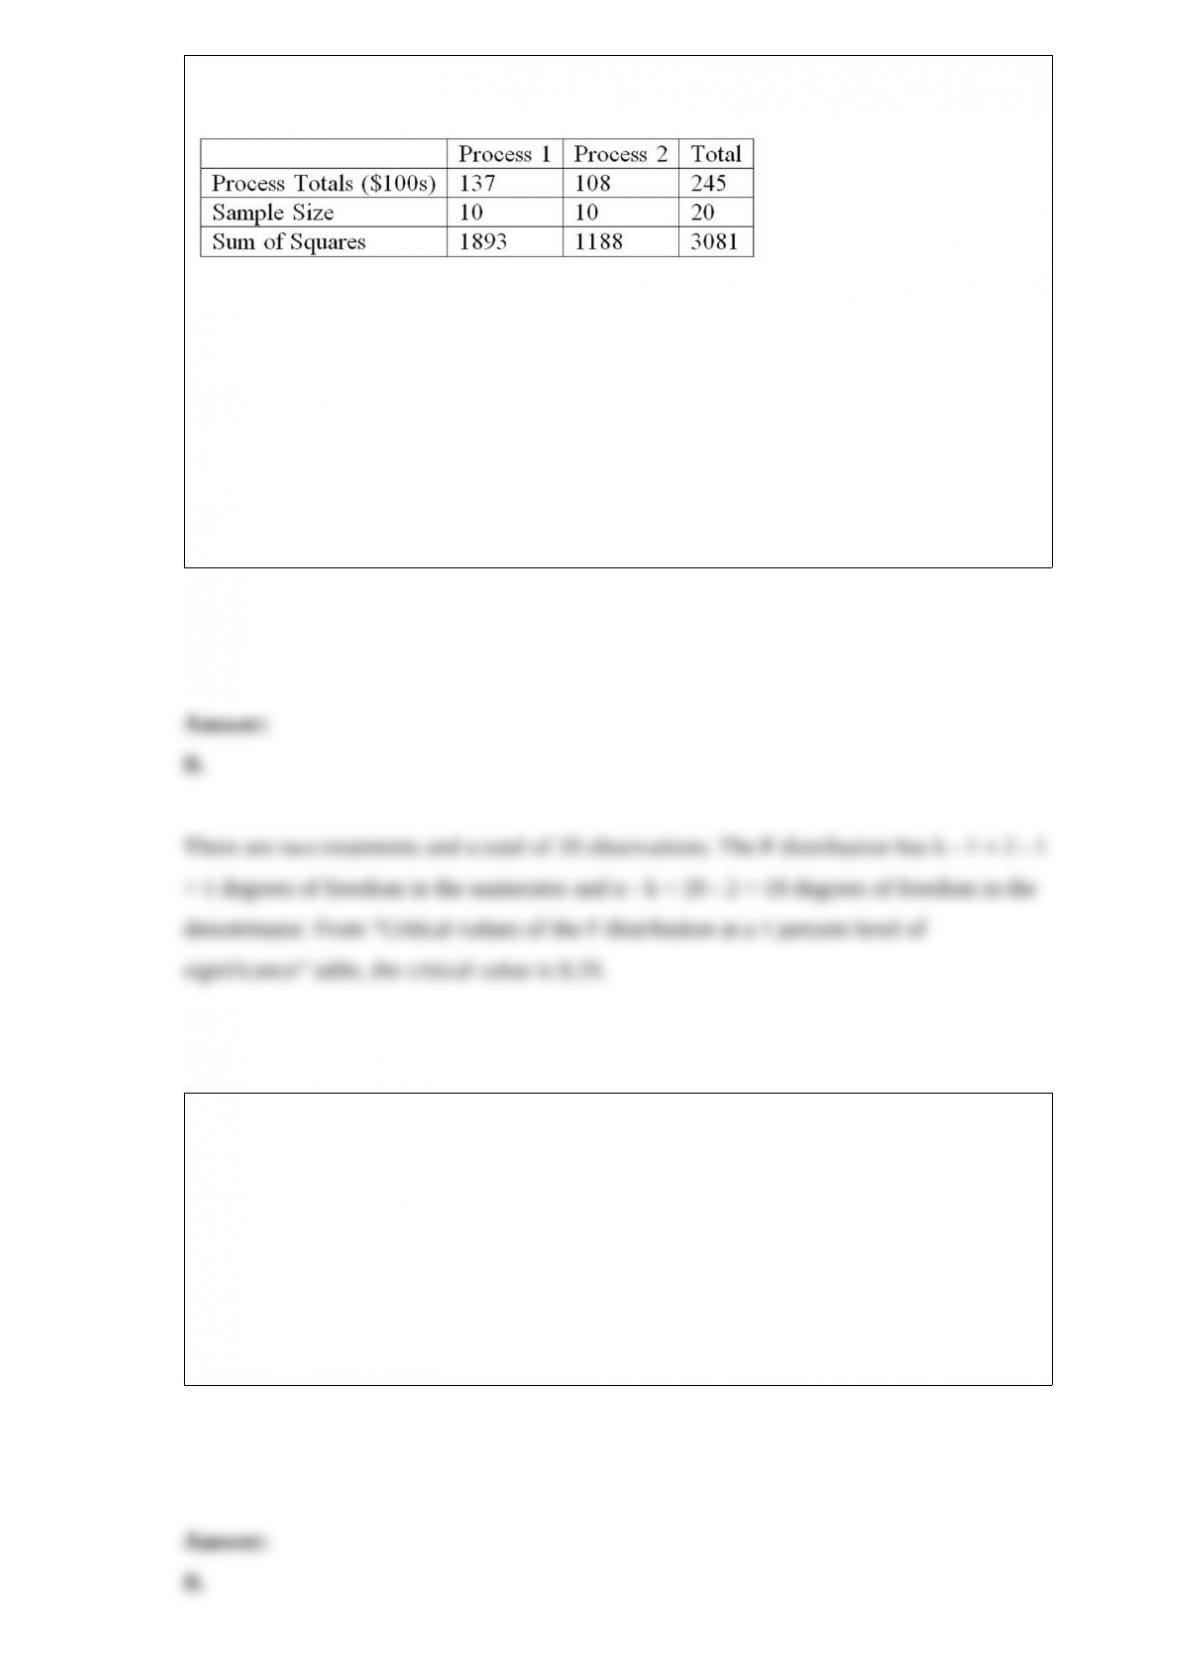
ordered a study of the production costs to see if there is a difference between the two
processes. A summary of the findings is shown next.
What is the critical value of F at the 1% level of significance?
A. 9.46
B. 8.29
C. 8.18
D. 4.61
A confidence interval for a population mean __________.
A. Estimates the population range
B. Estimates a likely interval for a population mean
C. Estimates likelihood or probability
D. Estimates the population standard deviation
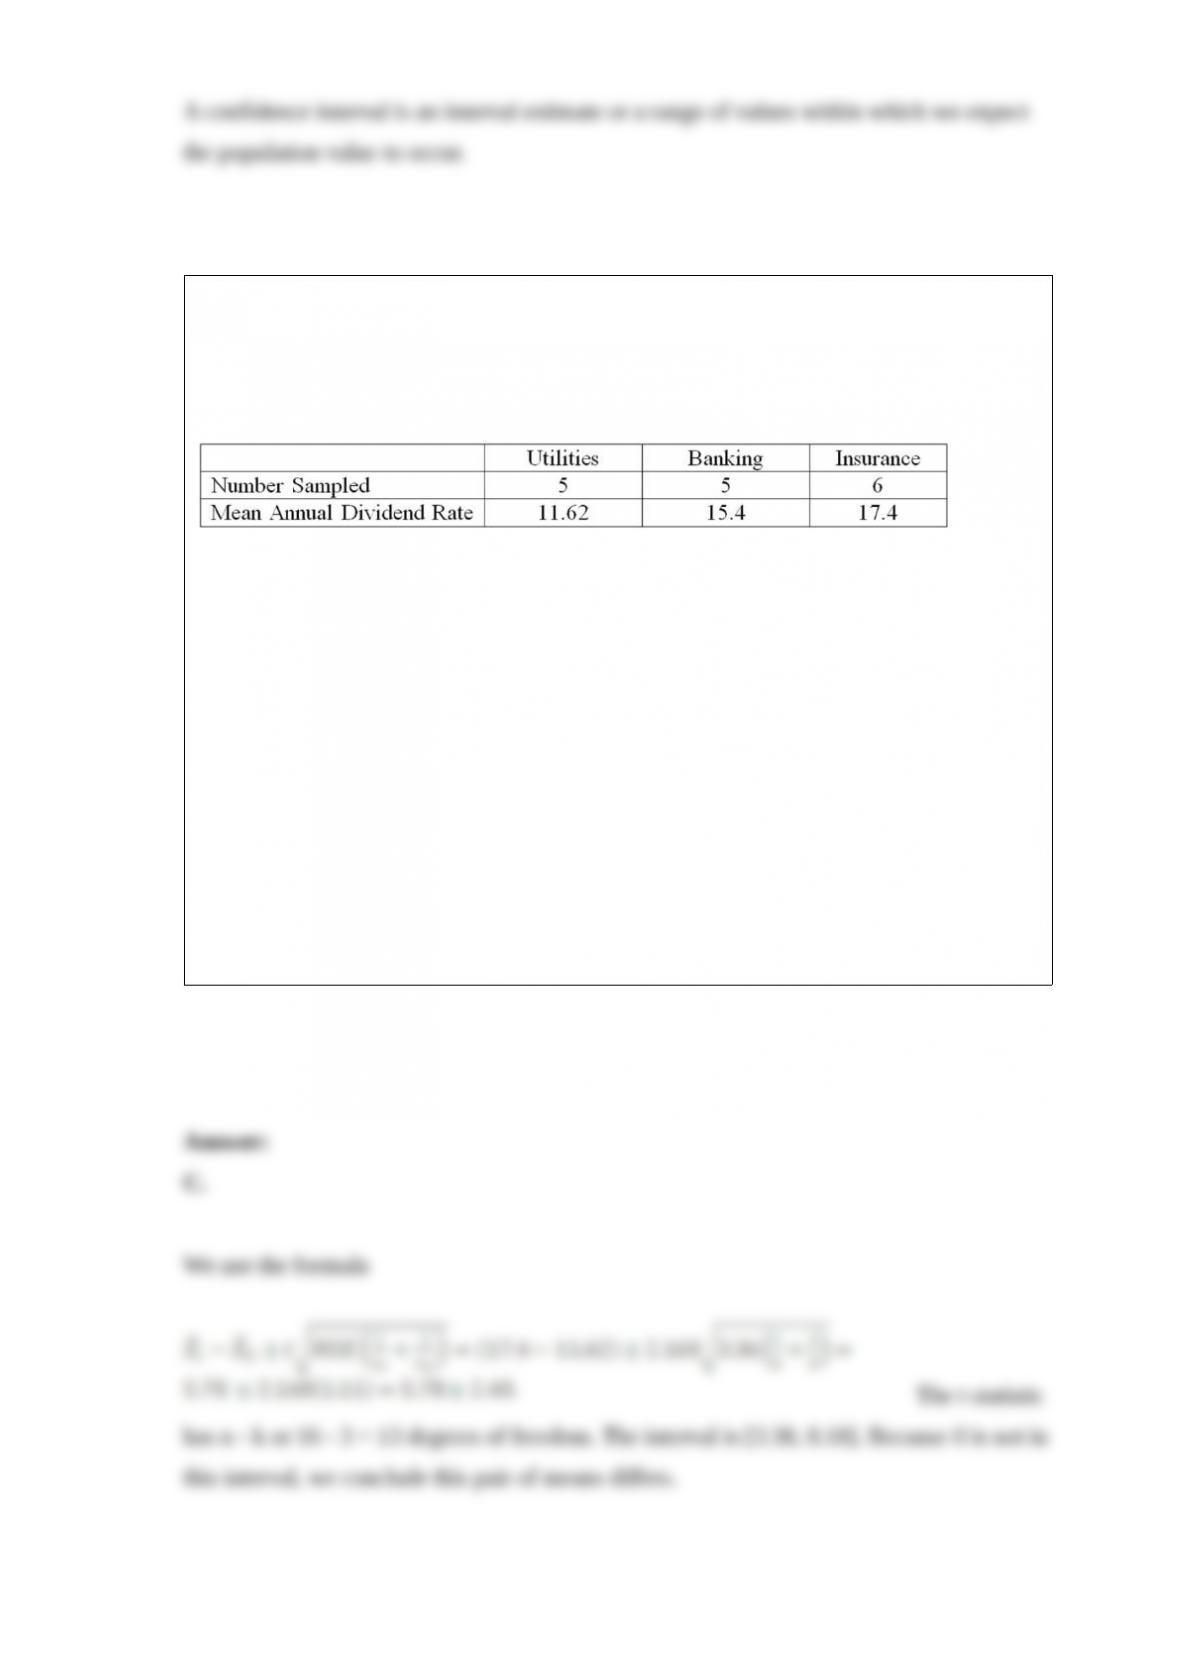
The annual dividend rates for a random sample of 16 companies in three different
industries, utilities, banking, and insurance were recorded. The ANOVA comparing the
mean annual dividend rate among three industries rejected the null hypothesis that the
dividend rates were equal. The Mean Square Error (MSE) was 3.36. The following
table summarized the results:
Based on the comparison between the mean annual dividend rate for companies in the
utilities and insurance industries, _______________________.
A. A confidence interval shows that the mean annual dividend rates are not significantly
different
B. The ANOVA results show that the mean annual dividend rates are significantly
different
C. A confidence interval shows that the mean annual dividend rates are significantly
different
D. The ANOVA results show that the mean annual dividend rates are not significantly
different

For a standard normal distribution, what is the probability that z is greater than 1.75?
A. 0.0401
B. 0.0459
C. 0.4599
D. 0.9599
The result of a particular experiment is called a(n) ___________.
A. Observation
B. Conditional probability
C. Event
D. Outcome

Probabilities are important information when __________.
A. Summarizing a data set with a frequency chart
B. Applying descriptive statistics
C. Computing cumulative frequencies
D. Using inferential statistics
Two samples, one of size 14 and the second of size 13, are selected to test the difference
between two population means. How many degrees of freedom are used to find the
critical value? Assume the population standard deviations are equal.
A. 27
B. 26
C. 25
D. 14

To locate the percentile for a given observation in a data set, the data must be
___________.
A. Sorted and listed from the minimum to the maximum values
B. Displayed in a histogram
C. Summarized in a frequency distribution
D. Distributed symmetrically around the mean
A group of statistics students decided to conduct a survey at their university to find the
average (mean) amount of time students spent studying per week. They sampled 240
students and found a mean of 22.3 hours per week. Assuming a population standard
deviation of six hours, what is the 99% level of confidence?
A. [21.80, 22.80]
B. [16.3, 28.3]
C. [21.30, 23.30]
D. [20.22, 22.0]

A null hypothesis makes a claim about a __________.
A. Population parameter
B. Sample statistic
C. Sample mean
D. Type II error
Describe the uniform distribution.
You have the assignment of designing color codes for different parts. Three colors are
used to code on each part. Once a combination of three colors is usedsuch as green,
yellow, and redthese three colors cannot be rearranged to use as a code for another part.
If there are 35 combinations, how many colors were available?
A. 5
B. 7
C. 9

D. 11
A random sample of 42 college graduates revealed that they worked an average of 5.5
years on the job before being promoted. The sample standard deviation was 1.1 years.
Using the 0.99 degree of confidence, what is the confidence interval for the population
mean?
A. 5.04 and 5.96
B. 5.06 and 5.94
C. 2.67 and 8.33
D. 4.40 and 6.60
A survey of property owners’ opinions about a street-widening project was taken to
determine if owners’ opinions were related to the distance between their home and the
street. A randomly selected sample of 100 property owners was contacted and the
results are shown next.

What is the critical value at the 5% level of significance?
A. 7.779
B. 9.488
C. 9.236
D. 11.070
An example of a qualitative variable is _________________.
A. Number of children in a family
B. Weight of a person
C. Color of ink in a pen
D. Miles between oil changes

It is claimed that in a bushel of peaches, less than 10% are defective. A sample of 400
peaches is examined and 50 are found to be defective. What is the z-test statistic?
A. +0.125
B. +0.278
C. -1.645
D. +1.667
The first three class marks for a frequency distribution of “weights of college men”
recorded to the nearest pound are 105, 115, and 125.
What is the class interval?

The following frequency distribution shows the distribution of delivery times (in days)
for swimstuff.com customer orders during the last month.
What is the relative frequency of the orders delivered from 1 day up to 3 days?
How is the central limit theorem helpful when computing probabilities?
The Sea Mist Hotel collects customer satisfaction data daily. Yesterday, the hotel was
99% occupied and the manager wanted to quickly assess customer satisfaction. She
randomly selected 10 scores. The maximum score is 100 points. The mean score is
82.1. The 10 scores were:
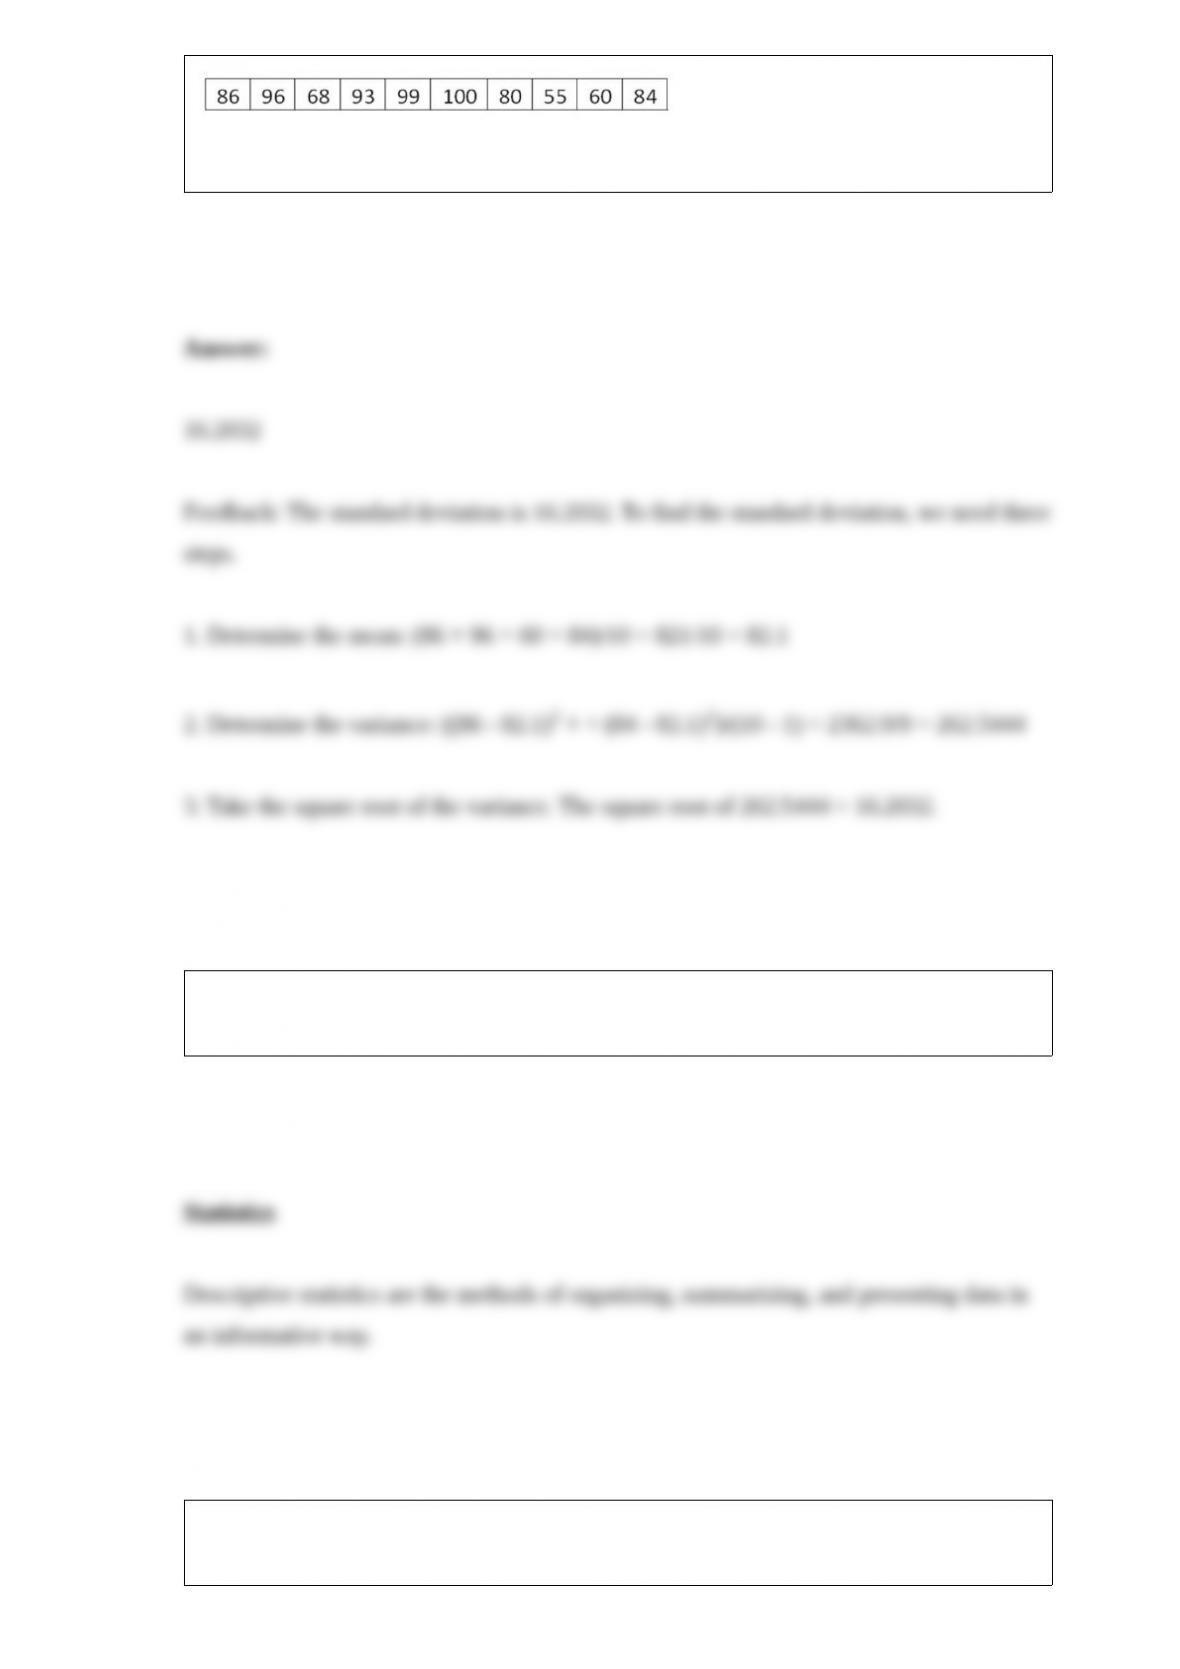
What is the standard deviation?
The science of collecting, organizing, presenting, analyzing, and interpreting data is
called __________________.
The probability that a flipped coin will show heads on four consecutive flips is
_______________.
The American Auto Association reports the mean price per gallon of regular gasoline is
$3.10, with a population standard deviation of $0.20. Assume a random sample of 16
gasoline stations is selected and their mean cost for regular gasoline is computed. What
is the probability that the sample mean is between $2.98 and $3.12?
If there is perfect correlation, the value of the correlation coefficient is __________.
Elly’s Hotdog Emporium is famous for its chilidogs. Elly’s latest sales indicate that 30%
of the customers order their chilidogs with hot peppers. Suppose 15 customers are
selected at random. What is the probability that exactly 10 customers will ask for hot
peppers?
In a relative frequency distribution, the sum of the relative class frequencies is
_____________________.
The branch of statistics that collects, analyzes, and presents data is called
_____________ statistics.

Assuming a normal population with a known population standard deviation, the z
statistic for a 99% confidence interval would be ______.
In a contingency table analysis, the decision to reject the null hypothesis is based on a
__________ test statistic.
A sum of squares divided by its corresponding degrees of freedom is called a
________________.
When applying the stepwise regression technique, _________ independent is included
in the first multiple regression model.
The sum of the deviations of each value from the mean is ___.