
What impact might a decrease in the U.S. federal budget deficit have on interest rates
and exchange rates in the market for the U.S. dollar? (Assume the exchange rate is
stated in terms of foreign currency per U.S. dollar.)
A) Interest rates and exchange rates increase.
B) Interest rates increase and exchange rates decrease.
C) Interest rates decrease and exchange rates increase.
D) Interest rates and exchange rates decrease.
When exchange rates are not determined in the market but are instead set by a country’s
central bank, we say that the country’s exchange rate is
A) flexible.
B) fixed.
C) a nominal exchange rate.
D) a real exchange rate.
Which of the following istrue about the consumer price index?
A) It accounts for people switching to goods whose prices have fallen.
B) It assumes that consumers purchase the same amount of each product in the market
basket each month.

C) It frequently updates the price changes of new products added to the market basket,
as these have a tendency to fall.
D) It filters out the part of price increases that occurs because of quality improvements
in products.
At a price of $100, Beachside Canoe Rentals rented 11 canoes. When it increased its
rental price to $125, 9 canoes were rented. Calculate the absolute value of the price
elasticity of demand for canoe rentals, using the midpoint formula.
A) 2
B) 1.25
C) 0.9
D) 0.75
Which of the following is a true statement?
A) excess reserves = actual reserves – required reserves
B) excess reserves = deposits – required reserves
C) excess reserves = deposits – loans
D) excess reserves = loans – required reserves
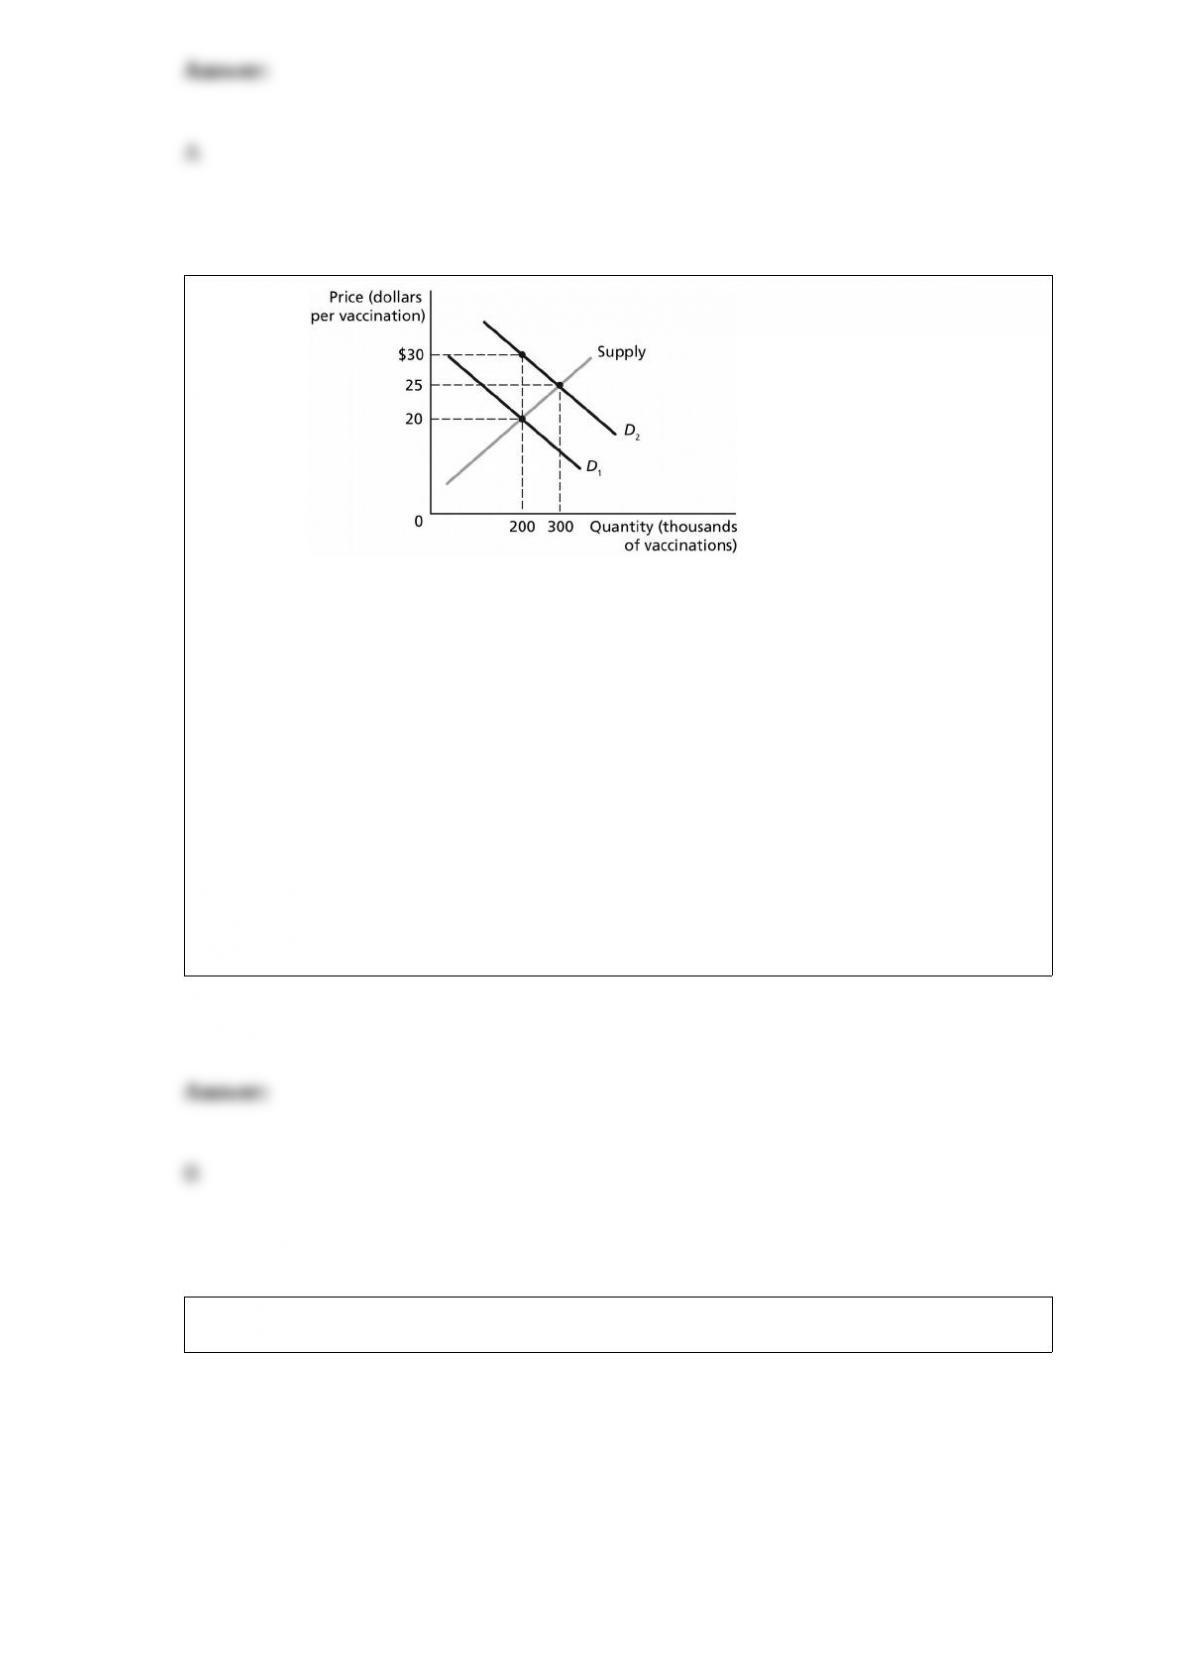
Figure 7-1 Figure 7-1 represents the
market for vaccinations. Vaccinations are considered a benefit to society, and the figure
shows both the marginal private benefit and the marginal social benefit from
vaccinations.
Marginal social benefit is represented by which curve?
A) D1
B) D2
C) Supply
D) All of the above represent marginal social benefit.
Table 19-3
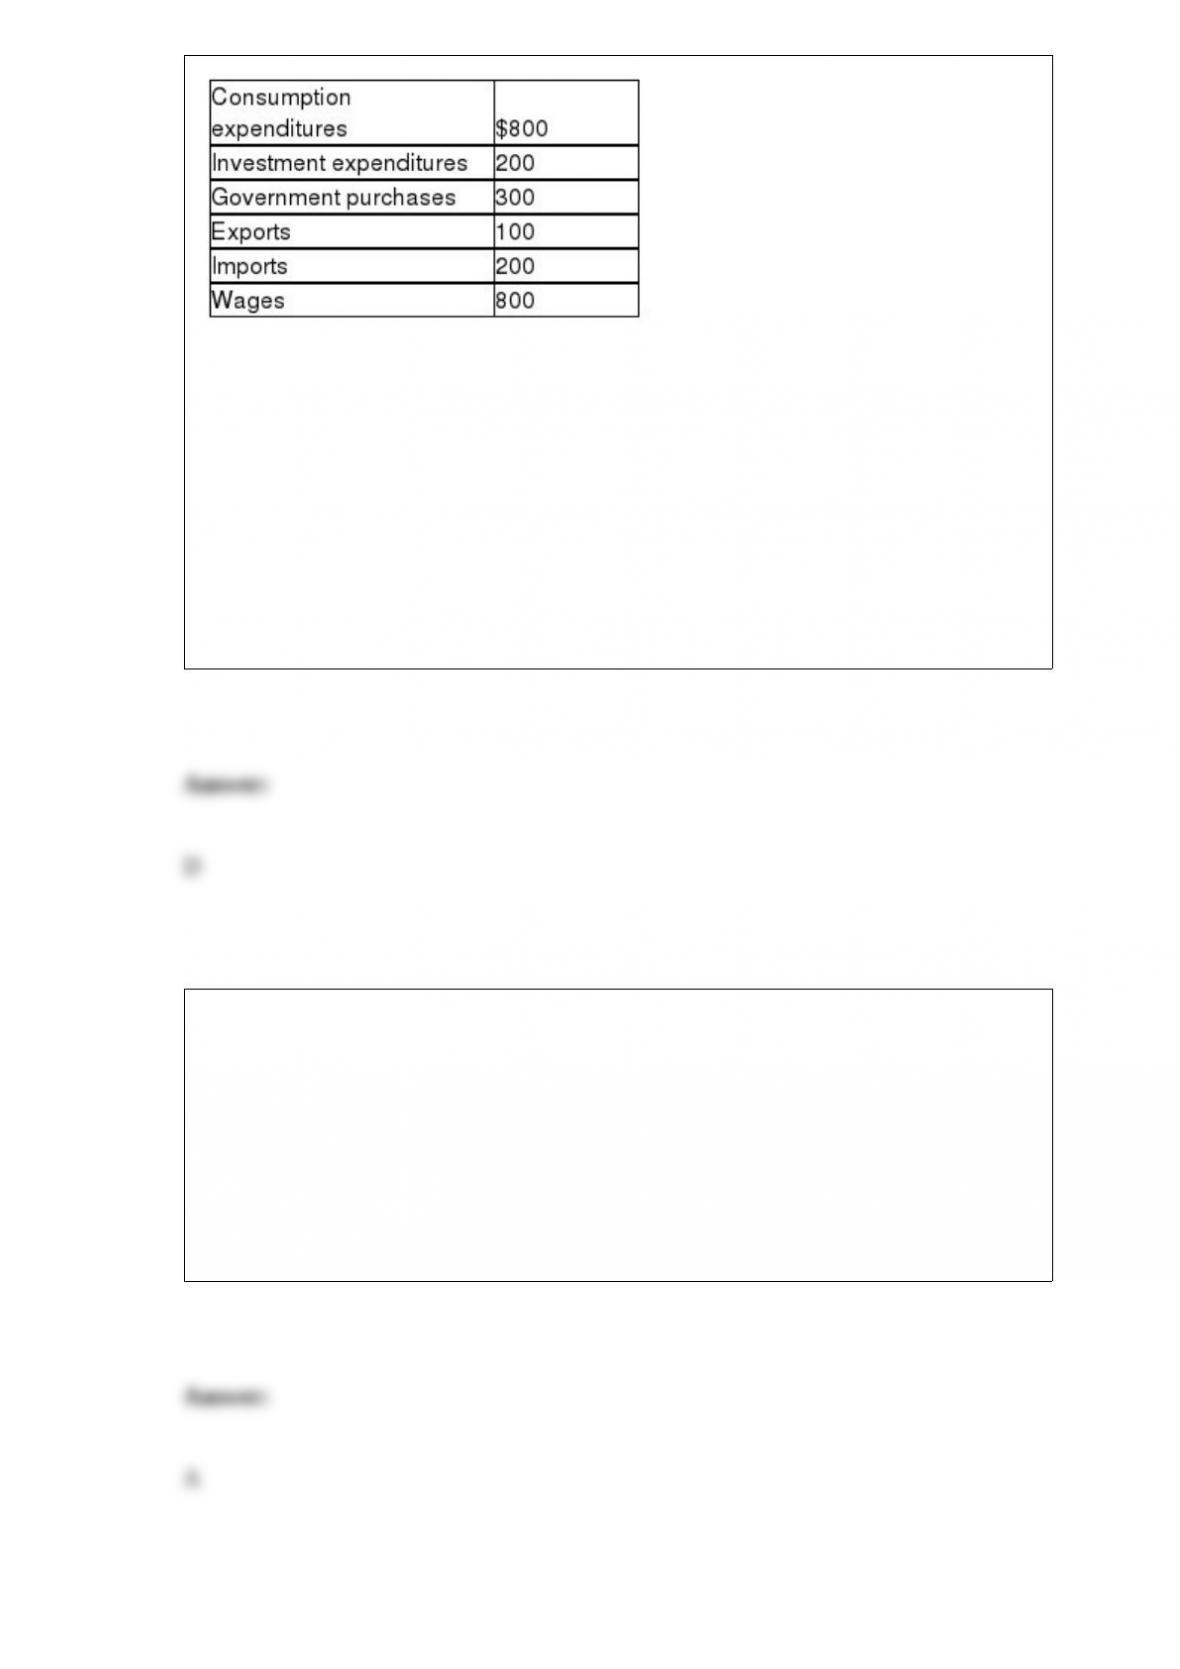
Consider the data above (in billions of dollars) for an economy: Gross domestic product
(in billions of dollars) for this economy equals
A) $2,200.
B) $1,600.
C) $1,400.
D) $1,200.
If banks do not loan out all their excess reserves, then the real world multiplier is
A) smaller than 1/RR.
B) larger than 1/RR.
C) equal to 1/RR.
D) not related to 1/RR.

An increase in individual income taxes ________ disposable income, which ________
consumption spending.
A) increases; increases
B) increases; decreases
C) decreases; increases
D) decreases; decreases
Which of the following economists is best known for exploring the application of
economic analysis to human resources issues?
A) Edward Lazear
B) Claudia Goldin
C) David Hammermesh
D) Alan Krueger
Table 2-19
Table 2-19 shows the output per month of two people, Wilma and Betty. They can either
devote their time to making marble statues or making marble benches.

Which of the following statements istrue?
A) Wilma has an absolute advantage in making both products.
B) Betty has an absolute advantage in making both products.
C) Betty has an absolute advantage in making statues and Wilma in making benches.
D) Betty has an absolute advantage in making benches and Wilma in making statues.
Market supply is found by
A) vertically summing the relevant part of each individual producer’s marginal cost
curve.
B) horizontally summing the relevant part of each individual producer’s marginal cost
curve.
C) vertically summing each individual producer’s average total cost curve.
D) horizontally summing each individual producer’s average total cost curve.
Which of the following is an example of a “how much” decision?
A) The Pleasantville movie theatre is open only in the evenings. The theatre’s manager
is debating whether to add daily matinee shows.
B) The Zhous have demolished their old home and are debating whether to build a
ranch-style house or a Craftsman home.
C) You’re planning to hold a graduation party and must decide between having your
party catered or having a pot-luck.
D) Chelsea has withdrawn from the swim team to take up a full-time job.
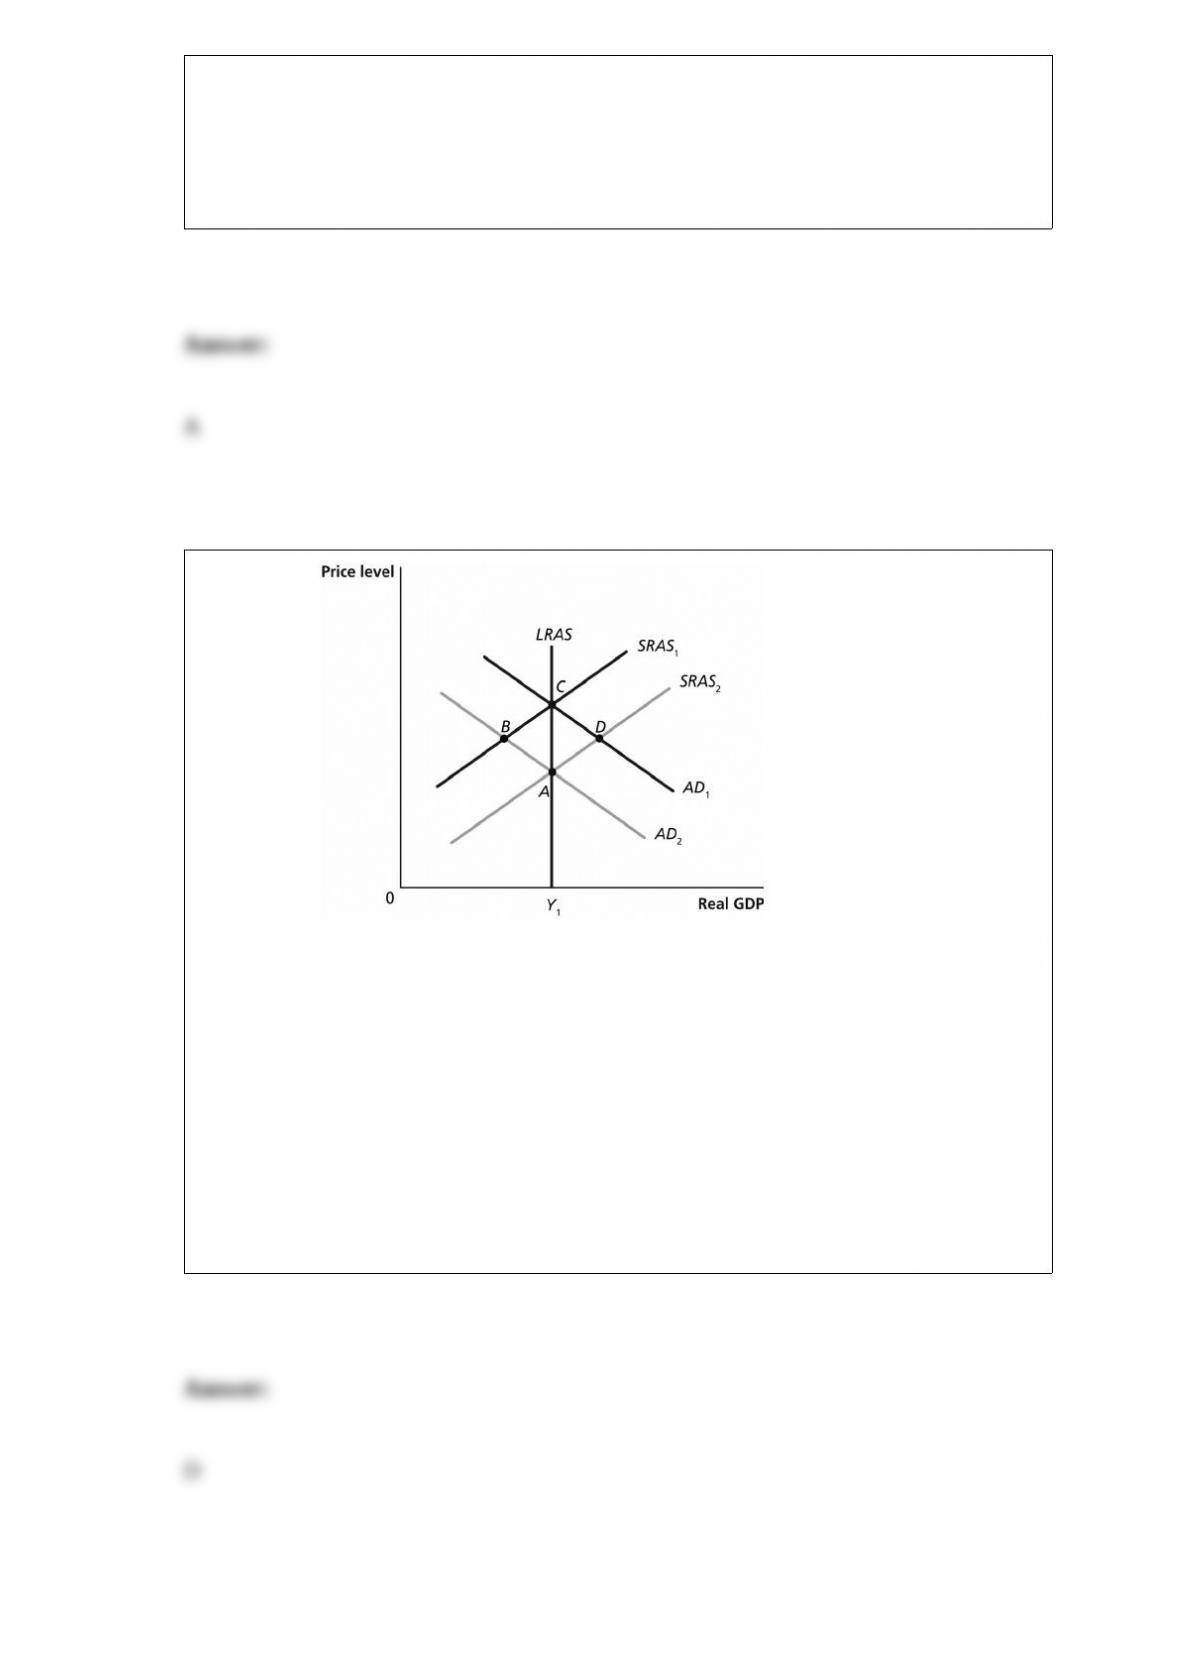
Figure 24-3
Which of the points in the above graph are possible short-run equilibria but not
long-run equilibria? Assume that Y1 represents potential GDP.
A) A and B
B) A and C
C) C and D
D) B and D