Unlock document.
This document is partially blurred.
Unlock all pages and 1 million more documents.
Get Access

In a large sample test about a single population median, it is appropriate to employ the
standard normal distribution so long as the population is also normally distributed.
A bank is interested in determining whether its customers' checking balances are
linearly related to their savings balances. A sample of n = 20 customers was selected
and the correlation was calculated to be +0.40. If the bank is interested in testing to see
whether there is a significant linear relationship between the two variables using a
significance level of .05, the correct null and alternative hypotheses to test are:
H0 : r = 0.0
Ha : r ≠ 0.0
Companies frequently use charts and graphs in their regular communications with
stockholders and investors; this shows the use of descriptive statistics.

A local bank has 1,400 checking account customers. Of these, 1,020 also have savings
accounts. A sample of 400 checking account customers was selected from the bank of
which 302 also had savings accounts. The sampling error in this situation is .0264.
A seasonally unadjusted forecast is one that is made from seasonal data without any
adjustment for the seasonal component in the time series.
Data collected using open-end questions is generally easier to analyze than data
collected from closed-end questions.
In order to assume that the sampling distribution for a proportion is approximately
normal, the population proportion must be very close to 0.50.

In order to apply the chi-square contingency methodology for quantitative variables, we
must first break the quantitative variable down into discrete categories.
A contract calls for the strength of a steel rod to stand up to pressure of 200 lbs per
square inch on average. The contract also requires that the variability in strength for
individual steel rods be no more than 5 pounds per square inch. If a random sample of n
= 15 rods is selected and the sample standard deviation is 6.7 pounds, the test statistic is
approximately χ2 = 25.138.
The Crystal Window Company makes windows at three locations: Reno, Las Vegas,
and Boise. Some windows made by the company contain a visible defect and must be
replaced. Each defect costs the company $45.00. The Reno plant makes 40 percent of
all windows while the Las Vegas and Boise plants split the remaining production
evenly. A recent quality study shows that 8 percent of the Reno windows contain a
defect, 11 percent of the Las Vegas windows contain a defect, while 4 percent of the
windows made in Boise have a defect. Once the windows are made, they are shipped to
a central warehouse where they are commingled and the location where they were made
is lost.
Based on this information the probability that a defective window was made by the
Boise plant is approximately 0.16.
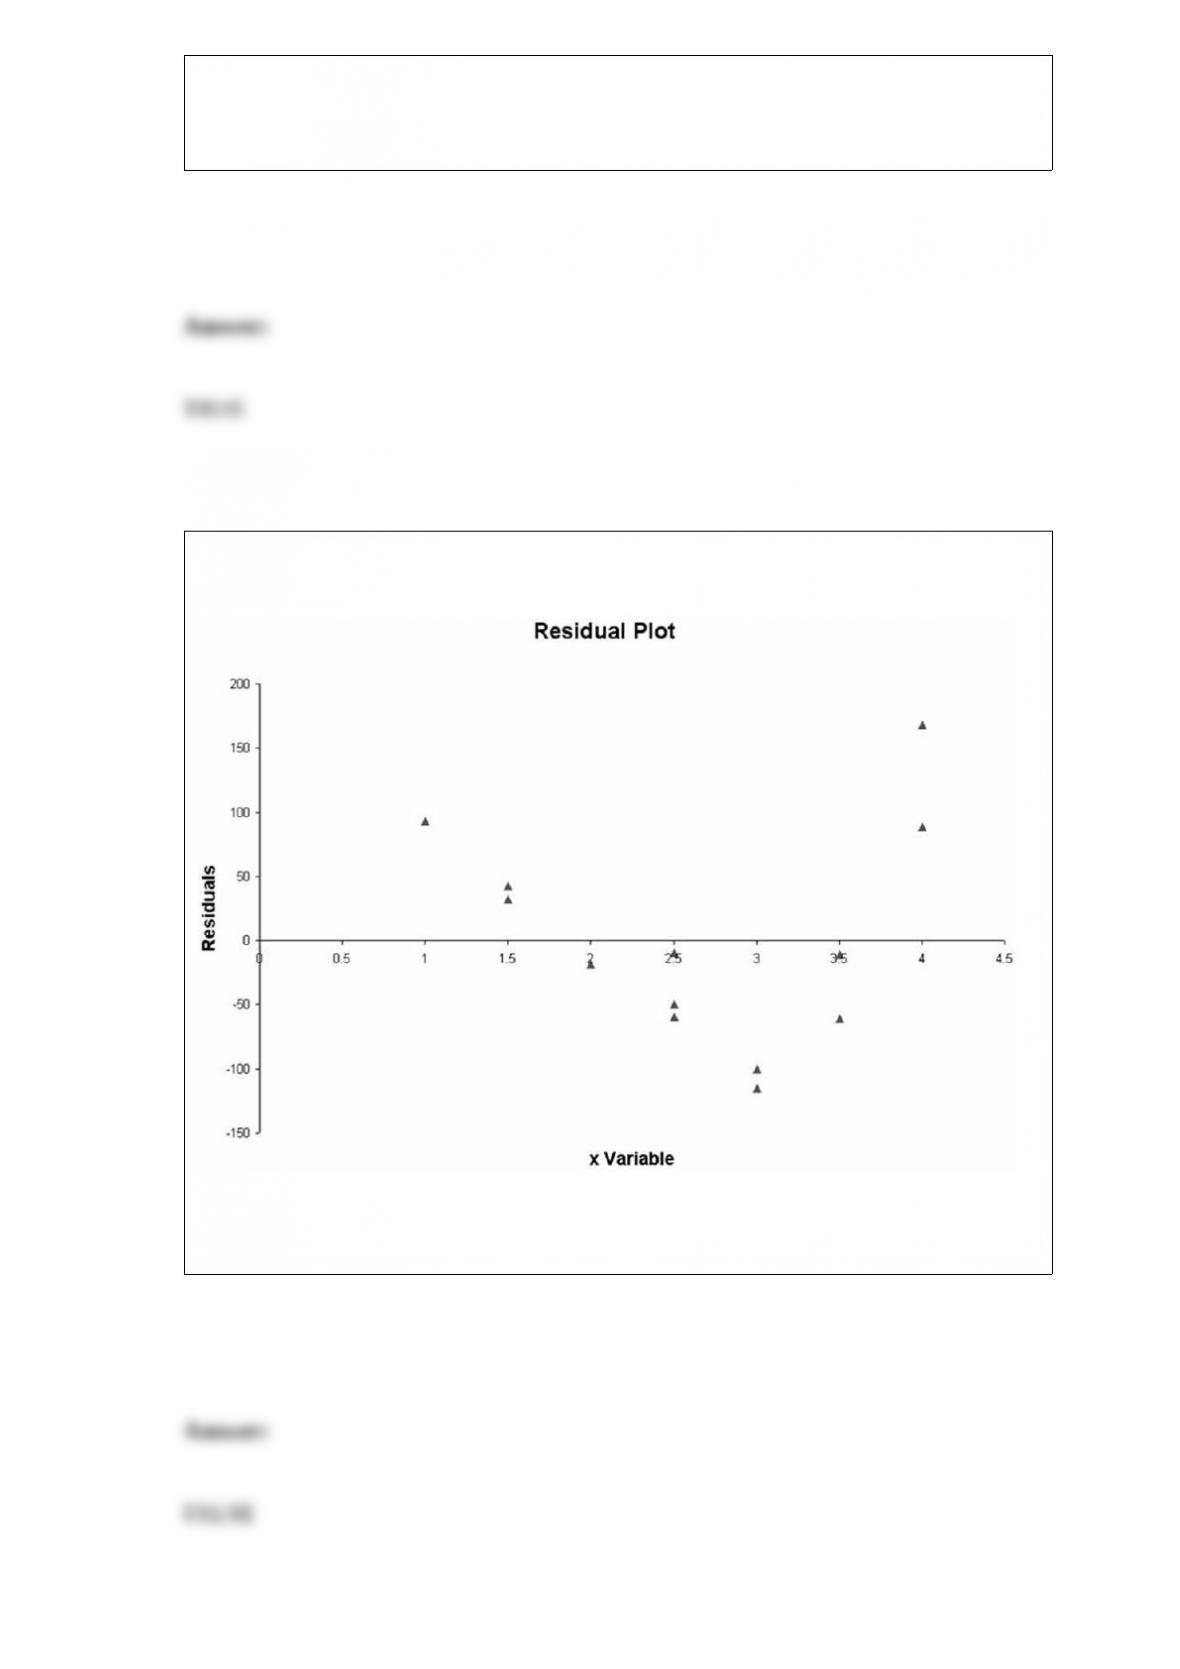
The following residual plot was constructed based on a simple linear regression model.
Based on this plot, there appears to be no basis for concluding that a curvilinear model
may be more appropriate than a linear model to explain the variation in the y variable.

The Sergio Lumber Company manufactures plywood. One step in the process is the one
where the veneer is dried by passing through a huge dryer (similar to an oven) where
much of the moisture in the veneer is extracted. At the end of this step, samples of
veneer are tested for moisture content. It is believed that pine veneer will be less moist
on average than will fir veneer. The hypothesis test that will be conducted using an
alpha = 0.05 level will be a two-tailed test.
An electronics repair shop has determined that the time between failures for a particular
electronic component part is exponentially distributed with a mean time between
failures of 200 hours. Based on this information, the probability that a part will not fail
in the first 200 hours is 0.50.
When news articles report on household income level they usually report the median
income, rather than the mean income. This would be because income is usually a
right-skewed distribution.

In playing the game Monopoly, the probability of a player landing on Park Place would
be assessed using classical probability assessment.
The correlation matrix is an effective means of determining whether any of the
independent variables has a curvilinear relationship with the dependent variable.
In a campaign speech, a candidate for governor stated that about 63 percent of the
people in the state were in favor of spending additional money on higher education.
After the speech, a polling agency surveyed a random sample of 400 people and found
234 people who favored more spending on higher education. Based on the candidate's
statement, the probability of finding 234 or fewer is approximately 0.97.
Assume a sample of size n = 12 has been collected. To perform a hypothesis test of a
population variance using a 0.05 level of significance, where the null hypothesis is:

H0: σ2 = 25
The upper tail critical value is 21.92.
A sales manager has five salespeople. The following are the number of units sold by the
five salespeople during the past week: {5, 13, 6, 2, 4}. Based on the data, the mean
number of units sold was 6 units.
In a recent study of the sales prices of houses in a Midwestern city, the mean sales price
has been reported to be $167,811 while the median sales price was $155,600. From this
information, you can determine that the data involved in the study are left-skewed.
The Good-Guys Car Dealership has tracked the number of used cars sold at its
downtown dealership. Consider the following data as representing the population of
cars sold in each of the 8 weeks that the dealership has been open.

The population range is 9.
The number of defects discovered in a random sample of 100 products produced at the
Berdan Manufacturing Company is binomially distributed with p = .03. Based on this,
the standard deviation of the number of defects per sample of size 100 is 2.91.
A dependent variable is the variable that we wish to predict or explain in a regression
model.
In determining the required sample size when estimating a population proportion, it is
necessary to start with some idea of what that proportion is.

In a single exponential smoothing model, finding the forecast value for each period
requires having the actual and forecast values from the proceeding period. This is not
possible for the first period, so for the first period one should use the actual value as the
forecast value.
Recently the State Fish and Game planted several thousand tagged fish in a local river.
The mean length of these fish, which constitute a population, is 12.6 inches. Yesterday,
fishermen caught 100 of these tagged fish. You could expect that the mean length for
these fish would be 12.6 inches as well since they come from the population.
A claim was recently made that stated that the median income for male and female
graduates is the same for those graduating with a degree in operations management. The
following sample data were collected:

In employing the Mann-Whitney U test, the sum of the ranks for the males is 53.5
The makers of furnace filters recently conducted a test to determine whether the median
number of particulates that would pass through their four leading filters was the same. A
random sample of 6 of each type of filter was used with the following data being
recorded:
The Kruskal-Wallis test can be used in this case since it requires that the sample sizes
be equal.

Because simple exponential smoothing models require a starting point for the first
period forecast that will be arbitrary, it is important to have as much data as possible to
dampen out the effect of the starting point.
Renton Industries makes replacement parts for the automobile industry. As part of the
company's capacity planning, it needs a long-range total demand forecast. The
following information was generated based on 10 years of historical data on total
number of parts sold each year.
Based on this information, the percent of variation in the number of parts sold that is
explained by the linear trend model is approximately 90.9.

One example of a difference between discrete random variables and continuous random
variables is that in a discrete distribution P(x > 2) = P(x ≥ 3) while in a continuous
distribution P(x > 2) is treated the same as P(x ≥ 2).
A report recently published in a major business periodical stated that the average salary
for female managers is less than $50,000. If we were interested in testing this, the
following null and alternative hypotheses would be established:
H0 : μ ≥ 50,000
Hα : μ < 50,000
If the correlation coefficient for two variables is computed to be a -0.70, the scatter plot
will show the data to be downward sloping from left to right.
Histograms cannot have gaps between the bars, whereas bar charts can have gaps.

According to data from the Environmental Protection Agency, the average daily water
consumption for a household of four people in the United States is approximately at
least 243 gallons. (Source:
http://www.catskillcenter.org/programs/csp/H20/Lesson3/house3.htm) Suppose a state
agency plans to test this claim using an alpha level equal to 0.05 and a random sample
of 100 households with four people.
State the appropriate null and alternative hypotheses.
A) H0 : μ > 243 Ha : μ ≤ 243
B) H0 : μ < 243 Ha : μ ≥ 243
C) H0 : μ ≤ 243 Ha : μ > 243
D) H0 : μ ≥ 243 Ha : μ < 243
Vegetables from the summer harvest are currently being processed at Skone and
Conners Foods, Inc. The manager has found a case of cans that has not been properly
sealed. There are three lines that processed cans of this type, and the manager wants to
know which line is most likely to be responsible for this mistake. Provide the manager
this information.
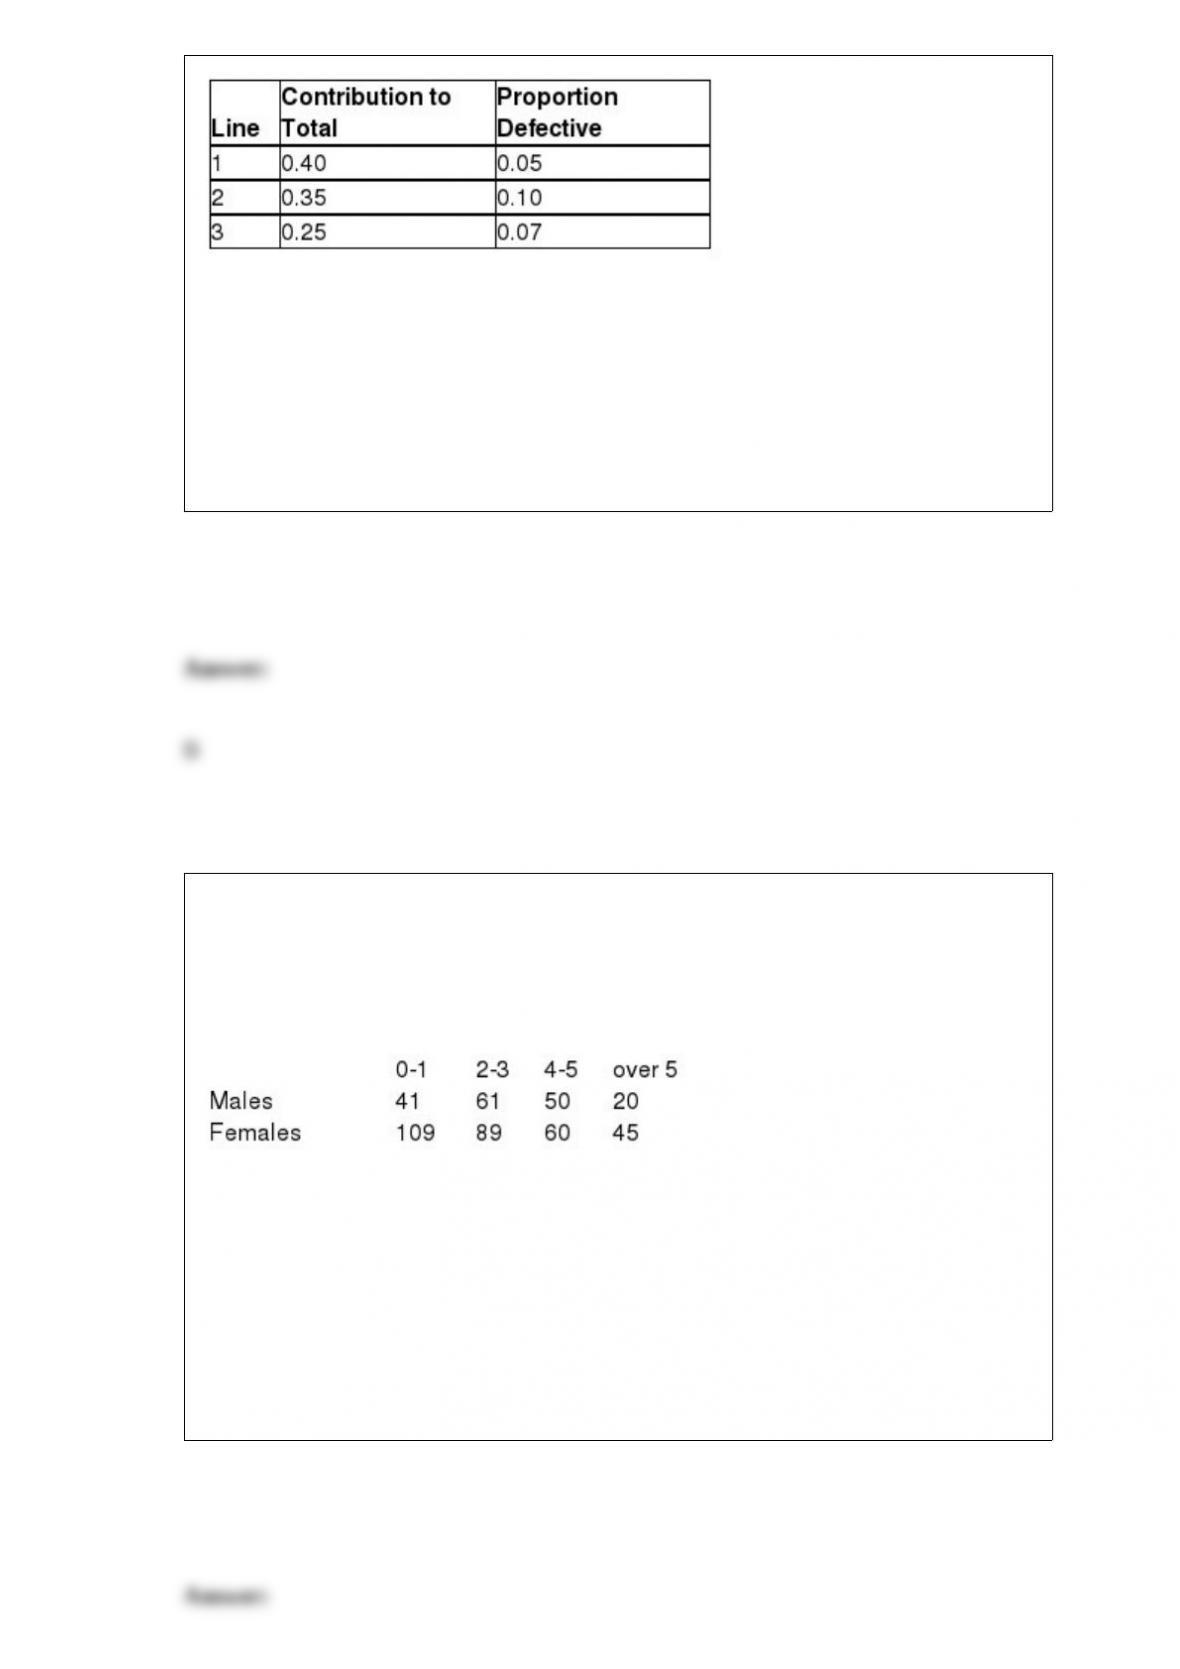
A) Line 1
B) Line 2
C) Line 3
D) Cannot be determined from this information
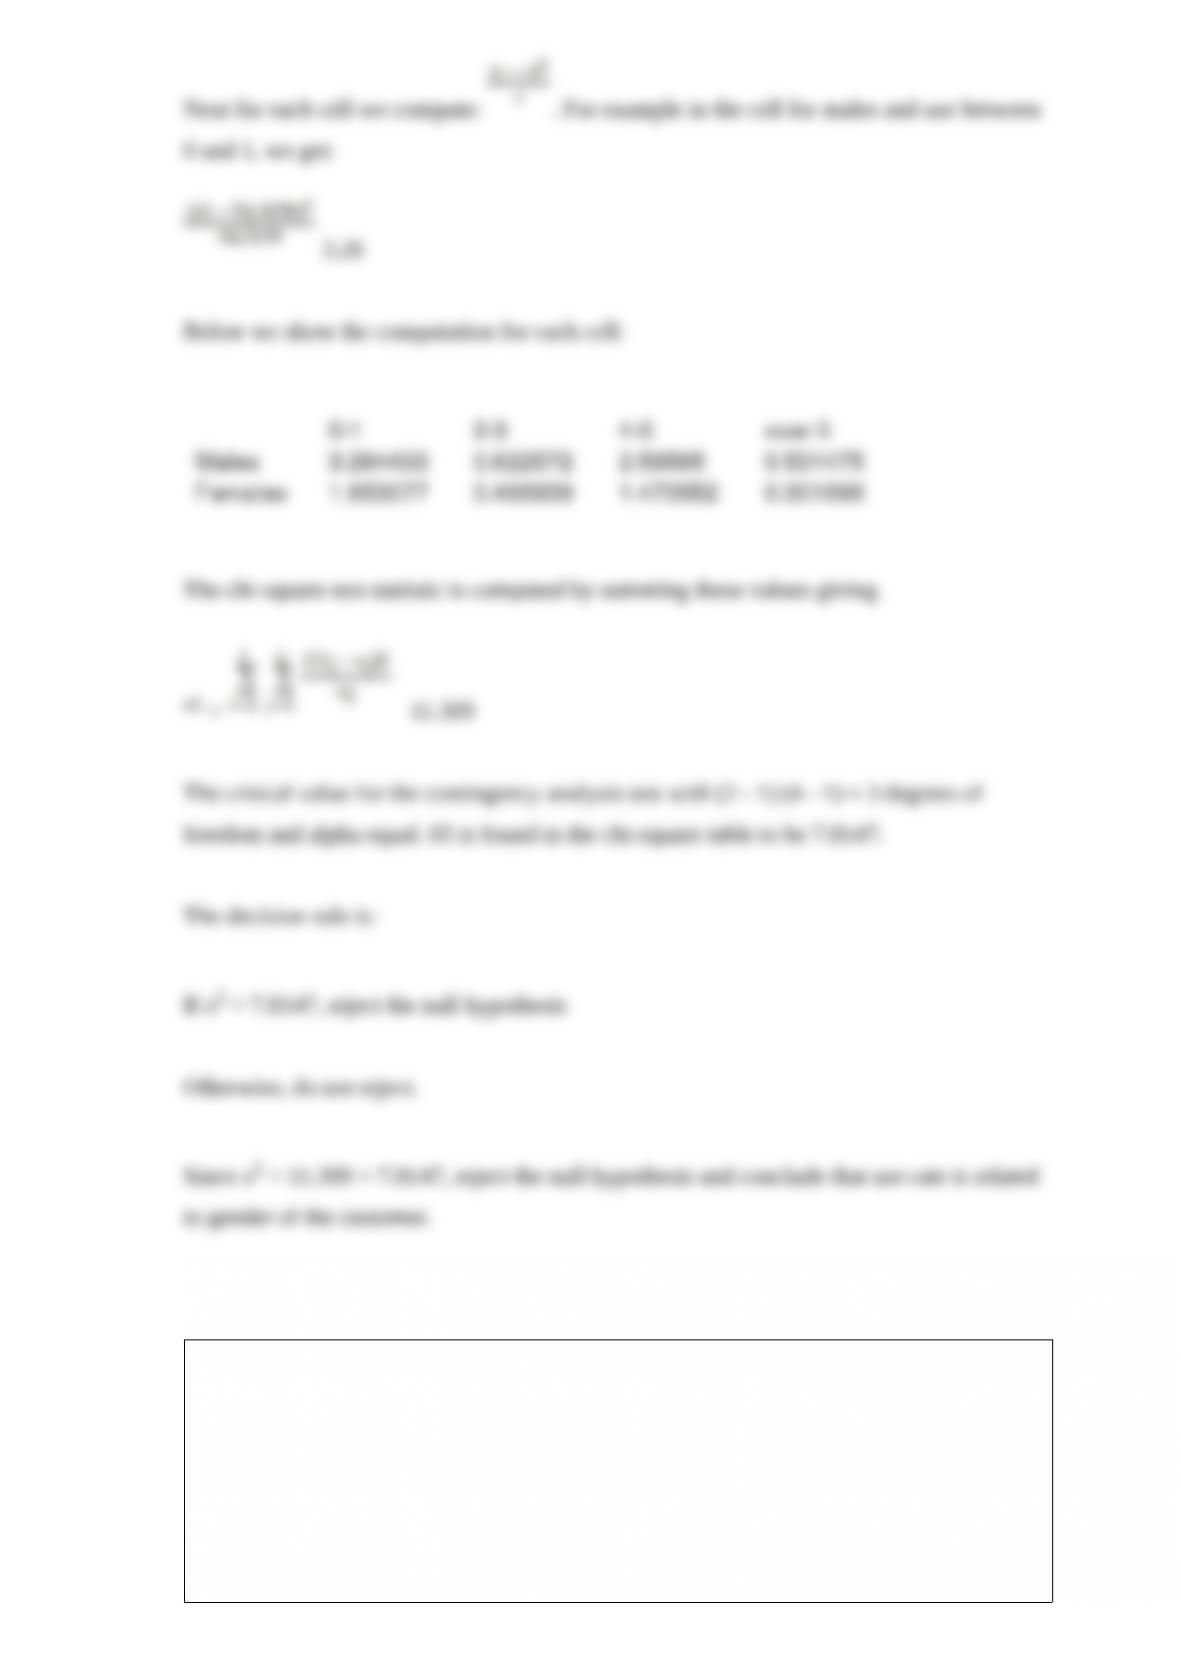
Recently a survey was conducted involving customers of a fitness center in Dallas,
Texas. Participants were asked to indicate how often they use the club by checking one
of the following categories: 0-1 time per week; 2-3 times per week; 4-5 times per week;
more than 5 times. The following data show how males and females responded to this
question.
One of the purposes of the survey was to determine whether there is a relationship
between the gender of the customer and the number of visits made each week.
a. State the appropriate null and alternative hypothesis.
b. What test procedure is appropriate to use to conduct this test?
c. Conduct the hypothesis test using an alpha = .05 level.
The x-bar chart is based on the principles of which distribution?
A) t-distribution
B) Chi square distribution
C) F distribution

D) Normal distribution
Consider the following partially completed computer printout for a regression analysis
where the dependent variable is the price of a personal computer and the independent
variable is the size of the hard drive.
Based on the information provided, what percentage of the variation in the price of the
personal computers is accounted for by the regression model using hard drive capacity
as the independent variable?
A) About 82 percent
B) About 67 percent
C) 217.75
D) About 66 percent

If cars arrive to a service center randomly and independently at a rate of 5 per hour on
average, what is the probability of 0 cars arriving in a given hour?
A) 0.1755
B) 0.0067
C) 0.0000
D) 0.0500
The following data reflect the number of customers who test drove new cars each day
for a sample of 20 days at the Redfield Ford Dealership.
Given these data, what is the range?
A) 14
B) 1
C) Approximately 3.08
D) 5.95

A recent study showed that the length of time that juries deliberate on a verdict for civil
trials is normally distributed with a mean equal to 12.56 hours with a standard deviation
of 6.7 hours. Given this information, what is the probability that a deliberation will last
between 10 and 15 hours?
A) Approximately 0.29
B) Nearly 0.75
C) About 0.48
D) About 0.68
The following regression output is available. Notice that some of the values are
missing.
Given this information, what percent of the variation in the y variable is explained by
the independent variable?
A) About 75 percent
B) Approximately 57 percent
C) Can't be determined without having the actual data available.
D) About 25 percent
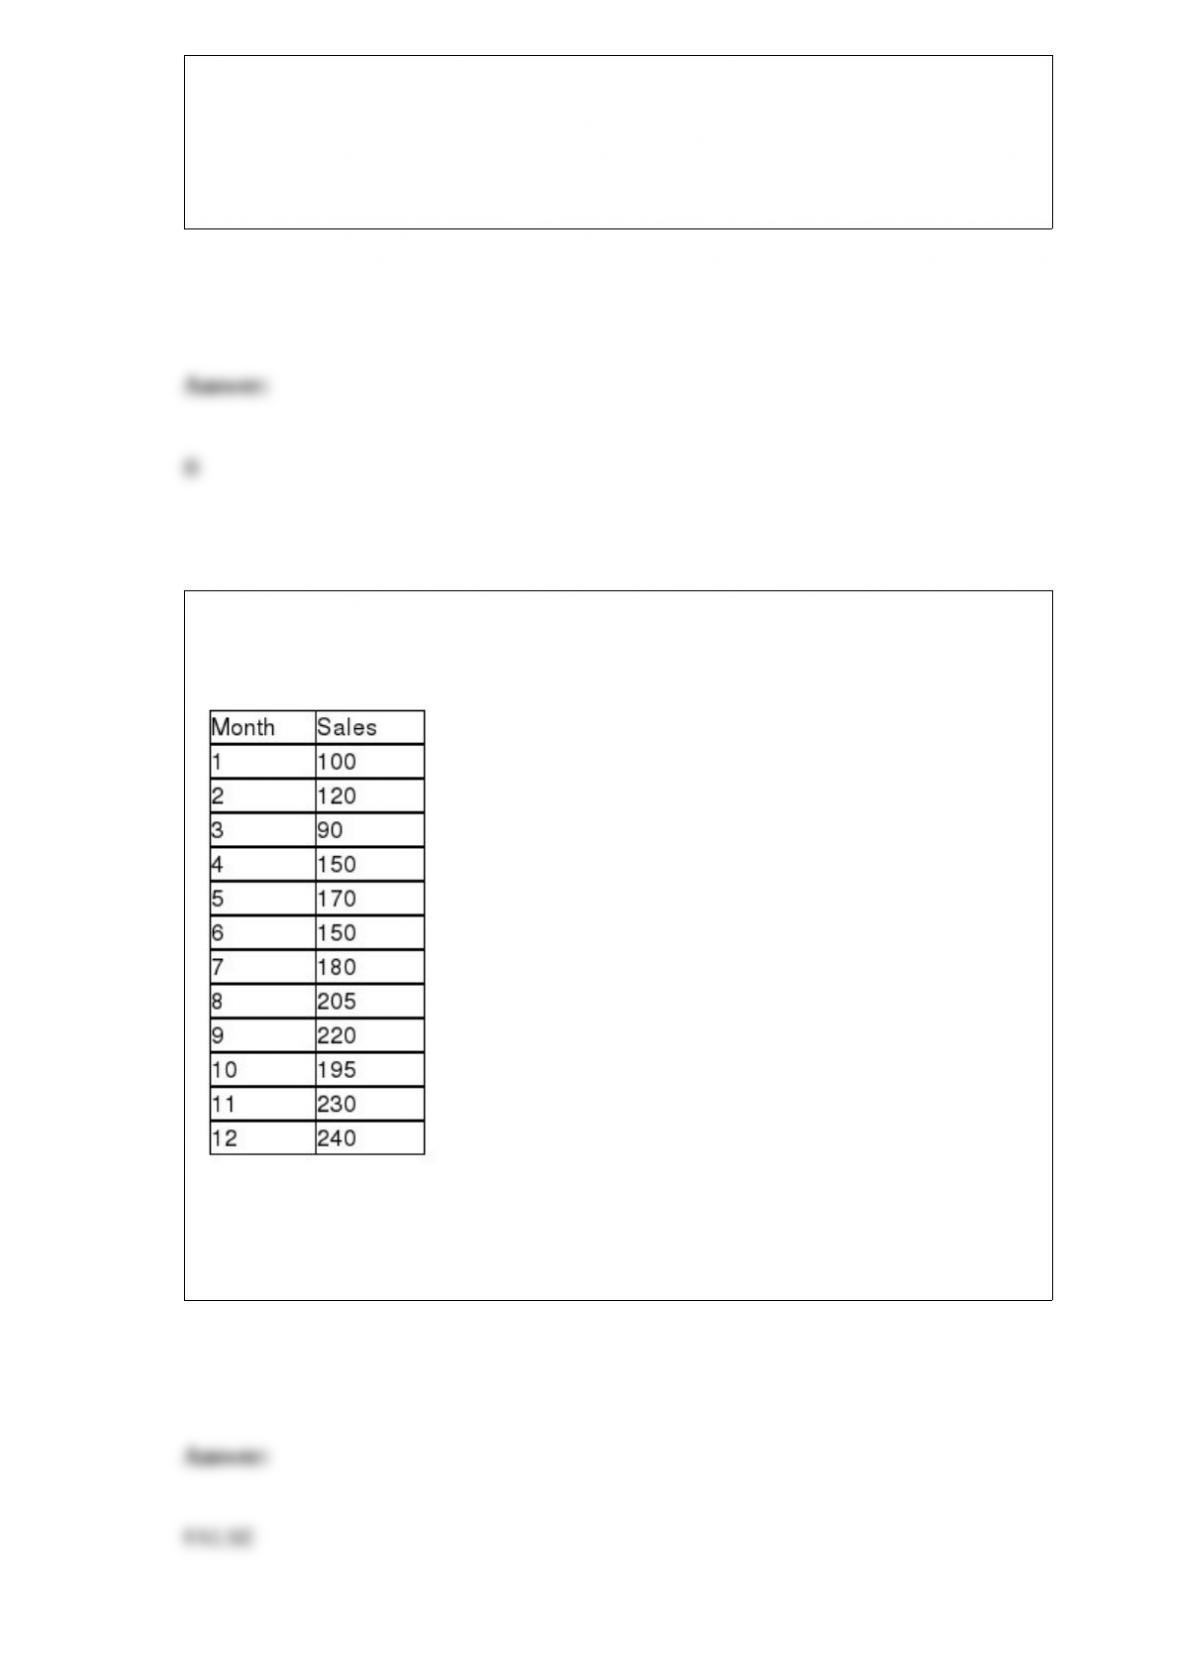
The Morgan Company is interested in developing a forecast for next month's sales. It
has collected sales data for the past 12 months.
After analyzing these data, if the company wishes to use exponential smoothing, it
should employ a single smoothing model since there is evidence of a linear trend in the
data.
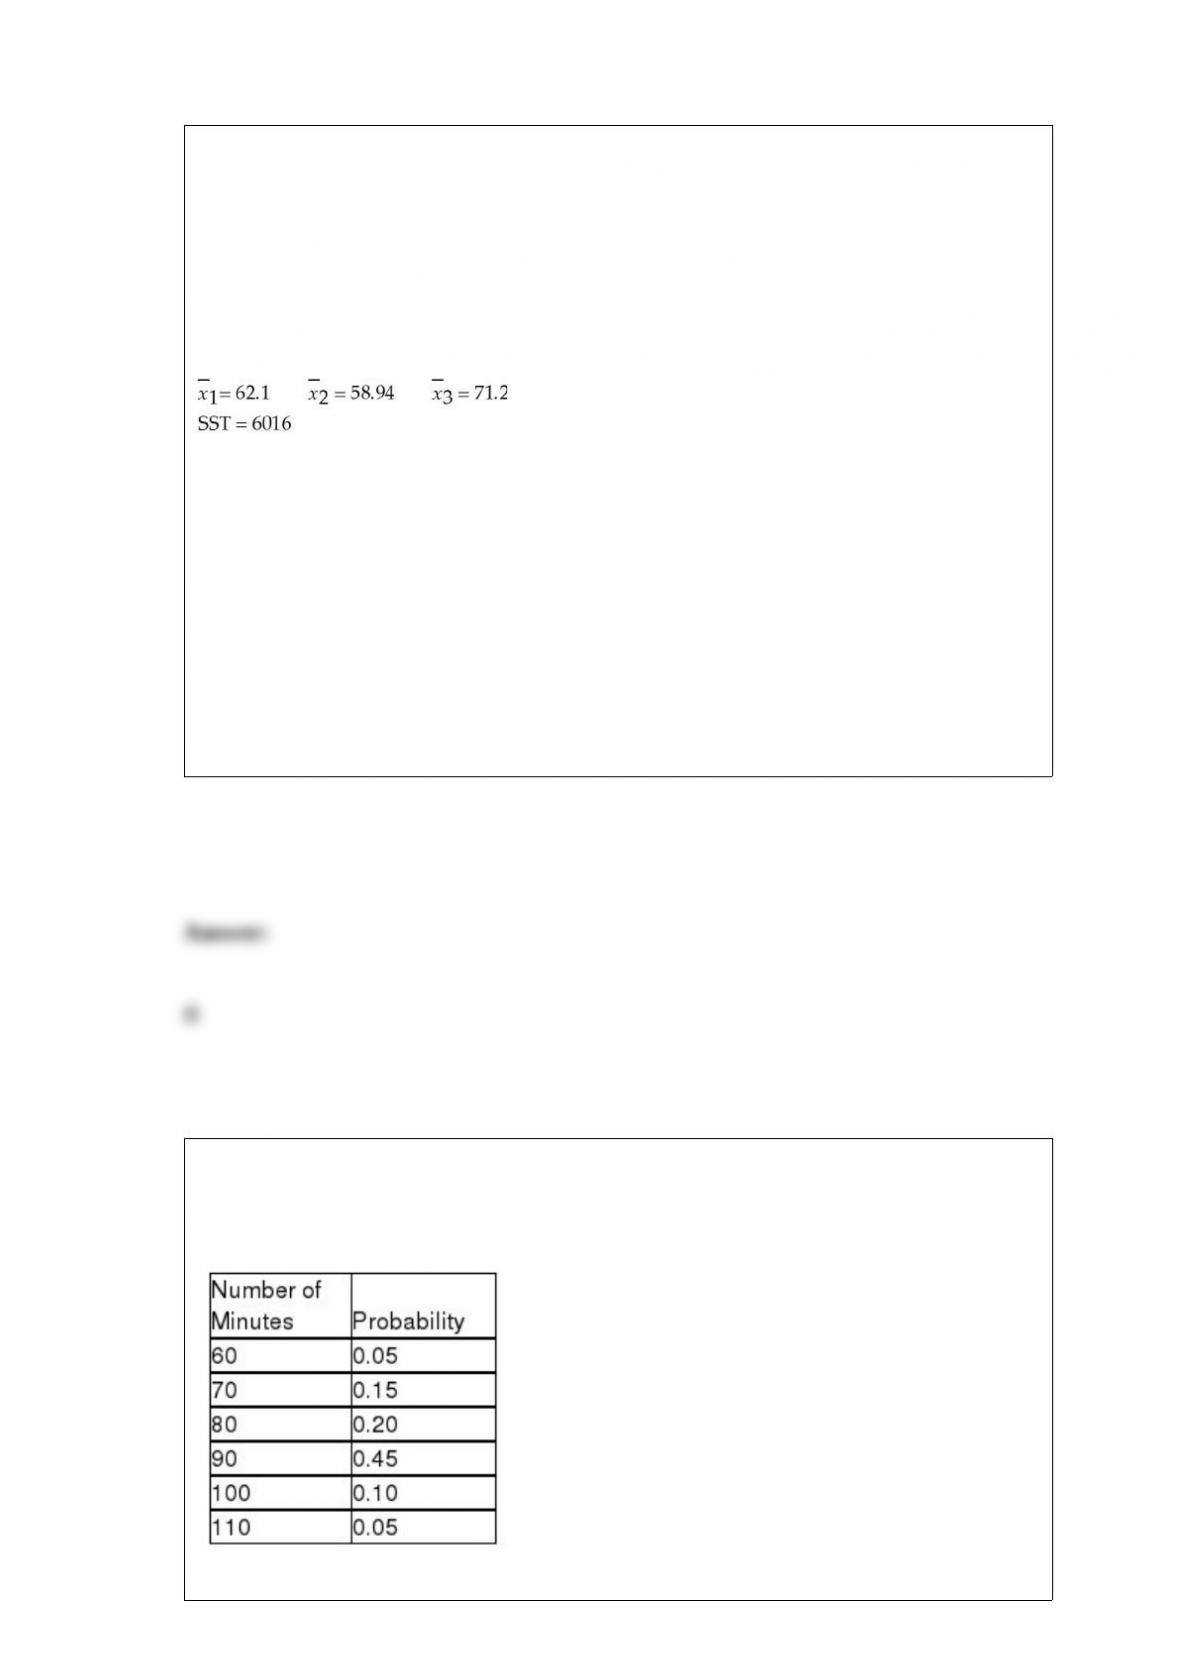
The State Transportation Department is thinking of changing its speed limit signs. It is
considering two new options in addition to the existing sign design. At question is
whether the three sign designs will produce the same mean speed. To test this, the
department has conducted a limited test in which a stretch of roadway was selected.
With the original signs up, a random sample of 30 cars was selected and the speeds
were measured. Then, on different days, the two new designs were installed, 30 cars
each day were sampled, and their speeds were recorded. Suppose that the following
summary statistics were computed based on the data:
Based on these sample results and a significance level equal to 0.05, assuming that the
null hypothesis of equal means has been rejected, the Tukey-Kramer critical range is:
A) 1.96.
B) approximately 4.0.
C) Can't be determined without more information
D) None of the above
Cramer's Bar and Grille in Dallas can seat 130 people at a time. The manager has been
gathering data on the number of minutes a party of four spends in the restaurant from
the moment they are seated to when they pay the check.

What is the variance and standard deviation?
A) Variance = 164.99, standard deviation = 12.84
B) Variance = 233.75, standard deviation = 15.89
C) Variance = 128.75, standard deviation = 11.35
D) Variance = 134.75, standard deviation = 11.61
If a manager believes that the required sample size is too large for a situation in which
she desires to estimate the mean income of blue collar workers in a state, which of the
following would lead to a reduction in sample size?
A) Reduce the level of confidence
B) Allow a higher margin of error
C) Somehow reduce the variation in the population
D) All of the above
Hono Golf is a manufacturer of golf products in Taiwan and China. One of the golf
accessories it produces at its plant in Tainan Hsing, Taiwan, is plastic golf tees. The
injector molder produces golf tees that are designed to have an average height of 66
mm. To determine if this specification is met, random samples are taken from the
production floor. One sample is contained in the file labeled THeight. If the hypothesis

test determines the specification is not being met, the production process will be shut
down while causes and remedies are determined. At times this occurs even though the
process is functioning to specification. What type of statistical error would this be?
A) The null hypothesis, the specification not being met, was not rejected when in fact it
was not being met, this is a Type II error.
B) The null hypothesis, the specification not being met, was not rejected when in fact it
was not being met, this is a Type I error.
C) The null hypothesis, the specification is being met, was rejected when in fact it was
being met, this is a Type II error.
D) The null hypothesis, the specification is being met, was rejected when in fact it was
being met, this is a Type I error.
A walk-in medical clinic believes that arrivals are uniformly distributed over weekdays
(Monday through Friday). It has collected the following data based on a random sample
of 100 days.
Based on these data, conduct a goodness-of-fit test using a 0.10 level of significance.
Which conclusion is correct?
A) Arrivals are not uniformly distributed over the weekday because (test statistic) >
(critical value).
B) Arrivals are uniformly distributed over the weekday because (test statistic) > (critical
value).
C) Arrivals are not uniformly distributed over the weekday because (test statistic) <

(critical value).
D) Arrives are uniformly distributed over the weekday because (test statistic) < (critical
value).
Residual analysis is conducted to check whether regression assumptions are met. Which
of the following is not an assumption made in simple linear regression?
A) Errors are independent of each other.
B) Errors are normally distributed.
C) Errors are linearly related to x.
D) Errors have constant variance.
If a binomial distribution applies with a sample size of n = 20, find the expected value,
n = 20, p = 0.20.
A) 2
B) 3
C) 4
D) 5

A hotel chain has four hotels in Oregon. The general manager is interested in
determining whether the mean length of stay is the same or different for the four hotels.
She selects a random sample of n = 20 guests at each hotel and determines the number
of nights they stayed. Assuming that she plans to test this using an alpha level equal to
0.05, which of the following is the appropriate alternative hypothesis?
A) H0 : μ1 = μ2 = μ3 = μ4
B) H0 : μ1 ≠ μ2 ≠ μ3 ≠ μ4
C) Not all population means are equal.
D) σ1 = σ2 = σ3 = σ4
A sample of people who have attended a college football game at your university has a
mean = 3.2 members in their family. The mode number of family members is 2 and the
median number is 2.0. Based on this information:
A) the population mean exceeds 3.2.
B) the distribution is bell-shaped.
C) the distribution is right-skewed.
D) the distribution is left-skewed.

Consider a random variable, z, that has a standardized normal distribution. Determine
P(0 < z < 1.96).
A) 0.1250
B) 0.5250
C) 0.3250
D) 0.4750
A professor wishes to develop a numerical method for giving grades. He intends to base
the grade on homework, two midterms, a project, and a final examination. He wishes
the final exam to have the largest influence on the grade. He wants the project to have
10%, each midterm to have 20%, and the homework to have 10% of the influence of
the semester grade.
Determine the weights the professor should use to produce a weighted average for
grading purposes.
A)
B)

C)
D)
A time-series plot that exhibits a general increase in value from the early periods to the
latest time periods:
A) most likely is exhibiting a cyclical component.
B) has a trend component present in the data.
C) will probably start to decline in a few periods.
D) has a seasonal component present in the data
When data are organized into levels, the highest data level is:
A) interval level data.
B) nominal level data.

C) ordinal level data.
D) ratio level data.
Nominal data is the highest level of data.
The following paired samples have been obtained from normally distributed
populations. Construct a 90% confidence interval estimate for the mean paired
difference between the two population means.
A) -571.92 ≤ μ ≤ -172.51
B) -487.41 ≤ μ ≤ -283.89
C) -812.21 ≤ μ ≤ -72.61

D) -674.41 ≤ μ ≤ -191.87
Long-time friends, Pat and Tom, agree on many things, but not the outcome of the
American League pennant race and the World Series. Pat is originally from Boston, and
Tom is from New York. They have a steak dinner bet on next year's race, with Pat
betting on the Red Sox and Tom on the Yankees. Both are convinced they will win.
What probability assessment technique is being used by the two friends?
A) Subjective probability
B) Classical probability
C) Relative frequency probability
D) Independent probability
Princess Cruises recently offered a 16-day voyage from Beijing to Bangkok during the
time period from May to August. The announced price, excluding airfare, for a room
with an ocean view or a balcony was listed as $3,475. Cruise fares usually are quite
variable due to discounting by the cruise line and travel agents. A sample of 20
passengers who purchased this cruise paid the following amounts (in dollars):
Determine the sampling error for this sample.

A) -$29.70
B) -$51.12
C) -$21.71
D) -$31.74
A company that fills soft drinks into bottles wishes to establish an -chart to monitor the
average fill level in the bottles. To do this, the company has taken a series of samples of
size n = 4 bottles. The overall average fill is 12.03 ounces. The average range for the
subgroups has been .06 ounces. Based on this information, what is the upper limit of the
3-sigma control limit?
A) .729
B) .0437
C) 12.09
D) 12.074
A major cell phone service provider has determined that the number of minutes that its
customers use their phone per month is normally distributed with a mean equal to 445.5
minutes with a standard deviation equal to 177.8 minutes. The company is thinking of
changing its fee structure so that anyone who uses the phone less than 250 minutes

during a given month will pay a reduced monthly fee. Based on the available
information, what percentage of current customers would be eligible for the reduced
fee?
A) About 36.4 percent
B) Approximately 52 percent
C) About 86.6 percent
D) About 13.6 percent
Dynamic random-access memory (DRAM) memory chips are made from silicon wafers
in manufacturing facilities through a very complex process called wafer fabs. The
wafers are routed through the fab machines in an order that is referred to as a recipe.
The wafers may go through the same machine several times as the chip is created. The
data file DRAM Chips contains a sample of processing times, measured in fractions of
hours, at a particular machine center for one chip recipe.
Calculate the 80th percentile for processing time.
A) 0.40 minutes
B) 0.35 minutes
C) 0.45 minutes
D) 0.20 minutes


