
According to the empirical rules of standard deviation in statistics, approximately 68%
of the observations will fall within three standard deviations of the mean.
AutoFilter creates filtering criteria based on the type of data being filtered.
A cyclical effect is one that repeats at fixed intervals of time, typically a year, month,
week, or day.
If the distribution of observations are such that mode < median < mean, the histogram
would be said to be negatively skewed.

If the Integer Tolerance is set to 0.01, the Solver will stop if it finds an integer solution
that is within 10% of the optimal solution.
Fewer groups provide a “coarser” histogram.
Rectilinear distance is the measure of distance as a straight line between two points.
The larger the variance, the more the data are spread out from the mean.

Linear optimization cannot be used on problems having multiple time periods.
Not specifying a Bin Range will not allow Excel to automatically determine bin values
for the frequency distribution and histogram.
Stone Age Surfboards is a small manufacturer of two types of popular low-tide
surfboards, the Graystone and the Lava models. The manufacturing process consists of
two departments: fabrication and finishing. The fabrication department has 8 skilled
workers, each of whom works 9.25 hours per day. The finishing department has 5
workers, each of whom works a 6 -hour shift per day. Each pair of Graystone
surfboards requires 2.5 labor hours in the fabrication department and 2 labor hours in
finishing. The Lava model requires 4.2 labor-hours in fabrication and 3.6 labor-hours in
finishing. The company operates 6 days a week. It makes a per unit profit of $40 on the
Graystone model and $60 on the Lava model. The company anticipates selling at least
twice as many Lava models as Graystone models.

What is the Allowable Decrease in the fabrication hours used?
A) 26.84
B) 16.67
C) 8.33
D) 38.46
The Riviera Transport Company (RTC) produces car accessories at two plants: Dallas
and Atlanta. They ship them to major distribution centers in Houston, San Jose,
Jacksonville, and Memphis. The accounting, production, and marketing departments
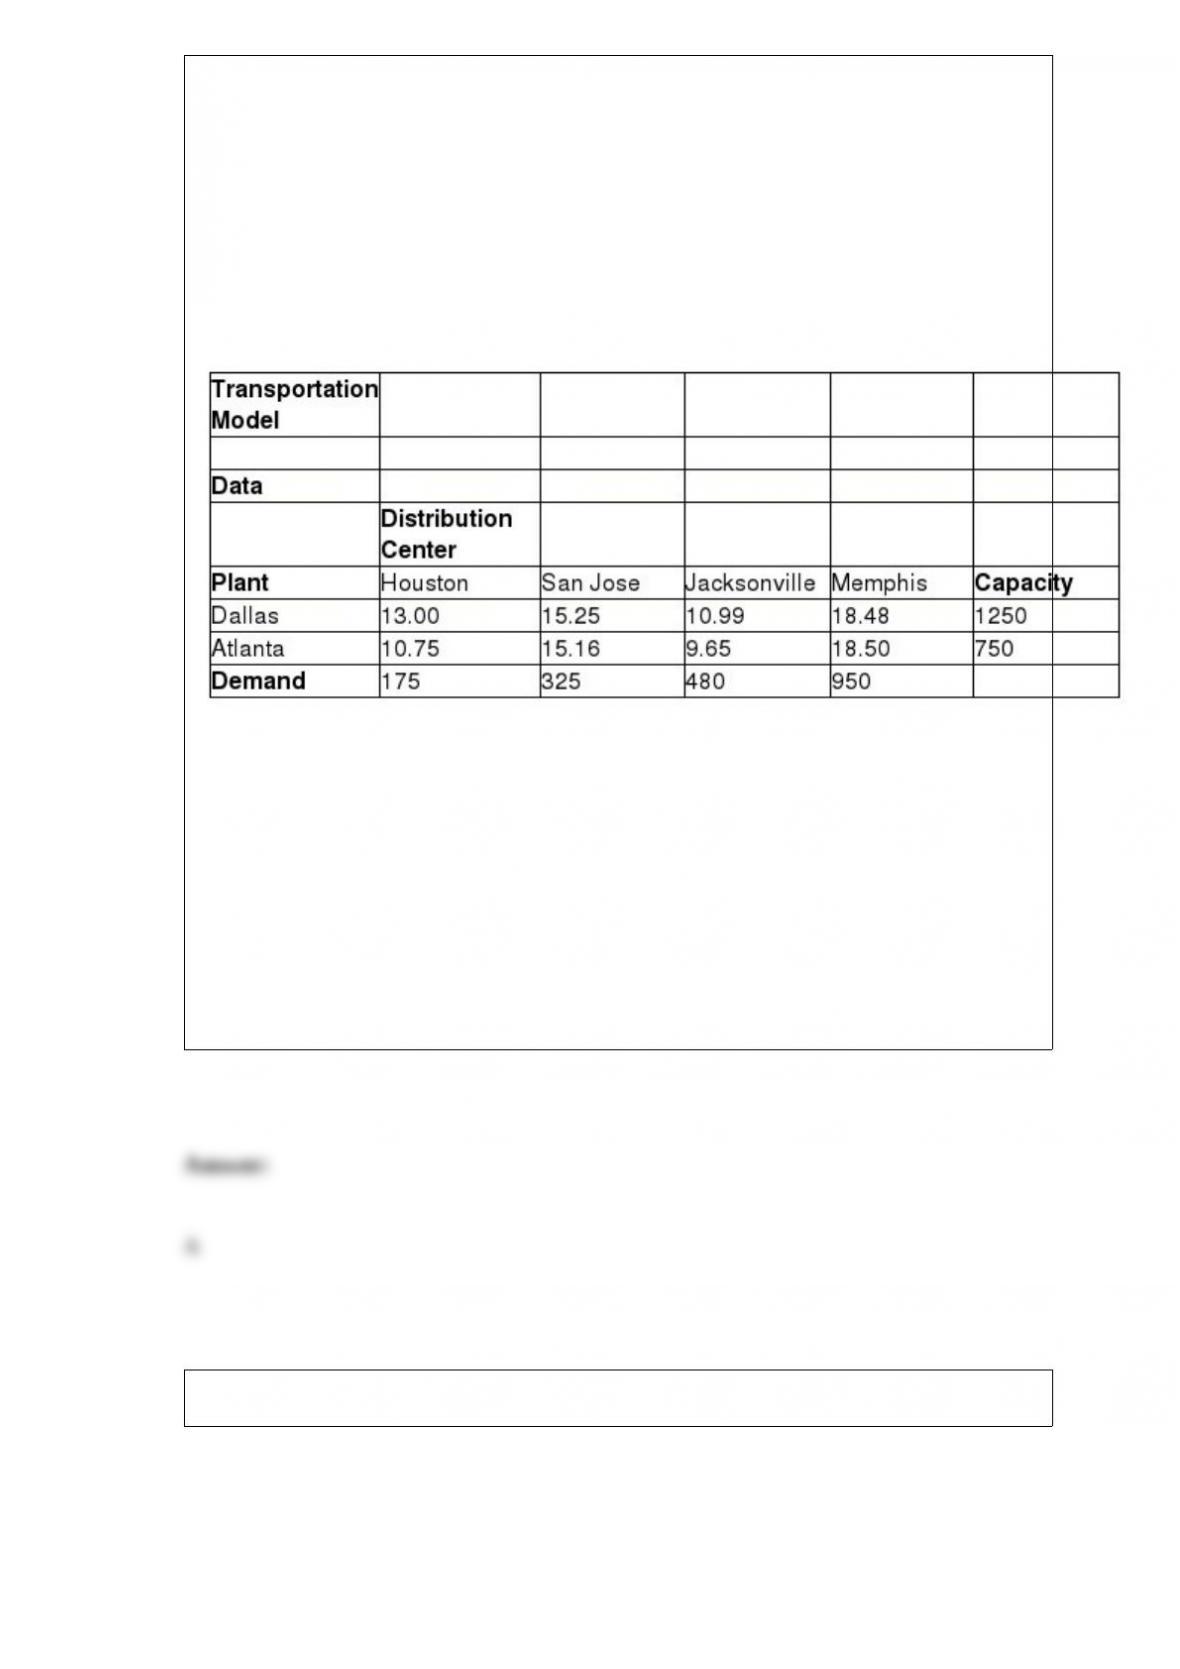
have provided the information in the table below, which shows the unit cost of shipping
between any plant and distribution center, plant capacities over the next planning
period, and distribution center demands. RTC’s supply chain manager faces the problem
of determining how much to ship between each plant and distribution center to
minimize the total transportation cost, not exceed available capacity, and meet customer
demand.
Assume Xij = amount shipped from plant i to distribution center j, where i = 1
represents Dallas, i = 2 represents Atlanta, j = 1 represents Houston, and so on.
According to the transportation model, what is the total cost incurred by Riviera
Transport Company?
A) $29,016.95
B) $26,698.95
C) $20,331.35
D) $41,978.75
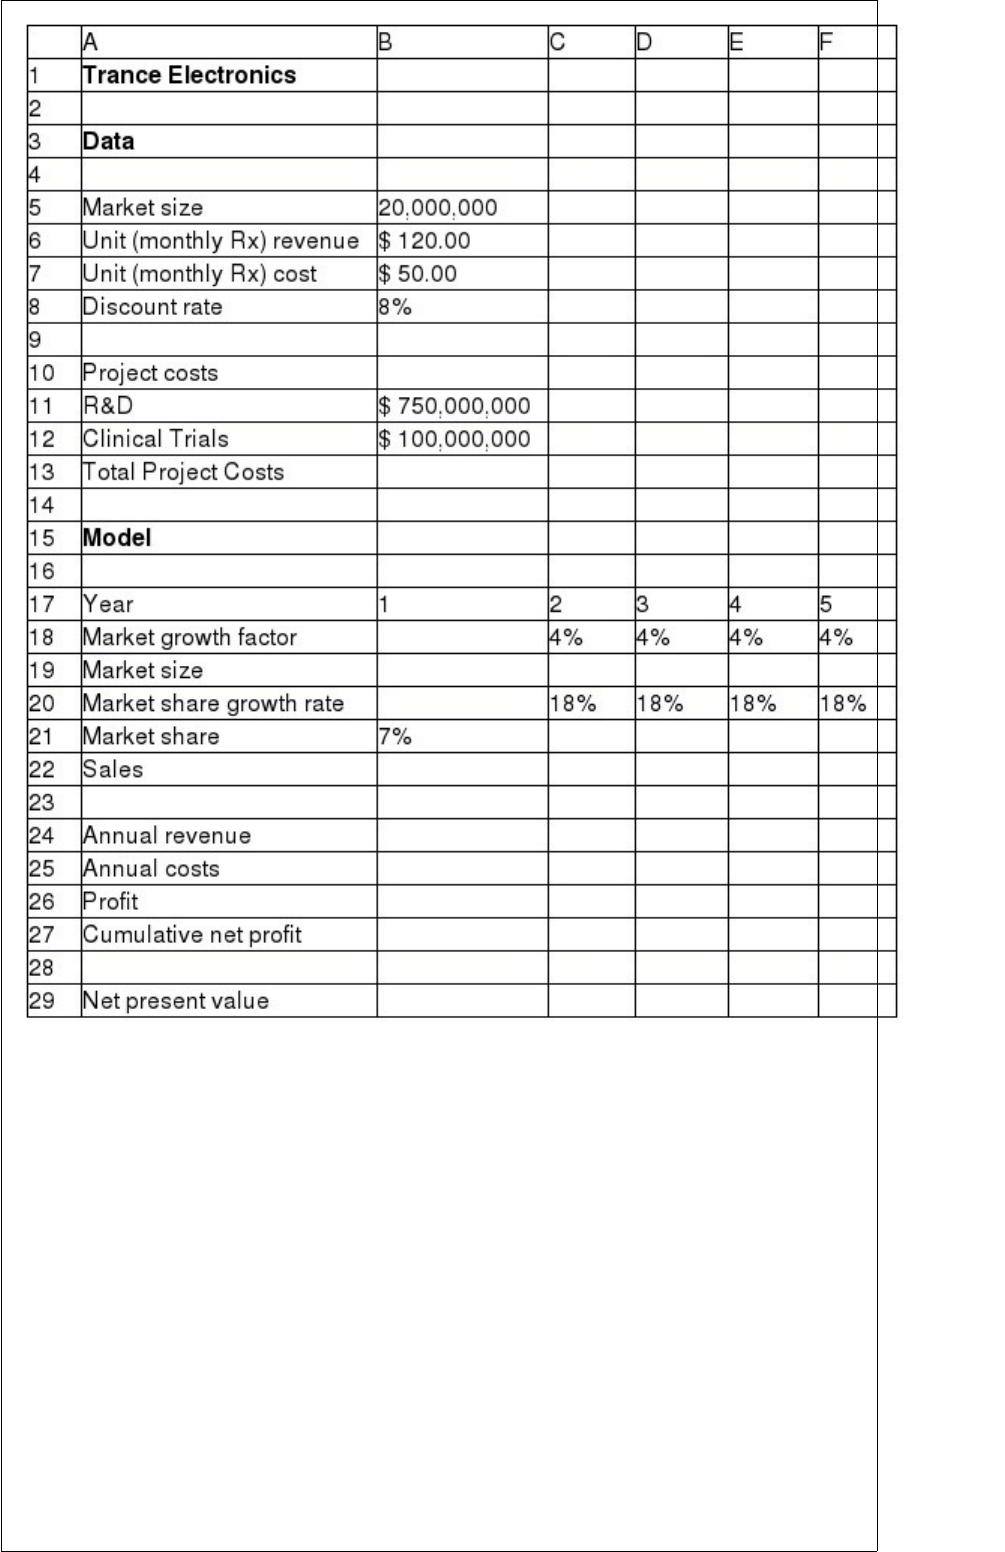
Below is a spreadsheet for Trance Electronics.
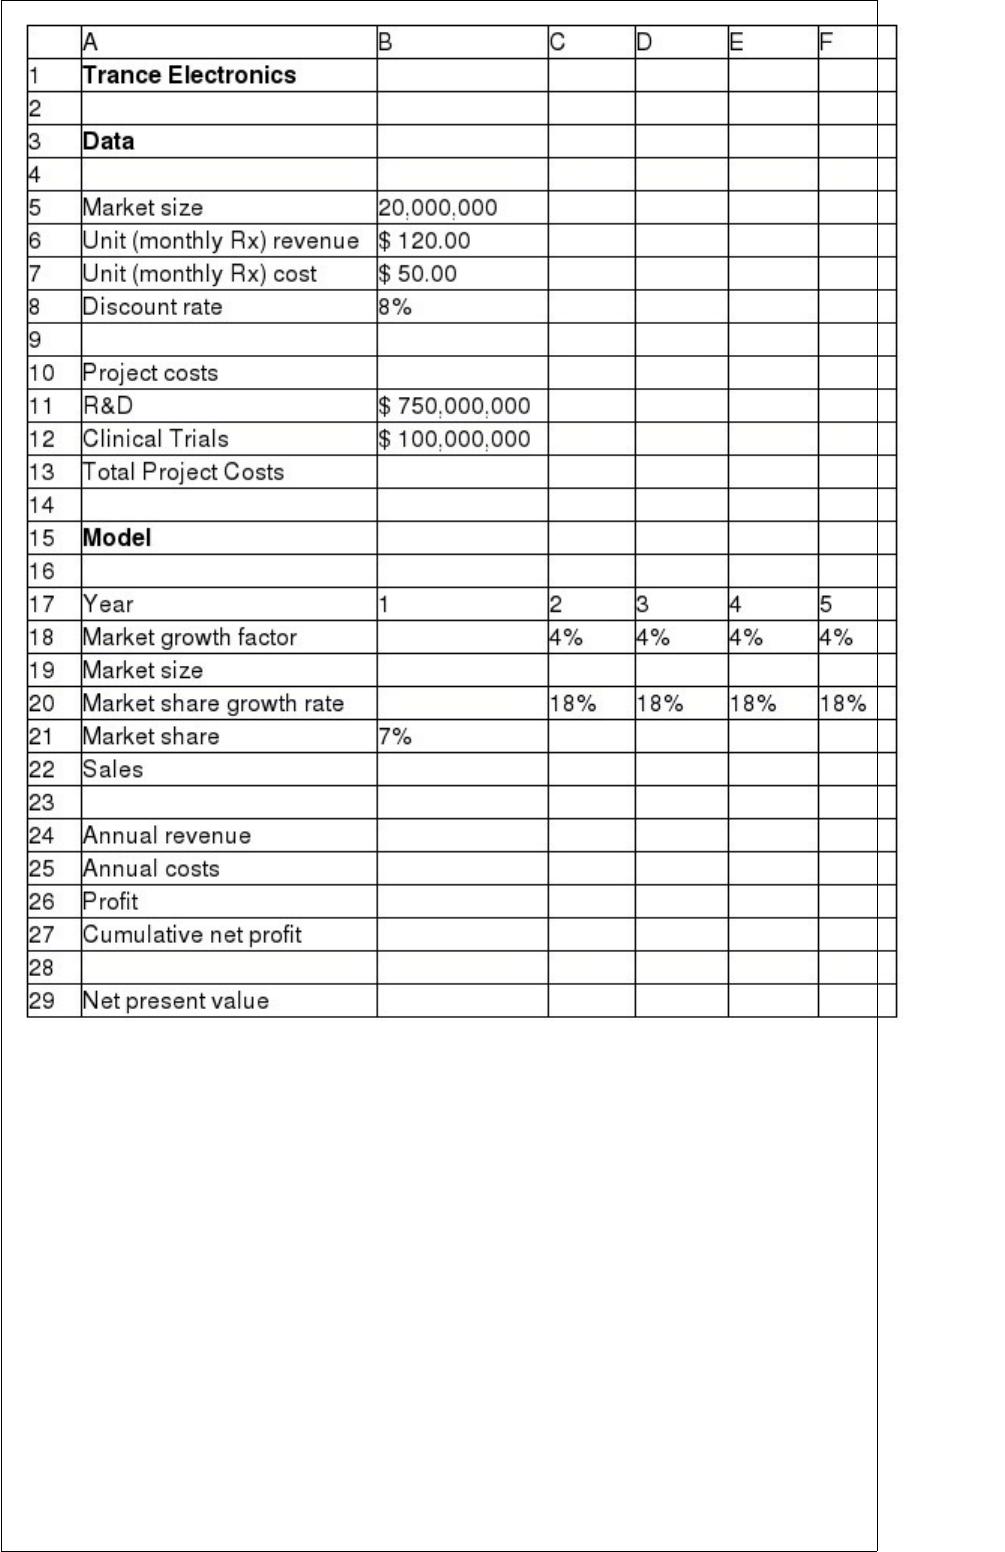
Suppose that the project manager of Trance Electronics has identified the following
uncertain variables in the model and the distributions and parameters that describe
them, as follows: Market size: normal with mean of 20,000,000 units and standard
deviation of 4,000,000 units. R&D costs: uniform between $600,000,000 and
$800,000,000.
Clinical trial costs: lognormal with mean of $150,000,000 and standard deviation
$30,000,000. Annual market growth factor: triangular with minimum = 2%,
maximum = 6%, and most likely = 3%.
Annual market share growth rate: triangular with minimum = 15%, maximum =
25%, and most likely = 20%.
The number of trials per simulation is equal to 10,000 at a Sim. Random Seed of 2. Run
the simulation and answer the following questions using the Risk Solver Platform.
What are the chances that the product will show a cumulative net profit in the fourth
year?

A) approximately 25%
B) approximately 18%
C) approximately 11%
D) approximately 32%
Which of the following data sets provides the most realistic estimate of the performance
of a model on completely unseen data?
A) validation data set
B) test data set
C) training data set
D) linear regression data set
Which of the following accurately describes a sampling distribution of the mean?
A) It is the mean of any one sample from a group of related populations of different
sizes.
B) It is the mean distribution of any one sample from a group of samples of varying
sizes from a population.
C) It is the mean of half the samples from a related group of populations.

D) It is the distribution of the means of all possible samples of fixed size n from a
population.
Which of the following characterizes a random variable having two possible outcomes,
each with a constant probability of occurrence?
A) Beta distribution
B) Bernoulli distribution
C) Poisson distribution
D) Binominal distribution
Which of the following is necessary to calculate the variable cost of production for the
company to develop a profit model?
A) unit sale price
B) quantity of item produced
C) quantity of item sold
D) fixed cost of production
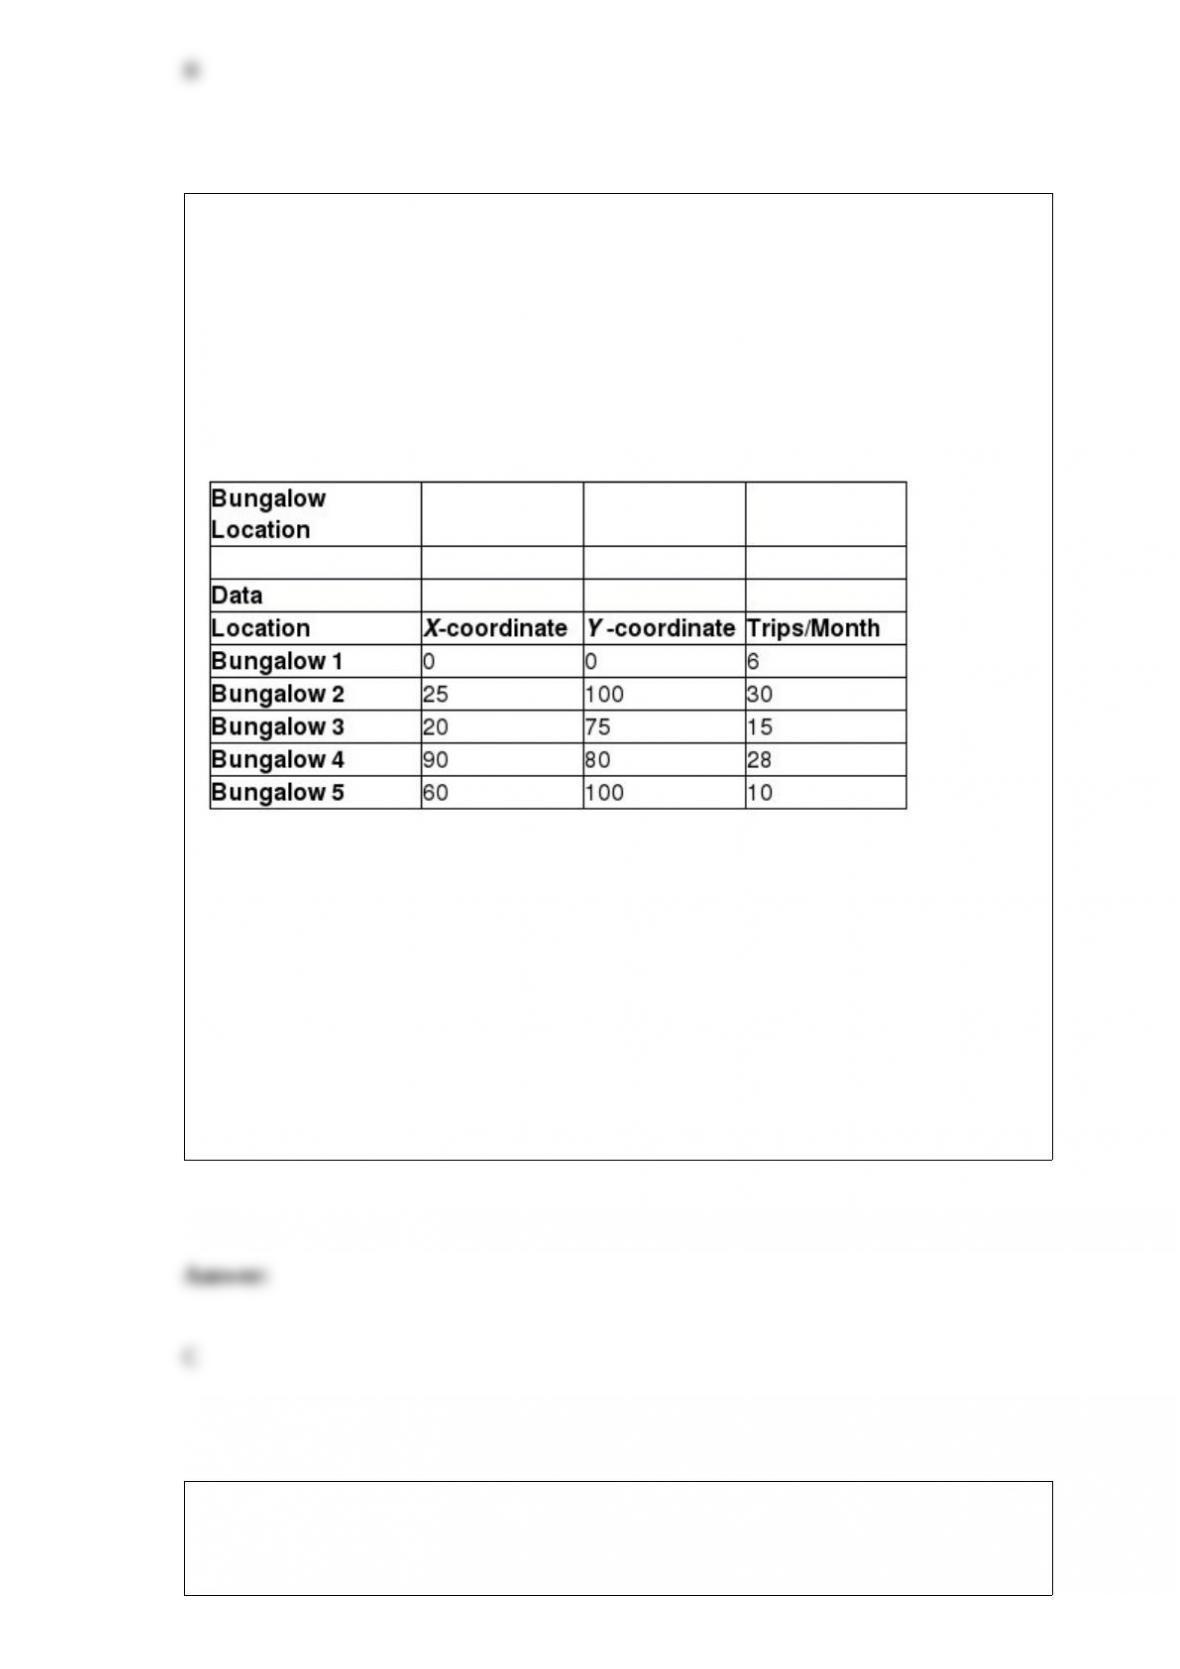
Shirley Templeton is a real estate agent for Paralol Realty. Shirley is given the
responsibility to manage potential customers for 5 of the Realty’s bungalows. These 5
bungalows are situated in close proximity. In order to make traveling easier, Shirley
decides to move to a location closer to the 5 bungalows. The table below gives the
location (X and Y coordinates) of the 5 bungalows along with the number of trips she
would have to make to each bungalow. Create a nonlinear model based on the data
given in the table below noting that the objective is to reduce the weighted distance
between Shirley’s accommodation and the 5 bungalows.
According to the model, what is the distance between Shirley’s new accommodation
and Bungalow 4?
A) 14.53
B) 250.78
C) 54.62
D) 98.21
What is the formula used to calculate the value of at in the linear trend equation Ft+k =
at + btk while using double exponential smoothing?

A) at = β(bt – bt–1) + (1 –β)bt–1
B) at = αFt-1 + (1 – α)(at +1 + bt+1)
C) at = αFt + (1 – α)(at –1 + bt-1)
D) at = β(bt + bt–1) + (1 + γ)bt–1
A positiveNPVmeansthattheinvestmentwillprovideaddedvaluebecausetheprojected
returnexceedsthe .
A) modified internal rate of return
B) discount rate
C) accounting rate of return
D) adjusted present value
The Riviera Transport Company (RTC) produces car accessories at two plants: Dallas
and Atlanta. They ship them to major distribution centers in Houston, San Jose,
Jacksonville, and Memphis. The accounting, production, and marketing departments
have provided the information in the table below, which shows the unit cost of shipping
between any plant and distribution center, plant capacities over the next planning
period, and distribution center demands. RTC’s supply chain manager faces the problem
of determining how much to ship between each plant and distribution center to
minimize the total transportation cost, not exceed available capacity, and meet customer
demand.
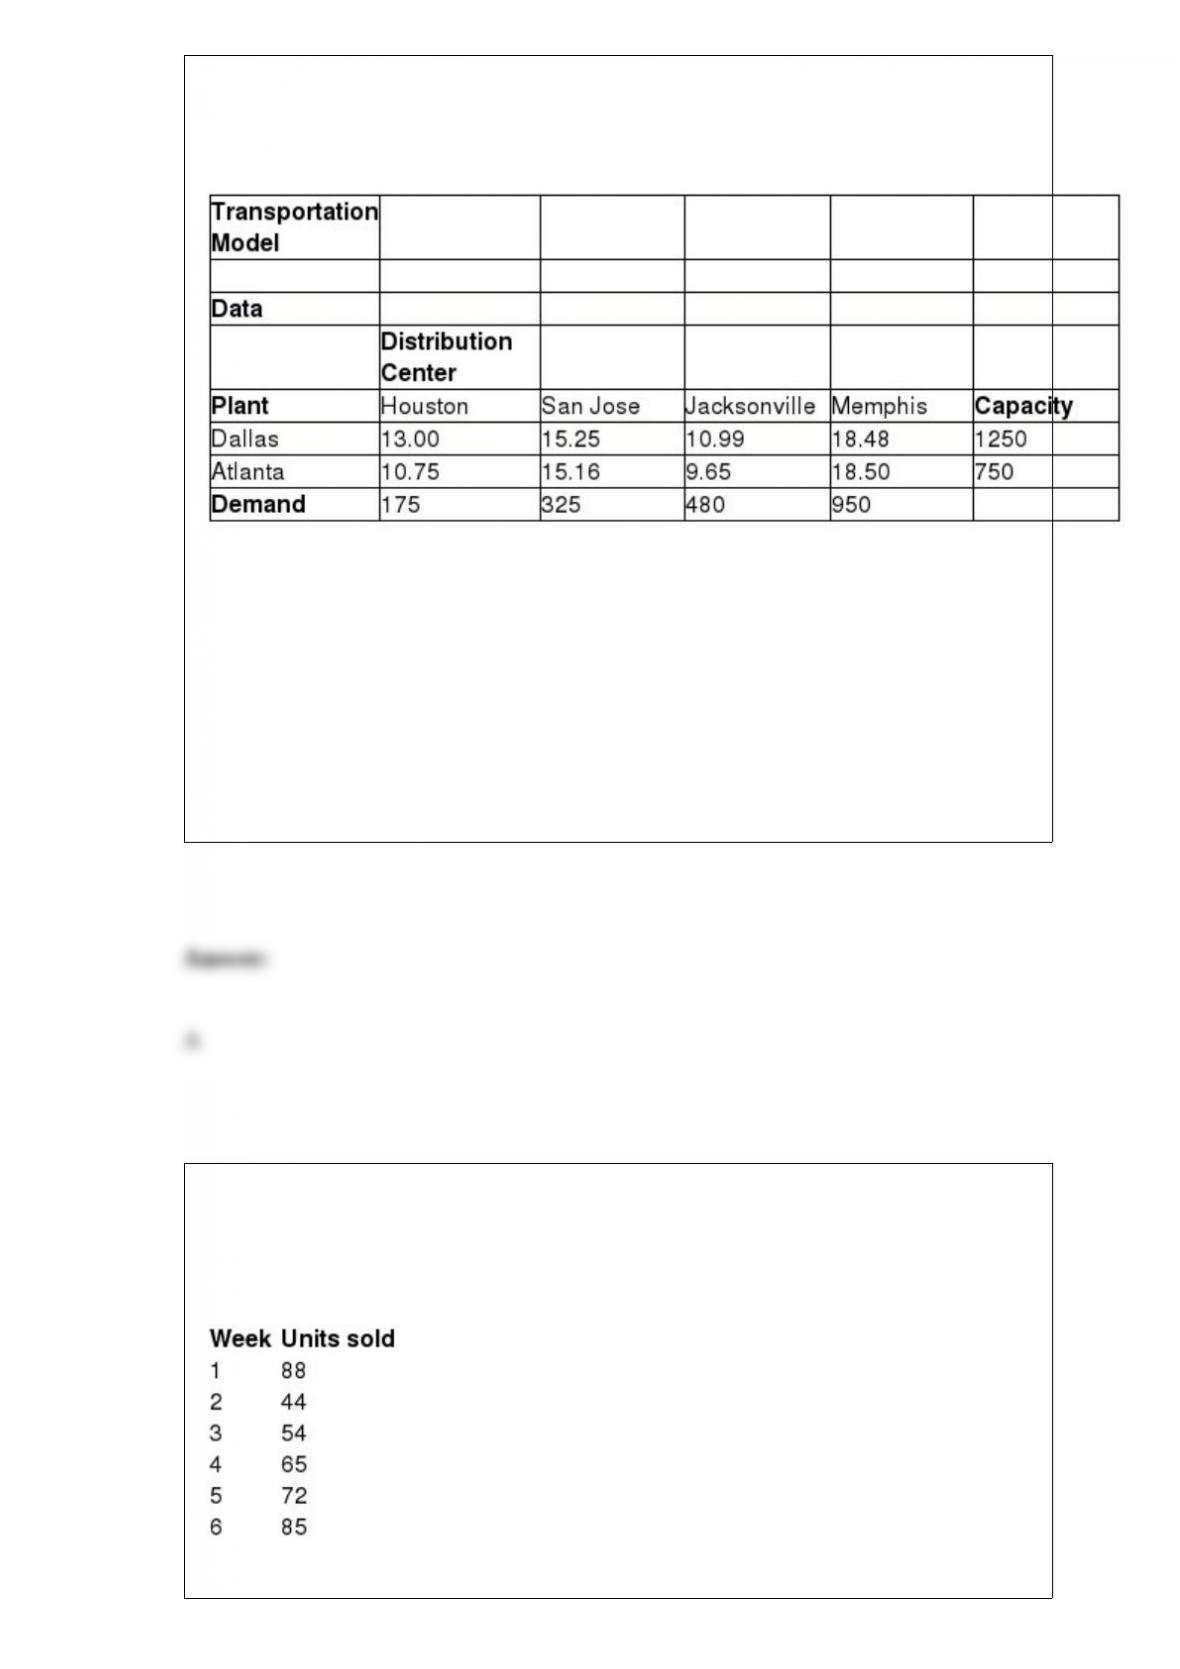
Assume Xij = amount shipped from plant i to distribution center j, where i = 1
represents Dallas, i = 2 represents Atlanta, j = 1 represents Houston, and so on.
Which of the following is the constraint for total amount shipped from Dallas?
A) X11 + X12 + X13 + X14 ≤ 1,250
B) X21 + X22 + X23 + X24 ≤ 1,250
C) X21 + X22 + X23 + X24 ≤ 750
D) X11 + X12 + X13 + X14 – X21 + X22 + X23 + X24 ≤ 850
The table provided below gives the sales details of the number of android smart phones
at an electronic retail store for the past 6 weeks. The time series appears to be relatively
stable, without trend, seasonal, or cyclical effects. (Hint: Optimize α value in 0.1
increments)

What is the difference between the forecasted and the actual value for the 3rd week?
A) 1 phones
B) 6 phones
C) 4 phones
D) 3 phones
The binominal distribution:
A) is a discrete distribution used to model the number of occurrences in some unit of
measure.
B) assumes that the average number of occurrences per unit is a constant and that
occurrences are independent.
C) is symmetric irrespective of the value of the probability of success.
D) models n independent replications of a Bernoulli experiment, each with a probability
p of success.
Below is the profit model spreadsheet for the Lazarus Shoe Company producing their
latest model of shoes for the month of January.
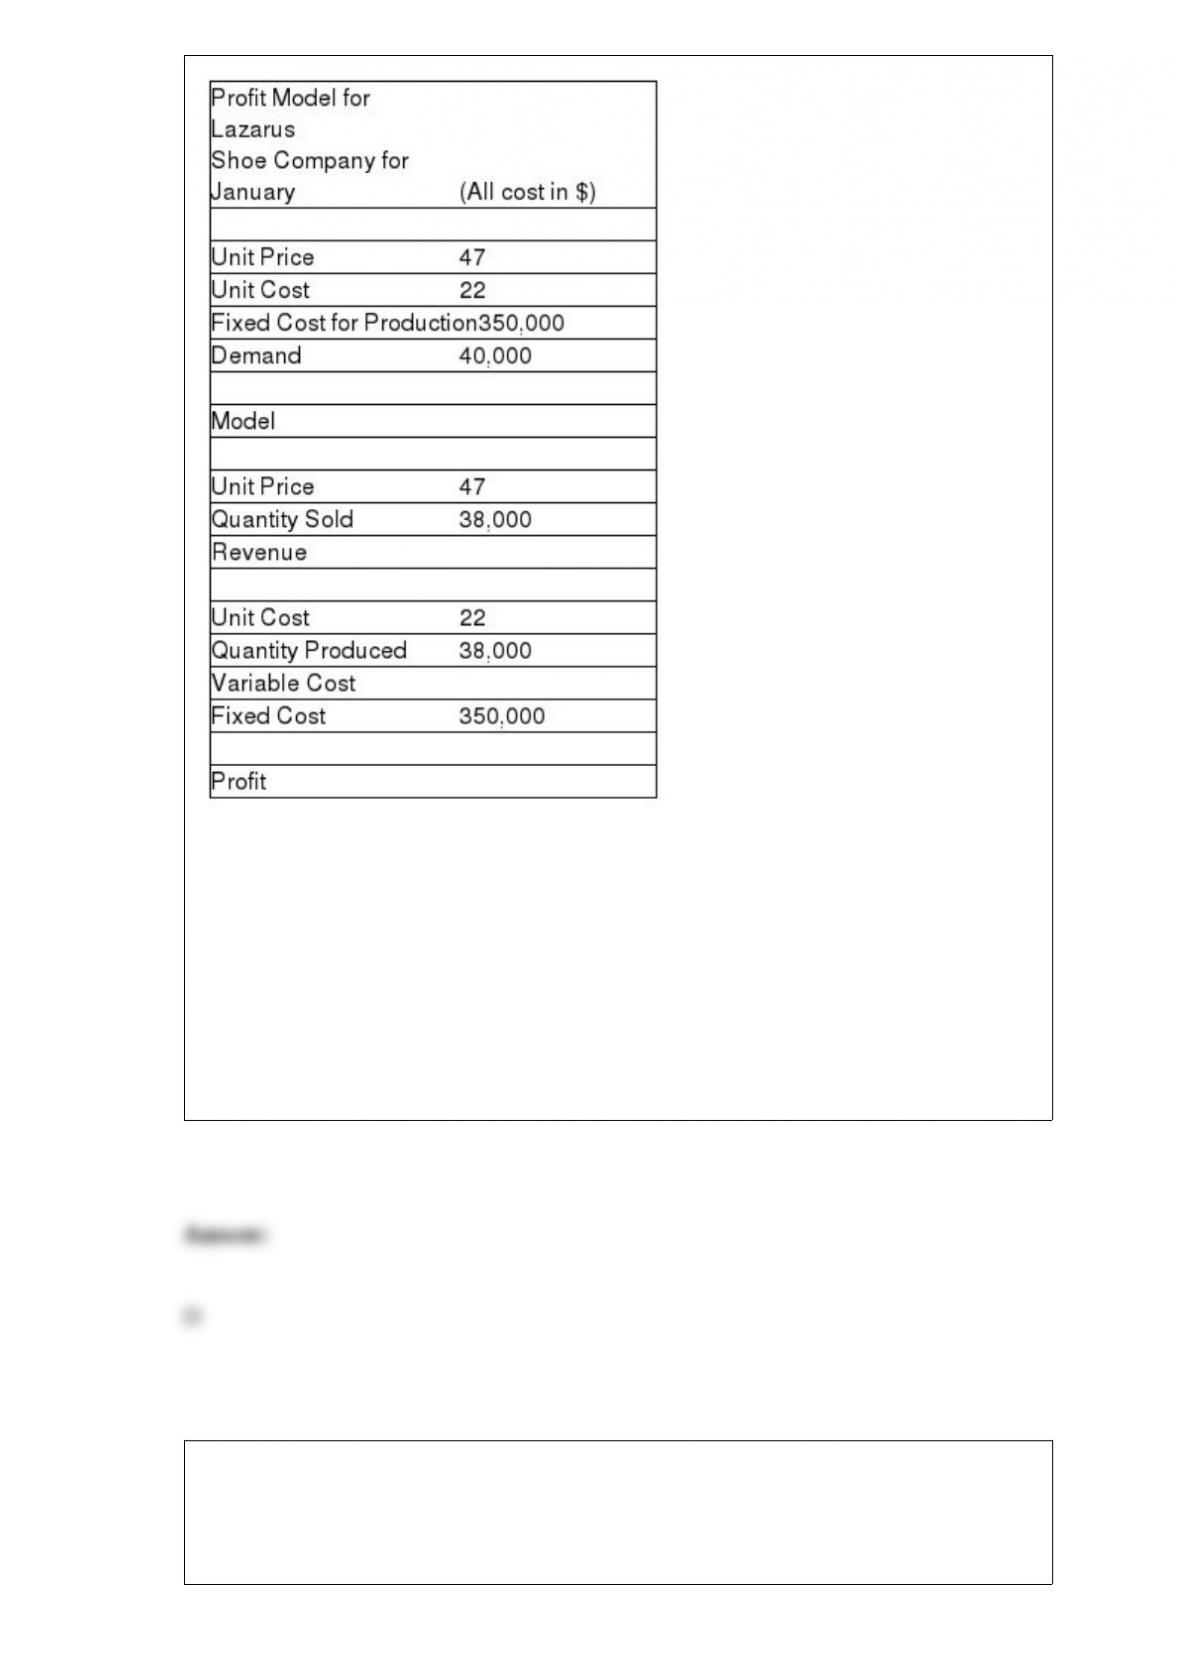
Calculate the revenue for units sold.
A) $836,000
B) $1,136,000
C) $600,000
D) $1,786,000
Remington Textiles has a mill that produces three types of fabrics on a make-to-order
basis. The mill operates on a 24/7 basis. The key decision facing the plant manager is
about the type of loom needed to process each fabric during the coming 12 weeks to
meet demands for the three fabrics and not exceed the capacity of the looms in the mill.
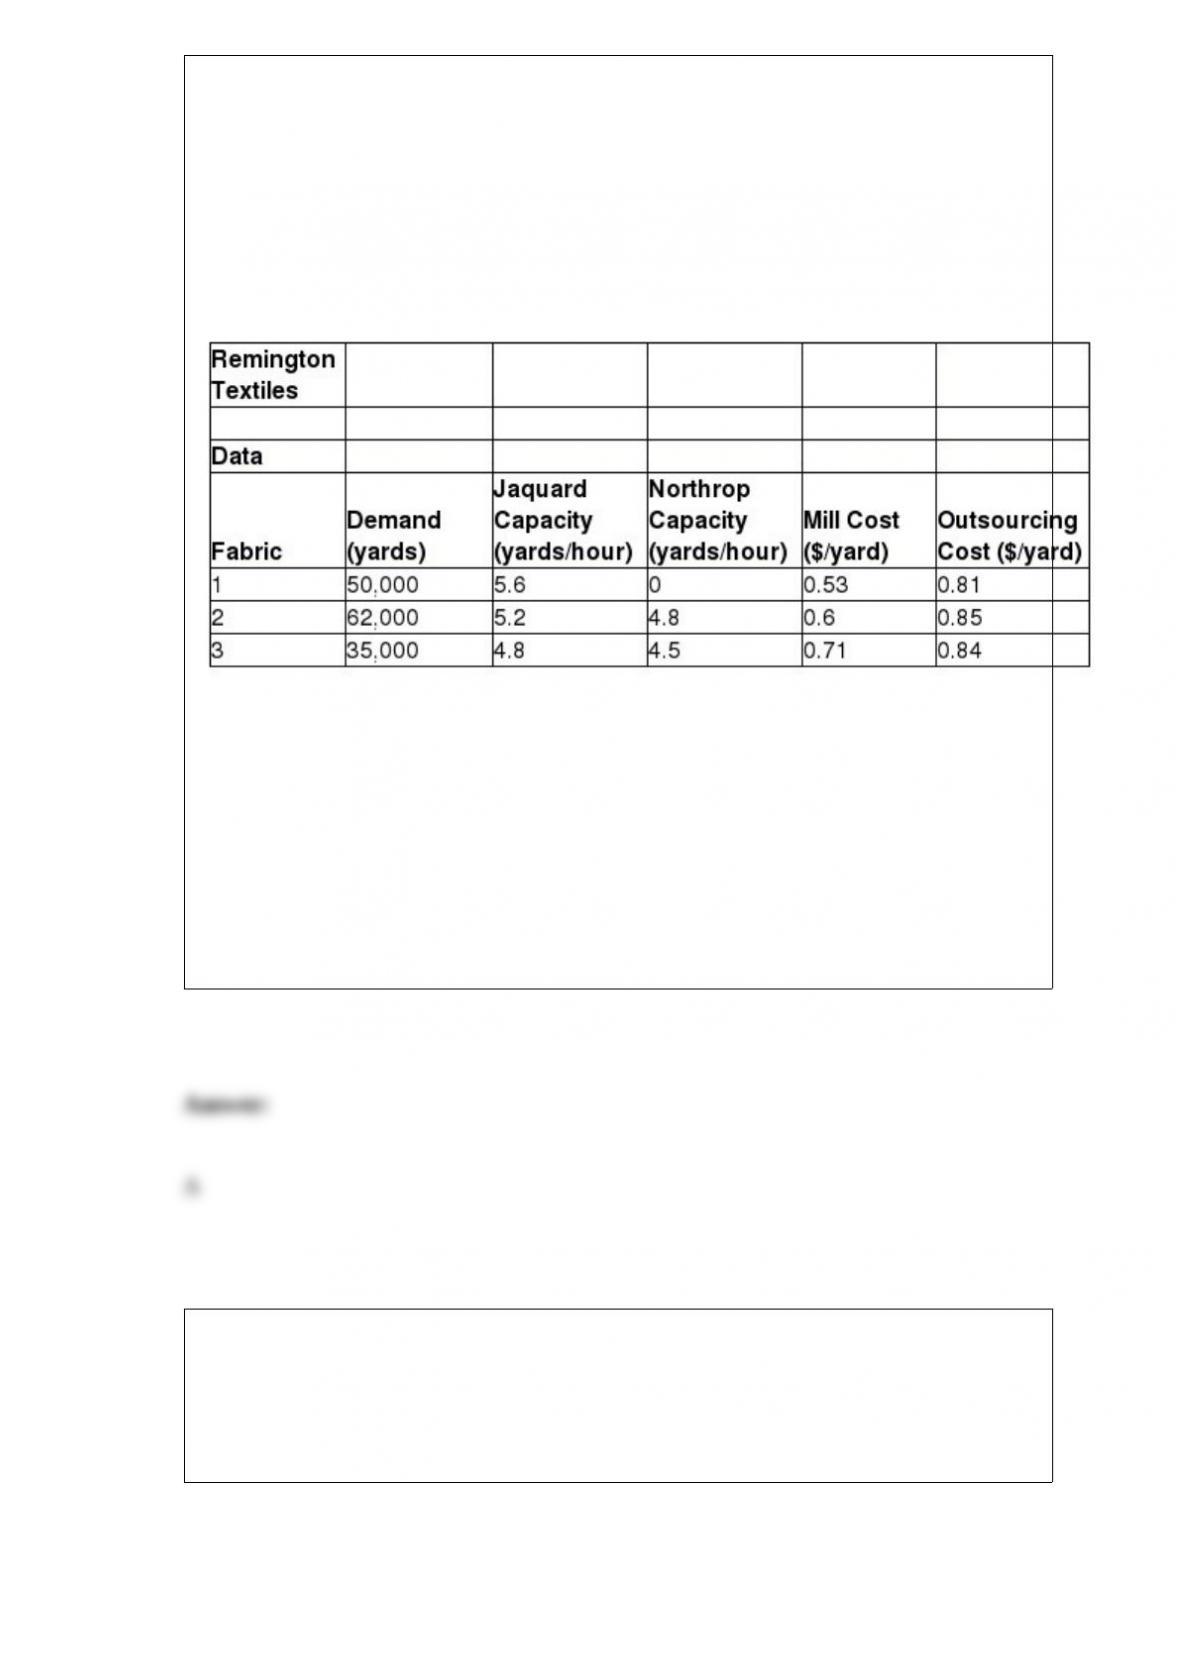
Two types of looms are used: Jaquard and Northrop. Jaquard looms can be used to
make all fabrics and are the only looms that can weave certain fabrics, such as plaids.
Demands, variable costs for each fabric, and production rates on the looms are given in
the table below. The mill has 10 Northrop looms and 2 Jaquard looms. Any fabrics that
cannot be woven in the mill because of limited capacity will be purchased from an
external supplier, finished at the mill, and sold at the selling price. In addition to
determining which looms to use to process the fabrics, the manager also needs to
determine which fabrics to buy externally.
According to the model, what is the total amount of Fabric 1 to be purchased?
A) 27,420.8
B) 50,000
C) 22,579.2
D) 32,595
The Atlas Movies Theater has repriced their ticket rates to maximize revenues. They
have three classes of tickets: Classic, Silver, and Gold. The table below provides
information on the average ticket sales, revenue and price elasticity on demand. They
have a total seating capacity of 300. The table also provides the new price for the three
classes obtained using Solver.
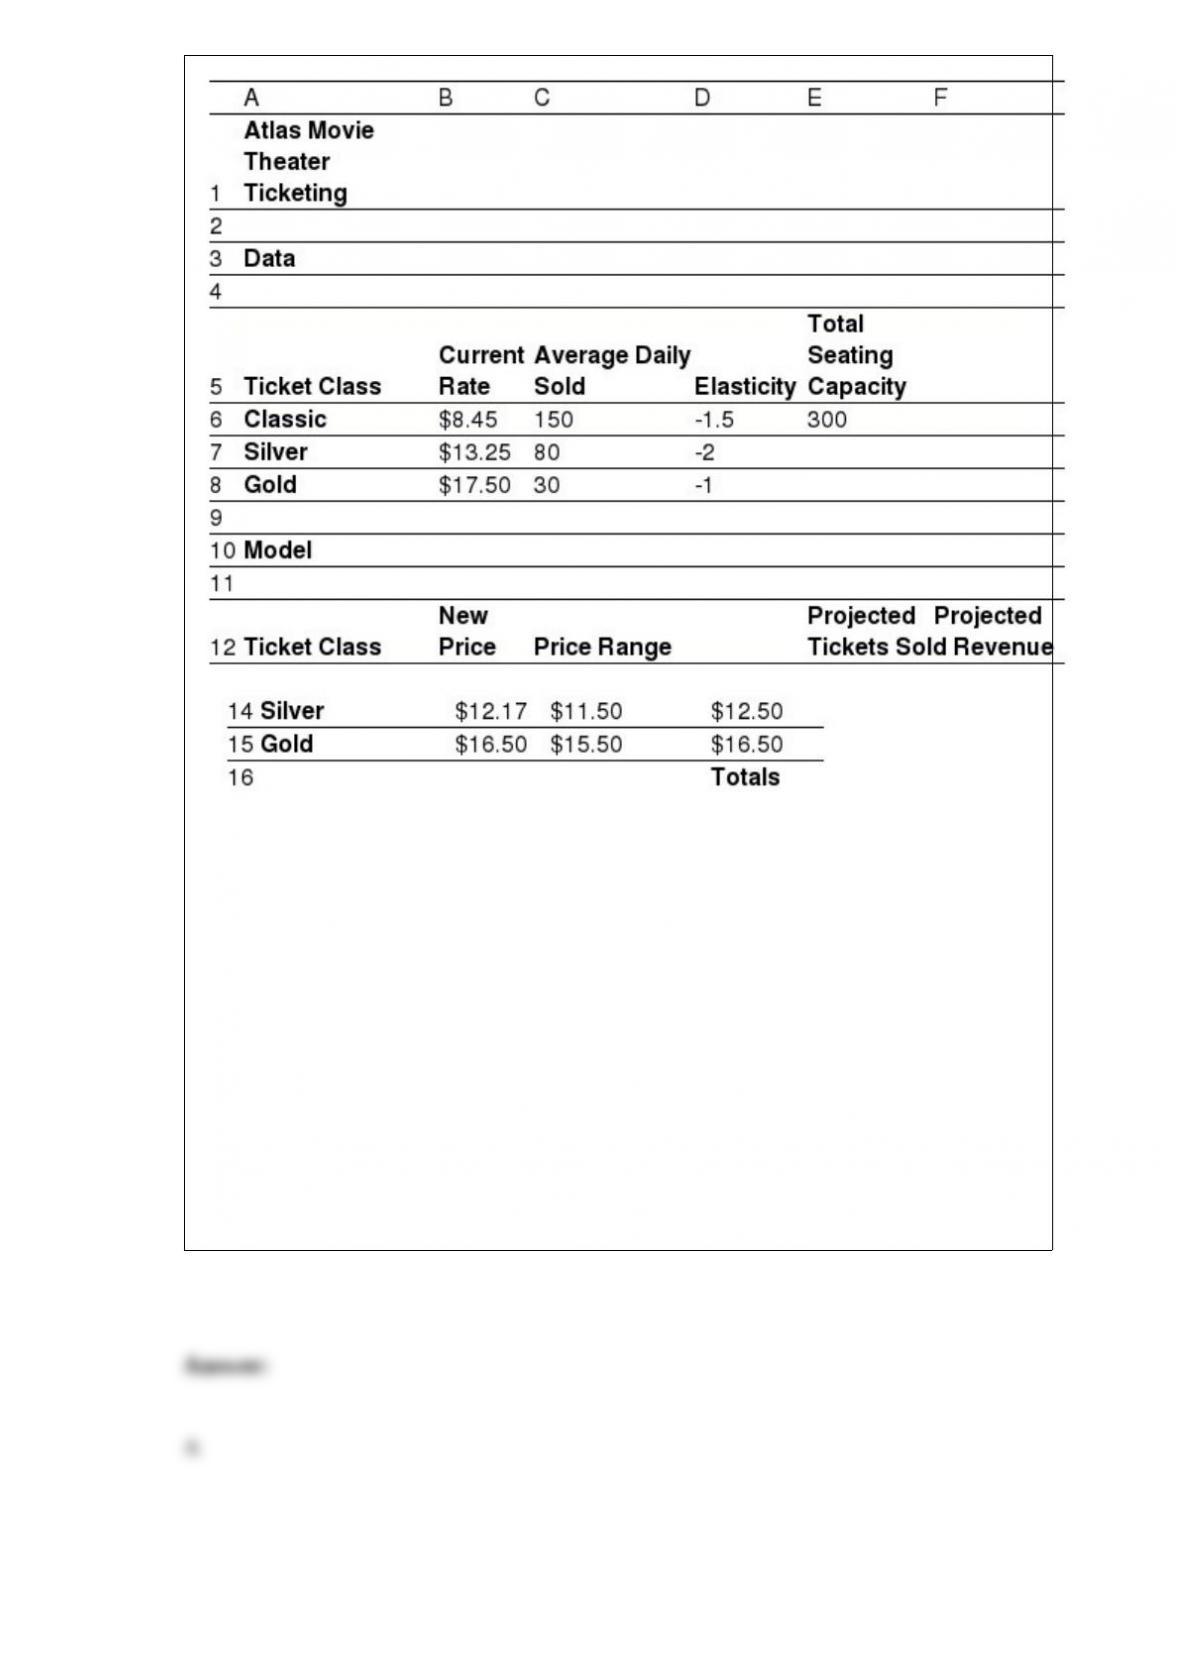
Assume the distributions of elasticities for three classes of tickets are uniform with
minimum and maximum values equal to 75% and 125% of their estimated values,
respectively. Under this assumption, use Monte Carlo simulation to see what happens to
the prediction of tickets sold. The model is simulated for 10,000 trials.
Which of the following cells is defined as the output cell?
A) E16
B) E18
C) F17
D) F18

The average cost for the sample of 5 sales of a product is = $230 and the
sample standard deviation is s = $17.50. The hypothesized mean is μ0 = $250.
Compute the value of the test statistic.
A) -2.56
B) -4.00
C) -1.67
D) -3.87
Stone Age Surfboards is a small manufacturer of two types of popular low-tide
surfboards, the Graystone and the Lava models. The manufacturing process consists of
two departments: fabrication and finishing. The fabrication department has 8 skilled
workers, each of whom works 9.25 hours per day. The finishing department has 5
workers, each of whom works a 6 -hour shift per day. Each pair of Graystone
surfboards requires 2.5 labor hours in the fabrication department and 2 labor hours in
finishing. The Lava model requires 4.2 labor-hours in fabrication and 3.6 labor-hours in
finishing. The company operates 6 days a week. It makes a per unit profit of $40 on the
Graystone model and $60 on the Lava model. The company anticipates selling at least
twice as many Lava models as Graystone models.
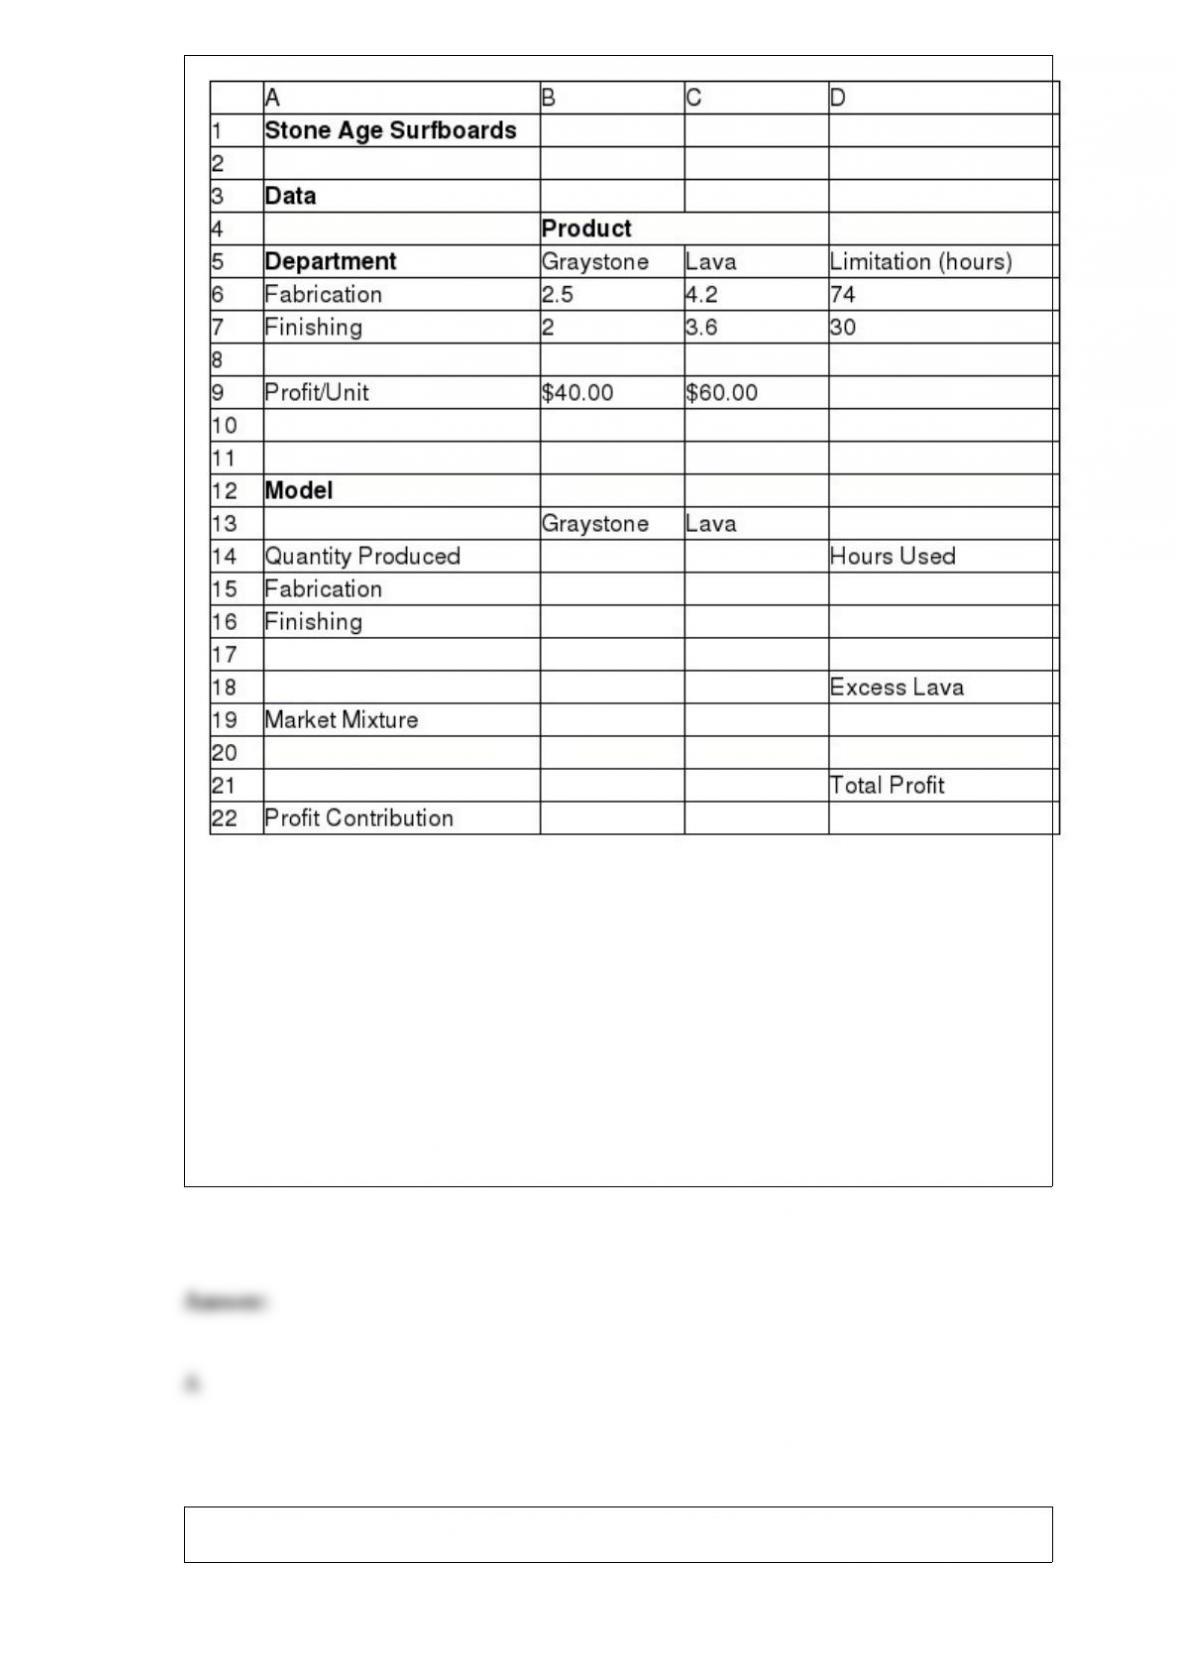
If the unit profit on both Graystone and Lava surfboards is increased by $10, what is the
Allowable Decrease for Lava surfboards?
A) 95.00
B) 38.46
C) 20.00
D) 11.11
Below is a spreadsheet for Trance Electronics.
Suppose that the project manager of Trance Electronics has identified the following
uncertain variables in the model and the distributions and parameters that describe
them, as follows: Market size: normal with mean of 20,000,000 units and standard
deviation of 4,000,000 units. R&D costs: uniform between $600,000,000 and
$800,000,000.
Clinical trial costs: lognormal with mean of $150,000,000 and standard deviation
$30,000,000. Annual market growth factor: triangular with minimum = 2%,
maximum = 6%, and most likely = 3%.
Annual market share growth rate: triangular with minimum = 15%, maximum =
25%, and most likely = 20%.
The number of trials per simulation is equal to 10,000 at a Sim. Random Seed of 2. Run
the simulation and answer the following questions using the Risk Solver Platform.
What is the expected loss ratio obtained from the simulation results of the net present
value?
A) 93.50%
B) 72.45%
C) 67.32%
D) 86.32%
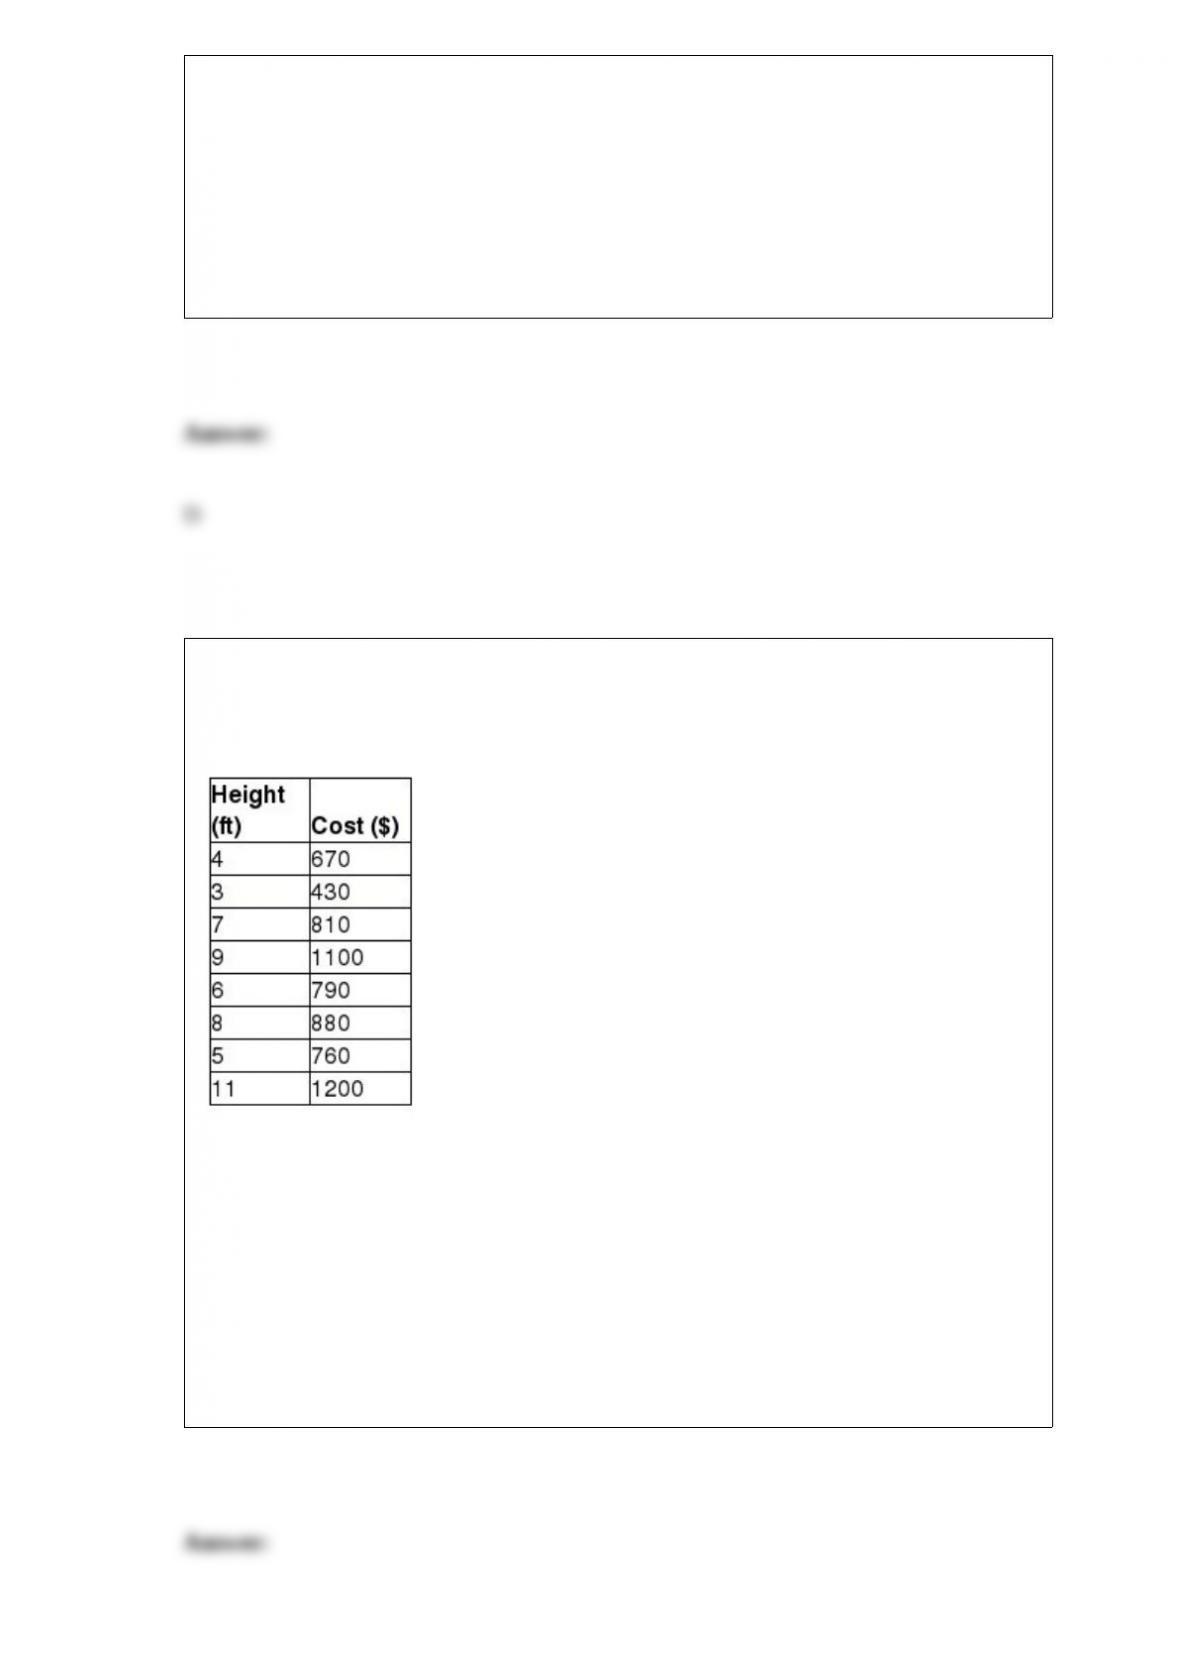
Following is an extract from the database of a construction company. The table shows
the height of walls in feet and the cost of raising them. The estimated simple linear
regression equation is given as Ŷ = b0 + b1X. (Hint: Use Excel functions).
What is the value of the coefficient b0?
A) -2.25321
B) 0.010697
C) 254.8371
D) 86.81704
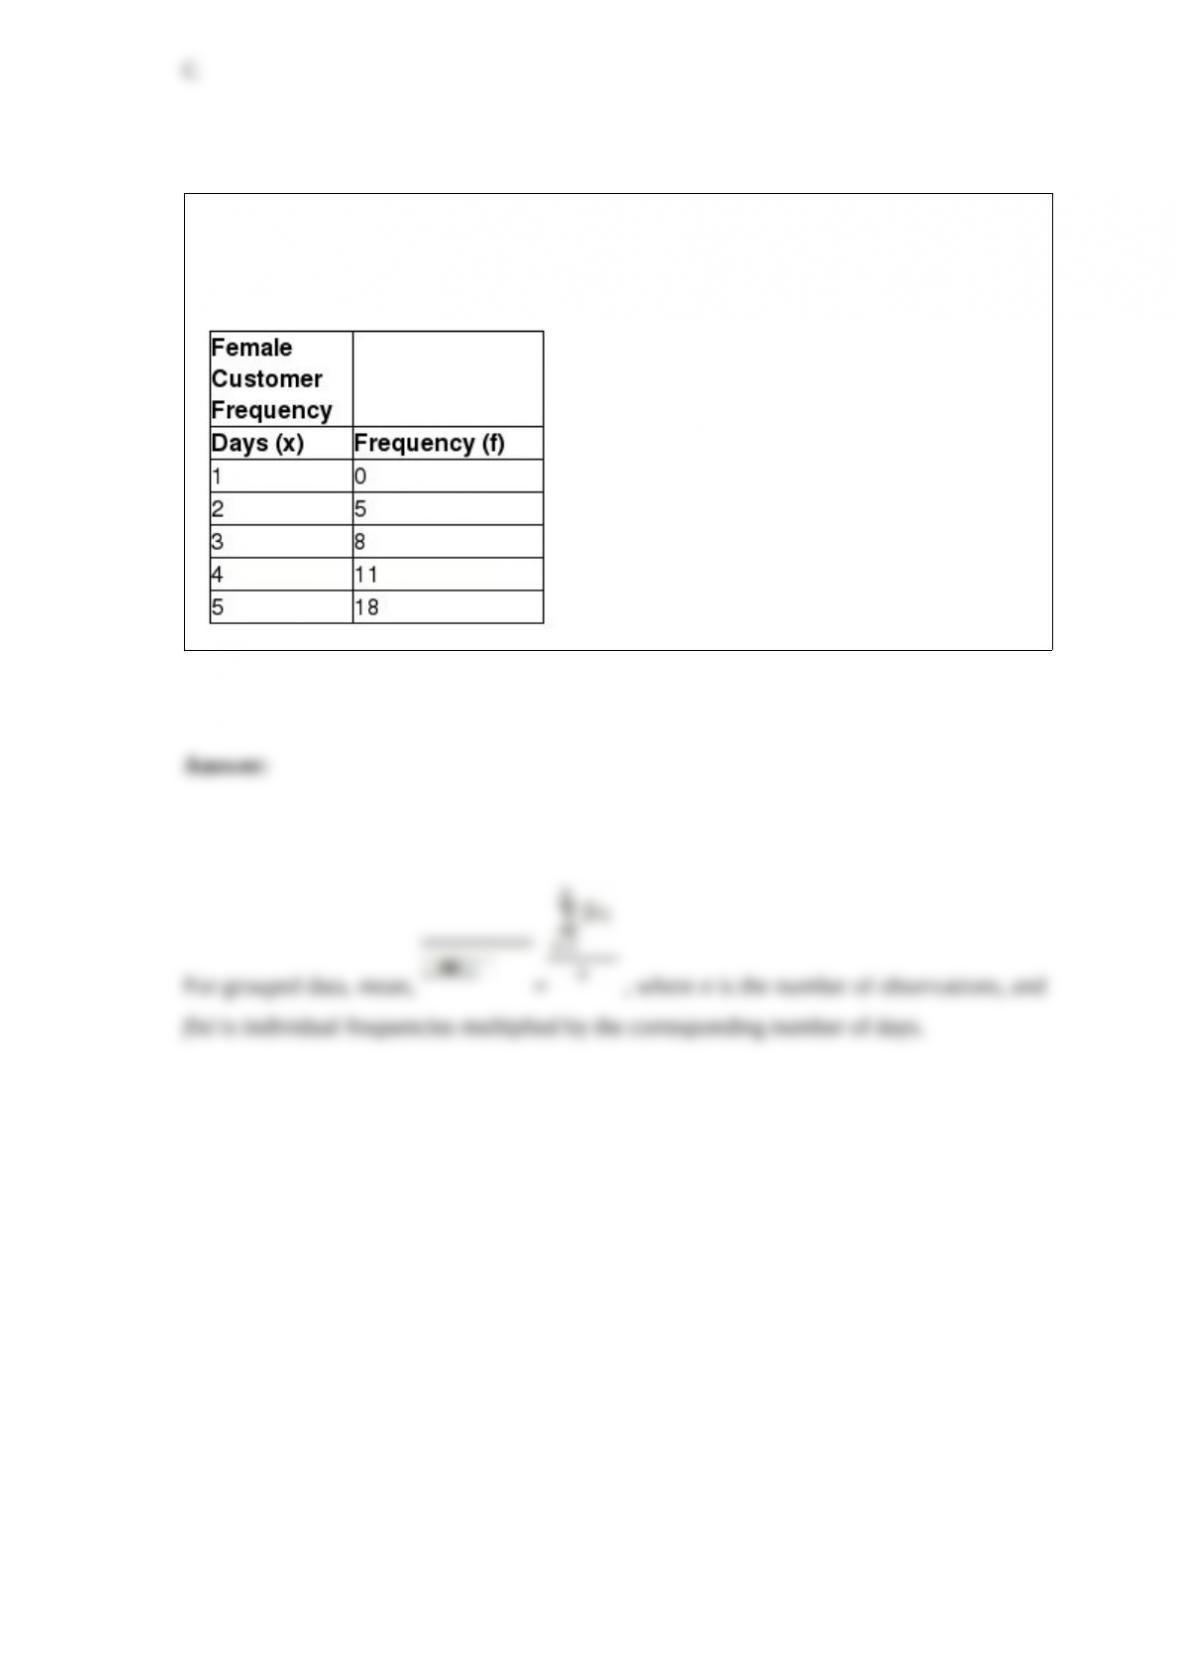
The table below shows the daily frequency of female customers at a particular ice
cream shop during discount sale periods. The data is collected for 5 days. Calculate the
mean for the data.
In a linear relationship, which of the following accounts for the many possible values of
the dependent variable that vary around the mean?
A) the coefficient of the dependent variable X
B) the value of the intercept 0
C) the random error term ε
D) the standard error SYX

When data are classified by the type of measurement scale, which is the strongest form
of measurement?
A) nominal
B) interval
C) ordinal
D) ratio
What is the mean absolute deviation obtained from the simulation results?
A) 39.10
B) 24.56
C) 58.75
D) 46.36
Below is a spreadsheet for Trance Electronics.
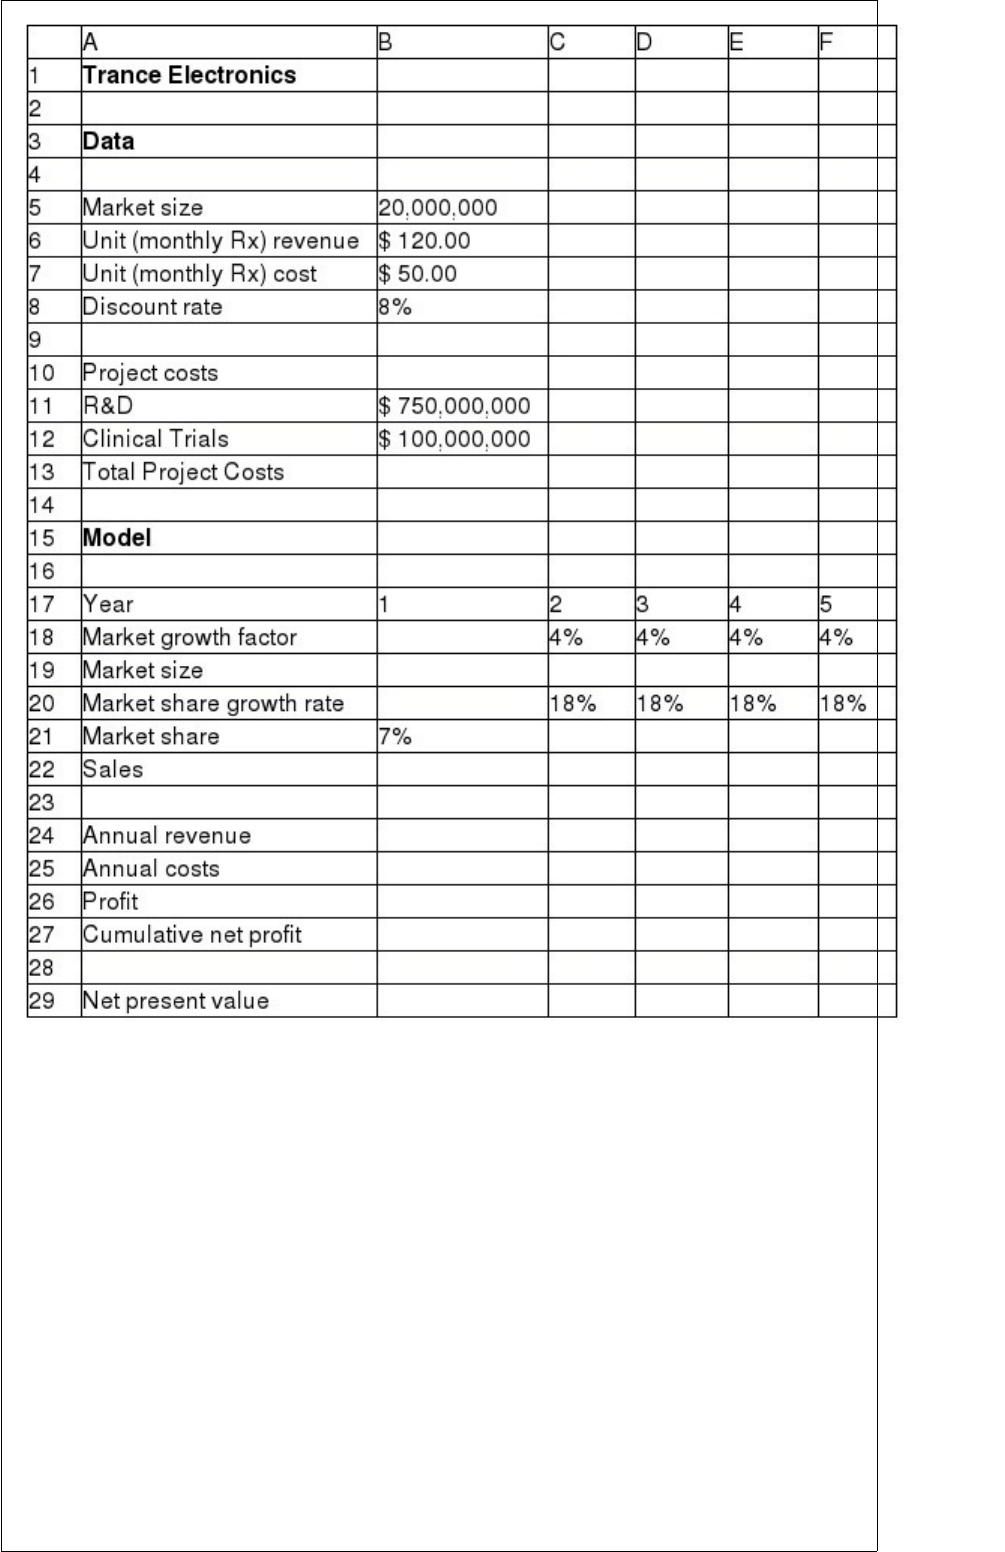
Suppose that the project manager of Trance Electronics has identified the following
uncertain variables in the model and the distributions and parameters that describe
them, as follows: Market size: normal with mean of 20,000,000 units and standard
deviation of 4,000,000 units. R&D costs: uniform between $600,000,000 and
$800,000,000.
Clinical trial costs: lognormal with mean of $150,000,000 and standard deviation
$30,000,000. Annual market growth factor: triangular with minimum = 2%,
maximum = 6%, and most likely = 3%.
Annual market share growth rate: triangular with minimum = 15%, maximum =
25%, and most likely = 20%.
The number of trials per simulation is equal to 10,000 at a Sim. Random Seed of 2. Run
the simulation and answer the following questions using the Risk Solver Platform.
What is the correlation of the market size with the NPV with reference to the sensitivity
chart?

A) 0.043
B) 0.888
C) -0.341
D) -0.026
Construct a PivotChart to visualize the purchase order total units for steel forks and
ceramic bowls within each region.
The table below is the data set of the Shiller Real Home Price Index for the years
1946-1956.
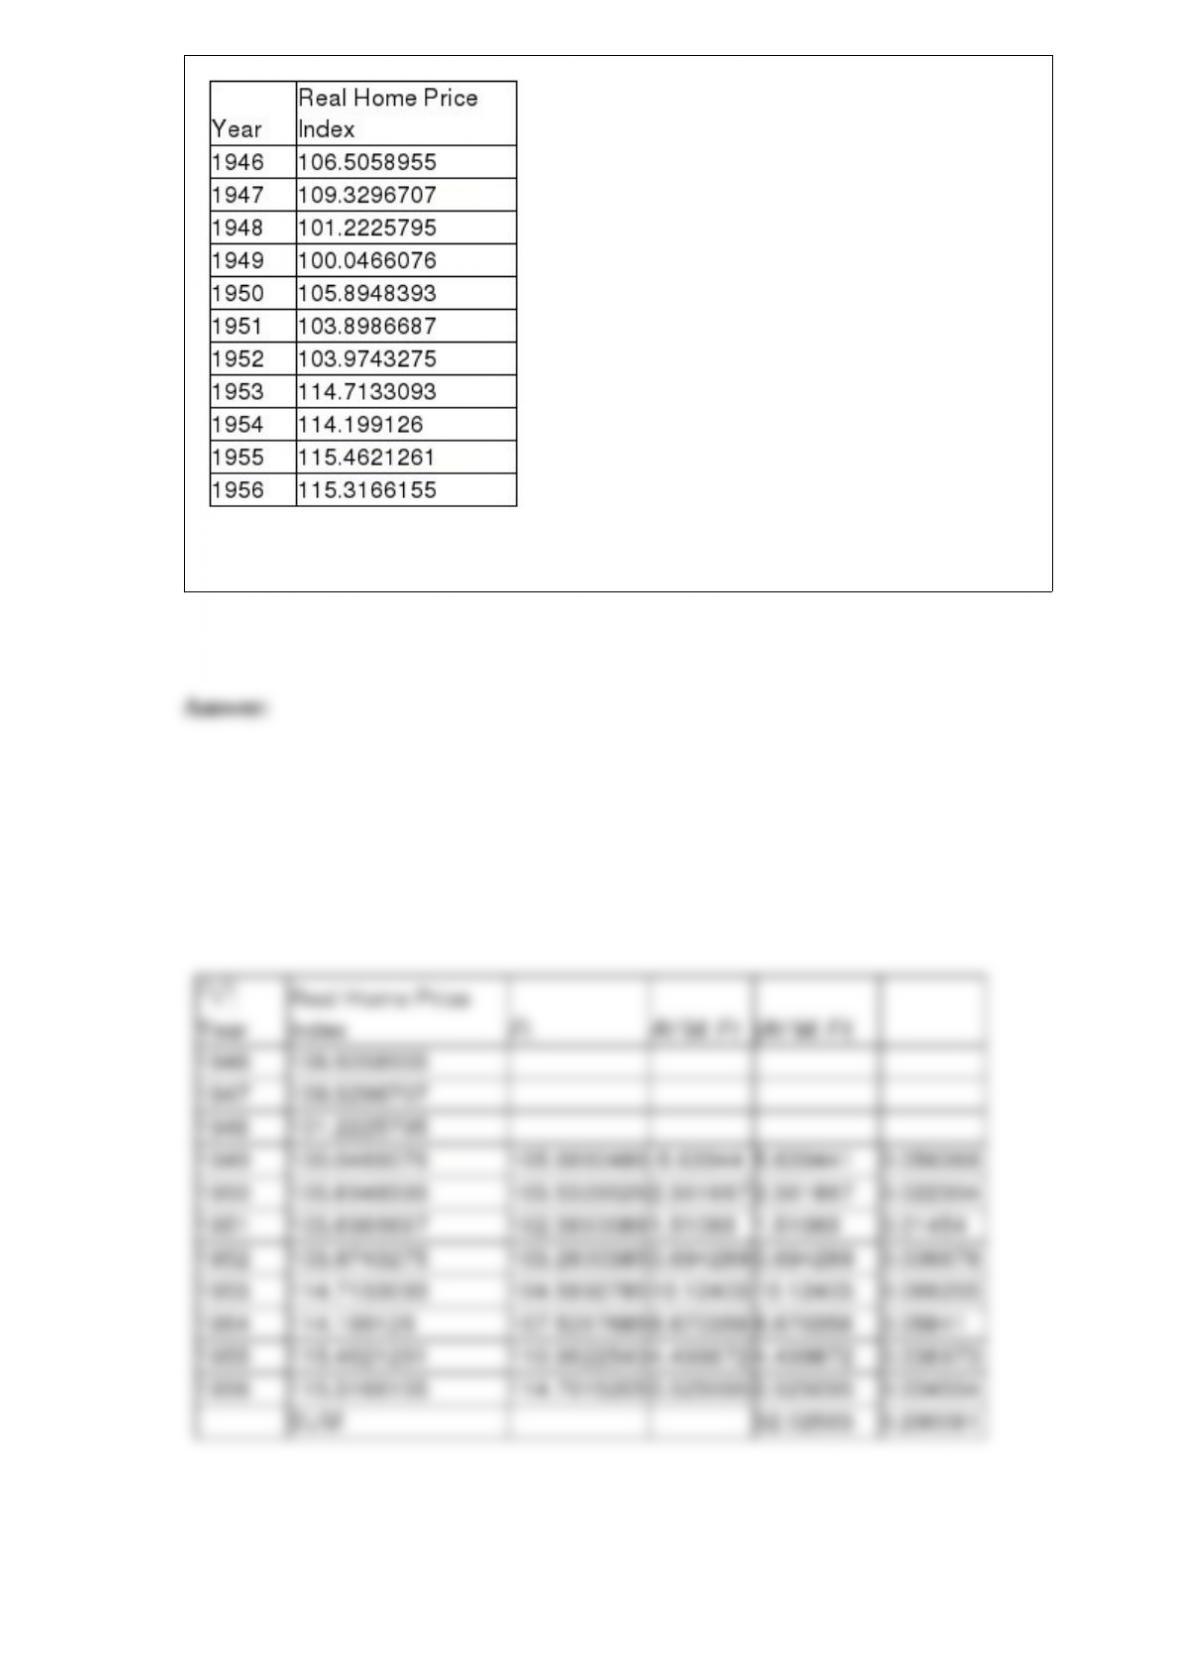
Setting k = 3, determine the value of mean absolute percentage of error.

Explain how data are used by accountants, economists, and operations managers.
P(Q|P) = P(Q) – P(P)
What is the expected value of perfect information?
What are multiple parameterized simulations?