In a Mann-Whitney U test, if the sample sizes are large then the test statistic can be
approximated by the student’s t-distribution.
The primary application for the hypergeometric probability distribution is in situations
where the sampling is done without replacement from a finite population.
The test statistic that is used when testing a null hypothesis for a population variance is
the standard normal z-value.
When determining sample size for a proportion, using p = 0.5 will produce the smallest
possible value for n.
Descriptive statistics allow a decision maker to reach a conclusion about a population
based on a subset from the population.
When using the p-value method for a two-tailed hypothesis, the p-value is found by
finding the area in the tail beyond the test statistic, then doubling it.
A frozen food company that makes burritos currently has employees making burritos by
hand. It is considering purchasing equipment to automate the process and wants to
determine if the automated process would result in lower variability of burrito weights.
To conduct a hypothesis test using a 0.05 level of significance, the proper format for the
null and alternative hypotheses is (where the current by-hand process is process 1 and
the automated process is process 2).
H0 : ≤
Ha : >

In order for a time series to exhibit a seasonal component, the data must be measured in
periods as short or shorter than quarterly.
Sometime it is necessary to assign probabilities based on a person’s belief that an
outcome will occur.
A major package delivery company claims that at least 95 percent of the packages it
delivers reach the destination on time. As part of the evidence in a lawsuit against the
package company, a random sample of n = 200 packages was selected. A total of 188 of
these packages were delivered on time. Using a significance level of .05, the test
statistic for this test is approximately z = -0.65.

A New Jersey company relies on a steady supply of power to keep its manufacturing
going. Recently at a planning meeting, the general manager stated that the chance of a
rolling blackout affecting production is 0.15. She most likely made this assessment
using subjective probability assessment.
If given a choice in collecting data on age for use as an independent variable in a
regression model, a decision maker would generally prefer to record the actual age
rather than an age category so as to avoid using dummy variables.
An open-end question requires respondents to choose from a short list of choices
The symbol μ is used to represent the sample mean.
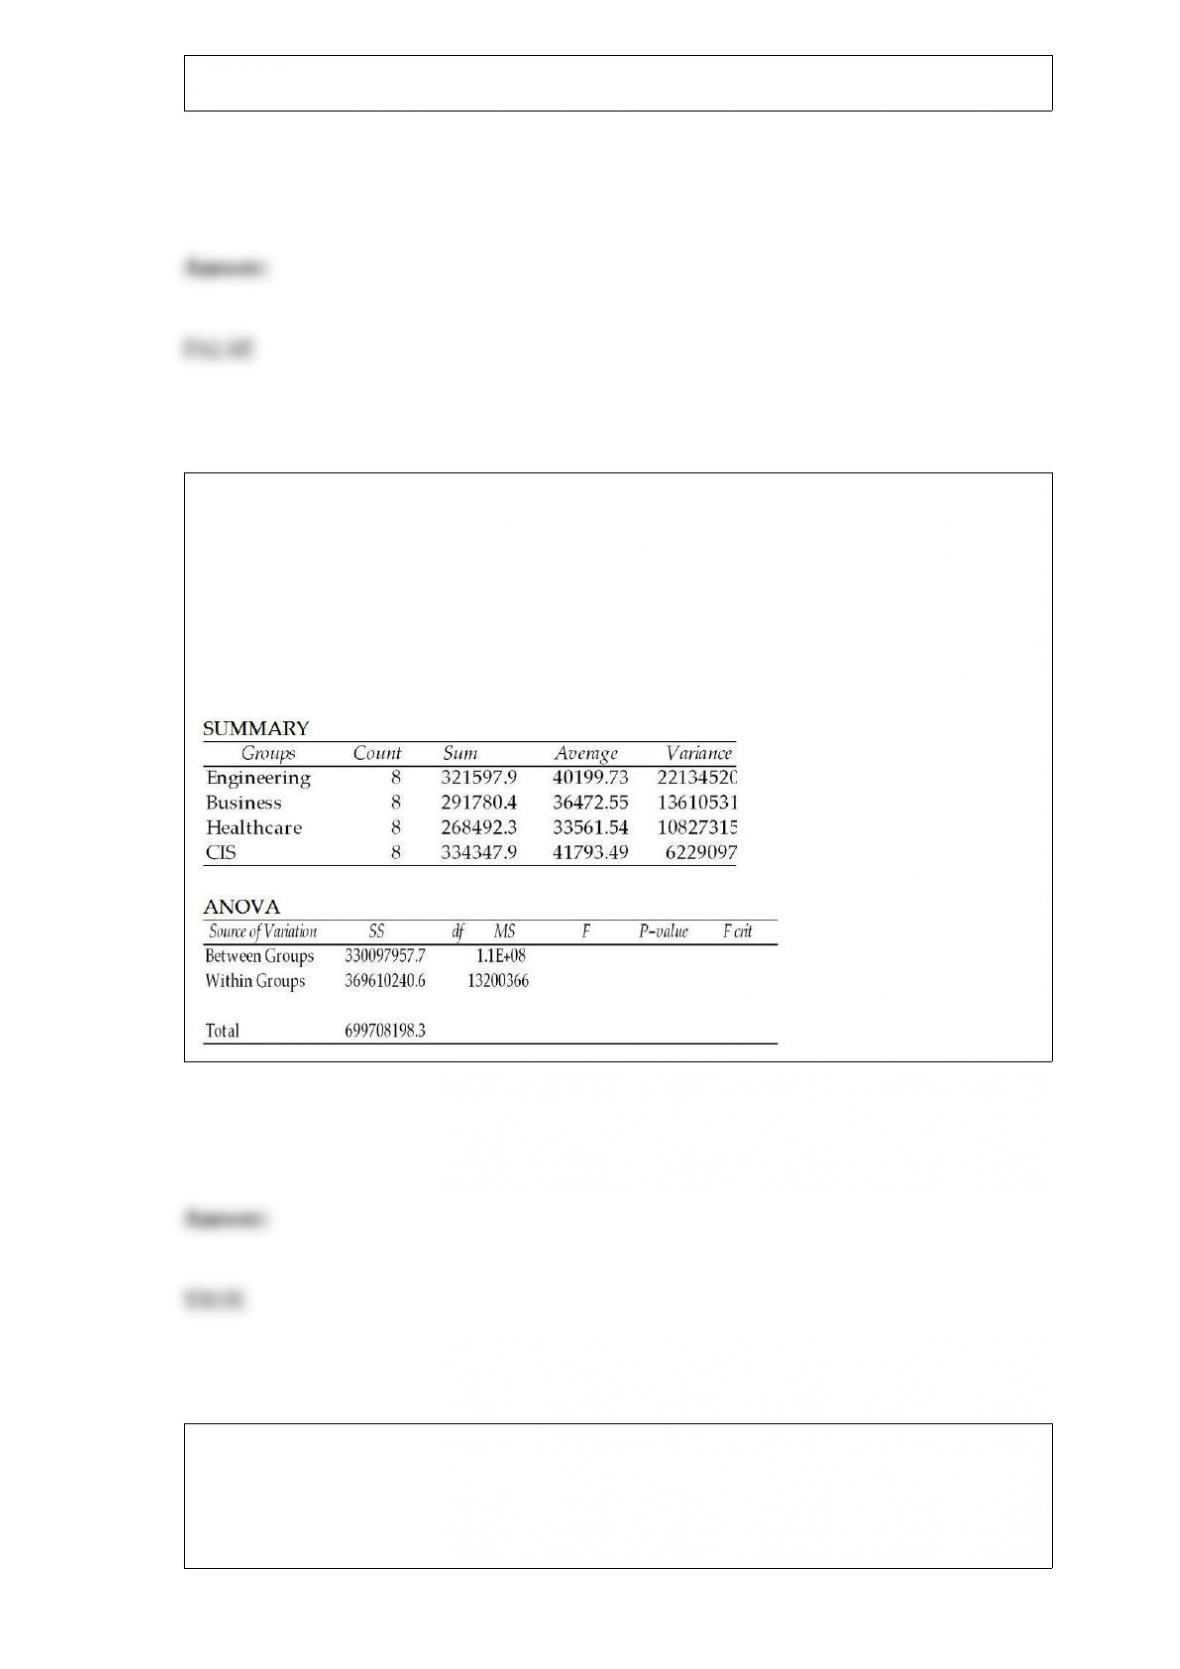
A study was recently conducted to see whether the mean starting salaries for graduates
of engineering, business, healthcare, and computer information systems majors differ. A
random sample of 8 graduates was selected from each major. The following chart shows
some of the results of the ANOVA computations; however, some of the output is
missing. If it had been included, the calculated test statistic would be F = 8.33.
ANOVA: Single Factor
If you were planning to take a small group out to dinner on a Thursday evening and you
were considering whether to call ahead for a reservation, the method of probability
assessment you would most likely use to assess the chances of being able to get in for
dinner without having a reservation would be subjective assessment.

One of the roles of managers who are overseeing the statistical process control analysis
is to set the control limits at the desired levels prior to collecting data from the process.
A statement in the newspaper attributed to the leader of a local union stated that the
average hourly wage for union members in the region is $13.35. He indicated that this
number came from a survey of union members. If an estimate was developed with 95
percent confidence, we can safely conclude that this value is within 95 percent of the
true population mean hourly wage.
The method of data collection called direct observation is always associated with
gathering data from people.

In a two-factor ANOVA study, if the two factors do not interact, then neither factor A
nor factor B can be considered statistically significant.
The interquartile range contains the middle 50 percent of a data set.
A plot of the time series with time on the horizontal axis is an effective means of
assessing whether the series is linear or nonlinear.
If a scatter diagram shows points that are reasonably aligned and are sloping downward
from left to right, this implies that there is a negative linear relationship between the
two variables.
In a two-factor ANOVA design, the variances of the populations are assumed to be
equal unless there is interaction present.
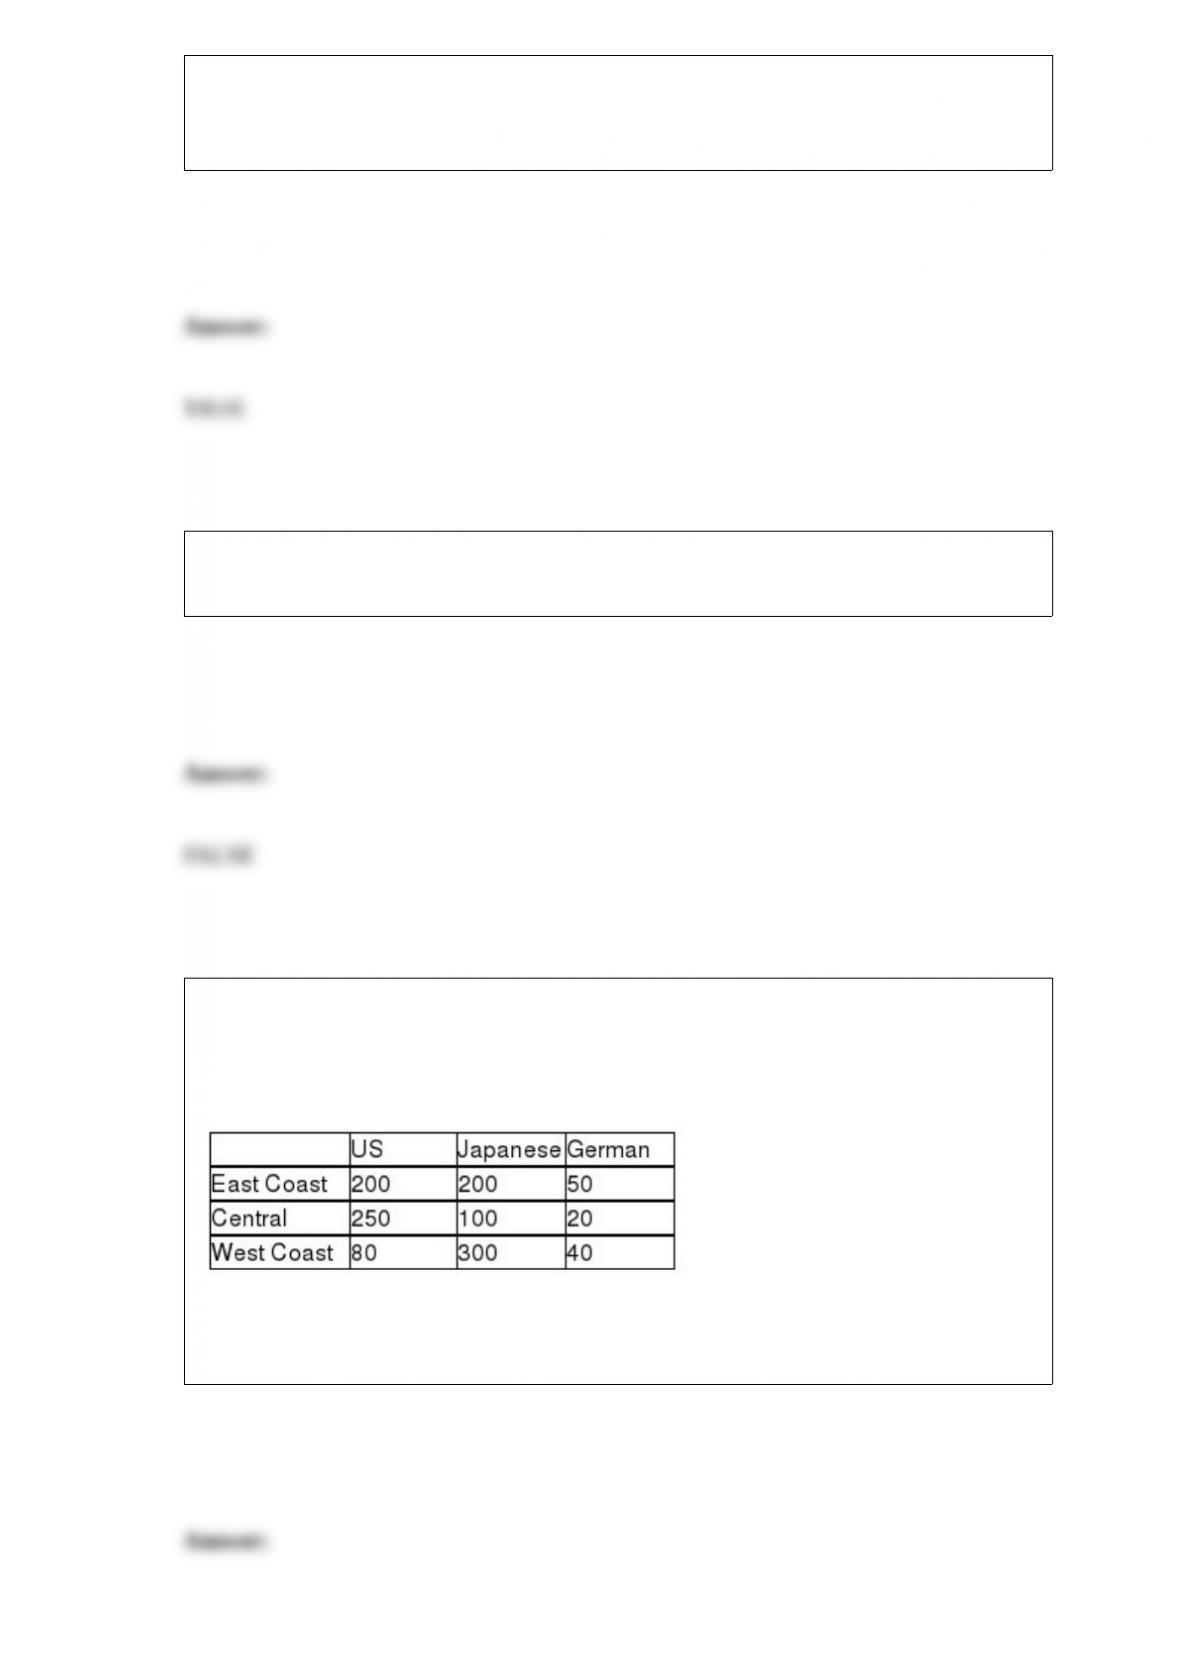
A study was recently done in the United States in which car owners were asked to
indicate whether their most recent car purchase was a U.S. car, a German car, or a
Japanese car. The people in the survey were divided by geographic region in the United
States. The following data were recorded.
Given this situation, to test whether the car origin is independent of the geographical
location of the buyer, the sum of the expected cell frequencies will equal 1,240.

In a simple regression model, the slope coefficient represents the average change in the
independent variable for a one-unit change in the dependent variable.
Three brands of running shoes are each tested by 10 different runners. The amount of
wear on the sole of the shoes is then measured. The objective is to determine if there is
any difference among the three brands of shoes based on how long the soles last. The
degrees of freedom for testing whether there is any blocking effect D1 = 9 and D2 = 18.
If the time it takes for a customer to be served at a fast-food chain business is thought to
be uniformly distributed between 3 and 8 minutes, then the probability that the time it
takes for a randomly selected customer to be served will be less than 5 minutes is 0.40.
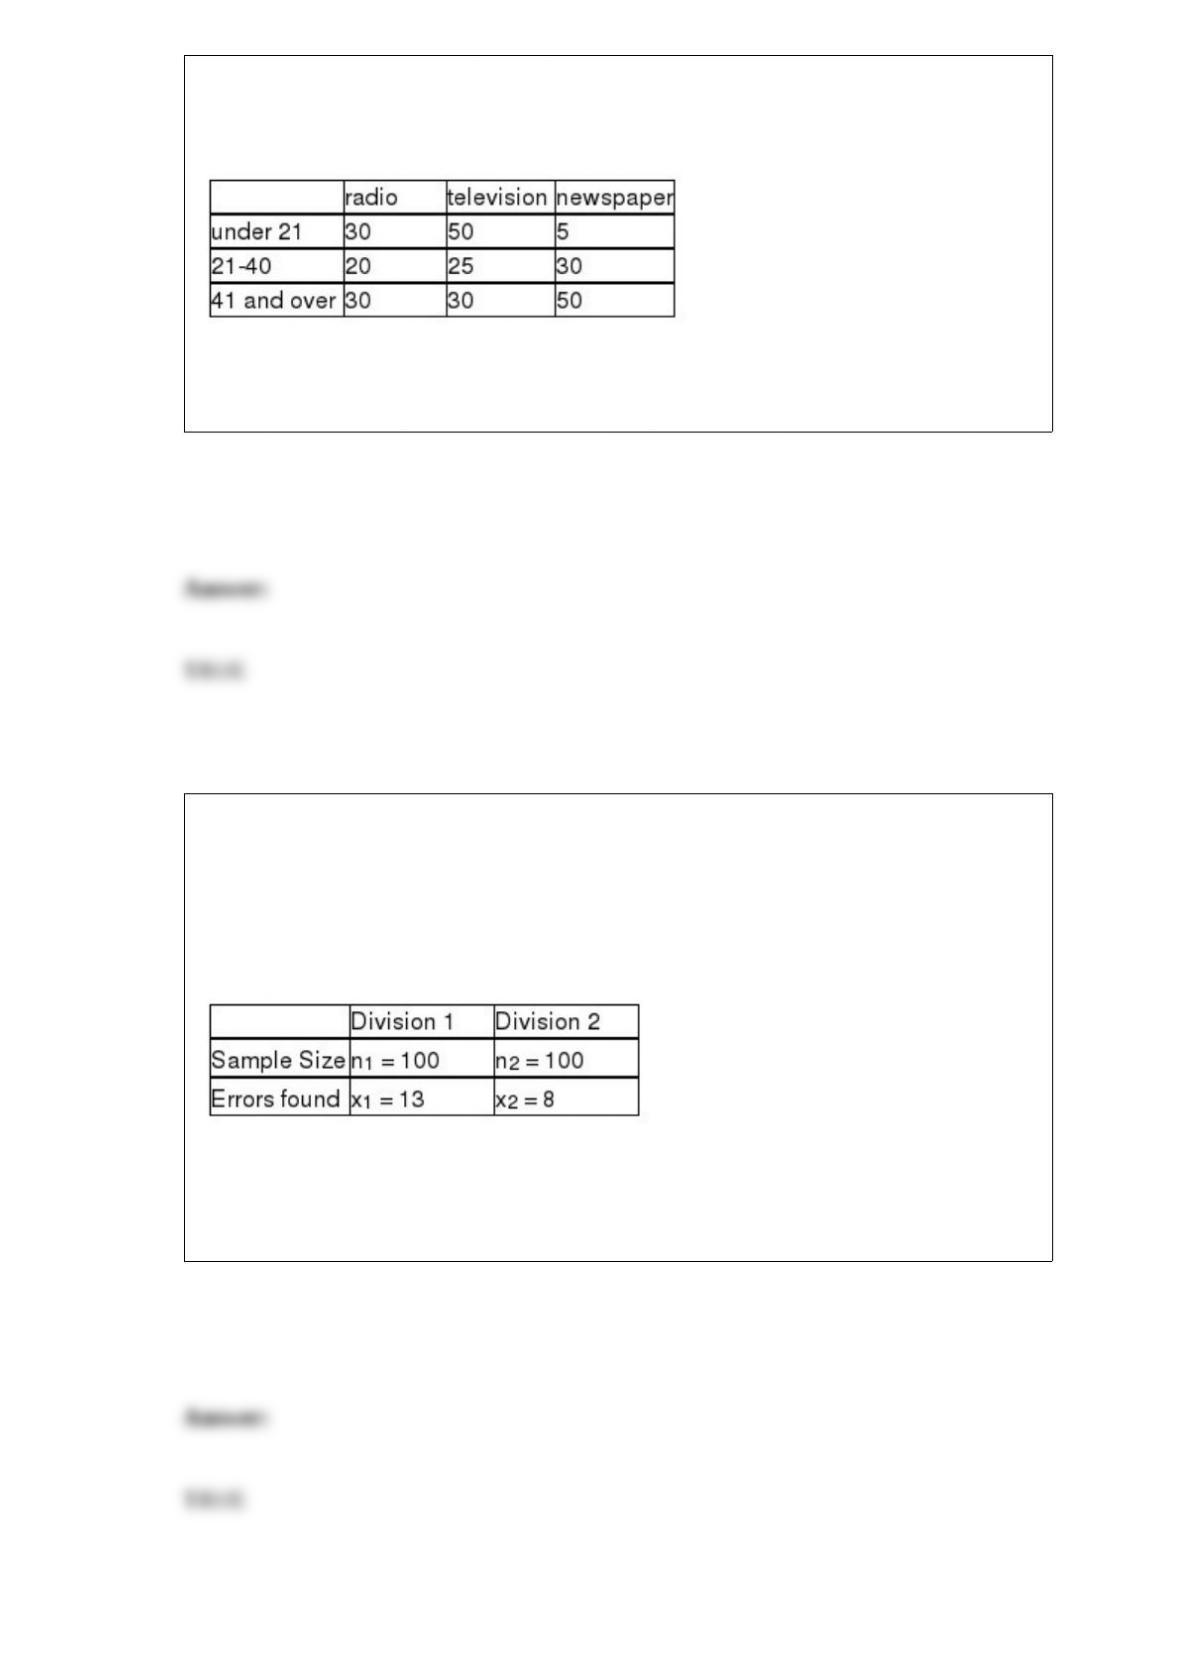
A study was recently conducted in which people were asked to indicate which news
medium was their preferred choice for national news. The following data were
observed:
Given this data, if we wish to test whether the preferred news source is independent of
age, for an alpha = .05 level, the test statistic is computed to be approximately 40.70.
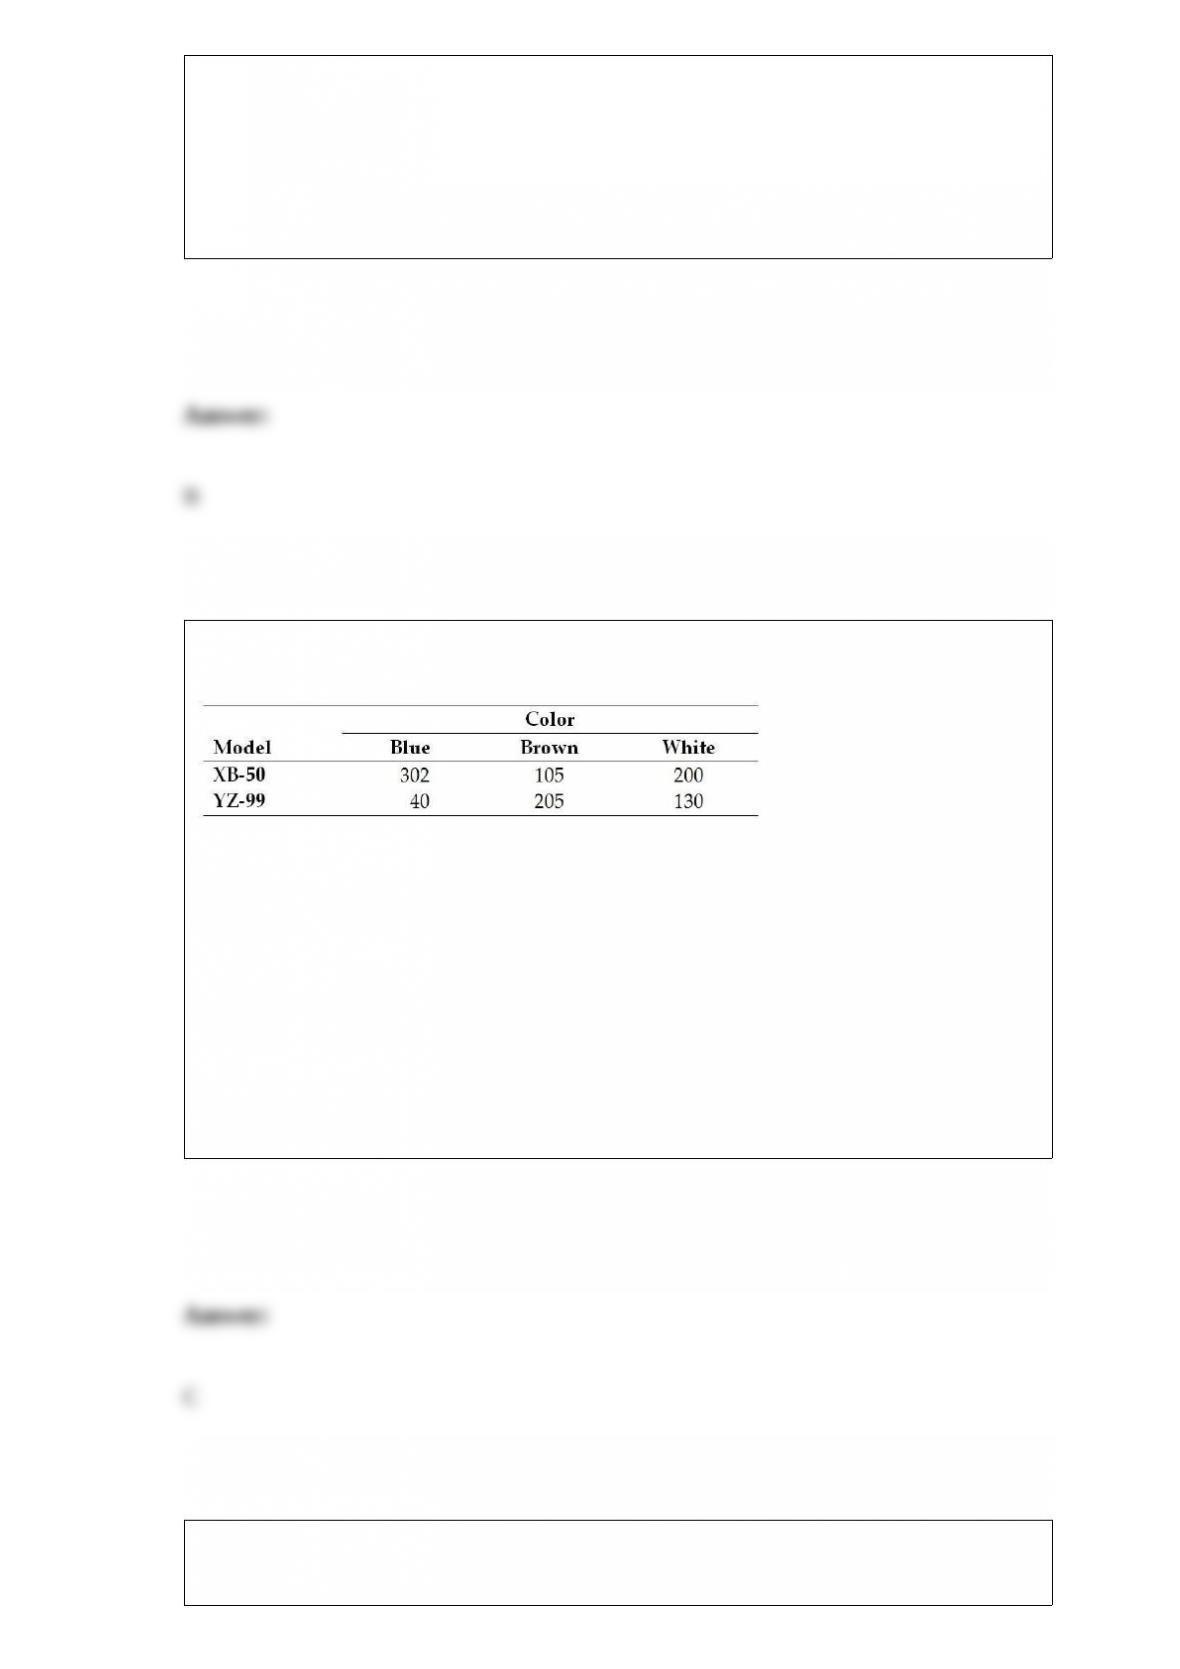
An accounting firm has been hired by a large computer company to determine whether
the proportion of accounts receivables with errors in one division (Division 1) exceeds
that of the second division (Division 2). The managers believe that such a difference
may exist because of the lax standards employed by the first division. To conduct the
test, the accounting firm has selected random samples of accounts from each division
with the following results.
Based on this information and using a significance level equal to 0.05, the test statistic
for the hypothesis test is approximately 1.153 and, therefore, the null hypothesis is not
rejected.

One way to develop a frequency distribution using Excel is to use the Frequency
function.
The First National Bank mailed out a survey to all 3,456 savings account customers. A
total of 568 surveys were returned. Values computed from the returned surveys would
constitute parameters since all 568 customers were surveyed.
In the Wilcoxon signed rank test using either small or large sample sizes, any value that
equals the hypothesized median is discarded from the analysis.
A scatter plot is useful for identifying a linear relationship between the independent and
dependent variable, but it is not particularly useful if the relationship is curvilinear.

While virtually all time series exhibit a random component, not all time series exhibit
other components.
Bar charts can show either frequency or percentage.
The higher the level of confidence, the wider the confidence interval must be.

The makers of a particular type of candy have stated that 75 percent of their sacks of
candy will contain 6 ounces or more of candy. A consumer group that studies such
claims recently selected a random sample of 100 sacks of this candy. Of these, 70 sacks
actually contained 6 ounces or more. The probability that 70 or fewer sacks would
contain 6 ounces or less is approximately 0.1251.
A hospital emergency room has collected a sample of n = 40 to estimate the mean
number of visits per day. It has found the standard deviation is 32. Using a 90 percent
confidence level, what is its margin of error?
A) Approximately 1.5 visits
B) About 9.9 visits
C) Approximately 8.3 visits
D) About 1.3 visits
A homeowners association consists of 20 homes. The family in each home is considered
an automatic member of the association. Recently, one of the homes fell into a state of
disrepair. A survey was conducted of the homeowners both on the same street as the
house in question and on the second street. At issue was whether legal action should be
brought against the homeowner with the problem house. There are 8 homes on the same
street as the problem house and 6 of these called for legal action. The percentage of
houses on the second street that favored legal action is 50 percent. Which type of chart
might be most effective for conveying the information about percentage of residents
favoring legal action by street?

A) Histogram
B) Stem and leaf diagram
C) Bar chart
D) Pie chart
Which of the following forecasting methods allows the decision maker to weigh the
past time series differently to make the model more sensitive to more recent data?
A) Linear trend regression model
B) Moving average model
C) Exponential smoothing
D) Deseasonalizing the time series
A major U.S. automaker has determined that the city mileage for one of its new SUV
models is normally distributed with a mean equal to 15.2 mpg. A report issued by the
company indicated that 22 percent of the SUV model vehicles will get more than 17
mpg in the city. Given this information, what is the city mileage standard deviation for
this SUV model?
A) 0.77 mpg
B) Approximately 2.34 mpg
C) 1.8 mpg
D) Approximately 3.1 mpg
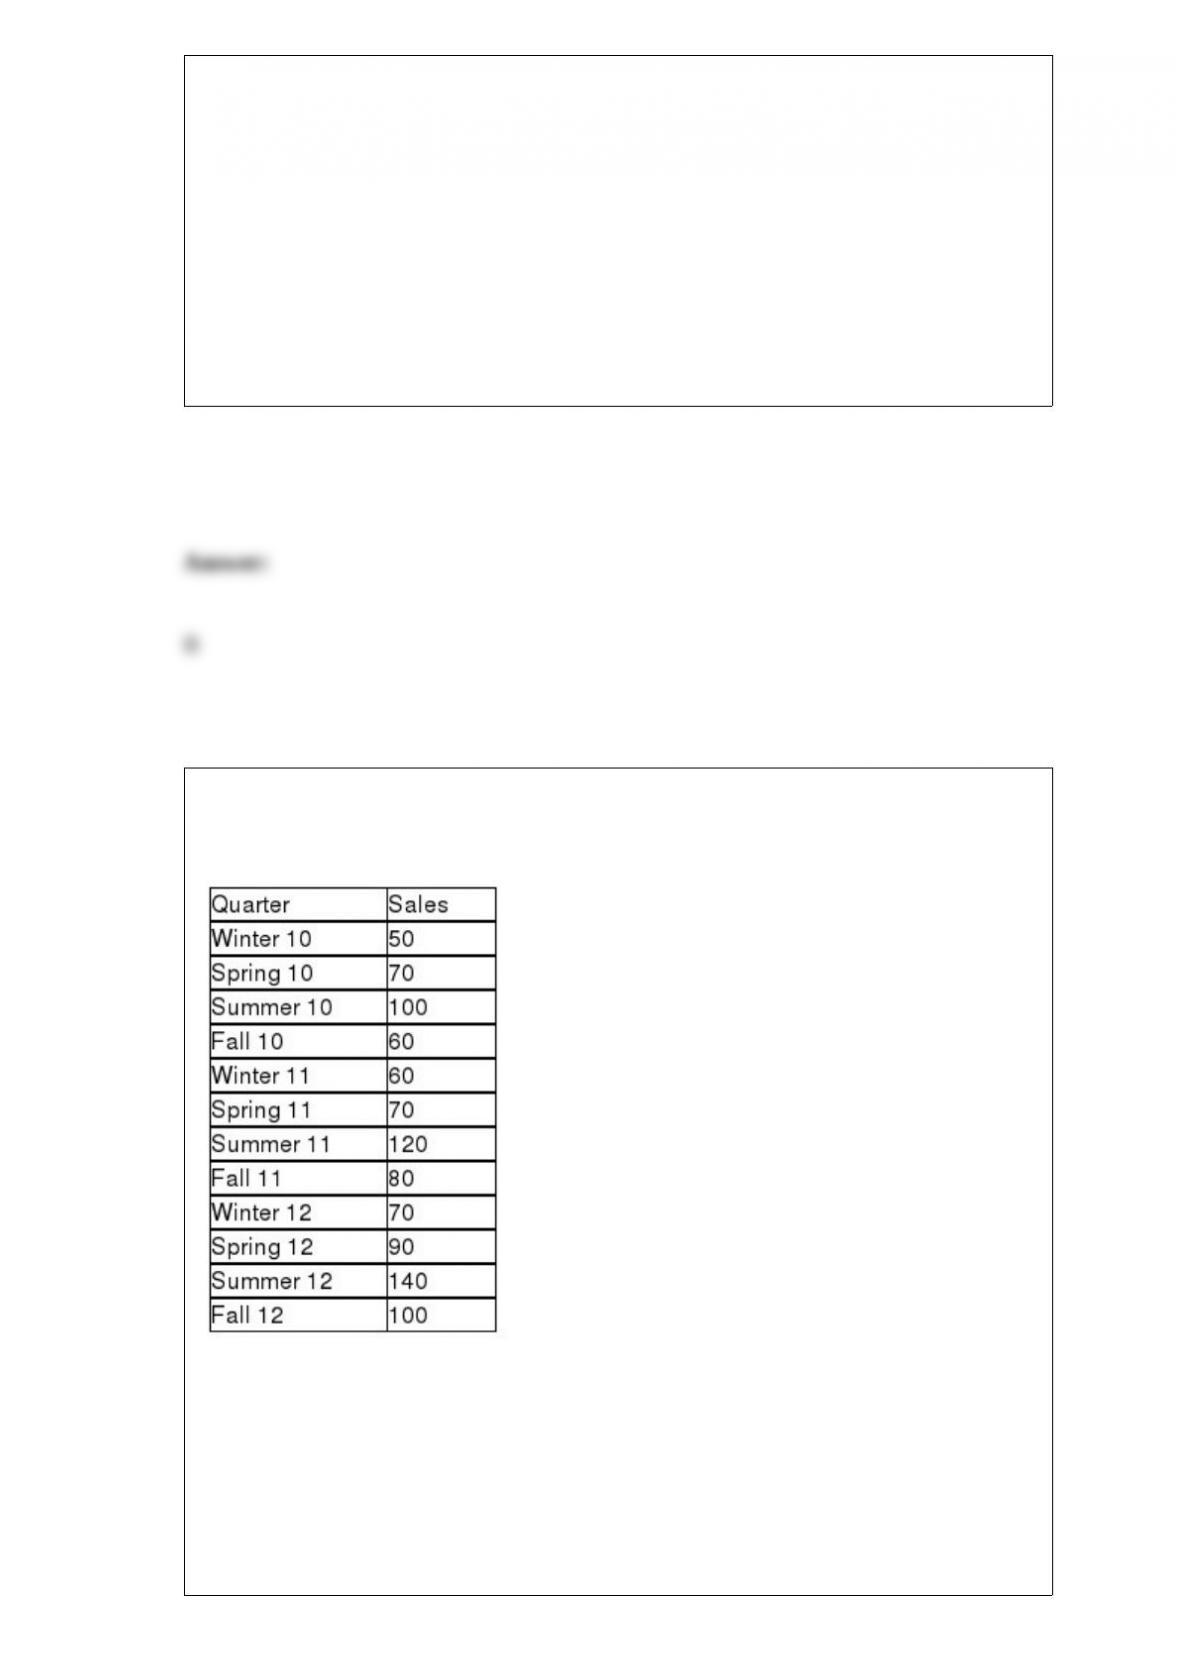
Cross County Bicycles makes two mountain bike models that each come in three
colors. The following table shows the production volumes for last week:
Based on the relative frequency assessment method, what is the probability that a
manufactured item is brown?
A) 0.2088
B) 0.3819
C) 0.3157
D) 0.1324
The number of customers who enter a bank is thought to be Poisson distributed with a
mean equal to 10 per hour. What are the chances that no customers will arrive in a

15-minute period?
A) Approximately zero
B) 0.0067
C) 0.0821
D) 0.0250
In an article entitled “Childhood Pastimes Are Increasingly Moving Indoors,” Dennis
Cauchon asserts that there have been huge declines in spontaneous outdoor activities
such as bike riding, swimming, and touch football. In the article, he cites separate
studies by the national Sporting Goods Association and American Sports Data that
indicate bike riding alone is down 31% from 1995 to 2004. According to the surveys,
68% of 7- to 11-year-olds rode a bike at least six times in 1995 and only 47% did in
2004. Assume the sample sizes were 1,500 and 2,000, respectively.
Calculate a 95% confidence interval to estimate the proportion of 7- to 11-year-olds
who rode their bike at least six times in 2004.
A) (0.4481, 0.4919)
B) (0.4324, 0.4676)
C) (0.4021, 0.5179)
D) (0.4712, 0.4888).
If a sample with n = 60 subjects distributed over 3 categories was selected, a chi-square
test for goodness-of-fit will be used. How many degrees of freedom will be used in
determining the chi-square test statistic?
A) 1
B) 2
C) 16
D) 64
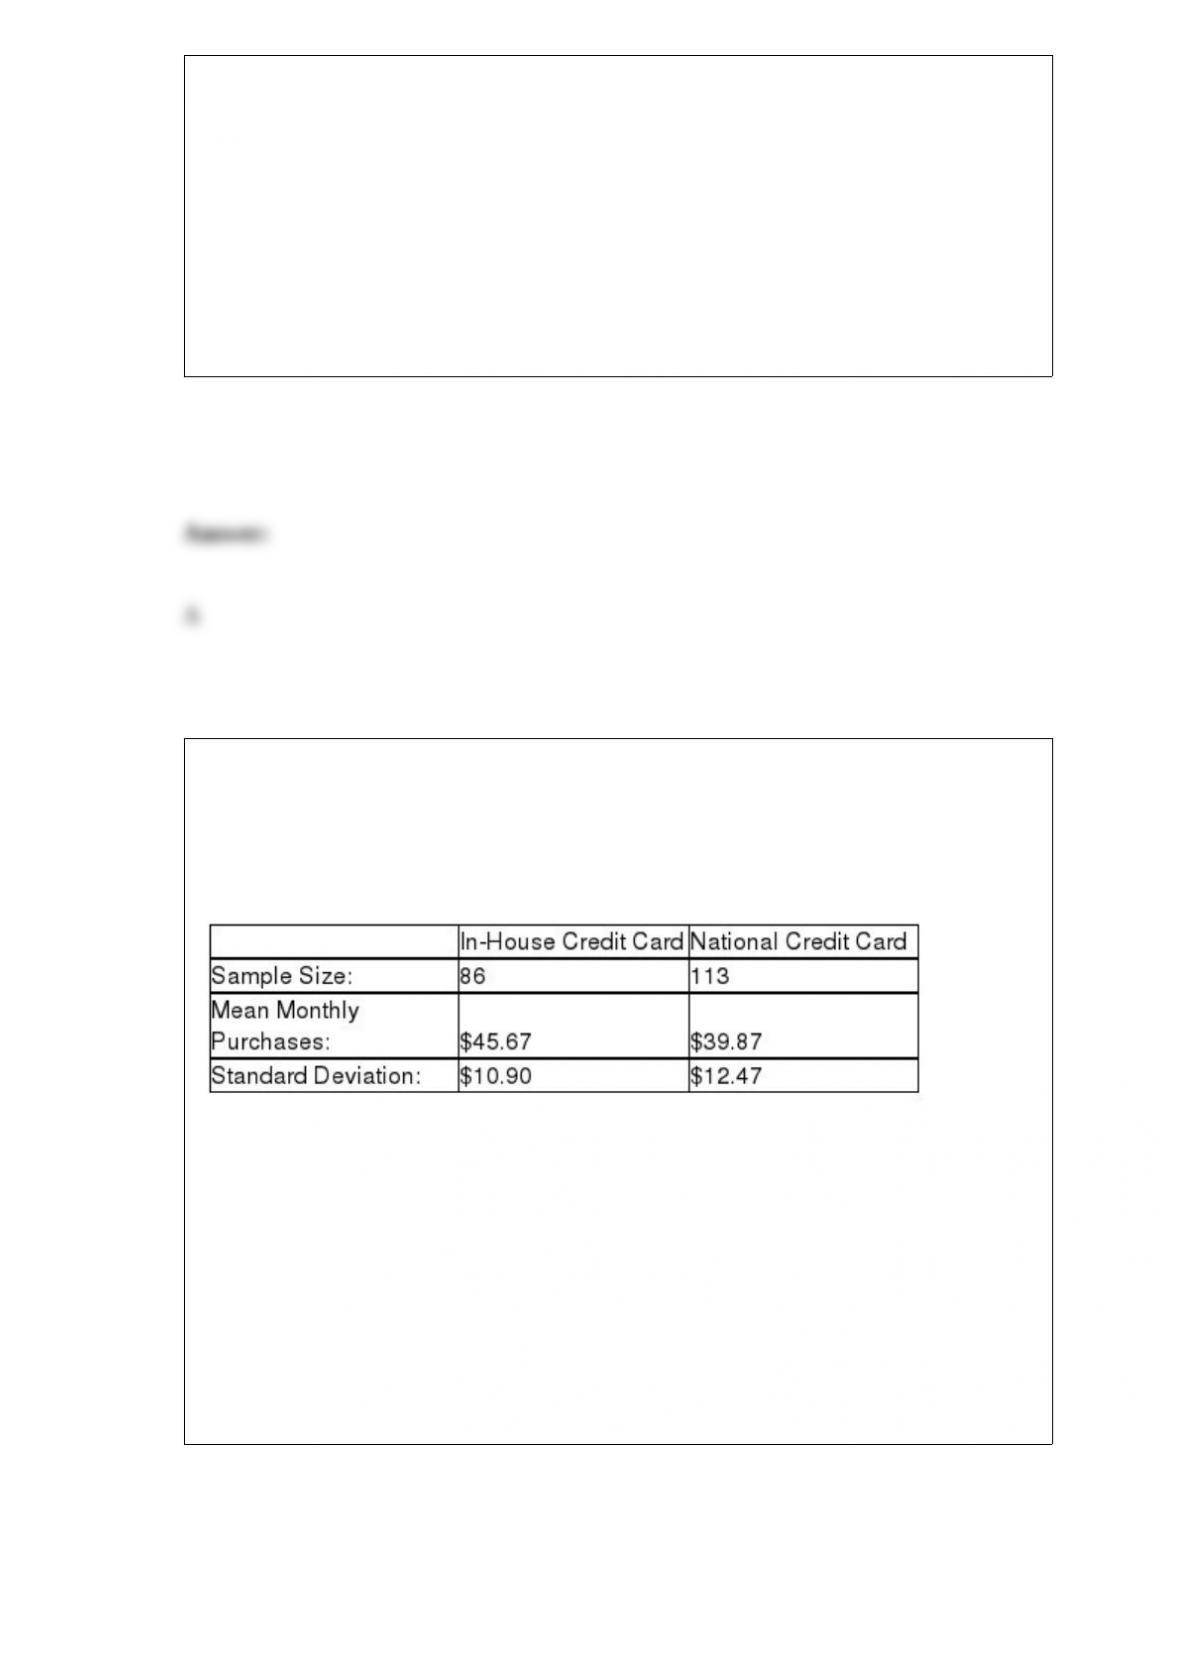
The Boxer Company has been in business since 1998. The following sales data are
recorded by quarter for the years 2010-2012.
The managers at the company wish to determine the seasonal indexes for each quarter
during the year. The index for the summer quarter is:
A) approximately 1.39
B) less than 1.1

C) about 087
D) approximately 159
Many Walmart stores have automotive departments where customers can buy tires,
have their vehicles serviced, and obtain other automotive services. Recently, the
manager at an Ohio Walmart collected data on the time customers had to wait to get the
desired automotive service. Of the 500 cars in the sample, the shortest time any
customer spent waiting was 3 minutes and the longest time was 183 minutes. Assuming
that the manager wishes to develop a frequency distribution with 9 classes, which of the
following would be an appropriate class width for each class?
A) 10.50
B) 19.99
C) 20.00
D) 3 to 23
A regression analysis between sales (Y) and advertising (X) (both in dollars) resulted in
the following equation:
= 100 + 2000X
The above equation implies that an
A) increase of $1 in advertising is correlated with an increase of $2,000 in sales.

B) increase of $1 in advertising is correlated with an increase of $2 in sales.
C) increase of $1 in advertising is correlated with an increase of $100 in sales.
D) increase of $1 in advertising is correlated with an increase of $2100 in sales.
Employees at a large computer company earn sick leave in one-minute increments
depending on how many hours per month they work. They can then use the sick leave
time any time throughout the year. Any unused time goes into a sick bank account that
they or other employees can use in the case of emergencies. The human resources
department has determined that the amount of unused sick time for individual
employees is uniformly distributed between 0 and 480 minutes. The company has
decided to give a cash payment to any employee that returns over a specified amount of
sick leave minutes. Assuming that the company wishes no more than 5 percent of all
employees to get a cash payment, what should the required number of minutes be?
A) 24 minutes
B) 419 minutes
C) 456 minutes
D) 470 minutes
Men have a reputation for not wanting to ask for directions. A Harris study conducted
for Lincoln Mercury indicated that 42% of men and 61% of women would stop and ask

for directions. The U.S. Census Bureau’s 2012 population estimate was that for
individuals 18 or over, 48.2% were men and 51.8% were women. This exercise
addresses this age group.
Given that a driver stops to ask for directions, determine the probability that the driver
was a man.
A) 0.518
B) 0.420
C) 0.316
D) 0.390
For a binomial distribution with a sample size equal to 10 and a probability of a success
equal to 0.30, what is the probability that the sample will contain exactly three
successes? Use the binomial formula to determine the probability.
A) 0.3277
B) 0.3288
C) 0.2668
D) 0.2577

If a business manager selected a sample of customers and computed the mean income
for this sample of customers, she has computed:
A) a statistic.
B) an ordinal value.
C) a nominal value.
D) a parameter.
An advertising company has developed a new ad for one of the national car
manufacturing companies. The ad agency is interested in testing whether the proportion
of favorable response to the ad is the same between male adults versus female adults. It
plans on conducting the test using an alpha level equal to 0.05. A sample of 100 adults
of each gender will be used in the study. Each person will be asked to view the ad and
indicate whether they find the ad to be “pleasing” or not. Given this information, what
is the critical value?
A) z = 1.645
B) t = 1.96
C) z = 1.96
D) Can’t be determined without knowing the results of the sample.
When a marketing manager surveys a few of the customers for the purpose of drawing a
conclusion about the entire list of customers, she is applying:
A) inferential statistics.
B) descriptive statistics.
C) quantitative models.
D) numerical measures.
A major retail clothing store is interested in estimating the difference in mean monthly
purchases by customers who use the store’s in-house credit card versus using a Visa,
Mastercard, or one of the other major credit cards. To do this, it has randomly selected a
sample of customers who have made one or more purchases with each of the types of
credit cards. The following represents the results of the sampling:
Based on these sample data, what is the lower limit for the 95 percent confidence
interval estimate for the difference between population means?
A) About $5.28
B) Approximately $4.85
C) Approximately $2.54
D) Approximately $3.41
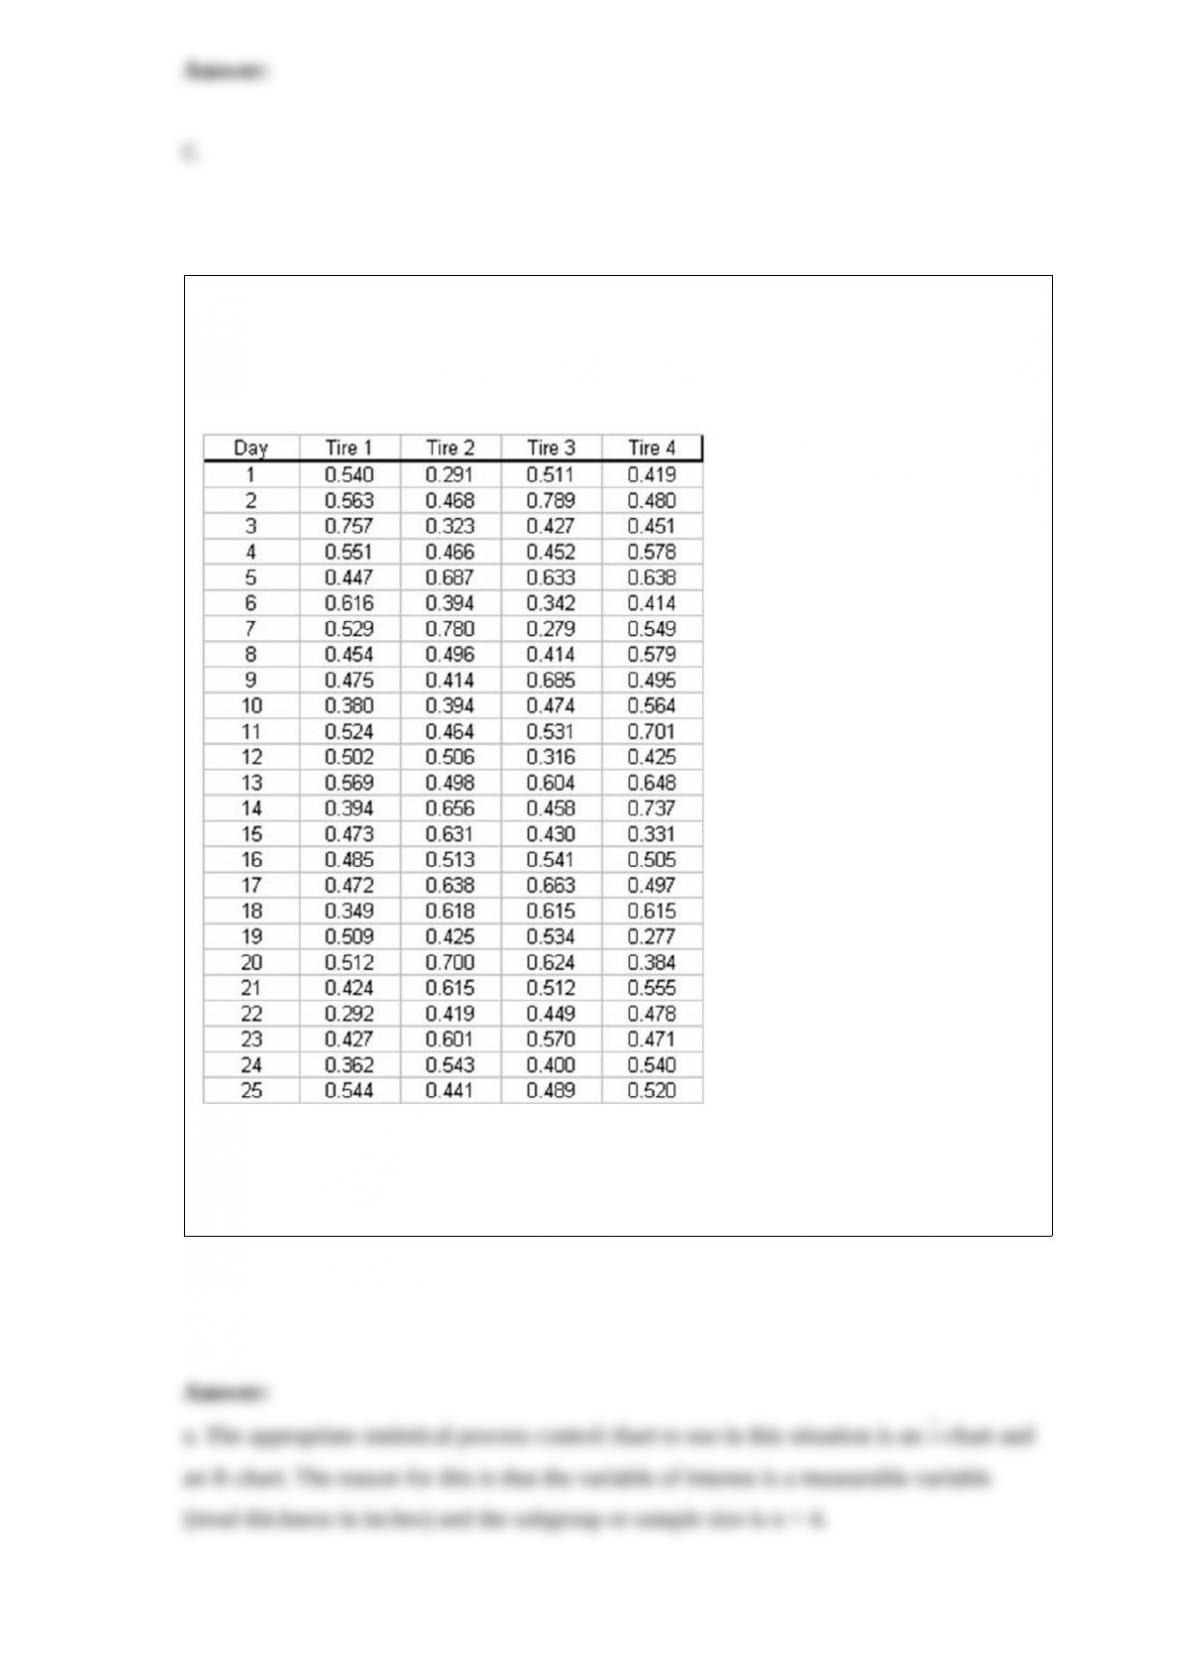
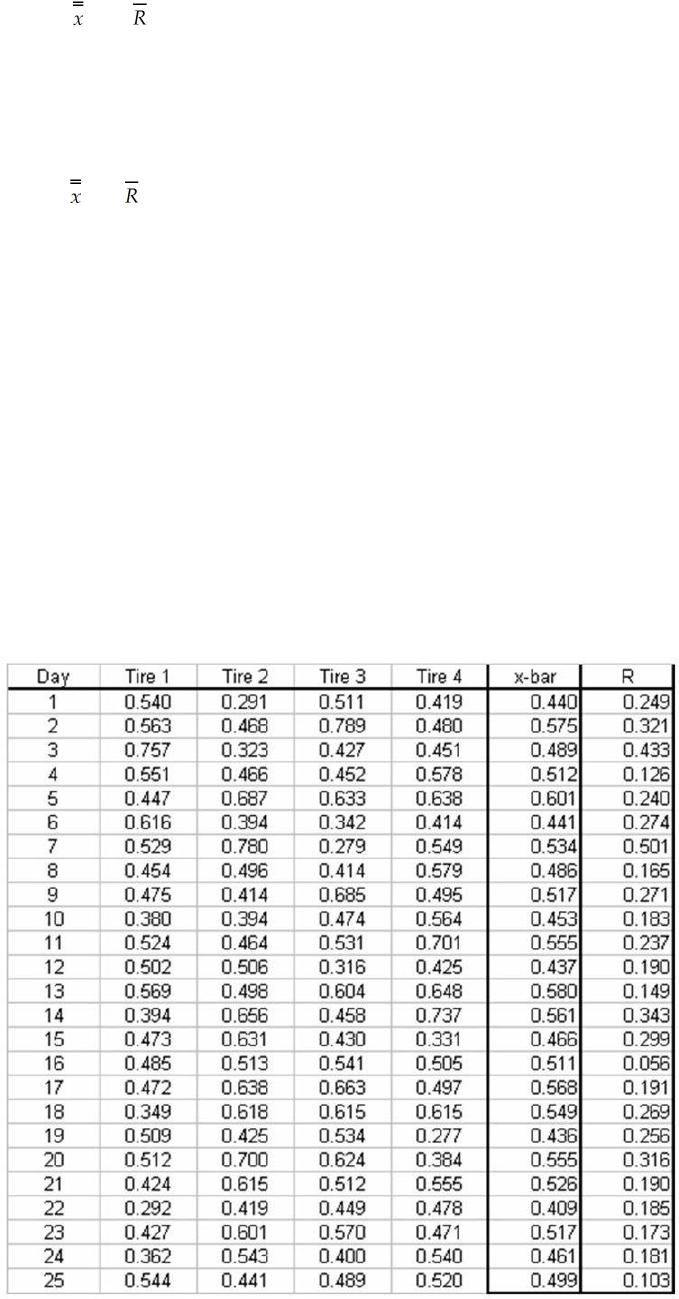
A tire company is interested in monitoring the process that produced tread thickness on
its tires. Every hour 4 tires are selected from production and the tread thickness is
measured. Data for the past 25 days is shown as follows:
a. What type of control chart would you recommend be used in this case?
b. Compute the upper and lower control limits for these data.

The process of selecting the forecasting technique to use in a particular application is
called:
A) model diagnosis.
B) model specification.
C) validity checking.
D) model fitting.
In a local community there are three grocery chain stores. The three have been carrying
out a spirited advertising campaign in which each claims to have the lowest prices. A
local news station recently sent a reporter to the three stores to check prices on several
items. She found that for certain items each store had the lowest price. This survey
didn’t really answer the question for consumers. Thus, the station set up a test in which
20 shoppers were given different lists of grocery items and were sent to each of the
three chain stores. The sales receipts from each of the three stores are recorded in the
data file Groceries.
Based on a significance level of 0.05 and these sample data, test to determine whether
blocking was necessary in this example. Use a test-statistic approach.
A) Since 952.6155 > 1.8673 do not reject H0 and conclude that there is an indication
that blocking was not effective.
B) Since 952.6155 > 1.8673 reject H0 and conclude that there is an indication that
blocking was effective.
C) Since 102.2912 > 1.8673 do not reject H0 and conclude that there is an indication
that blocking was not effective.
D) Since 102.2912 > 1.8673 reject H0 and conclude that there is an indication that
blocking was effective.

The manager for State Bank and Trust has recently examined the credit card account
balances for the customers of her bank and found that 20% have an outstanding balance
at the credit card limit. Suppose the manager randomly selects 15 customers and finds 4
that have balances at the limit. Assume that the properties of the binomial distribution
apply.
What is the probability that 4 or fewer customers in the sample will have balances at the
limit of the credit card?
A) 0.1876
B) 0.8358
C) 0.6482
D) 0.3832
Applebee’s International, Inc., is a U.S. company that develops, franchises, and operates
the Applebee’s Neighborhood Grill and Bar restaurant chain. It is the largest chain of
casual dining restaurants in the country, with over 1,500 restaurants across the United
States. The headquarters is located in Overland Park, Kansas. The company is
interested in determining if mean weekly revenue differs among three restaurants in a
particular city. The file entitled Applebees contains revenue data for a sample of weeks
for each of the three locations.
Based on the data gathered by Applebee’s, can it be concluded that there is a difference
in the average revenue among the three restaurants?
A) The p-value = 0.004 < alpha = 0.05. This indicates that we should not reject the null
hypothesis and conclude that there is not a difference in the average revenue among the

three restaurants.
B) The p-value = 0.004 < alpha = 0.05. This indicates that we should reject the null
hypothesis and conclude that there exists a difference in the average revenue among the
three restaurants.
C) The p-value = 0.084 > alpha = 0.05. This indicates that we should not reject the null
hypothesis and conclude that there is not a difference in the average revenue among the
three restaurants.
D) The p-value = 0.084 > alpha = 0.05. This indicates that we should reject the null
hypothesis and conclude that there exists a difference in the average revenue among the
three restaurants.
The Wilcoxon signed rank test is used to test which of the following type of
hypotheses?
A) Tests about a single population median
B) Tests involving three or more population medians
C) Tests about the variances of two or more populations
D) Tests about two or more population proportions
The hypergeometric probability distribution is used rather than the binomial or the
Poisson when:
A) the sampling is performed with replacement.
B) the sampling is performed without replacement from an infinite population.
C) the sampling is performed without replacement from a finite population.
D) the sampling is performed with replacement from a finite population.
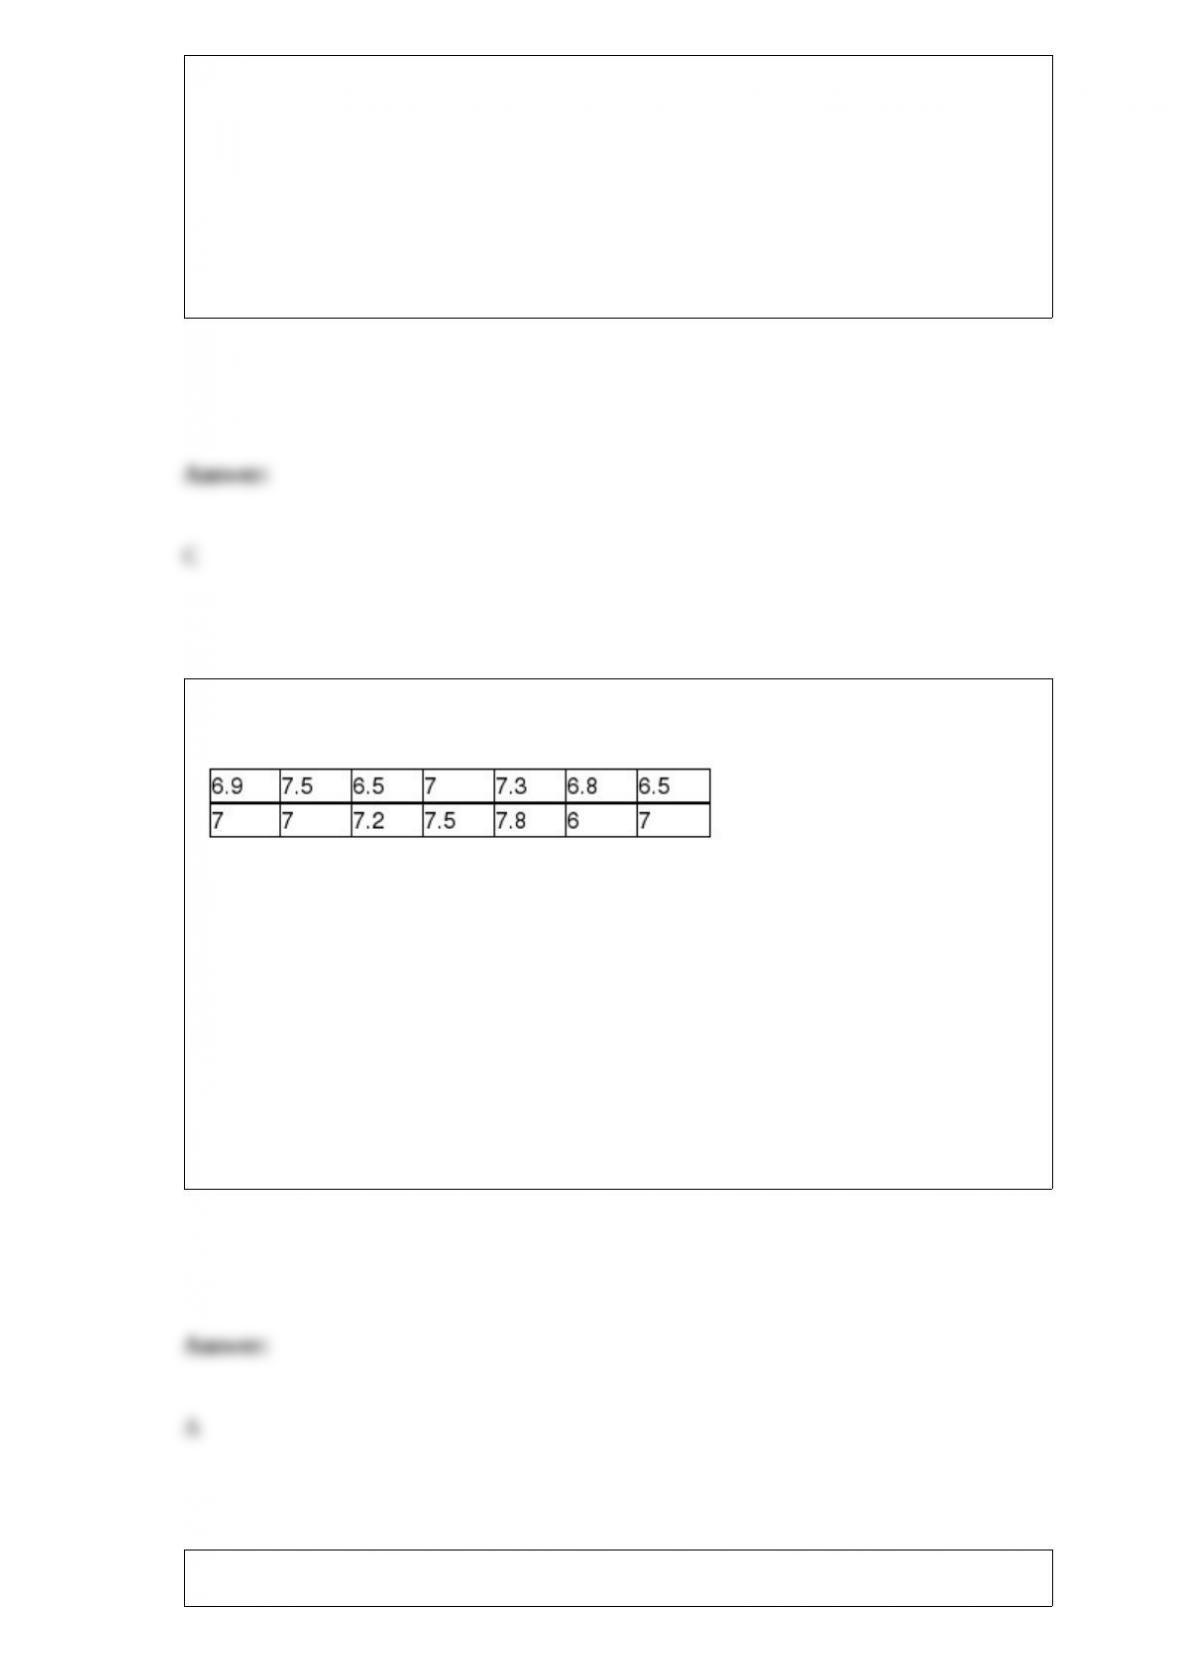
The following values represent the population of home mortgage interest rates (in
percents) being charged by the banks in a particular city:
Given this information, what is the most extreme amount of sampling error possible if a
random sample of n = 4 banks is surveyed and the mean loan rate is calculated?
A) -0.55 percent
B) 0.52 percent
C) 1.08 percent
D) Can’t be determined without more information.
Which one of the following is not a source of variation?
A) People
B) Measurement
C) Materials
D) Control
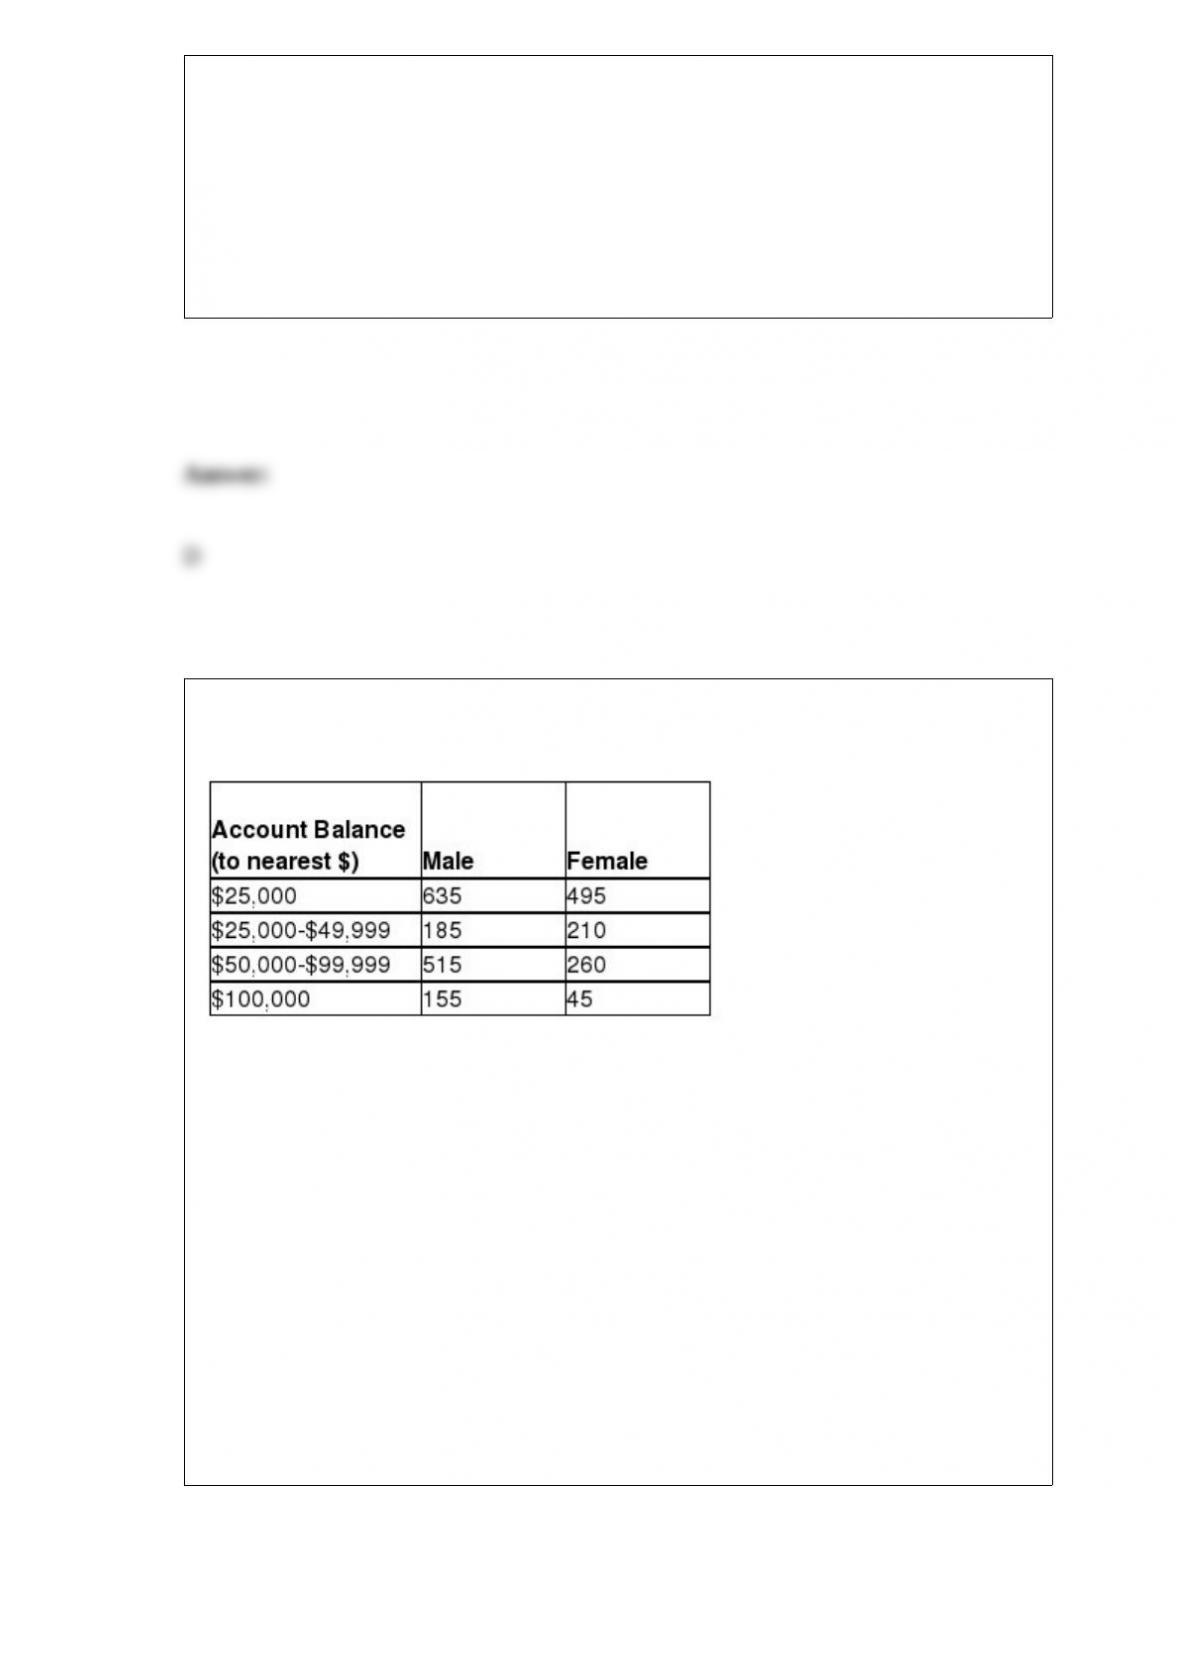
The results of a census of 2,500 employees of a mid-sized company with 401(k)
retirement accounts are as follows:
Suppose researchers are going to sample employees from the company for further
study.
Based on the relative frequency assessment method, what is the probability that a
randomly selected employee will have a 401(k) account balance of between $25,000
and $49,999?
A) 0.1580
B) 0.1040
C) 0.6160
D) 0.4040

Weekly stock closing prices for IBM would be classified as which of the following?
A) Cross-sectional data
B) Time-series data
C) Nominal data
D) Ordinal data
A company that makes shampoo wants to test whether the average amount of shampoo
per bottle is 16 ounces. The standard deviation is known to be 0.20 ounces. Assuming
that the hypothesis test is to be performed using 0.10 level of significance and a random
sample of n = 64 bottles, how large could the sample mean be before they would reject
the null hypothesis?
A) 16.2 ounces
B) 16.049 ounces
C) 15.8 ounces
D) 16.041 ounces