

If the correlation between the dependent variable and the independent variable is
negative, the standard error of the regression slope coefficient in a simple linear
regression model will also be negative.
A company that makes and markets a device that is aimed at helping people quit
smoking claims that at least 70 percent of the people who have used the product have
quit smoking. To test this, a random sample of n = 100 product users was selected. Of
these, 65 people were found to have quit smoking. Given these results, the test statistic
value is z = -1.0911.
When the production manager selects a sample of items that have been produced on her
production line and computes the proportion of those items that are defective, the
proportion is referred to as a statistic.
If you have constructed a joint frequency distribution manually and now wish to


convert it to a joint relative distribution, the proper method is to divide each cell
frequency by the cell’s row total.
In order to make the test for the difference between two population means valid, the
sample size in each independent sample must be the same.
A first step in testing whether two populations have the same mean value using the
t-distribution is to use the chi-square distribution to test whether the populations have
equal variances.
A contingency table and a cross-tabulation table are two separate things and should not
be used for the same purpose.


In a multiple regression model where three independent variables are included in the
model, the percentage of explained variation will be equal to the square of the sum of
the correlations between the independent variables and the dependent variable.
Interaction is the term that is used in a two-factor ANOVA design when the two factors
have different means.
If the correlation of x and y is -0.65, then coefficient of determination is -0.4225.
The primary difference between the binomial distribution and the Poisson distribution is
that the Poisson is used to describe a continuous random variable and the binomial is
used for discrete random variables.
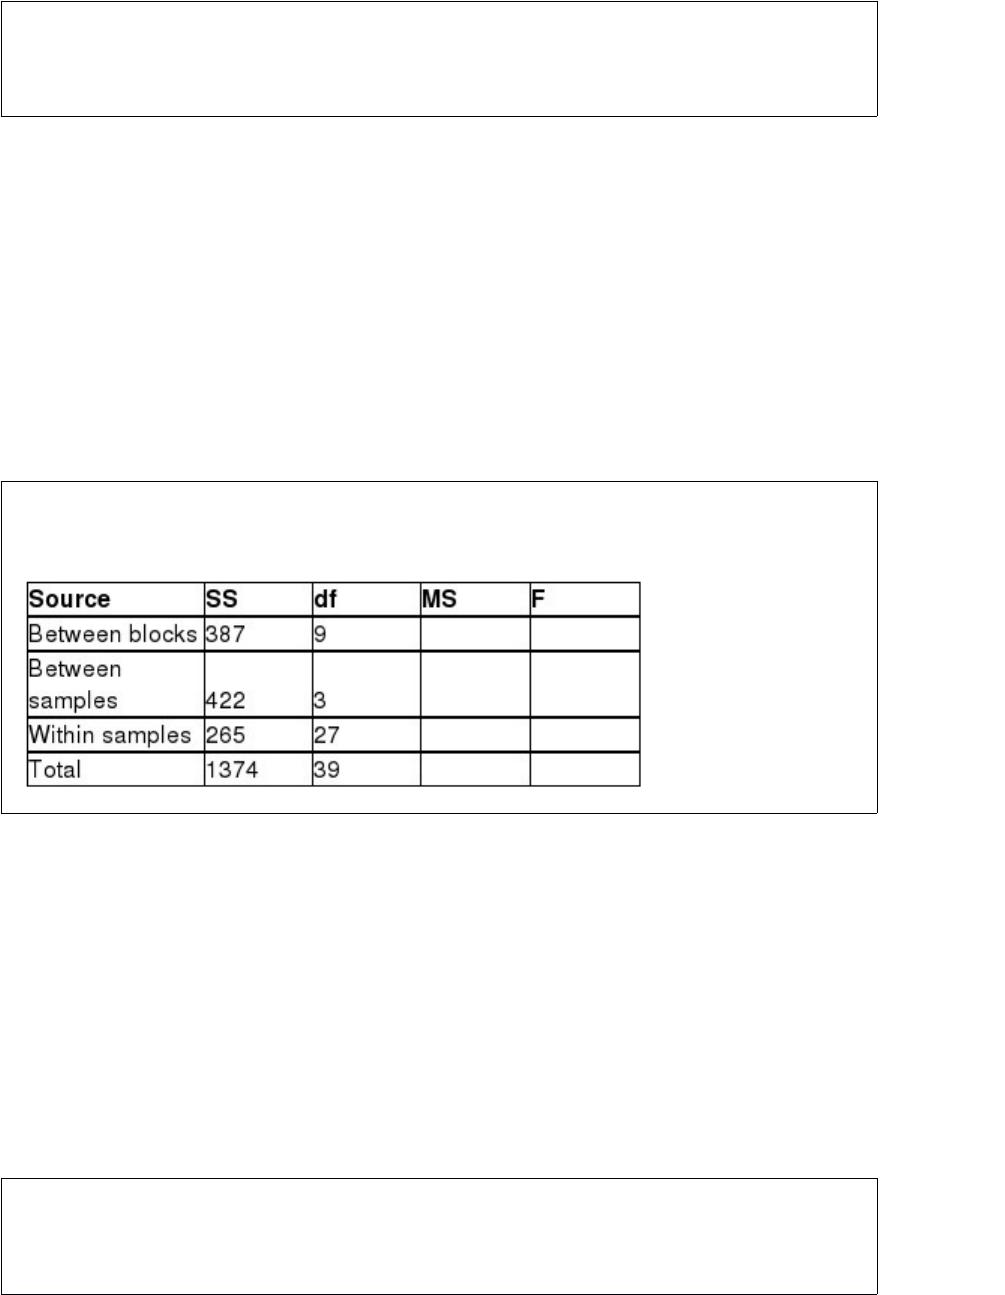
Based on the partially completed ANOVA table below, we know that 3 samples are
being compared using 9 blocks.
On a survey there is a question that asks whether someone lives in a house, apartment,
or condominium. These three responses could be coded in a dummy variable using
value 0, 1, and 2.
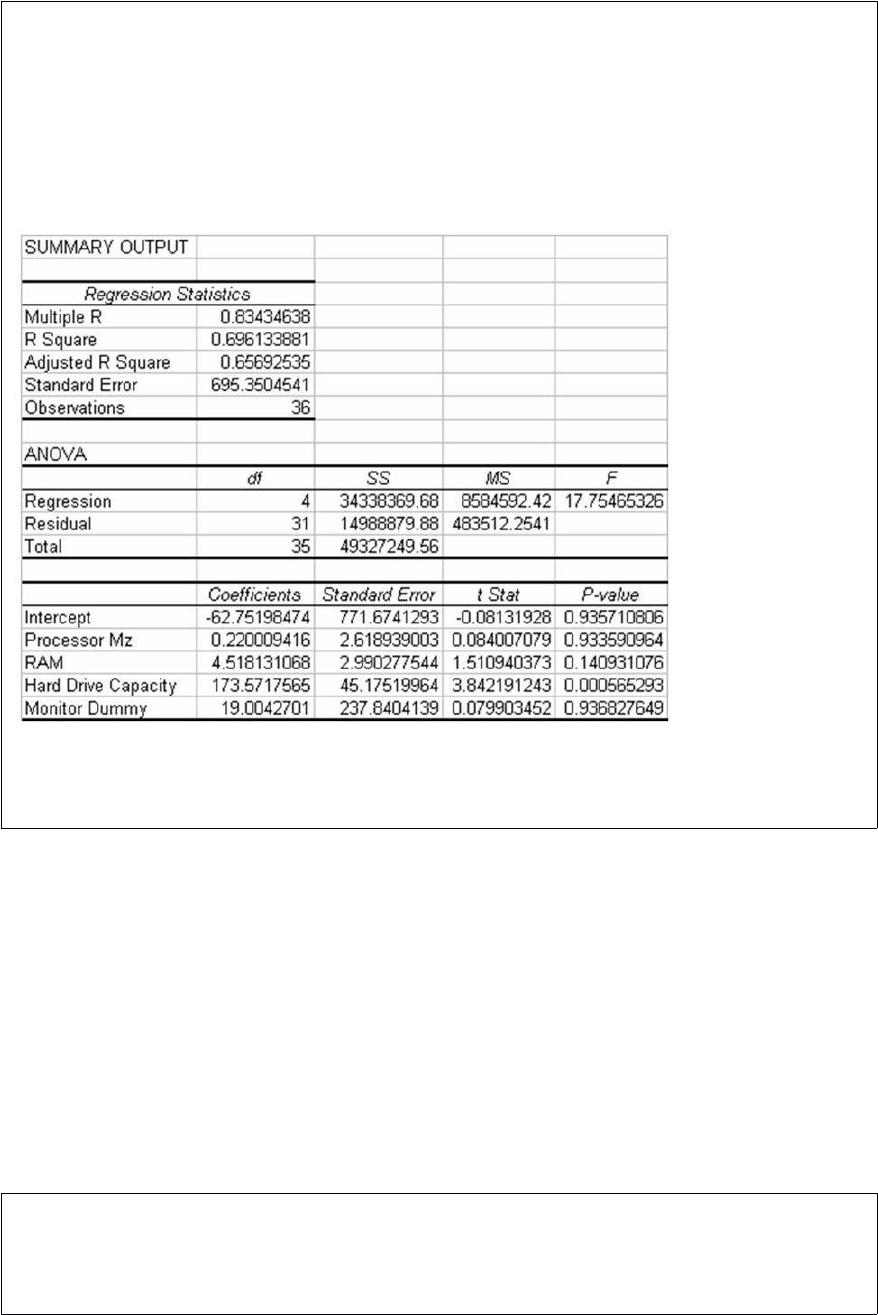
A study has recently been conducted by a major computer magazine publisher in which
the objective was to develop a multiple regression model to explain the variation in
price of personal computers. Three quantitative independent variables were used along
with one qualitative variable. The qualitative variable was coded 1 if the computer
included a monitor, 0 otherwise. The following computer printout shows the final
output.
Based on this information, it is possible to determine that 4 of the PCs in the data set
did not have a monitor included.
When analyzing annual incomes of adults in a market area, the marketing manager’s
report indicated that the 90th percentile is $123,400. That means that 90 percent of the
adult incomes in the market area fall at or below $123,400.
There is no hard-and-fast rule regarding the number of classes that must be used when
establishing a frequency distribution for a continuous variable.
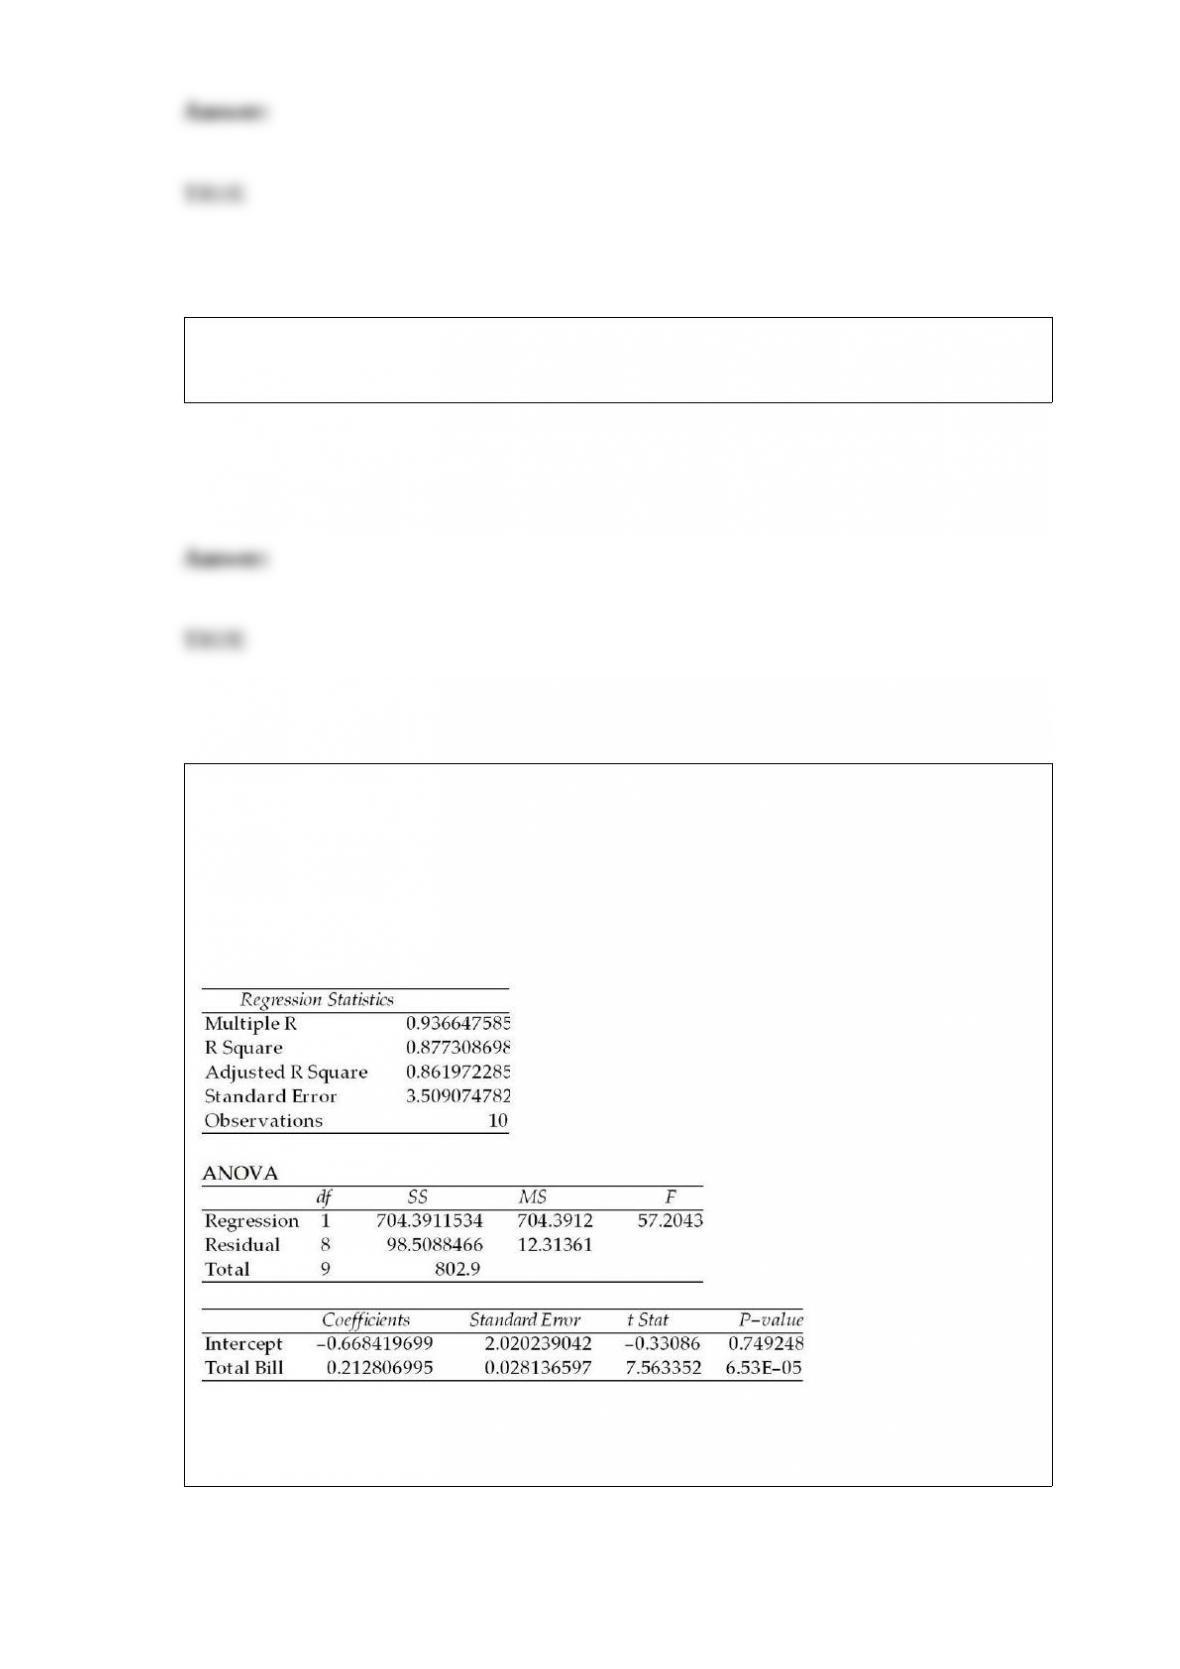
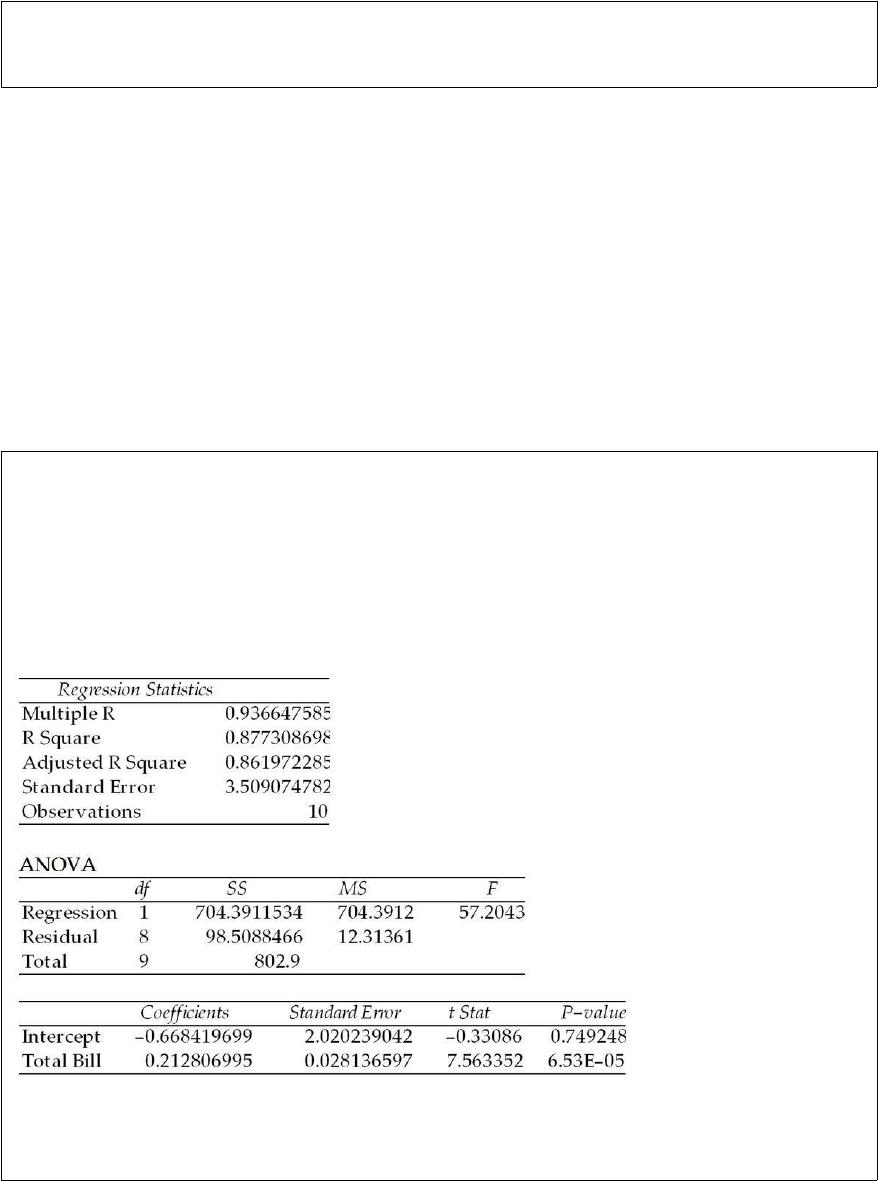
A study was recently performed by the Internal Revenue Service to determine how
much tip income waiters and waitresses should make based on the size of the bill at
each table. A random sample of bills and resulting tips were collected and the following
regression results were observed:
SUMMARY OUTPUT
Given this output, the point estimate for the average tip per dollar amount of the bill is
approximately $0.21.


For testing a research hypothesis, the burden of proof that a new product is no better
than the original is placed on the new product, and the research hypothesis is
formulated as the null hypothesis.
In most processes, the process control limits are set to correspond with the specification
limits on the product.
Experimental design is a plan for performing an experiment where the effects of one or
more factors on the variable of interest are measured.


If a uniform distribution and normal distribution both have the same mean and the same
range, the normal distribution will have a larger standard deviation than the uniform
distribution
To find the pooled standard deviation involves taking a weighted average of the two
sample variances, then finding its square root.
A complete polynomial model contains terms of all orders less than or equal to the pth
order.
Renton Industries makes replacement parts for the automobile industry. As part of the
company’s capacity planning, it needs a long-range total demand forecast. The
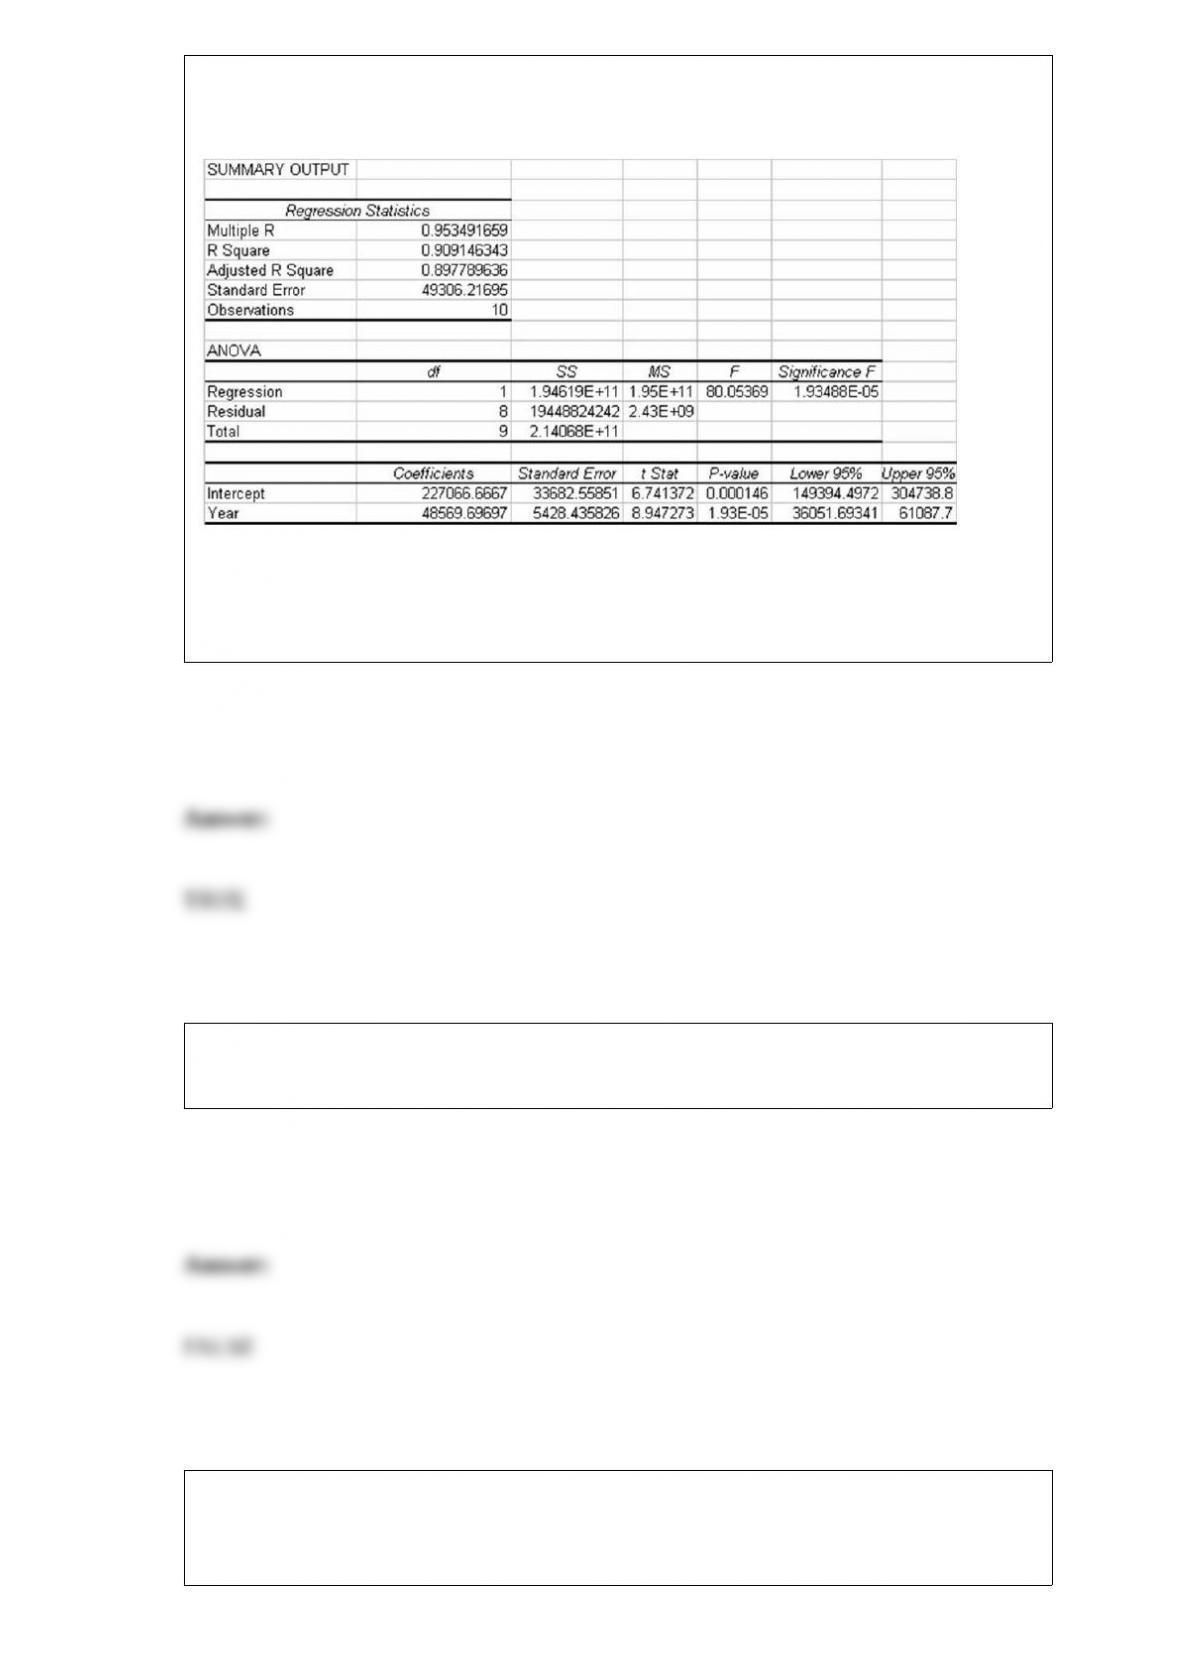
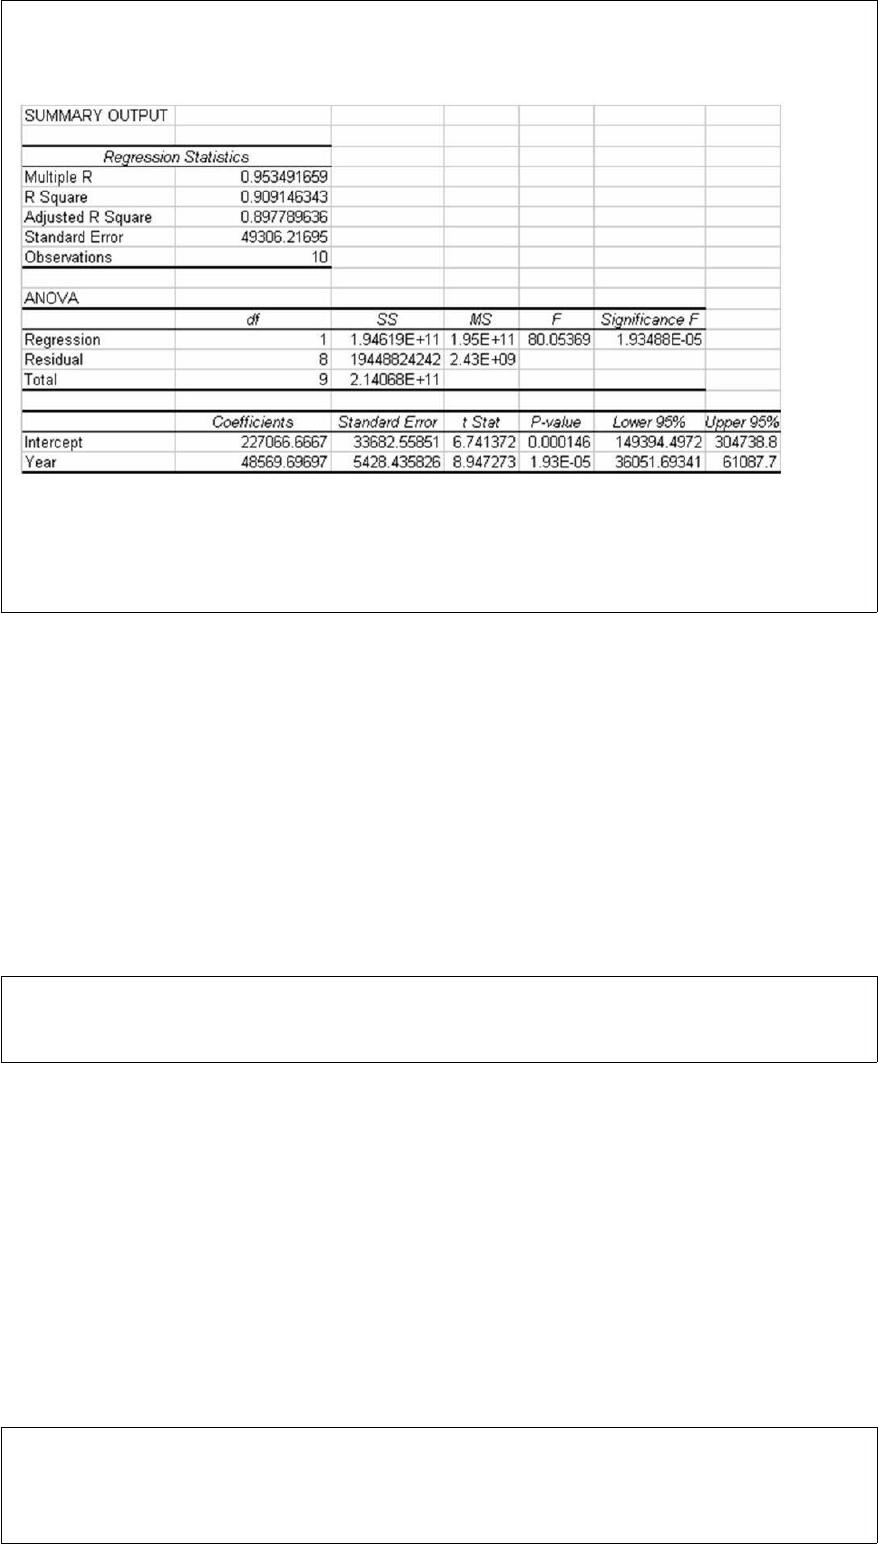
following information was generated based on 10 years of historical data on total
number of parts sold each year.
Based on this information we can conclude that the linear trend model explains a
significant proportion of the variation in the number of parts sold, because the p-value
is much smaller than any reasonable α that we might use.
A cumulative frequency distribution shows the percentage of observations for the
variable of interest with values less than or equal to the upper limit of each class.
In simple linear regression analysis, the regression model forms a straight line in
two-dimensional space through the x,y data points, while a multiple regression model
forms a plane through multidimensional space.


The graph of a discrete random variable looks like a histogram where the probability of
each possible outcome is represented by a bar.
A confidence interval will contain the true population value as long as the point
estimate is within the lower to upper limits.
One factor that plays an important part in determining what the needed sample size is
when developing a confidence interval estimate is the level of confidence that you wish
to use.


Given a sample of size n = 15 and a sample correlation of r = 0.7, the value of the test
statistic for conducting a hypothesis test of the correlation is t = 3.53.
A claim was recently made that stated that the median income for male and female
graduates is the same for those graduating with a degree in operations management. In
order to test this claim using the Mann-Whitney U test, the same number of males and
females must be selected.
A research study has stated that the taxes paid by individuals is correlated at a .78 value
with the age of the individual. Given this, the scatter plot would show points that would
fall on straight line on a slope equal to .78.
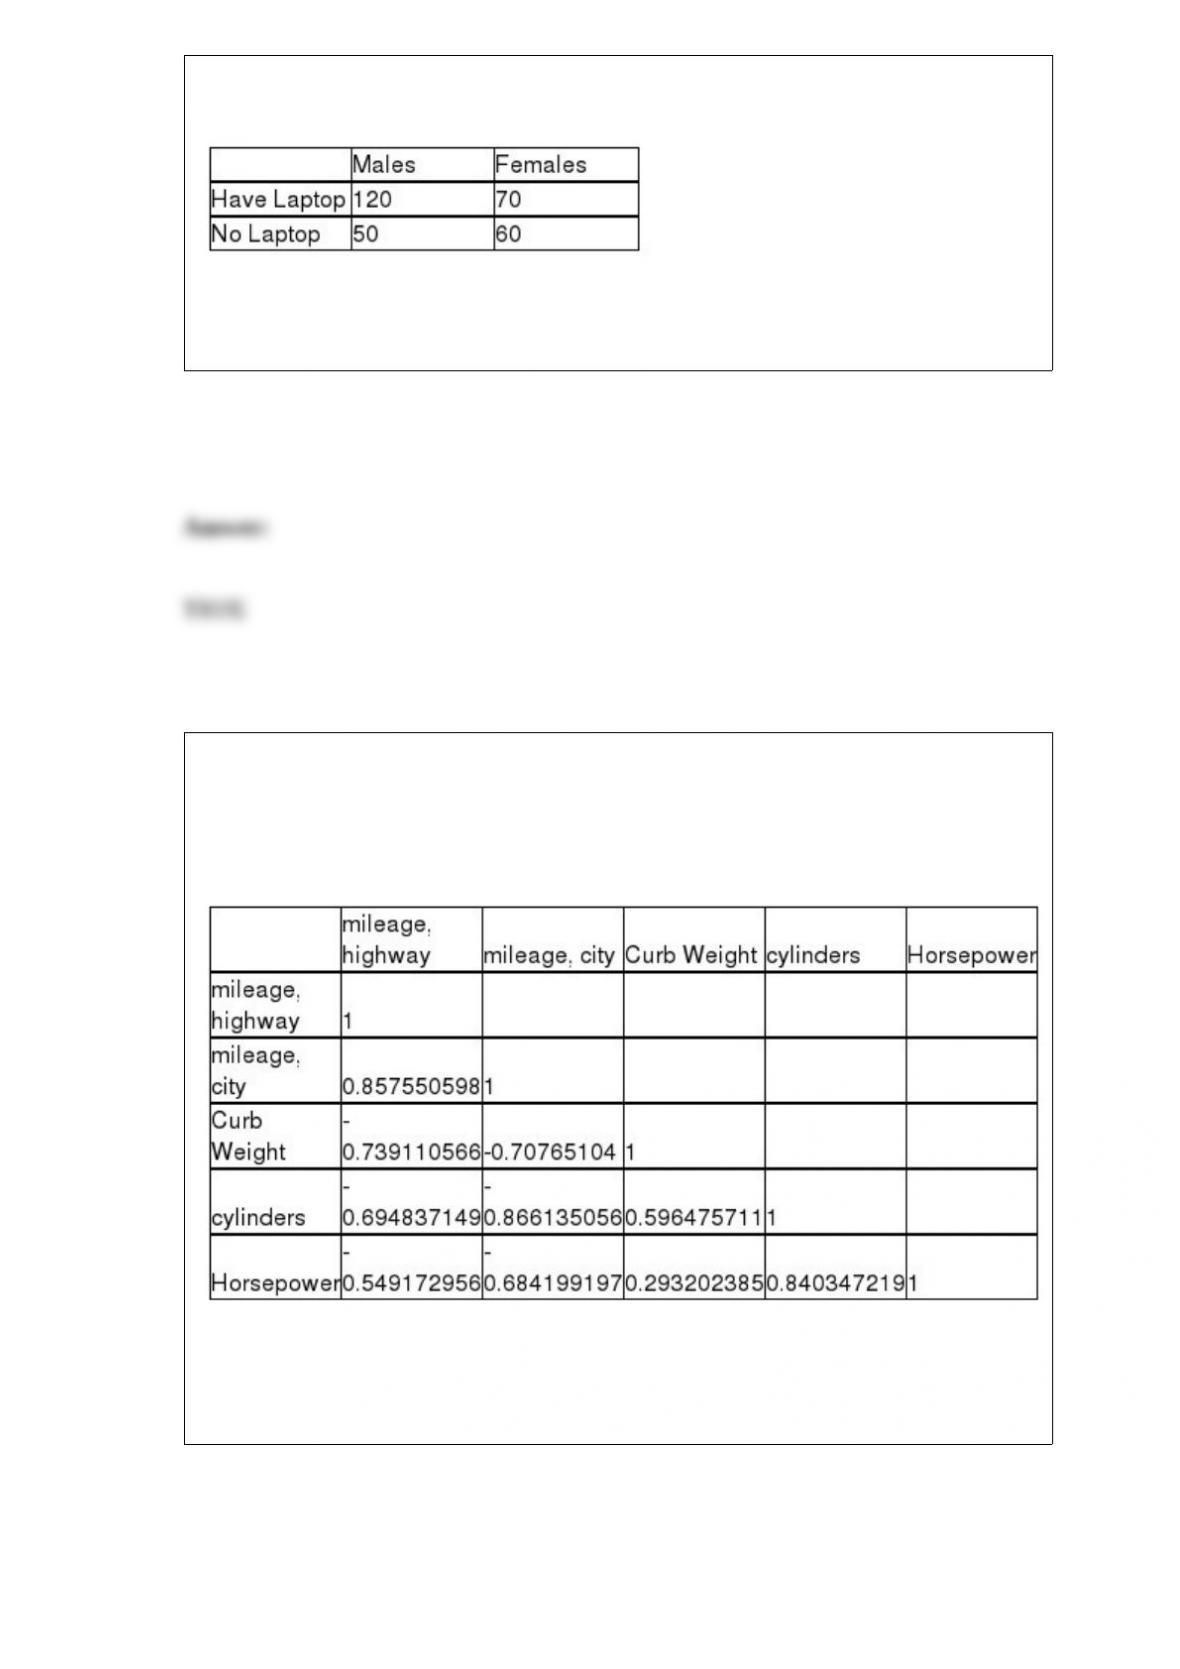
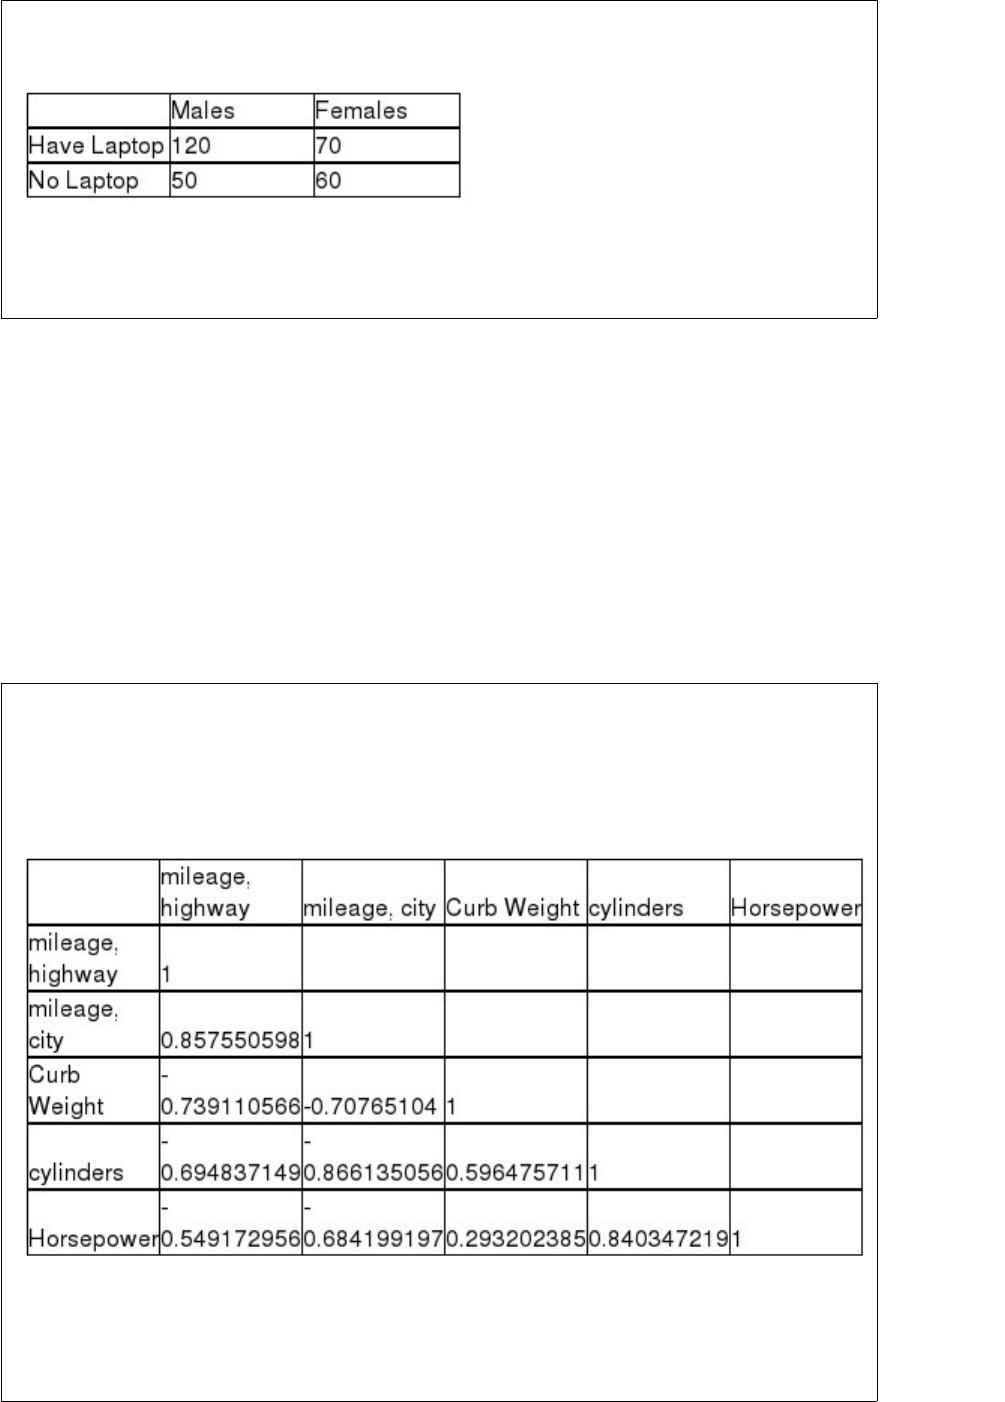
A survey was recently conducted in which males and females were asked whether they
owned a laptop personal computer. The following data were observed:
Given this information, if an alpha level of .05 is used, the critical value for testing
whether the two variables are independent is x2 = 3.8415.
A major car magazine has recently collected data on 30 leading cars in the U.S. market.
It is interested in building a multiple regression model to explain the variation in
highway miles. The following correlation matrix has been computed from the data
collected:
The analysts also produced the following multiple regression output using curb weight,
cylinders, and horsepower as the three independent variables. Note, a number of the
output fields are missing, but can be determined from the information provided.
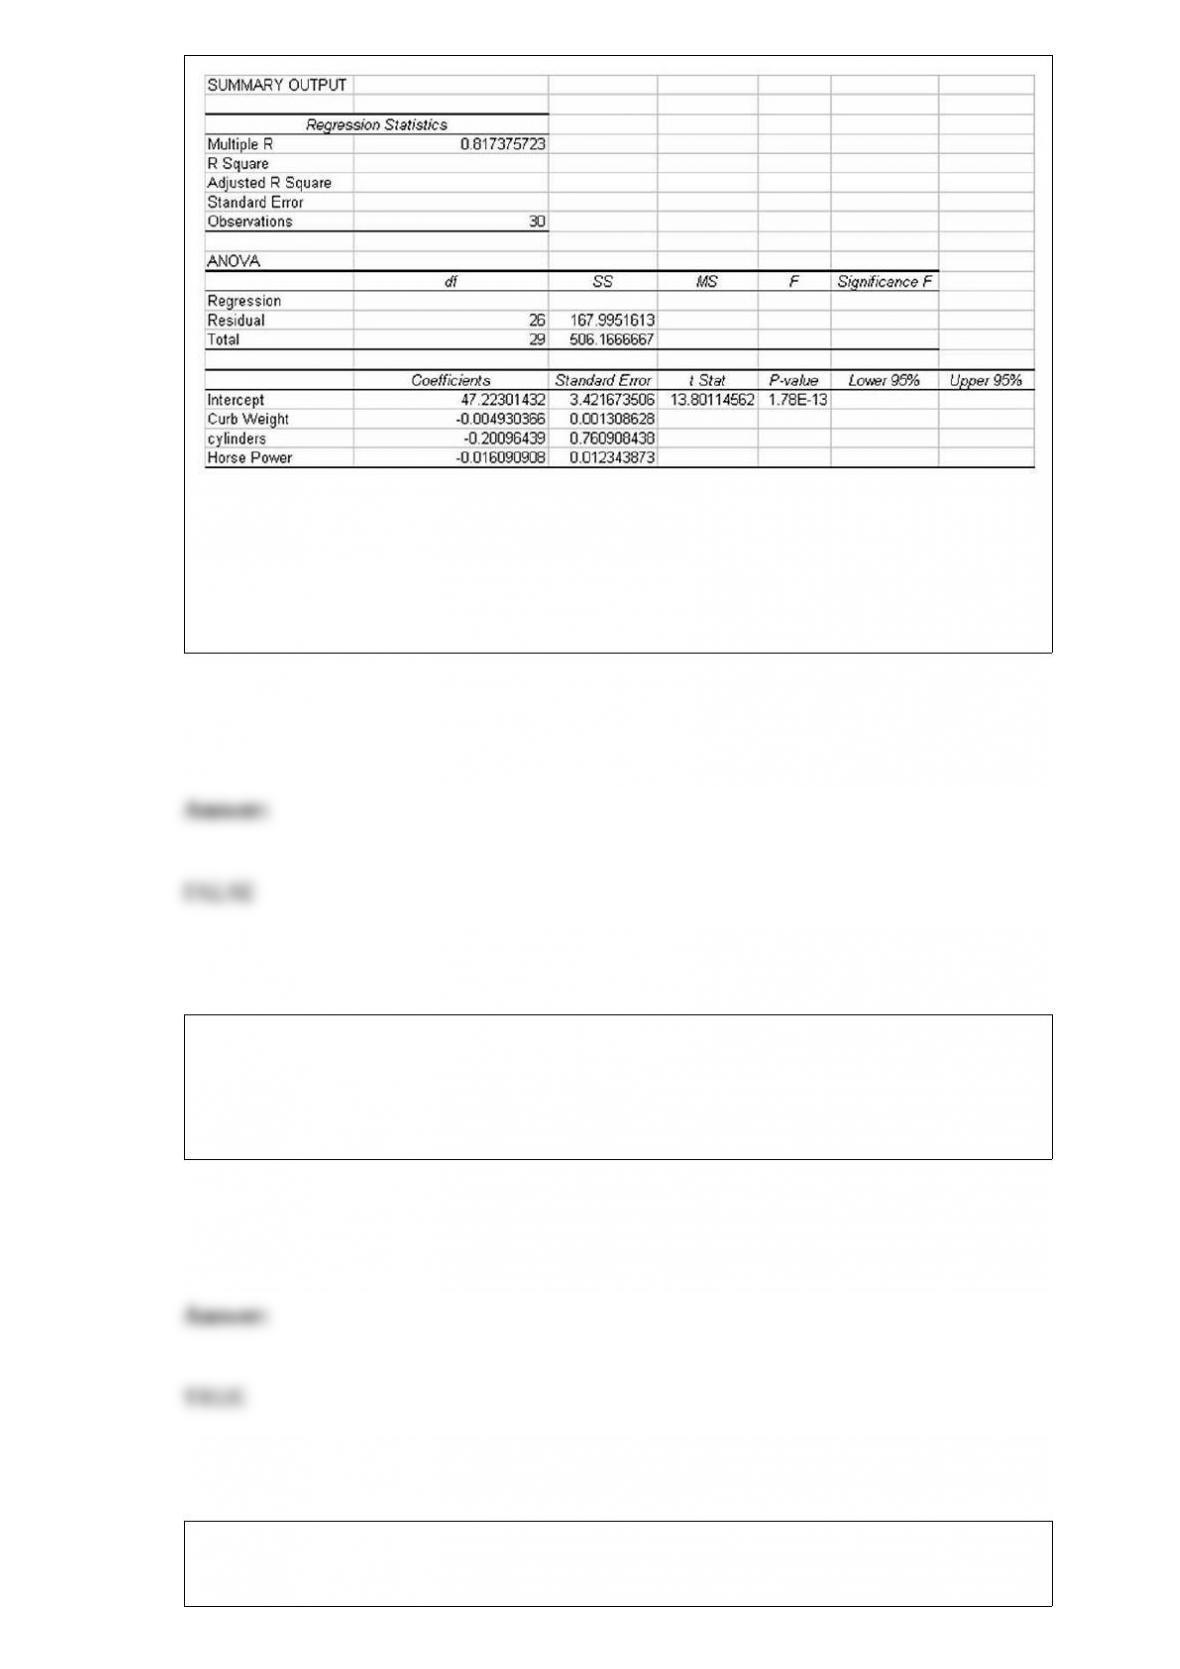
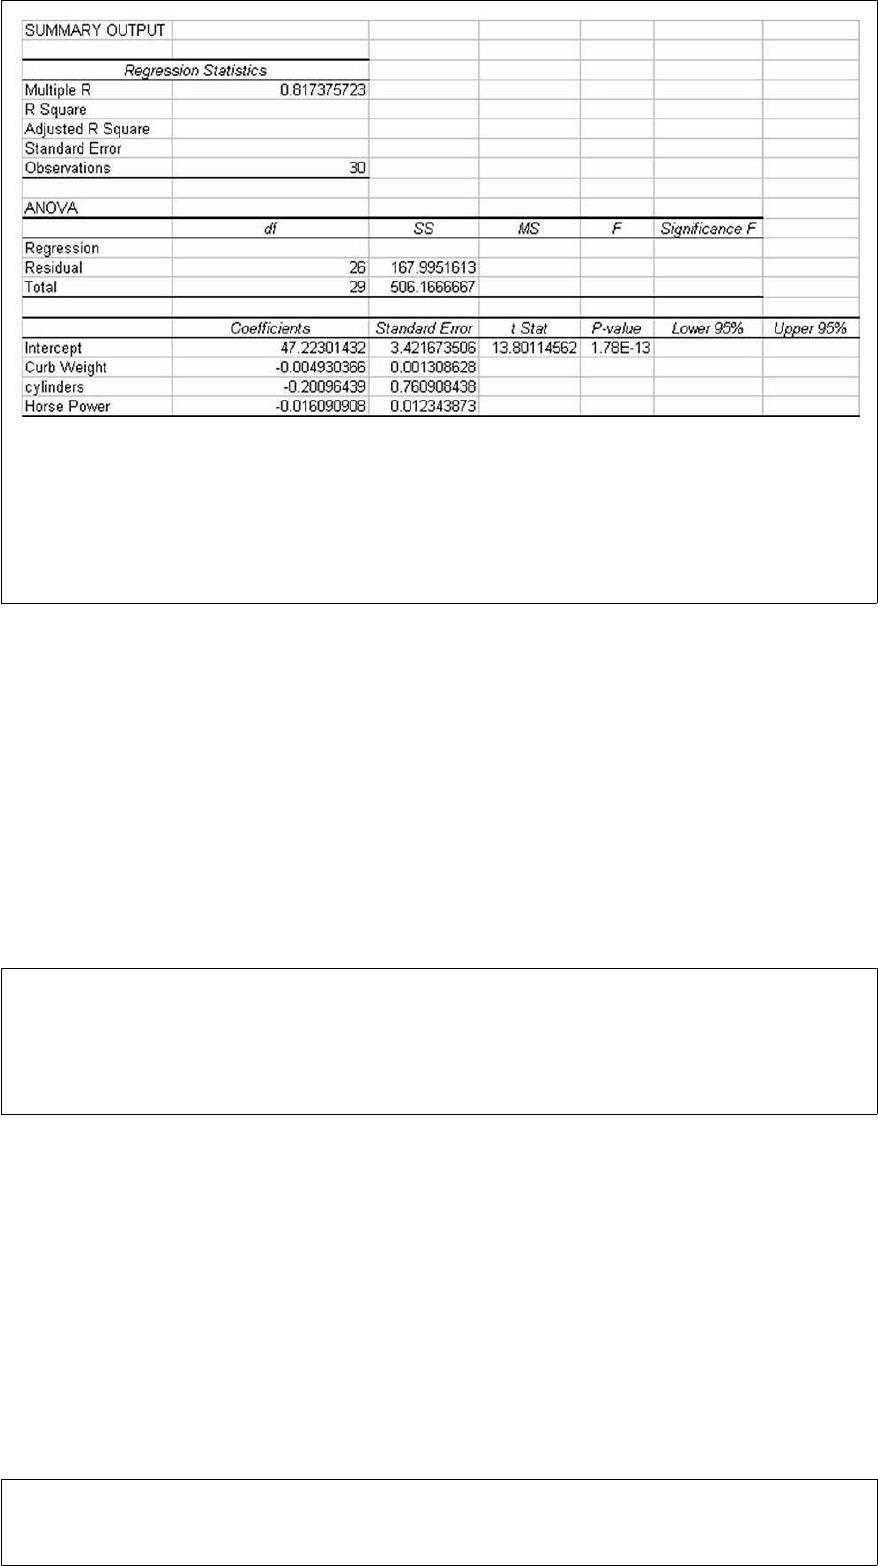
If the analysts are interested in testing whether the overall regression model is
statistically significant, the appropriate null and alternative hypotheses are:
H0: β1= β2= β3
Ha: β1≠ β2≠ β3
In a study involving car owners, one question asked the owner for the number of miles
driven last year. A second question asked the owner for the age of the vehicle. A joint
frequency distribution would be useful for determining whether newer cars tend to be
driven more miles than older cars.
The First National Bank mailed out a survey to all 3,456 savings account customers. A
total of 568 surveys were returned. Values computed from the returned surveys would


constitute parameters since all 568 customers were surveyed.
A time-series graph shows that annual sales data have grown gradually over the past 10
years. Given this, if a linear trend model is used to forecast future years’ sales, the sign
on the regression slope coefficient will be positive.
We expect virtually all the data in a stable process to fall within 2 standard deviations of
the mean.
A major airline has stated in an industry report that its mean onground time between
domestic flights is less than 18 minutes. To test this, the company plans to sample 36
randomly selected flights and use a significance level of .10. Assuming that the
population standard deviation is known to be 4.0 minutes, if the true population mean is
16 minutes, the decision maker could end up making either a Type I or a Type II error
depending on the sample result.


When a histogram is constructed for discrete numerical data, there should be spaces
between the bars of the histogram.
The power of a test is measured by its capability of:
A) rejecting a null hypothesis that is true.
B) not rejecting a null hypothesis that is true.
C) rejecting a null hypothesis that is false.
D) not rejecting a null hypothesis that is false.
If the standard deviation for a Poisson distribution is known to be 3, the expected value
of that Poison distribution is:


A) 3
B) about 1.73
C) 9
D) Can’t be determined without more information.
A decision maker wishes to test the following null and alternative hypotheses using an
alpha level equal to 0.05:
H0 : μ1 – μ2 = 0
HA : μ1 – μ2 ≠ 0
The population standard deviations are assumed to be known. After collecting the
sample data, the test statistic is computed to be z = 1.78
Using the p-value approach, what decision should be reached about the null hypothesis?
A) Since p-value = 0.0018 < α/2 = 0.025, reject the null hypothesis
B) Since p-value = 0.0415 > α/2 = 0.025, do not reject the null hypothesis.
C) Since p-value = 0.0033 < α/2 = 0.025, reject the null hypothesis.
D) Since p-value = 0.0375 > α/2 = 0.025, do not reject the null hypothesis.


Each evening, a nationwide retail chain randomly calls 100 of the customers who came
to their store that day to ask whether they were satisfied with the service they had
received. The customers respond yes or no. Suppose the company has found over time
that 8 percent of the customers are not satisfied (“no” answers). If they have established
a process control chart, what conclusion should be reached if the percentage of
customers surveyed tonight that say no is 14 percent?
A) This result indicates that a special cause situation exists.
B) Although this point is above the upper control limit, there is no cause for alarm if
this is the first time.
C) While this value is higher than “normal,” it is still within the range of common cause
variation and no action is needed.
D) This is outside the control limits and action should be taken
We expect the actual frequencies in each cell to approximately match the corresponding
expected cell frequencies when:
A) H0 is false.
B) H0 is true.
C) H0 is falsely accepted.
D) the variables are related to each other.


Ace Computer Manufacturer buys disk drives in lots of 5,000 units from a supplier in
California. The contract calls for, at most, 3 percent of the disk drives to be defective.
When a shipment arrives, a sample of n = 15 parts is selected. If zero defects are found
in this sample, the shipment is accepted. If 3 or more defects are found, the shipment is
rejected and sent back to the supplier. If the number of defects found is 1 or 2, a second
sample of 15 parts is selected. If this sample yields 1 or fewer defects, the shipment is
accepted; otherwise the shipment is rejected. Based on a binomial distribution, the
probability that Ace will reject a shipment of parts that meets the contract requirements
is approximately 0.0355.
If we are interested in testing to determine whether the center of three or more
populations is equal when the data in the samples are ordinal, what is the appropriate
test to conduct?
A) A t-test
B) An ANOVA
C) A Kruskal-Wallis
D) A Wilcoxon Matched-Pairs Sign Rank test
A sales rep for a national clothing company makes 4 calls per day. Based on historical
records, the following probability distribution describes the number of successful calls
each day:
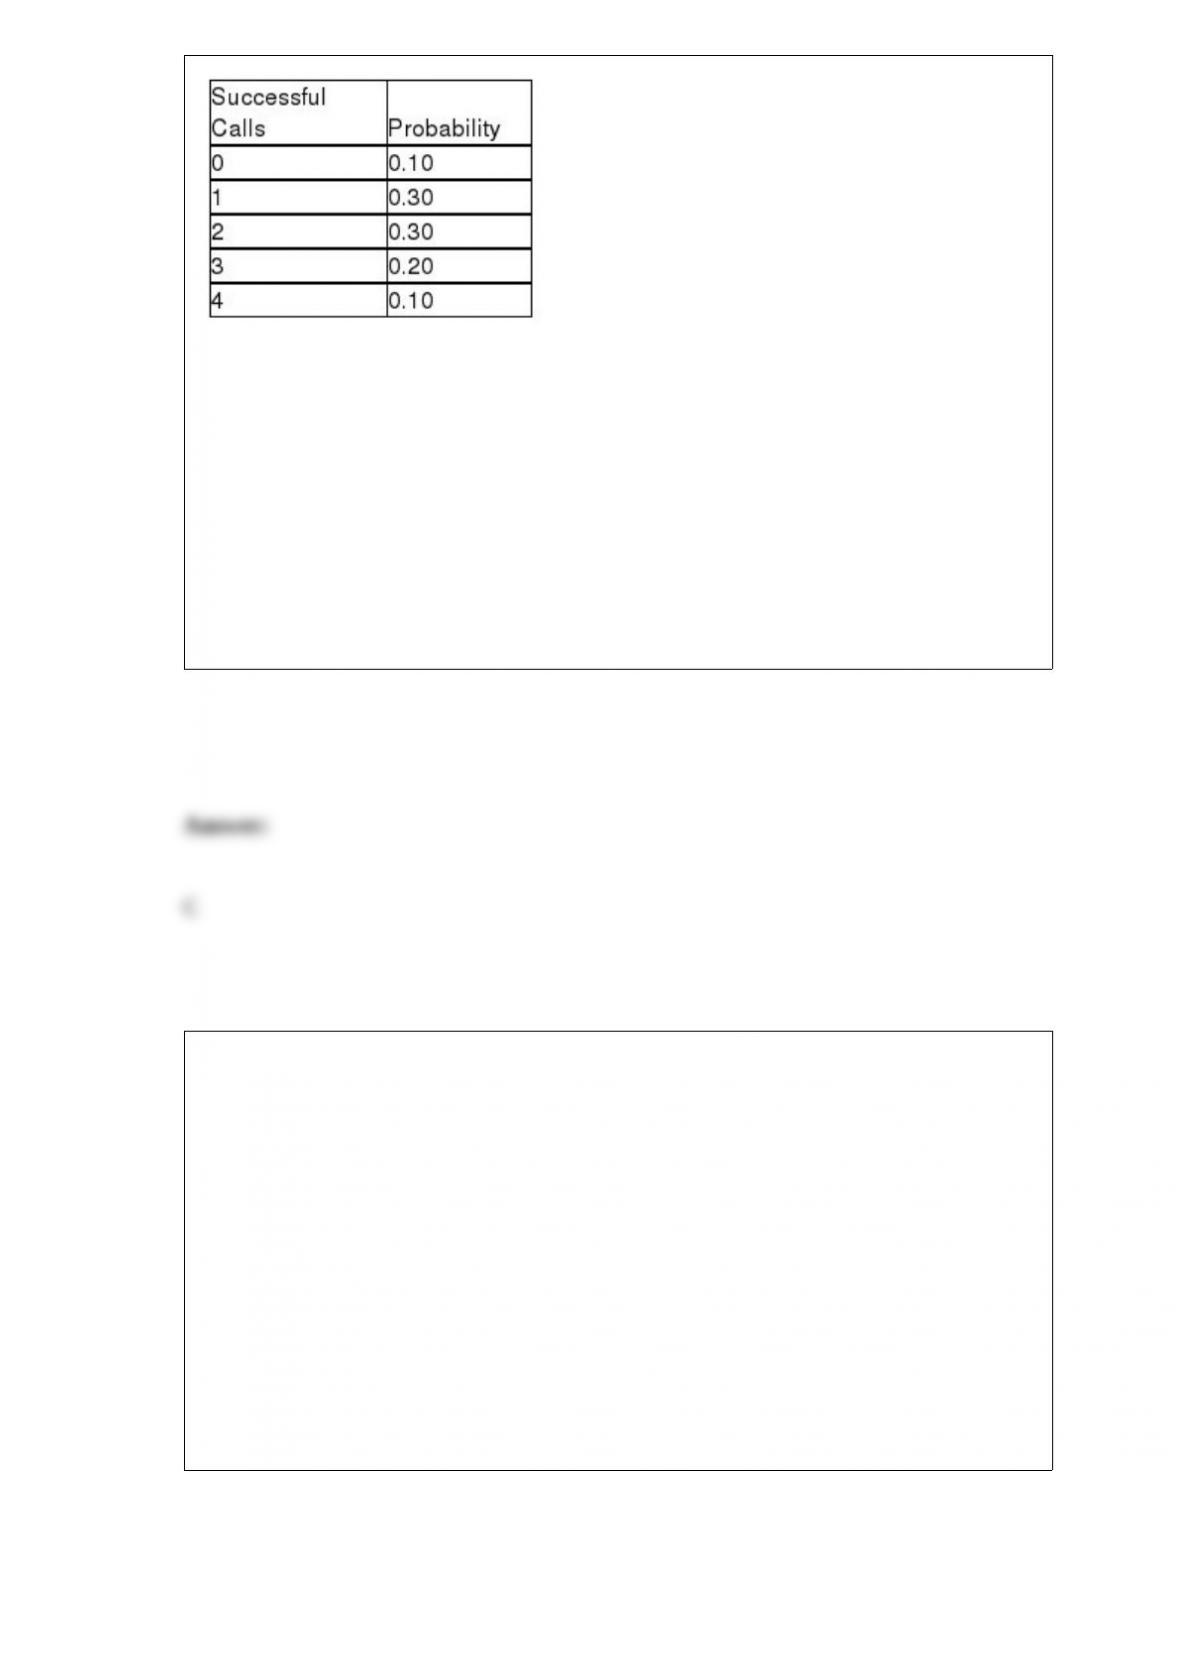
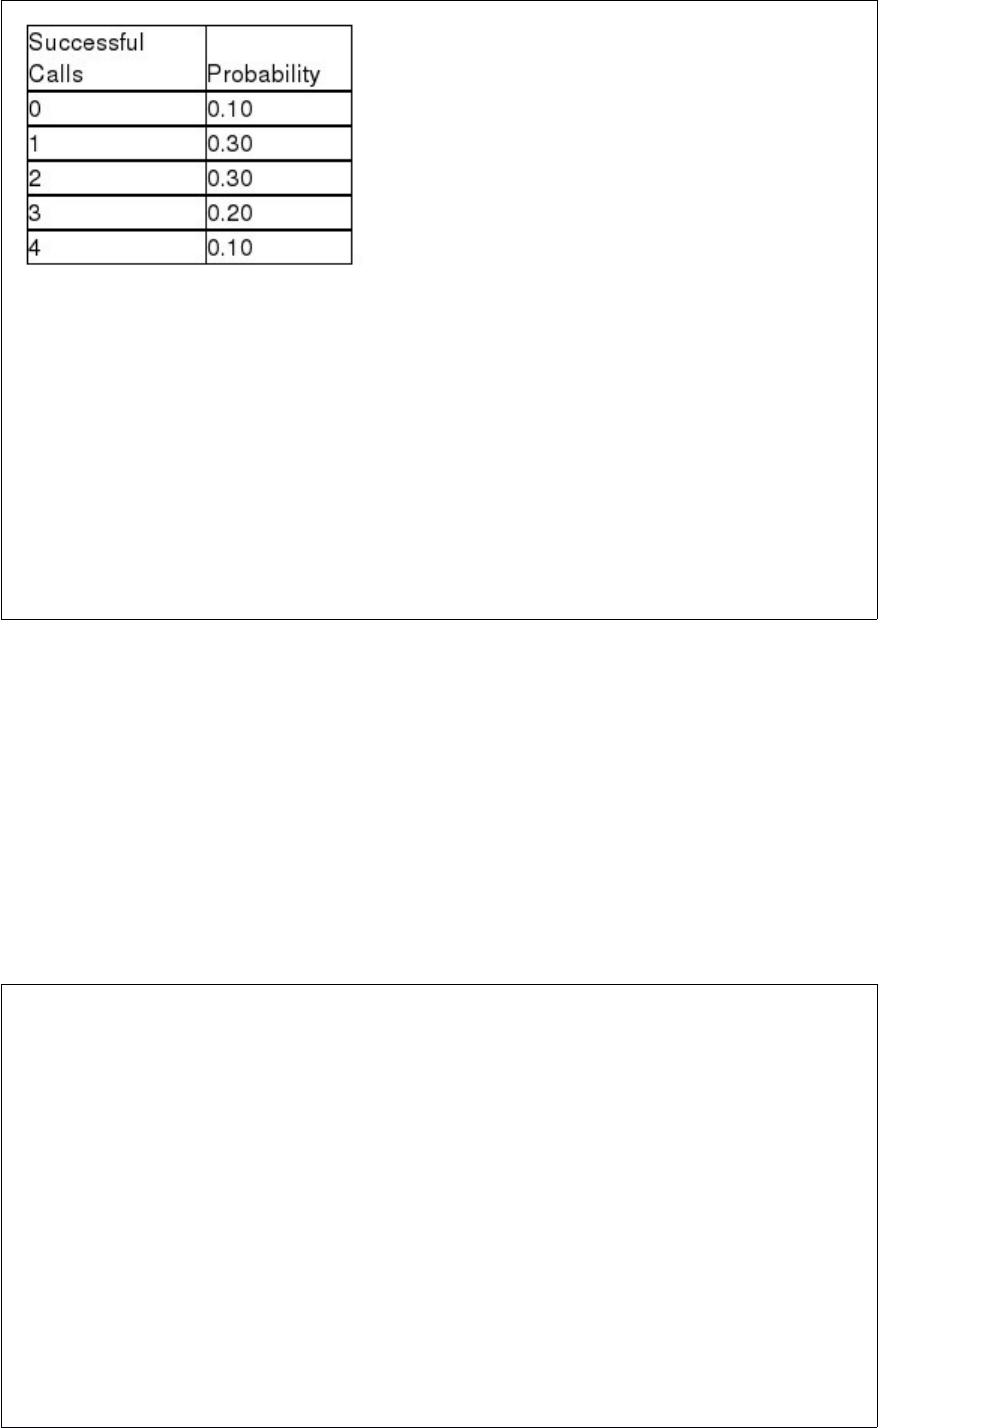
Based on this information, the probability that the sales rep will have a total of 2
successful calls in a two-day period is:
A) 0.60
B) 0.09
C) 0.15
D) 0.06
According to an industry report, 26 percent of all households have at least one cell
phone. Further, of those that do have a cell phone, the mean monthly bill is $55.90 with
a standard deviation equal to $9.60. Recently, a random sample of 400 households was
selected. Of these households, 88 indicated that they had cell phones. The mean bill for
these 88 households was $57.00. What is the probability of getting 88 or fewer
households with cell phones if the numbers provided by the industry report are correct?
A) Approximately 0.0344
B) Nearly 0.4656
C) About 0.1345
D) Can’t be determined without knowing the standard deviation
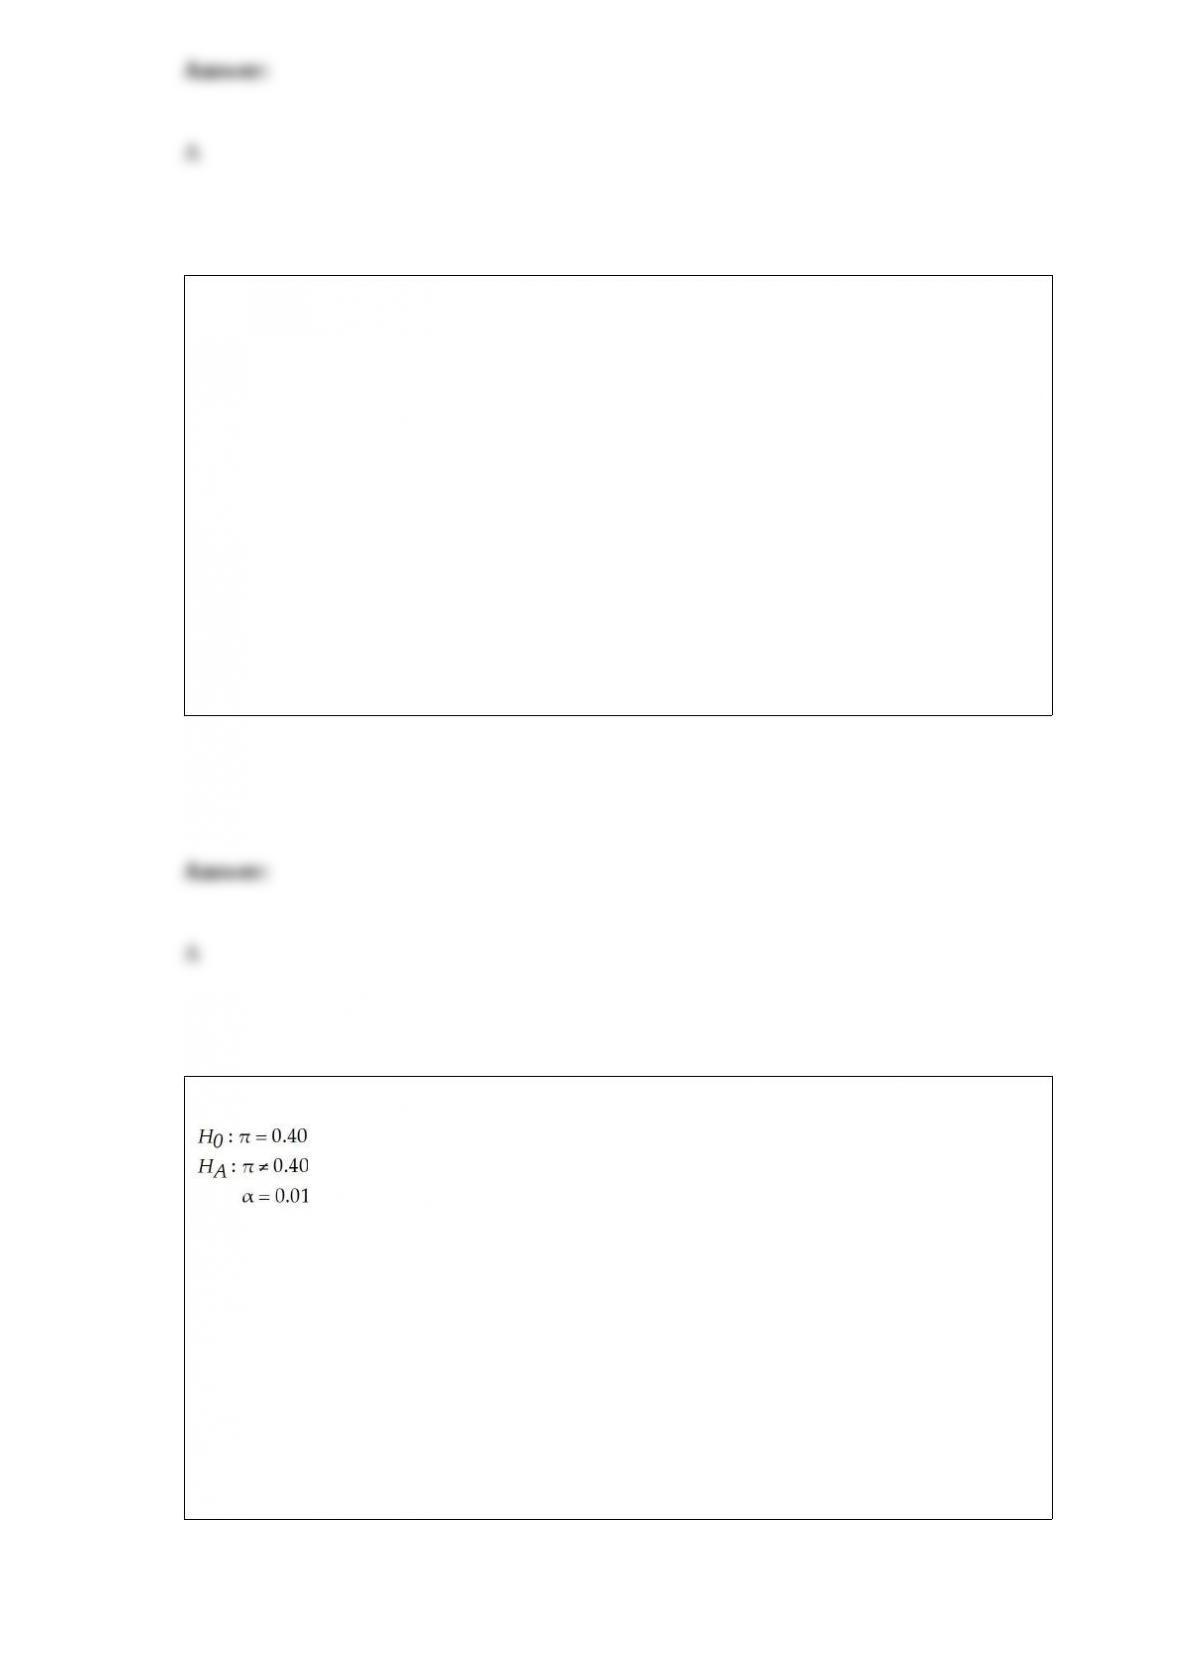

Many people believe that they can tell the difference between Coke and Pepsi. Other
people say that the two brands can’t be distinguished. To test this, a random sample of
20 adults was selected to participate in a test. After being blindfolded, each person was
given a small taste of either Coke or Pepsi and asked to indicate which brand soft drink
it was. If people really can’t tell the difference, the expected number of correct
identifications in the sample would be:
A) 10.
B) 0.
C) between 4 and 9.
D) Can’t be determined without more information.
For the following hypothesis test:
With n = 64 and p = 0.42, state the calculated value of the test statistic
A) t = 0.4122
B) t = 1.7291
C) z = 0.3266
D) z = 1.2412


The degrees of freedom for a contingency table with 11 rows and 10 columns is:
A) 11
B) 10
C) 110
D) 90
When discussing variation in the output of a process, which of the following is not true?
A) Variation is natural.
B) No two products or services are exactly the same.
C) With a fine enough measurement gauge, all things can be seen to differ.
D) Common cause variation can be eliminated.
The human resources department at a major high tech company recently conducted an
employee satisfaction survey of 100 of its 3,000 employees. Data were collected on
such variables as age, gender, marital status, current salary, level of overall satisfaction
on a scale from 1 to 5, number of years with the company, and job title. Which of the
variables would be classified as nominal level data?
A) Age and years with the company
B) Overall satisfaction
C) Gender, marital status, and job title
D) Age and gender
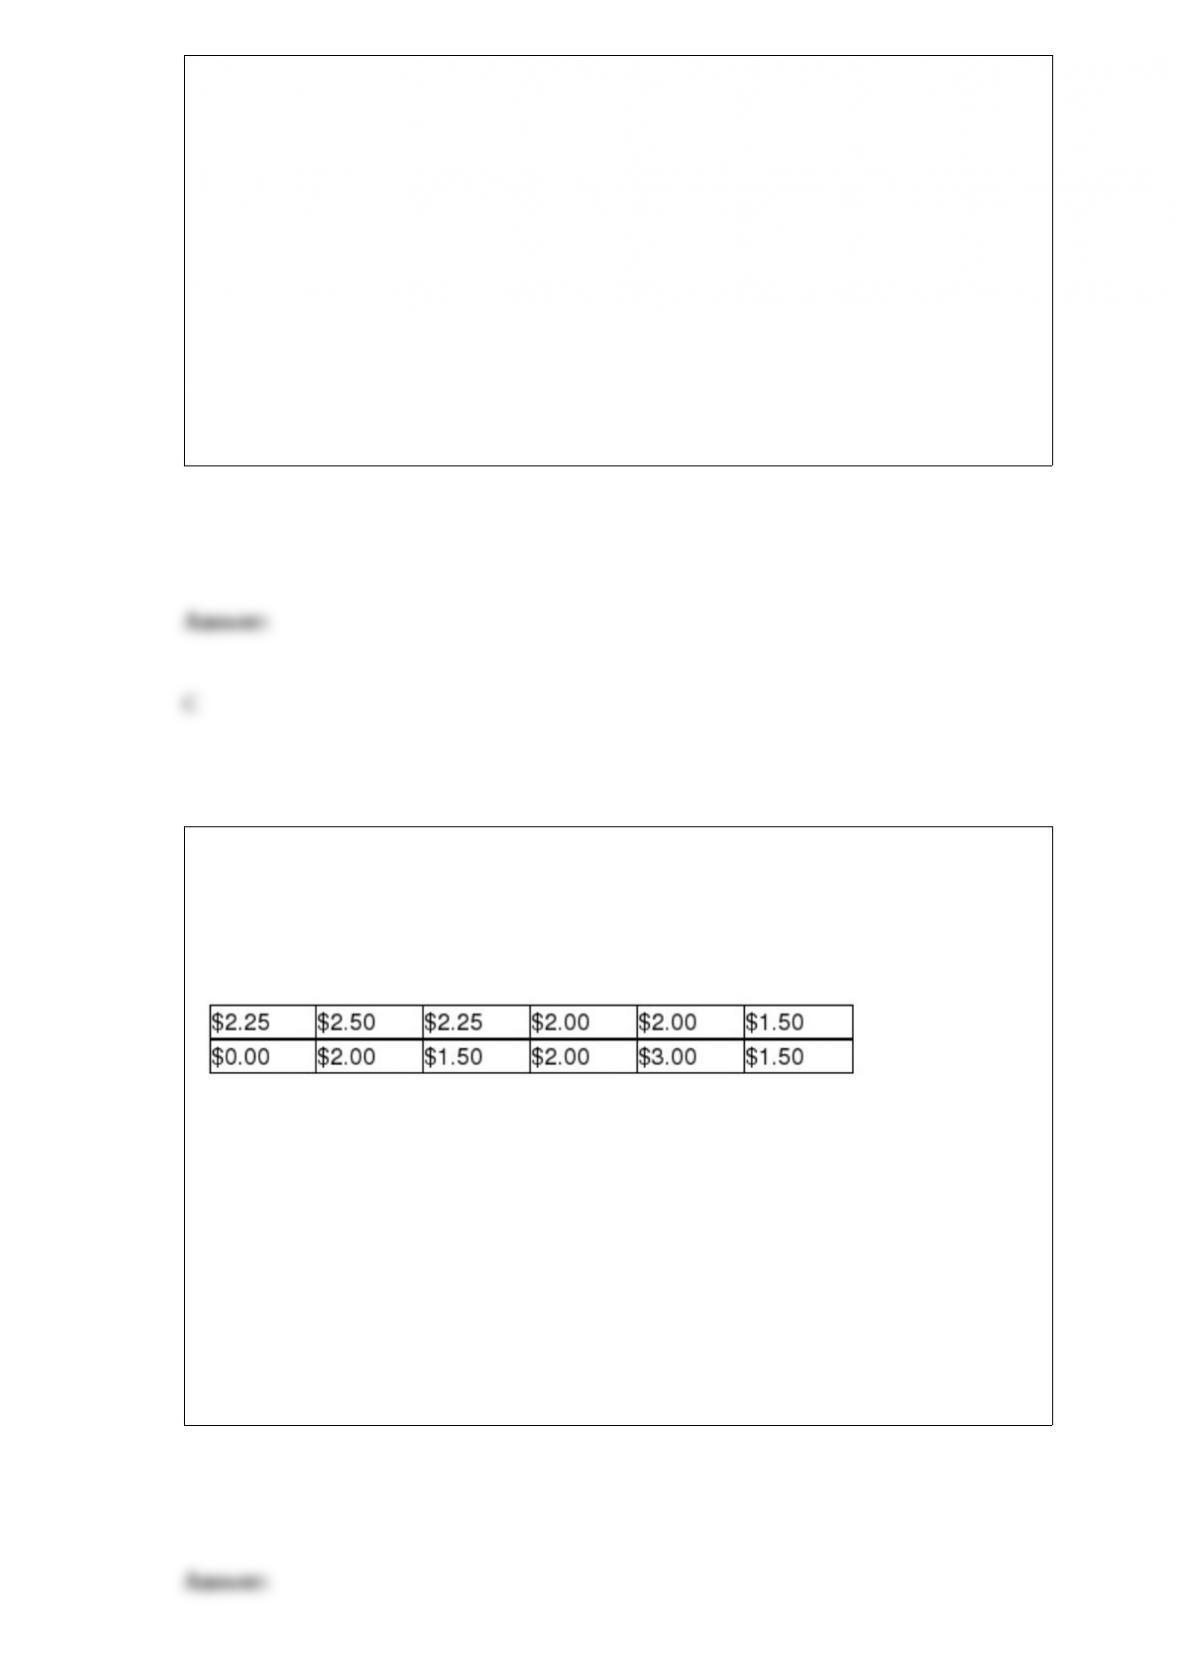
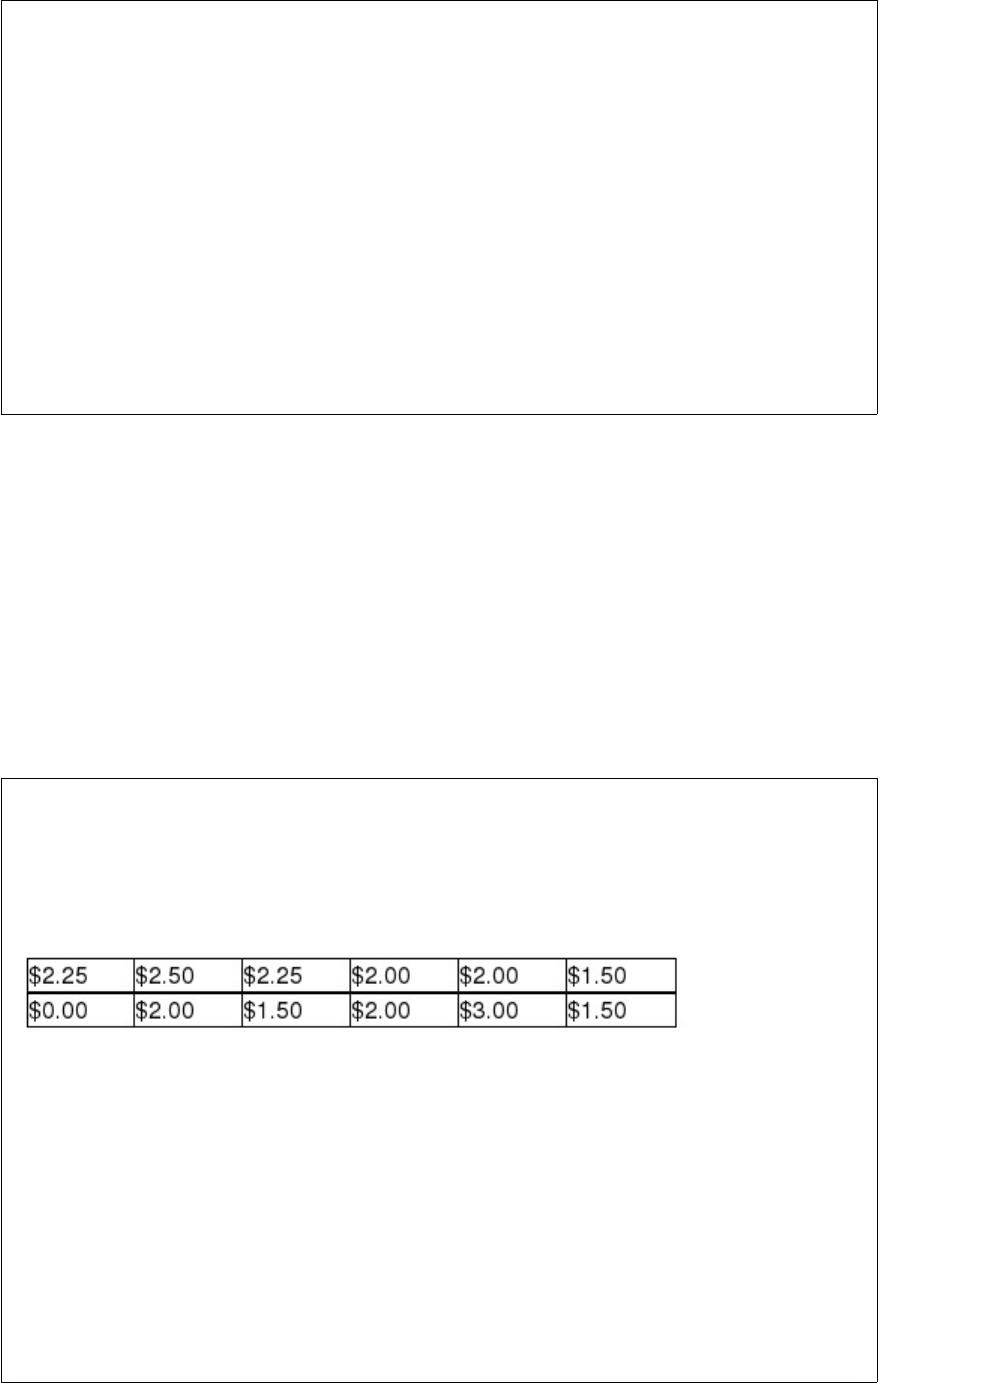
Allante Pizza delivers pizzas throughout its local market area at no charge to the
customer. However, customers often tip the driver. The owner is interested in estimating
the mean tip income per delivery. To do this, she has selected a simple random sample
of 12 deliveries and has recorded the tips that were received by the drivers. These data
are:
Based on these sample data, what is the best point estimate to use as an estimate of the
true mean tip per delivery?
A) 1.875
B) 1.811
C) 1.50
D) 1.312
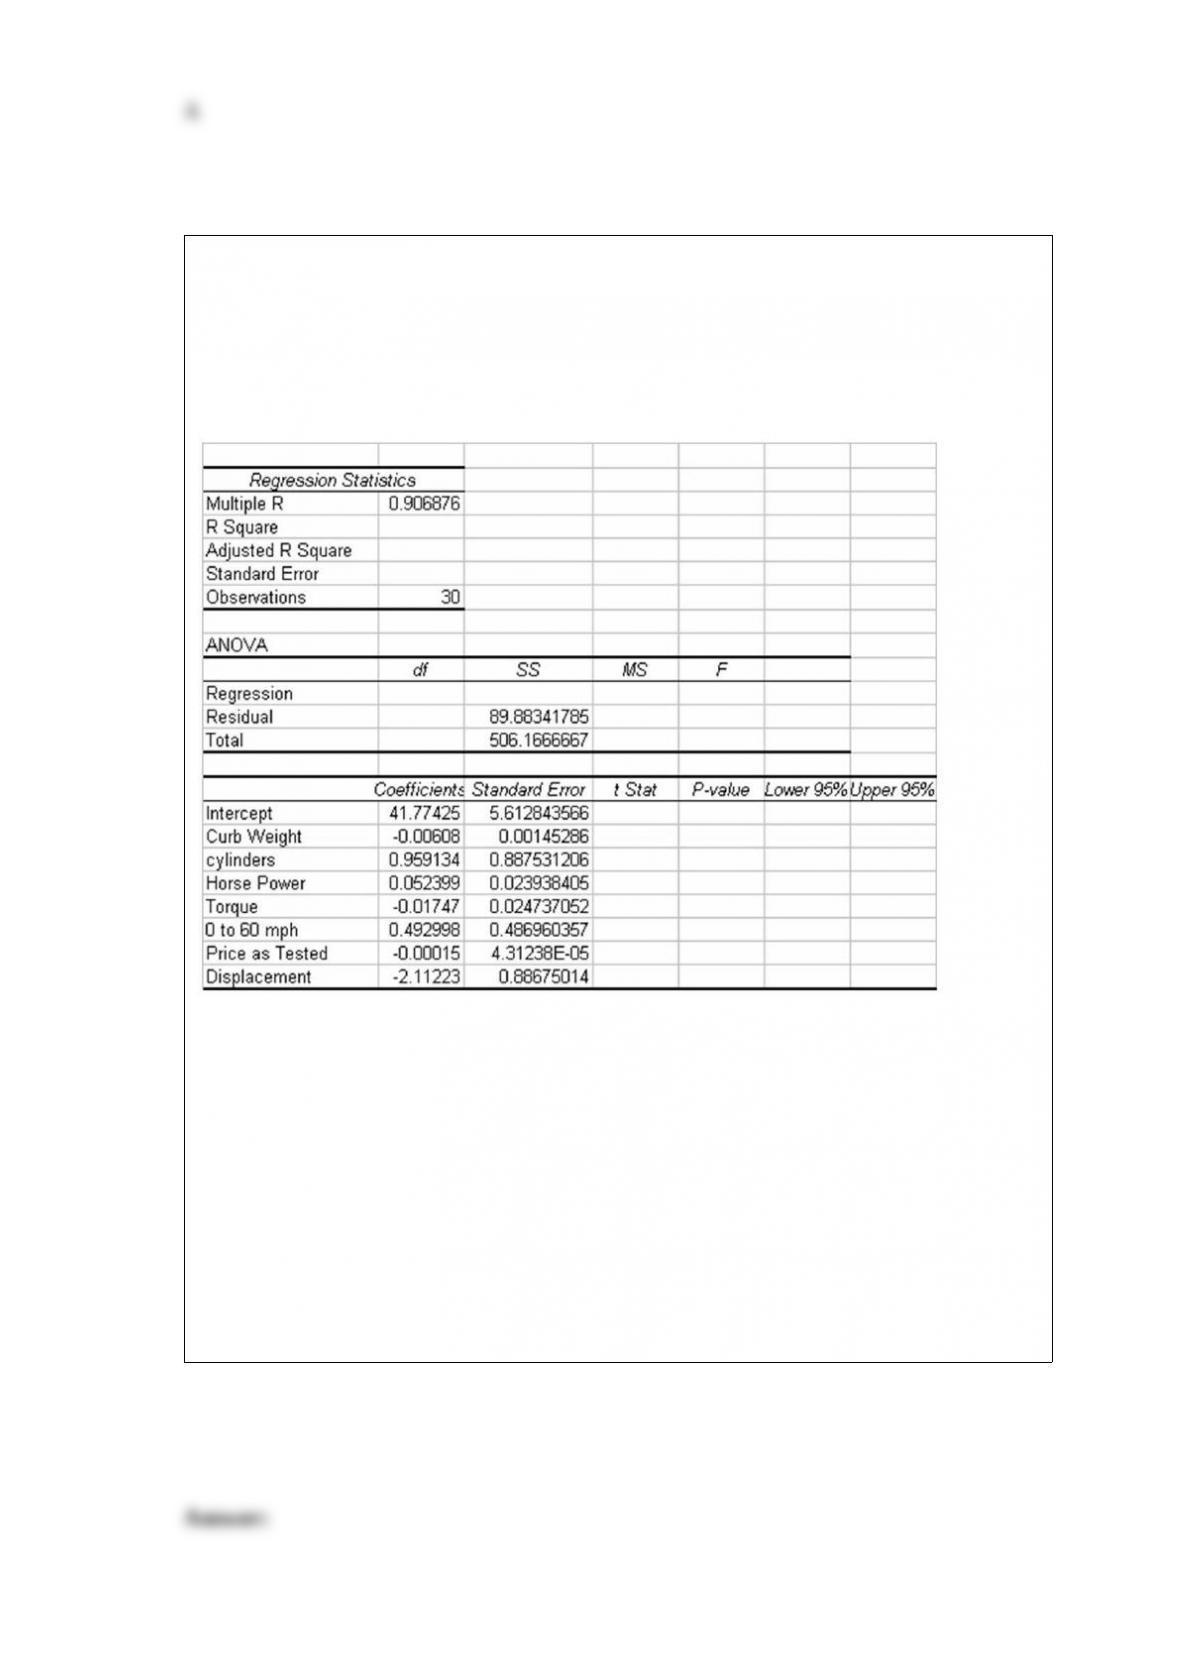
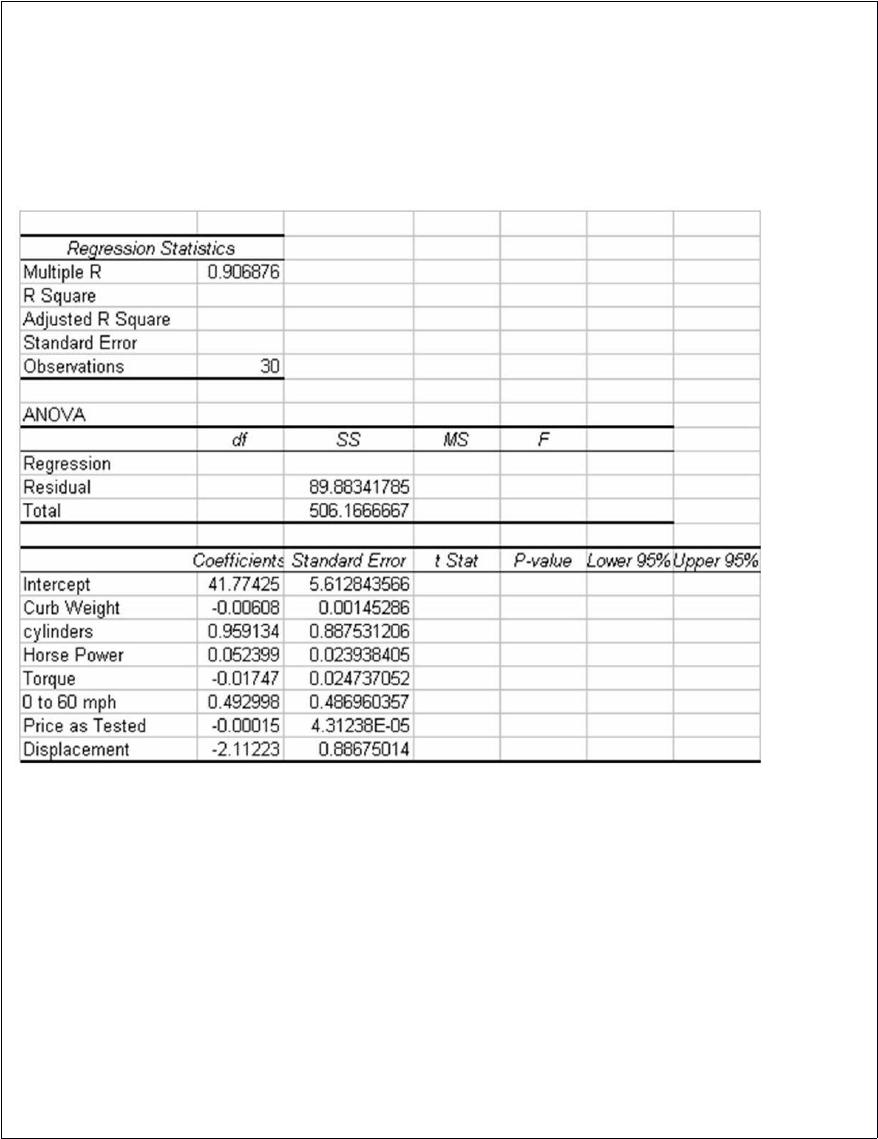
The editors of a national automotive magazine recently studied 30 different automobiles
sold in the United States with the intent of seeing whether they could develop a multiple
regression model to explain the variation in highway miles per gallon. A number of
different independent variables were collected. The following regression output (with
some values missing) was recently presented to the editors by the magazine’s analysts:
Based on this output and your understanding of multiple regression analysis, what is the
critical value for testing the significance of the overall regression model at a 0.05 level
of statistical significance?
A) About F = 5.92
B) Nearly F = 3.80
C) Approximately F = 2.50
D) None of the above


A value computed from a population is called:
A) a statistic.
B) a real number.
C) a parameter.
D) a point estimate.
Assume you are conducting a one-way analysis of variance using a 0.05 level of
significance and have found that the p-value = 0.02. Which of the follow is correct
regarding what you can conclude?
A) Do not reject the null hypothesis; the means are all the same.
B) Reject the null hypothesis; the means are not all the same.
C) Do not reject the null hypothesis; the means are not all the same.
D) Reject the null hypothesis; the means are all the same.

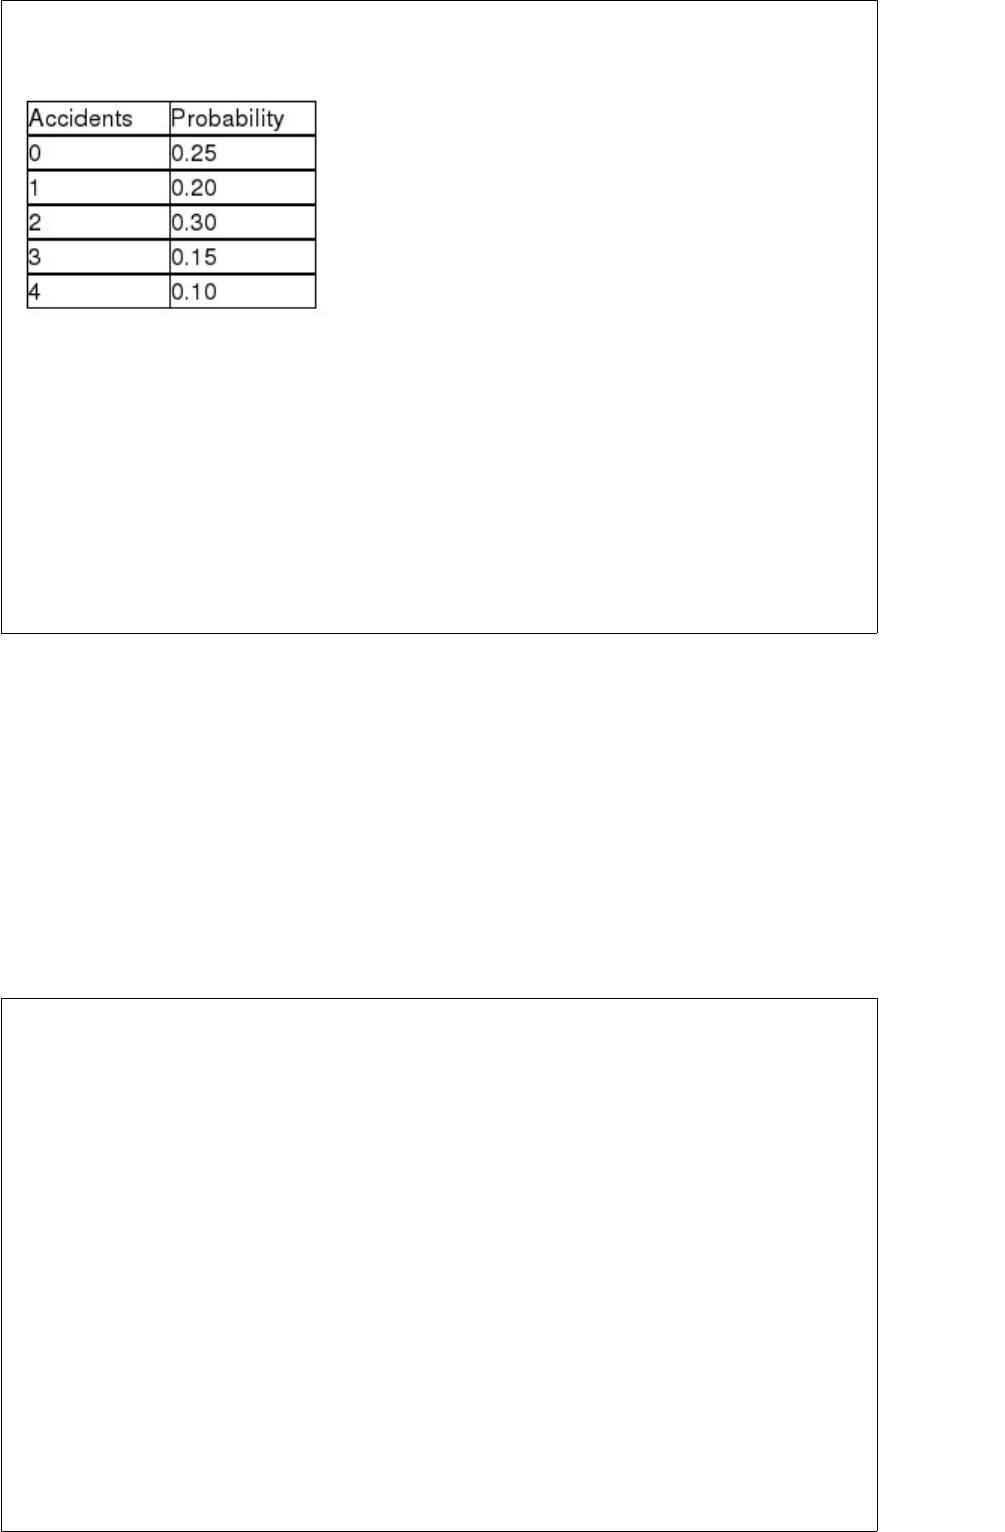
The following probability distribution has been assessed for the number of accidents
that occur in a Midwestern city each day:
The probability of having less than 2 accidents on a given day is:
A) 0.30
B) 0.75
C) 0.45
D) 0.25
In conjunction with the housing foreclosure crisis of 2009, many economists expressed
increasing concern about the level of credit card debt and efforts of banks to raise
interest rates on these cards. The banks claimed the increases were justified. A Senate
subcommittee decided to determine if the average credit card balance depends on the
type of credit card used. Under consideration are Visa, MasterCard, Discover, and
American Express. The sample sizes to be used for each level are 25, 25, 26, and 23,
respectively.
State the number of degrees of freedom available for determining the total variation.
A) 93
B) 95
C) 98
D) 97


Three events occur with probabilities P(E1) = 0.35, P(E2) = 0.15, P(E3) = 0.40. If the
event B occurs, the probability becomes P(E1|B) = 0.25, P(B) = 0.30. Calculate P(E1
and B).
A) 0.575
B) 0.075
C) 0.021
D) 0.475
A major textbook publisher has a contract with a printing company. Part of the contract
stipulates that no more than 5 percent of the pages should have any type of printing
error. Suppose that the company selects a random sample of 400 pages and finds 33 that
have an error. If the printer is meeting the standard, what is the probability that a sample
would have 33 or more errors?
A) 0.1245
B) 0.4986
C) 0.0014
D) 0.1250


A major shipping company has stated that 96 percent of all parcels are delivered on
time. To check this, a random sample of n = 200 parcels were sampled. Of these, 184
arrived on time. If the company’s claim is correct, what is the probability of 184 or
fewer parcels arriving on time?
A) About 0.0019
B) Nearly 0.24
C) Just over 0.98
D) About 0.4981
When discussing variation in the output of a process, which of the following is not true?
A) Variation is natural.
B) No two products or services are exactly the same.
C) With a fine enough measurement gauge, all things can be seen to differ.
D) Common cause variation can be eliminated.


John Thurgood founded a company that translates Chinese books into English. His
company is currently testing a computer-based translation service. Since Chinese
symbols are difficult to translate, John assumes the computer program will make some
errors, but then so do human translators. The computer error rate is supposed to be an
average of 3 per 400 words of translation. Suppose John randomly selects a 1,200-word
passage. Assuming that the Poisson distribution applies, if the computer error rate is
actually 3 errors per 400 words, determine the probability that no errors will be found.
A) 0.0001
B) 0.0141
C) 0.0415
D) 0.4557
A concern of Major League Baseball is that games last too long. Some executives in the
league’s headquarters believe that the mean length of games this past year exceeded 3
hours (180 minutes). To test this, the league selected a random sample of 80 games and
found the following results: = 193 minutes and s = 16 minutes.
Based on these results, if the null hypothesis is tested using an alpha level equal to 0.10,
which of the following is true?
A) The null hypothesis should be rejected if > 182.31.
B) The test statistic is t = 1.2924.
C) Based on the sample data, the null hypothesis cannot be rejected.
D) It is possible that when the hypothesis test is completed, a Type II statistical error
has been made.


The J R Simplot Company is one of the world’s largest privately held agricultural
companies, employing over 10,000 people in the United States, Canada, China, Mexico,
and Australia. More information can be found at the company’s Web site:
www.Simplot.com. One of its major products is french fries that are sold primarily on
the commercial market to customers such as McDonald’s and Burger King. French fries
have numerous quality attributes that are important to customers. One of these is called
“dark ends,” which are the dark-colored ends that can occur when the fries are cooked.
Suppose a major customer will accept no more than 0.06 of the fries having dark ends.
Recently, the customer called the Simplot Company saying that a recent random sample
of 300 fries was tested from a shipment and 27 fries had dark ends. Assuming that the
population does meet the 0.06 standard, what is the probability of getting a sample of
300 with 27 or more dark ends?
A) 0.0341
B) 0.0162
C) 0.0012
D) 0.0231
Which of the following is a reason for constructing a joint frequency distribution?
A) To determine the trend between the two variables
B) To measure the spread between the two variables
C) To help analyze the relationship between the two variables
D) To show the average of two variables


A cell phone service provider has 14,000 customers. Recently, the sales department
selected a random sample of 400 customer accounts and recorded the number of
minutes of long distance time used during the previous billing period. The company
analyst used Excel to sort these values in order from high to low. She then assigned the
highest value a rank of 1, the next highest value a rank of 2, and so forth. These ranks
would be considered to be ordinal data.
For the normal distribution with parameters μ = 4, σ = 3; calculate P(x > 1).
A) 0.8413
B) 0.4562
C) 0.7812
D) 0.4152
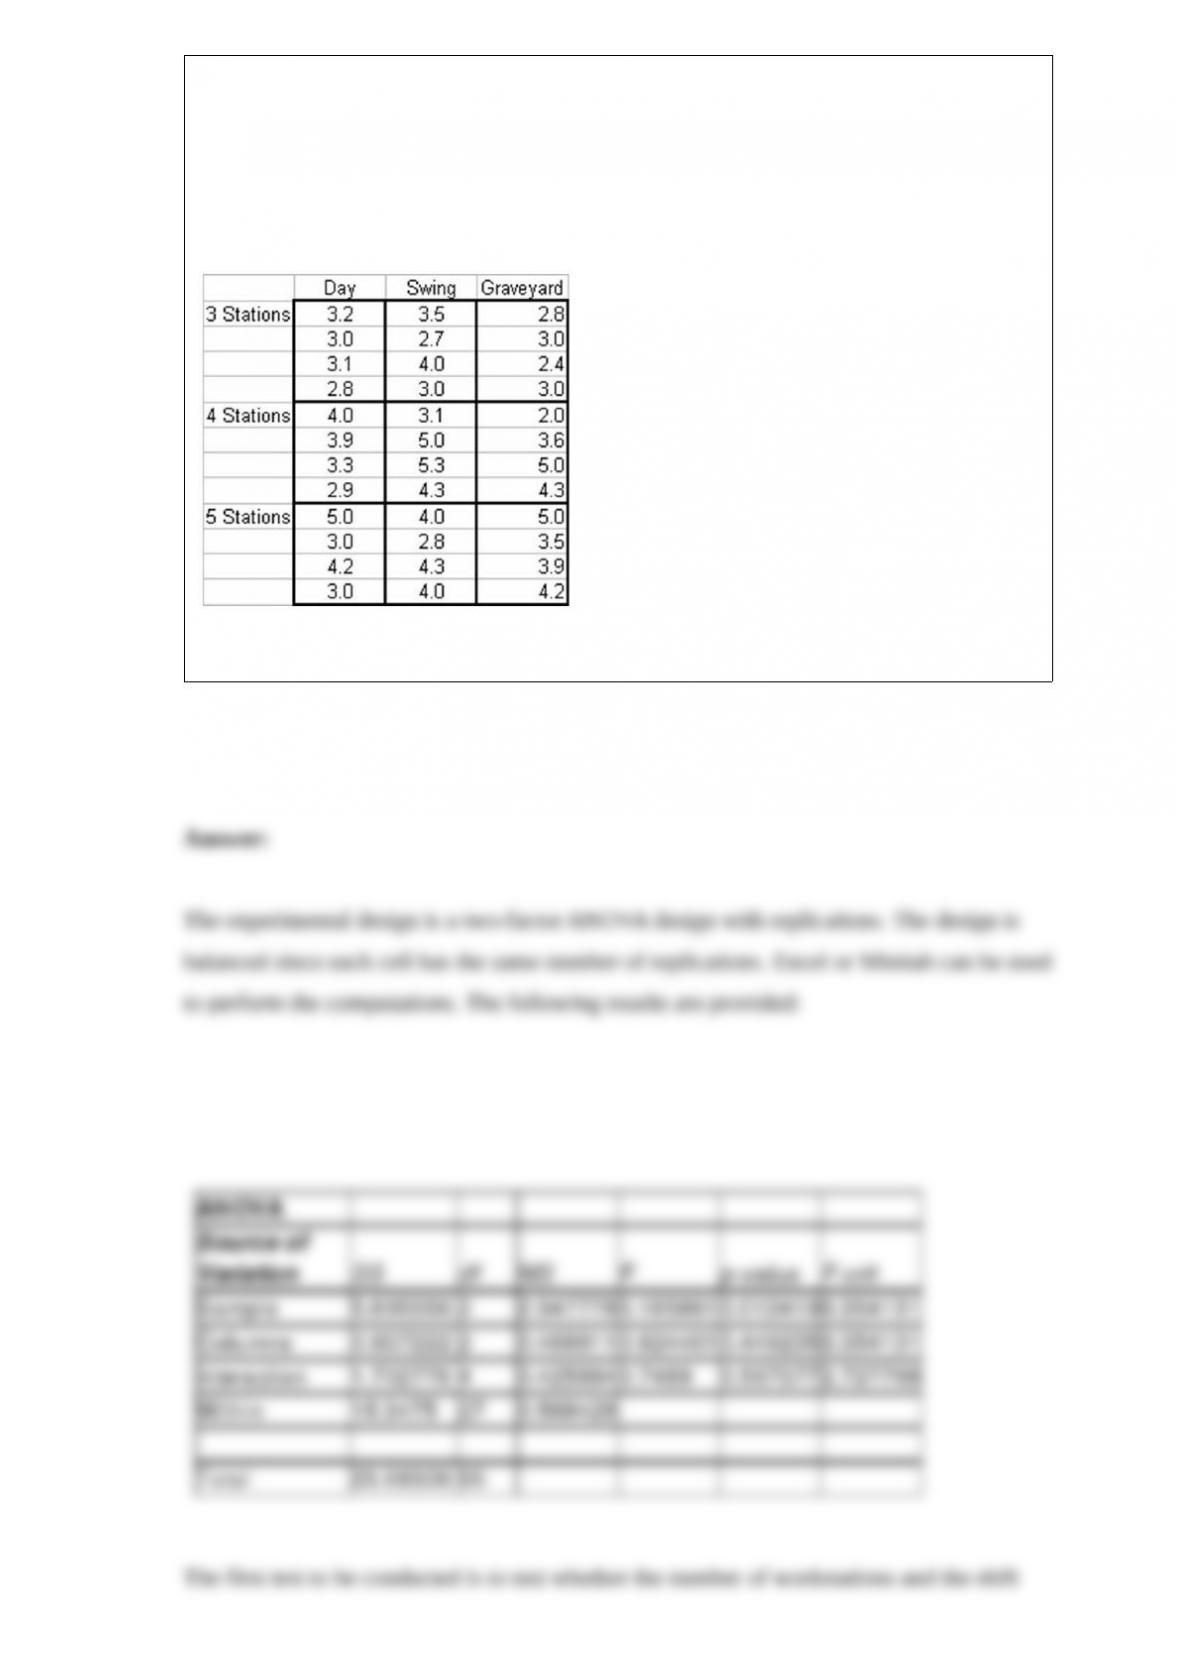
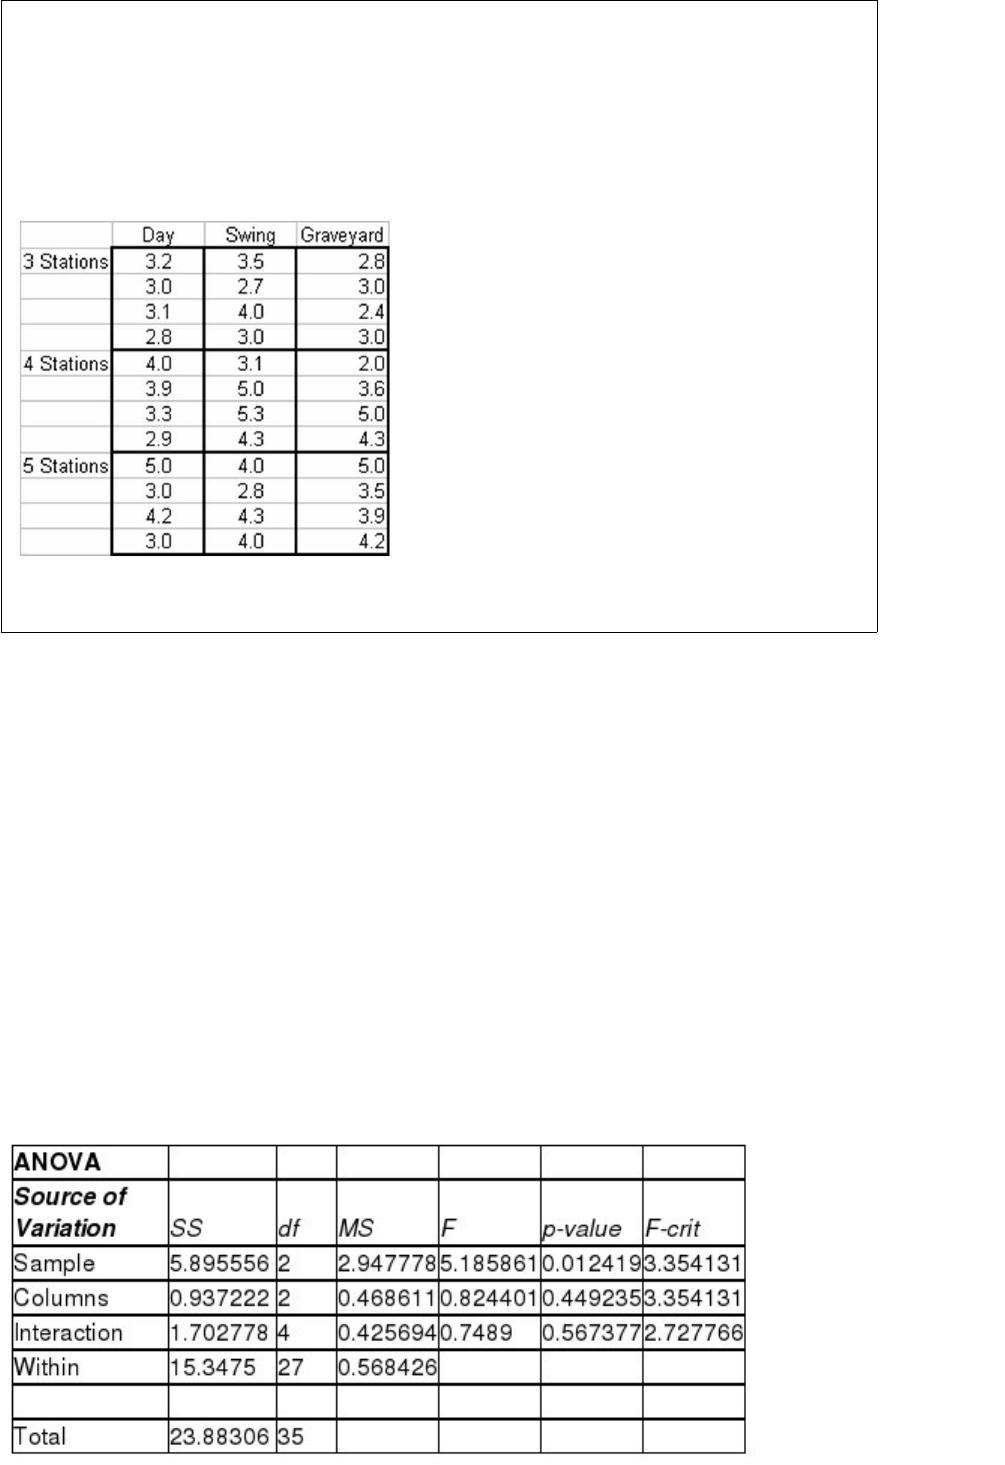
A personal computer assembly company is interested in studying the time it takes to
assemble a computer under different conditions. Specifically, two factors are to be
controlled: Factor A (Sample) is the number of individual work stations in the line and
Factor B (Columns) is whether the assembly was done on day shift, swing shift, or
graveyard shift. The following data were obtained in the study where the response
variable is the time required to assemble the PC from start to final test.
Carry out the appropriate statistical tests using an alpha equal .05 level.

In creating a frequency distribution for numerical data, describe the steps in choosing
the classes.

Explain why it is appropriate to connect the points on a line graph, but the points on a
scatter plot should not be connected.
The money spent by people at an amusement park, after paying to get in the gate, is
thought to be uniformly distributed between $5.00 and $25.00. Based on this, what is
the probability that someone will spend between $8.00 and $12.00?

Why should a histogram contain no gaps between the bars but a bar chart may have
gaps?
Statistical Process Control charts are used to detect whether a process remains in
control or whether it has gone out of control. Explain how the SPC signals work.

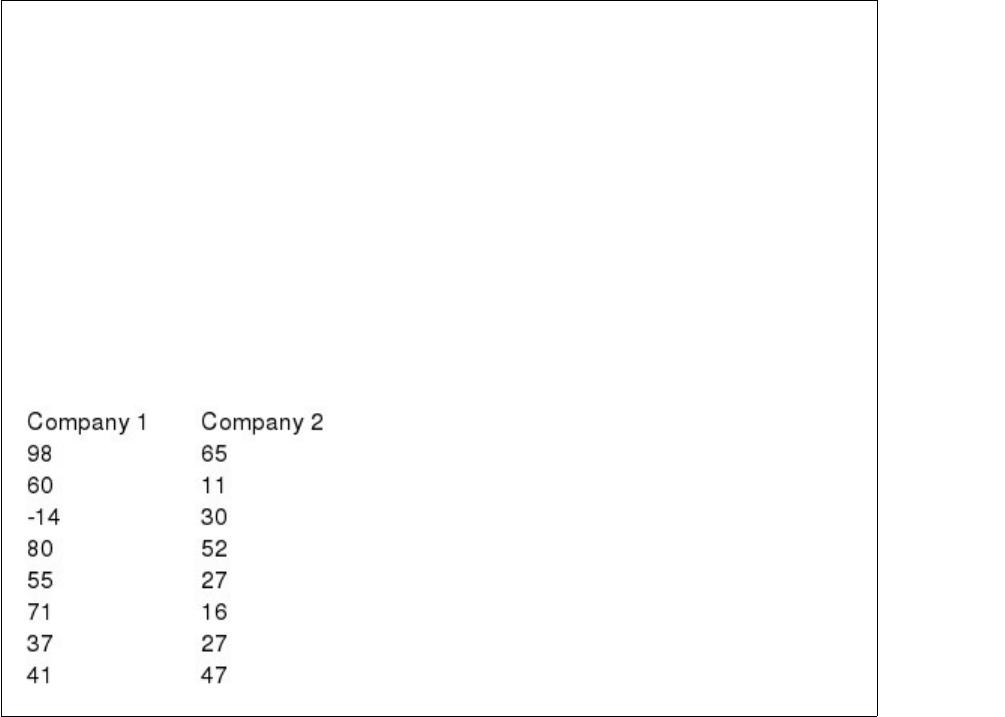
There are two major companies that provide SAT test tutoring for high school students.
At issue is whether Company 1, which has been in business for the longer time,
provides better results than Company 2, the newer company. Specifically of interest is
whether the mean increase in SAT scores for students who have already taken the SAT
test one time is higher for Company 1 than for Company 2. Two random samples of
students are selected. The following data reflect the number of points higher (or lower)
that the students scored on the SAT test after taking the tutoring. Prior to conducting the
test, which compares the means, we should determine if the assumption of equal
variances is supported.
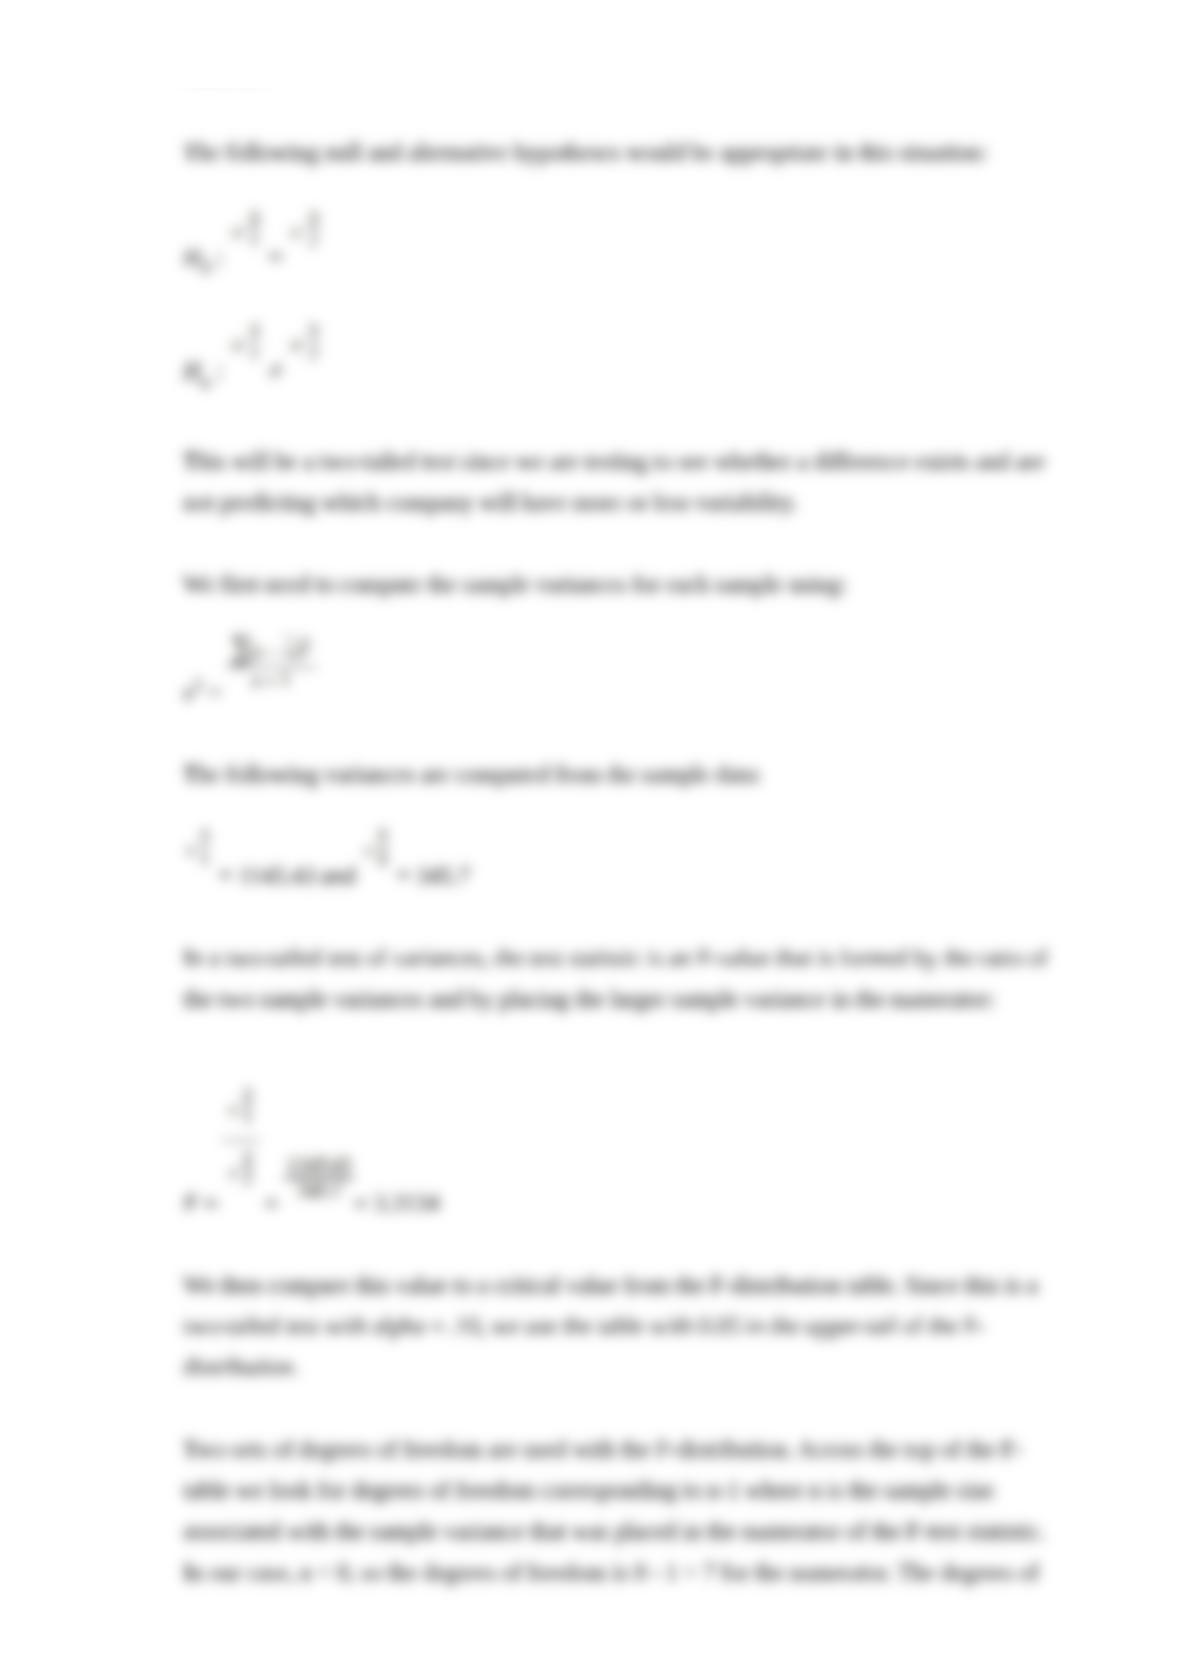
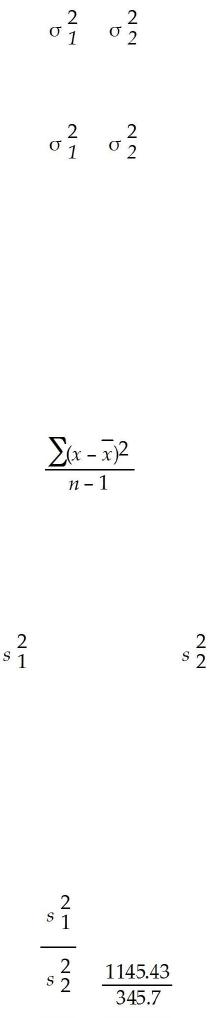
Conduct the appropriate hypothesis test to determine if the assumption of equal
variances is supported using a 0.10 level of significance.
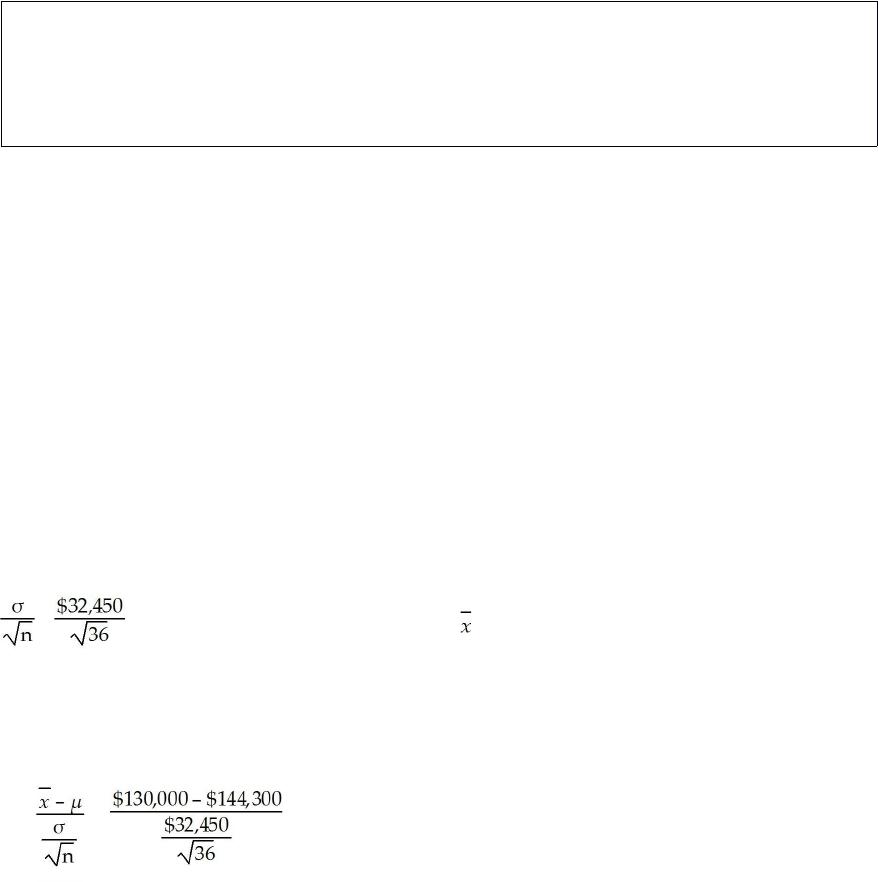
The annual income for independent sales representatives in the United States is thought
to be highly right-skewed with a mean equal to $144,300 and a standard deviation of
$32,450. Given this information, if a sample of 36 independent sales representatives is
selected, what is the probability that the mean of the sample will exceed $130,000?


A company that makes chocolate chip cookies has found that the number of chips per
cookie follows a Poisson distribution. What should the minimum average number of
chips be to result in at least 98 percent of the cookies having more than 2 chips? Find
the minimum average to nearest whole chip (i.e. choose an average that is a whole
number).
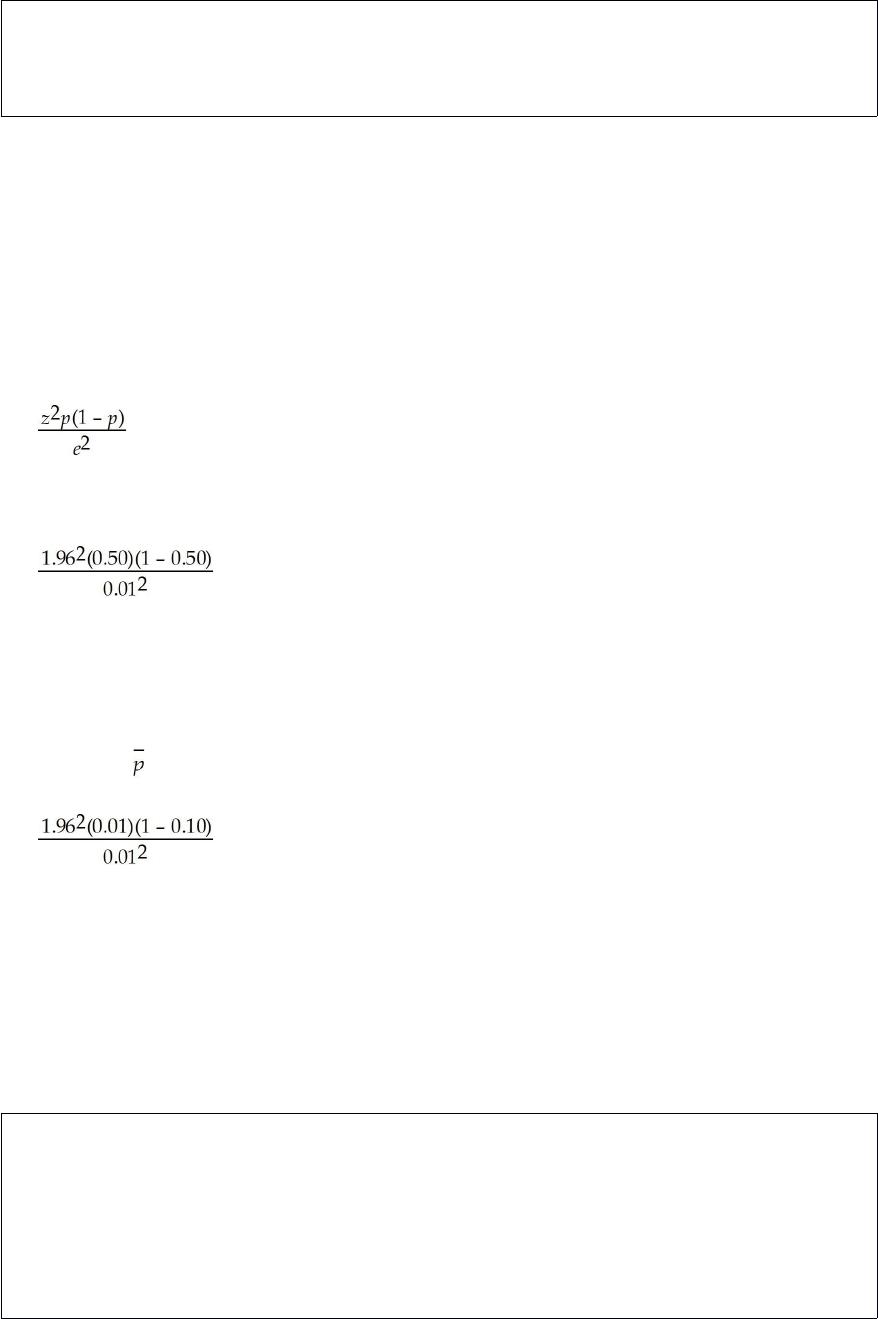
A human resources manager wishes to estimate the proportion of employees in her large
company who have supplemental health insurance. What is the largest size sample she
should select if she wants 95 percent confidence and a margin of error of 0.01?
The manager of a fast food store realizes that his staffing problems are a result of the
variation in the number of customers that arrive at the store. If the same number of
customers came each hour, she would know exactly how many servers to have working.
It turns out that the Poisson distribution works well to describe the arrivals of customers
in any given hour. Explain why the manager has more trouble staffing the store during
those hours when the average arrival rate is higher.

Assume that a standard deck of 52 playing cards is randomly shuffled and the first 2
cards are dealt to you. What is the probability that you have a blackjack? A blackjack is
where one card is an ace and the other card is worth 10 points. The 10-point cards are
kings, queens, jacks and 10’s.
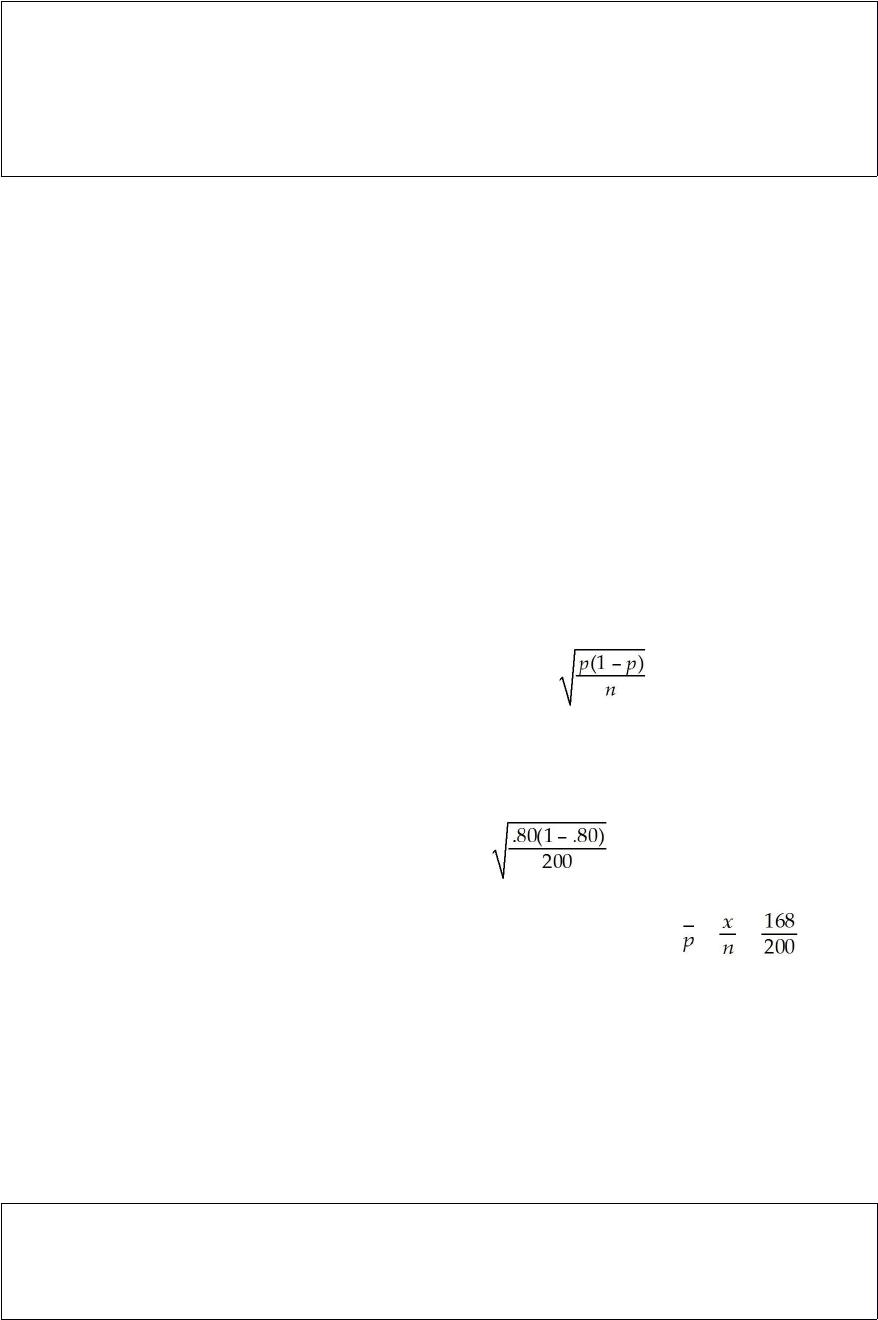
A national car rental chain believes that more than 80 percent of its customers are
satisfied with the check-in process that the company is using. To test this, a random
sample of n = 200 customers are surveyed. These sample results show 168 that say they
were satisfied. If the test is to be conducted using a .05 level of significance, what is the
critical value?
Of the following techniques for collecting data, which one is generally considered the
least costly to implement: experiments, telephone surveys, mail questionnaires, direct
observation, personal interview?

Referring to the SPC chart signals that a process is out of control, what type of problem
does each signal indicate? List the signals.
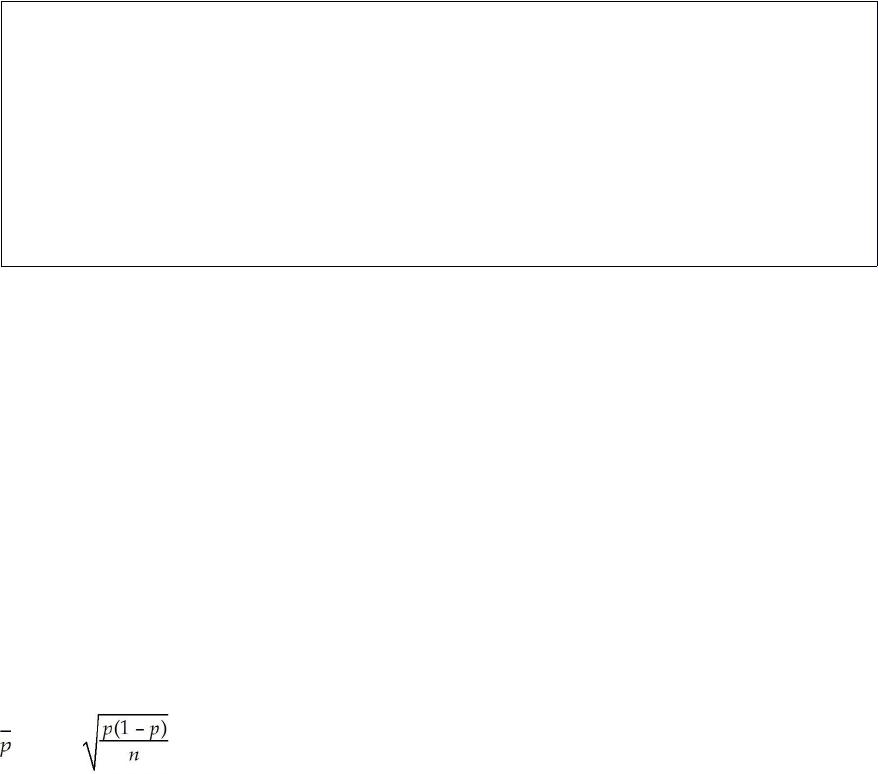
The Good Food chain has a contract to receive eggs from a large egg producer. The
eggs come in lots of 4,000 dozen each week. The contract specifies that the rate of
broken or defective eggs should not exceed 8 percent. Each time a load comes in, Good
Food warehouse employees select a random sample of n = 100 eggs and check to see if
they are broken or defective. If Good Food wants no more than a 0.05 chance of
rejecting the shipment, what should the cut-off be in terms of proportion of broken or
defective eggs so that if the proportion is that value or more, the shipment will be
rejected?

Explain what is meant by percentiles and quartiles.
Under what circumstances would you wish to select a pilot sample?