In a two-tailed hypothesis test for the difference between two population variances, the
test statistic is an F-ratio formed by putting the larger sample variance in numerator.
A simple random sample is selected in a manner such that each possible sample of a
given size has an equal chance of being selected.
One of the things that the Central Limit Theorem tells us is that about half of the sample
means will be greater than the population mean and about half will be less.
If the R-square value for a simple linear regression model is .80, the correlation
between the two variables is known to be .64.
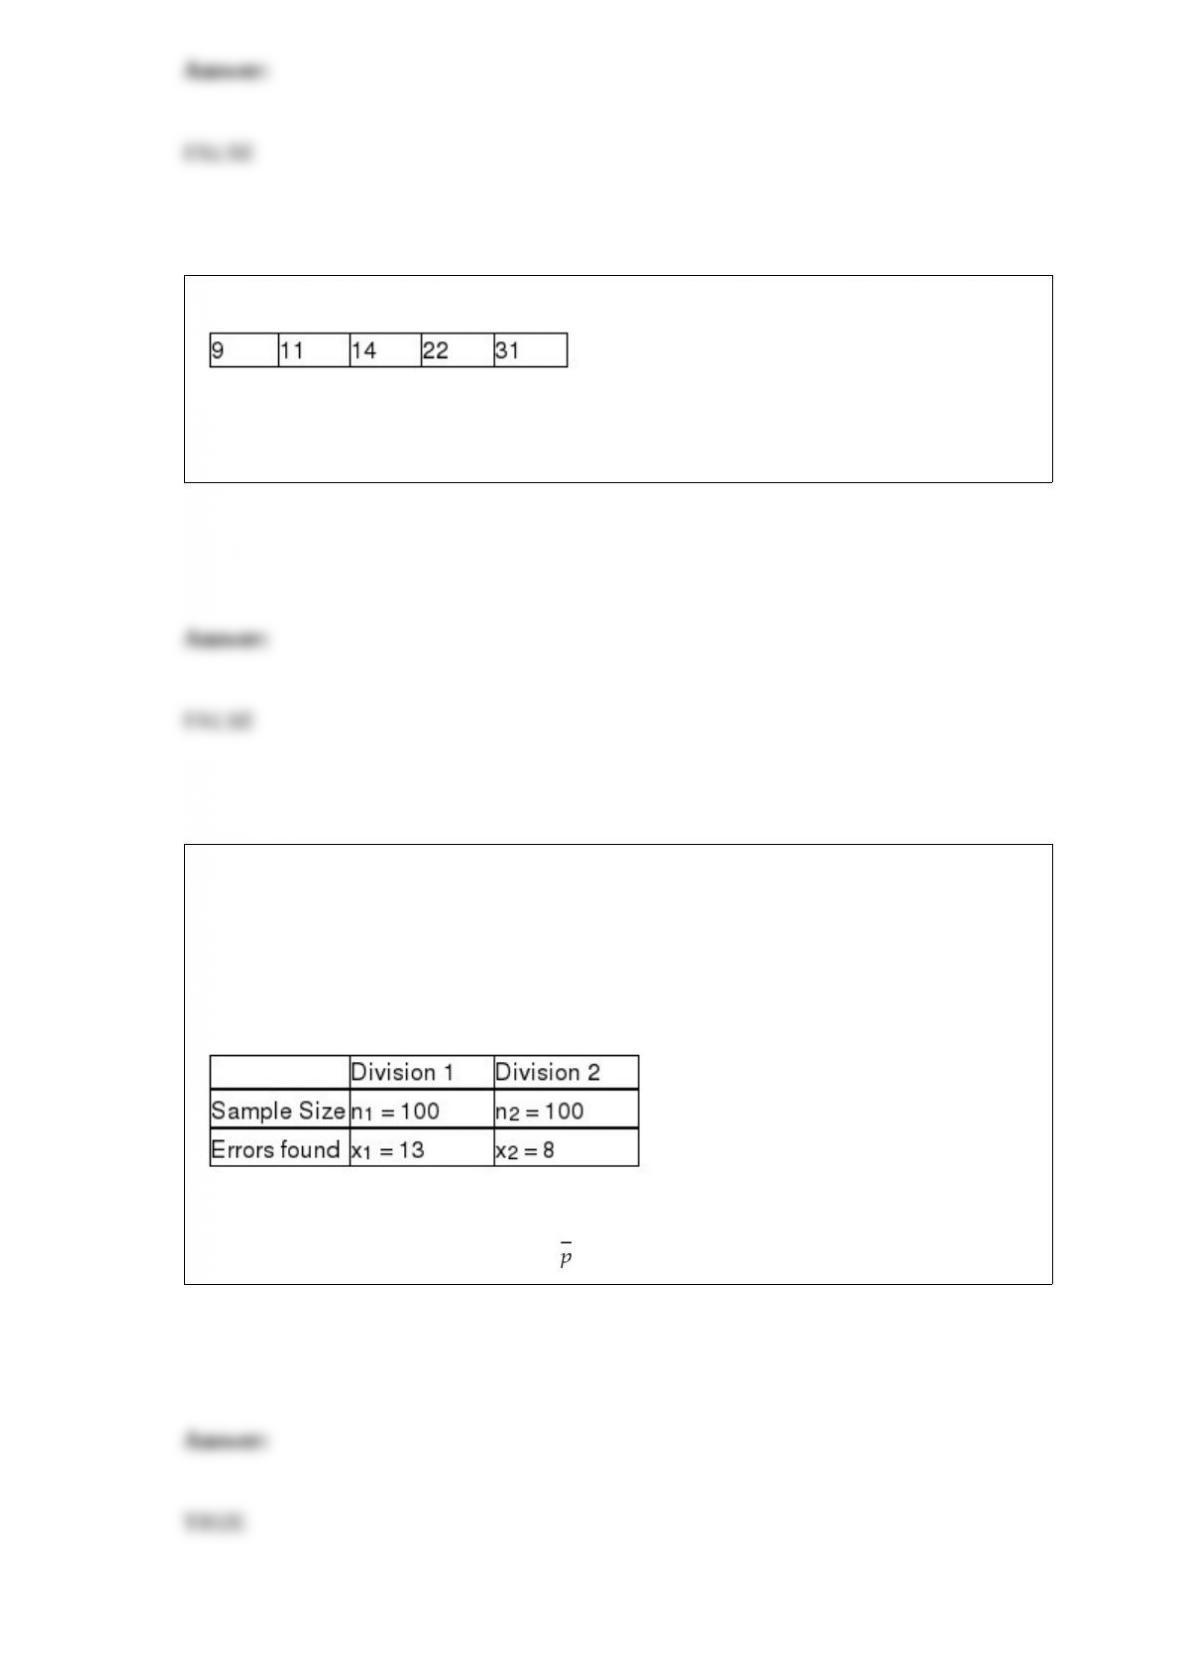
You are given the following data:
Assuming that these data reflect the population of interest, these data can be considered
symmetric.
An accounting firm has been hired by a large computer company to determine whether
the proportion of accounts receivables with errors in one division (Division 1) exceeds
that of the second division (Division 2). The managers believe that such a difference
may exist because of the lax standards employed by the first division. To conduct the
test, the accounting firm has selected random samples of accounts from each division
with the following results.
Based on this information, and using a significance level equal to 0.05, the pooled
estimator for the overall proportion is = .1050.
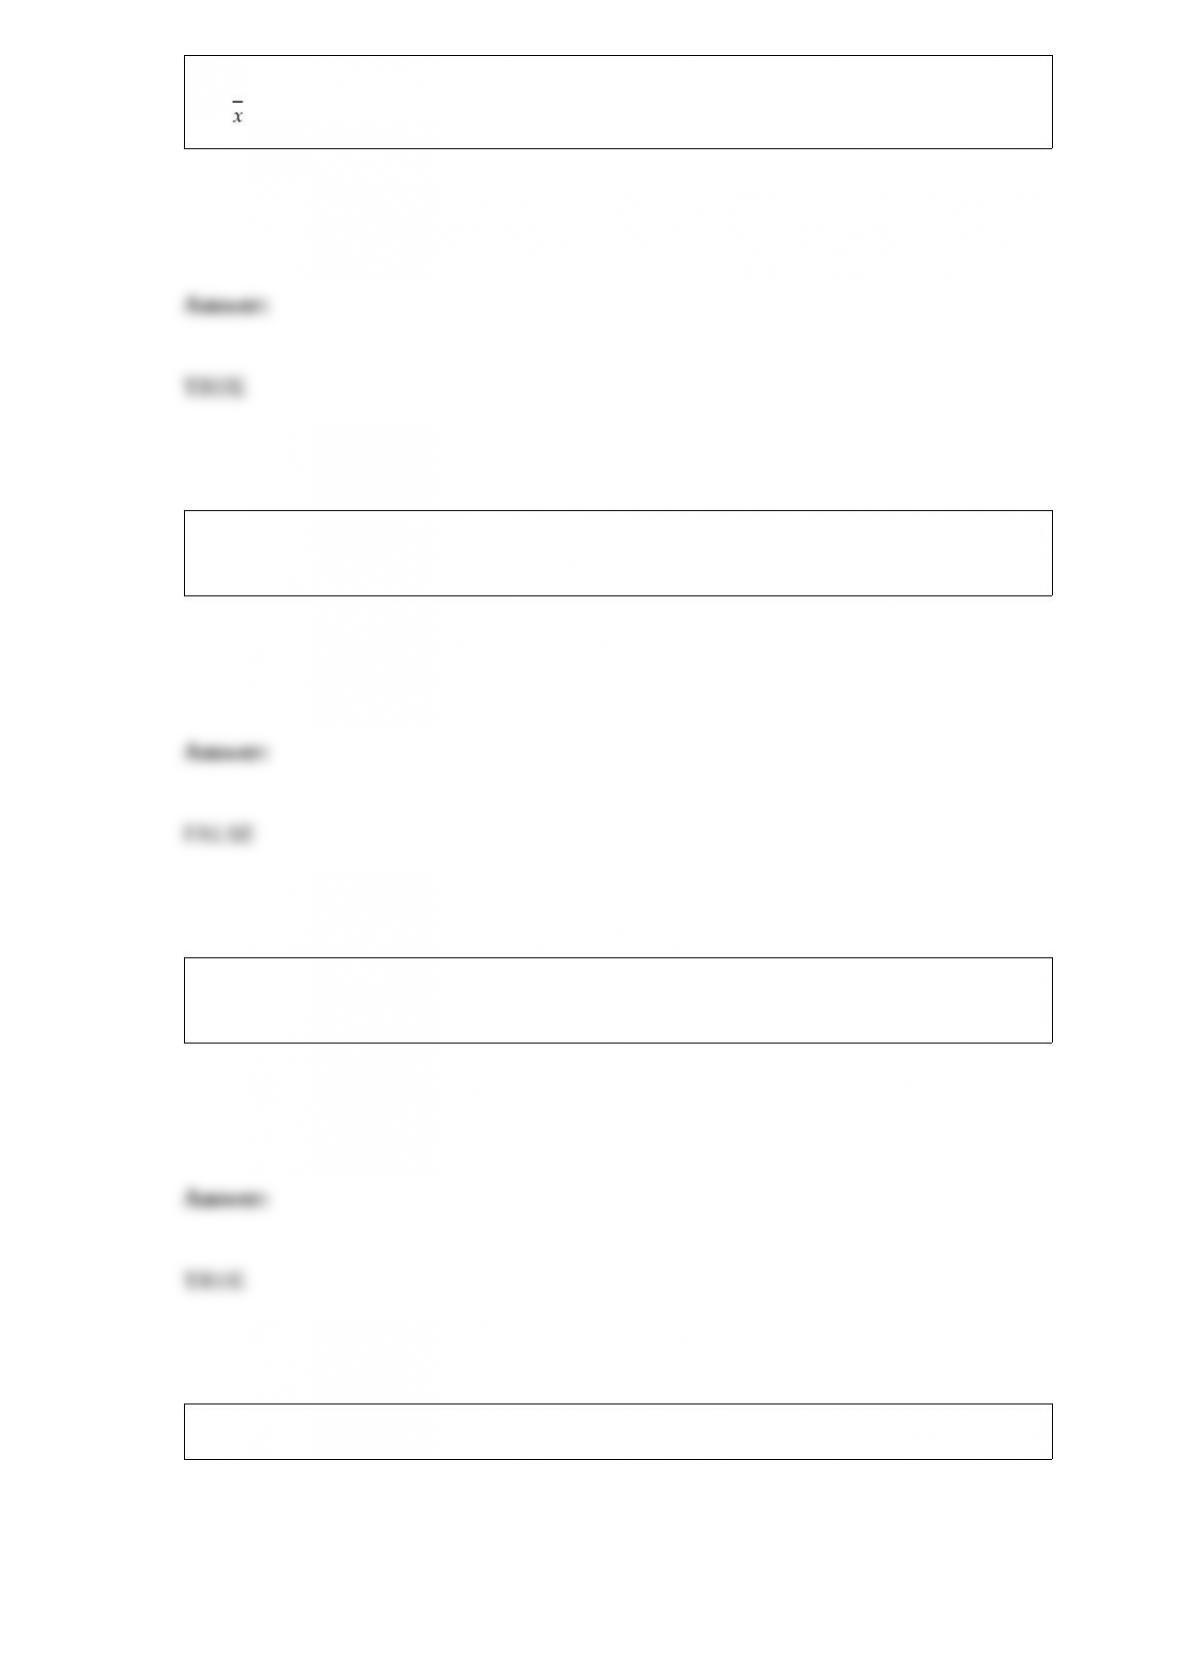
It is entirely possible for the R-chart to show that a process is in statistical control and
the -chart to show that the same process is out of control.
In a two-factor ANOVA design, the variances of the populations are assumed to be
equal unless there is interaction present.
On a survey, the questions pertaining to the background of the respondent (age, gender,
etc.) are referred to as demographic questions.
Mail questionnaires typically generate poor response rates.

To find a 98 percent confidence interval where the standard deviation is known, the
correct z-value to use for the critical value is 2.33.
Under the basic logic of one-way analysis of variance, if the within variation is large
relative to the between variation, it is an indication that the population means are likely
to be different.
Which distribution is used in testing the hypotheses about the equality of two
population variances?
A) z-distribution
B) F-distribution
C) x2 distribution
D) t-distribution

A major airline is concerned that the waiting time for customers at its ticket counter
may be exceeding its target average of 190 seconds. To test this, the company has
selected a random sample of 100 customers and times them from when the customer
first arrives at the checkout line until he or she is at the counter being served by the
ticket agent. The mean time for this sample was 202 seconds with a standard deviation
of 28 seconds. Given this information and the desire to conduct the test using an alpha
level of 0.02, which of the following statements is true?
A) The chance of a Type II error is 1 – 0.02 = 0.98.
B) The test to be conducted will be structured as a two-tailed test.
C) The test statistic will be approximately t = 4.286, so the null hypothesis should be
rejected.
D) The sample data indicate that the difference between the sample mean and the
hypothesized population mean should be attributed only to sampling error.
A population, with an unknown distribution, has a mean of 80 and a standard deviation
of 7. For a sample of 49, the probability that the sample mean will be larger than 82 is:
A) 0.5228
B) 0.9772
C) 0.4772
D) 0.0228

When σ is unknown, the margin of error is computed by using:
A) normal distribution.
B) t-distribution.
C) the mean of the sample.
D) The margin of error is also unknown.
To use contingency analysis for numerical data, which of the following is true?
A) Contingency analysis cannot be used for numerical data.
B) Numerical data must be broken up into specific categories.
C) Contingency analysis can be used for numerical data only if both variables are
numerical.
D) Contingency analysis can be used for numerical data only if it is interval data.

The Biltmore Hotel manager is getting ready to make a presentation that she hopes will
justify adding additional staff. As part of the presentation, she has constructed charts
and graphs. The general type of statistical analysis she is using is:
A) hypothesis testing.
B) estimation.
C) inferential statistics.
D) descriptive statistics.
Ponderosa Paint and Glass carries three brands of paint. A customer wants to buy
another gallon of paint to match paint she purchased at the store previously. She can’t
recall the brand name and does not wish to return home to find the old can of paint. So
she selects two of the three brands of paint at random and buys them.
What is the probability that she matched the paint brand?
A) 3/2
B) 2/3
C) 1/9
D) 3/4

Which of the following statements is true?
A) A binomial distribution with n = 20 and p = 0.05 will be right-skewed.
B) A binomial distribution with n = 6 and p = 0.50 will be symmetric.
C) A binomial distribution with n = 20 and p = 0.05 has an expected value equal to 1.
D) A, B, and C are all true.
Because of the complex nature of the U.S. income tax system, many people have
questions for the Internal Revenue Service (IRS). Yet, an article published by the
Detroit Free Press entitled “Assistance: IRS Help Centers Give the Wrong Information”
discusses the propensity of IRS staff employees to give incorrect tax information to
tax-payers who call with questions. Then IRS Inspector General Pamela Gardiner told a
Senate subcommittee that “the IRS employees at 400 taxpayer assistance centers
nationwide encountered 8.5 million taxpayers face-to-face last year. The problem:
When inspector general auditors posing as taxpayers asked them to answer tax
questions, the answers were right 69% of the time.”
Suppose an independent commission was formed to test whether the 0.69 accuracy rate
is correct or whether it is actually higher or lower. The commission has randomly
selected n = 180 tax returns that were completed by IRS assistance employees and
found that 105 of the returns were accurately completed.
Using an α= 0.05 level, based on the sample data, what conclusion should be reached
about the IRS rate of correct tax returns?
A) The z-critical values from the standard normal table for a two-tailed test with alpha
= 0.05 are and z = -1.96. Since z = -0.96 > -1.96, we do not reject the null
hypothesis. Thus, based on these sample data, we believe that the accuracy rate is
actually higher than the 0.69 rate quoted in the Detroit Free Press article
B) The z-critical values from the standard normal table for a two-tailed test with alpha =
0.05 are and z = -1.96. Since z = -0.96 > -1.96, we do not reject the null
hypothesis. Thus, based on these sample data, we believe that the accuracy rate is
actually higher than the 0.58 rate quoted in the Detroit Free Press article
C) The z-critical values from the standard normal table for a two-tailed test with alpha =

0.05 are and z = -1.96. Since z= -3.19 < -1.96, we reject the null hypothesis.
Thus, based on these sample data, we believe that the accuracy rate is actually lower
than the 0.69 rate quoted in the Detroit Free Press article.
D) The z-critical values from the standard normal table for a two-tailed test with alpha =
0.05 are and z = -1.96. Since z = -3.19 < -1.96, we reject the null hypothesis.
Thus, based on these sample data, we believe that the accuracy rate is actually lower
than the 0.58 rate quoted in the Detroit Free Press article.
For a standardized normal distribution, determine a value, say z0, so that P(z > z0) =
0.025.
A) 1.96
B) 1.65
C) 1.24
D) 2.14
The manager at a local movie theater has collected data for a long period of time and
has concluded that the revenue from concession sales during the first show each
evening is normally distributed with a mean equal to $336.25 and a standard deviation
equal to $80. Based on this information, what are the chances that the revenue on the
first show will be between $300 and $500?
A) About 0.3062

B) Approximately 0.6534
C) 0.1736
D) Approximately 0.4798
Assuming that the change in daily closing prices for stocks on the New York Stock
Exchange is a random variable that is normally distributed with a mean of $.35 and a
standard deviation of $.33. Based on this information, what is the probability that a
randomly selected stock will close up $.75 or more?
A) 0.3869
B) 0.1131
C) 0.7100
D) 0.8869
Determine the 90% confidence interval estimate for the population mean of a normal
distribution given n = 100, σ = 121, and = 1,200.
A) (1186.31, 1213.69)
B) (1180.10, 1219.90)
C) (1182.56, 1217.44)
D) (1191.12, 1208.88)
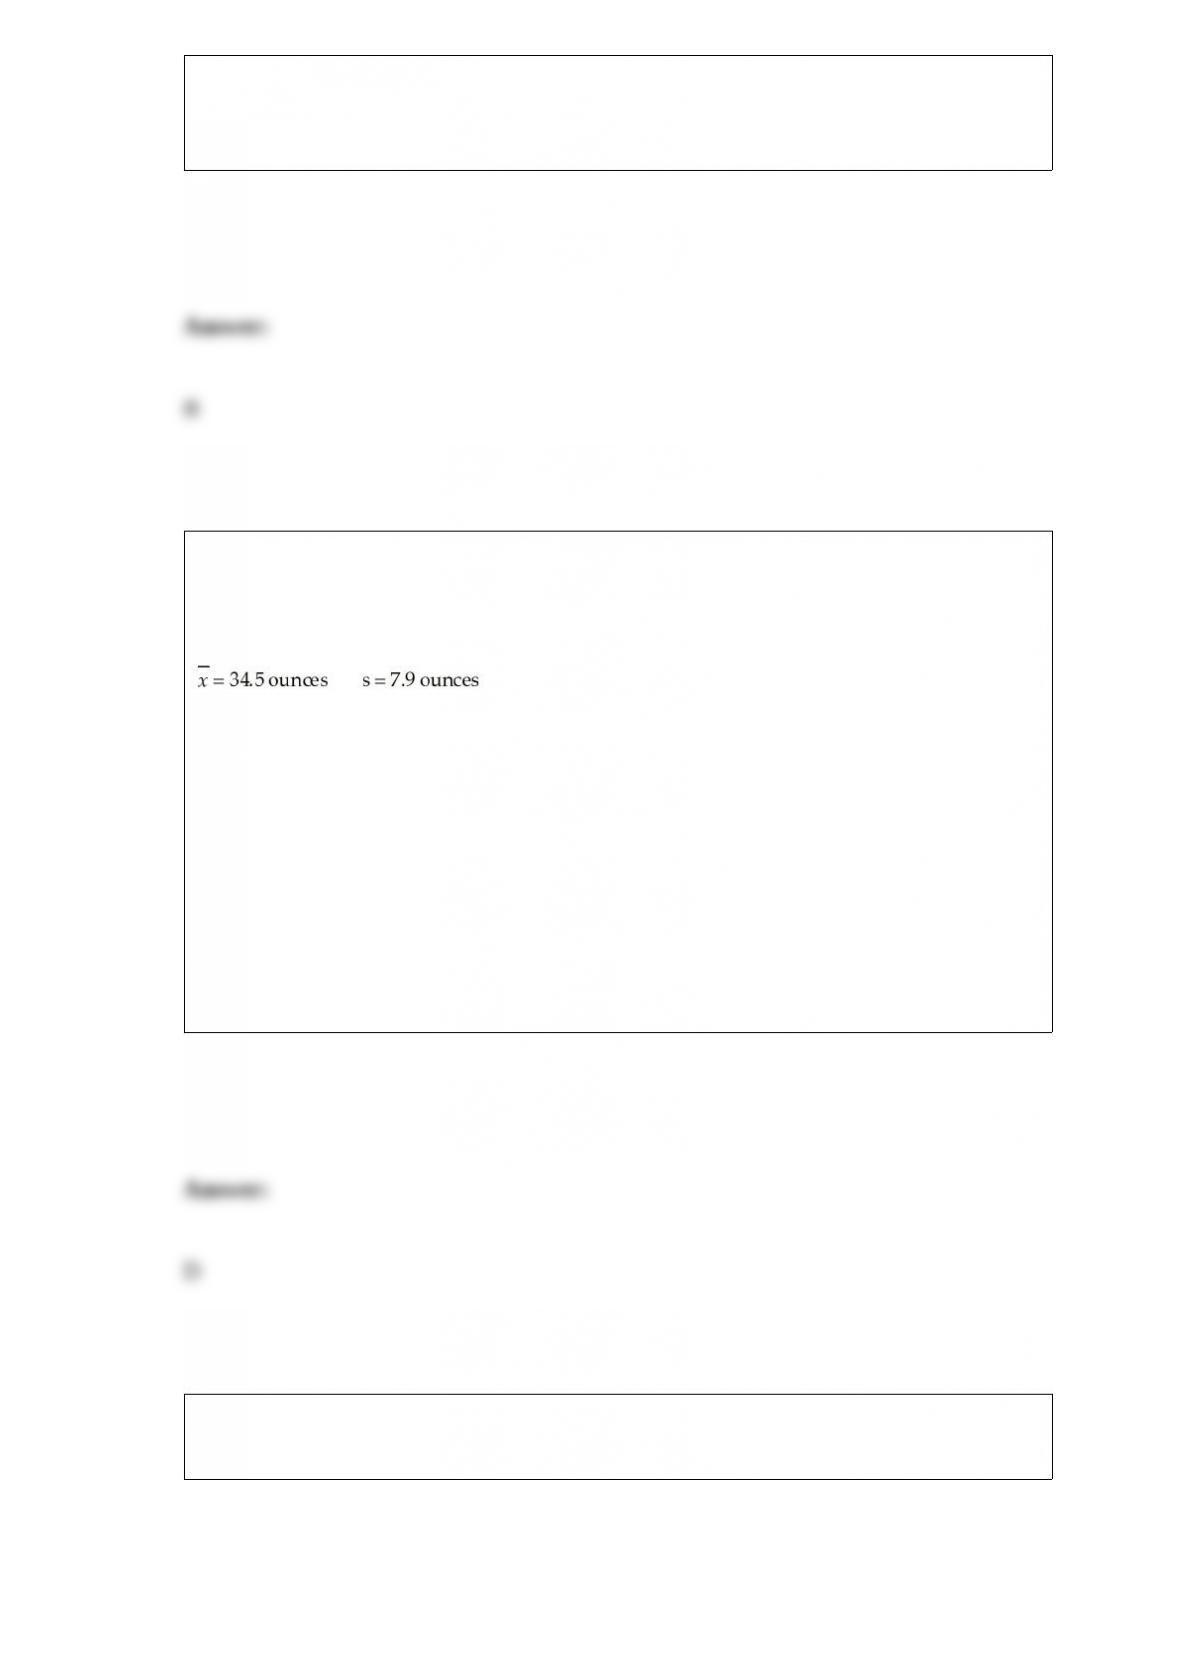
The Wisconsin Dairy Association is interested in estimating the mean weekly
consumption of milk for adults over the age of 18 in that state. To do this, they have
selected a random sample of 300 people from the designated population. The following
results were recorded:
Given this information, if the leaders wish to estimate the mean milk consumption with
90 percent confidence, what is the approximate margin of error in the estimate?
A) z = 1.645
B) 12.996 ounces
C) 0.456 ounce
D) 0.75 ounce
A study was done in which the high daily temperature and the number of traffic
accidents within the city were recorded. These sample data are shown as follows:
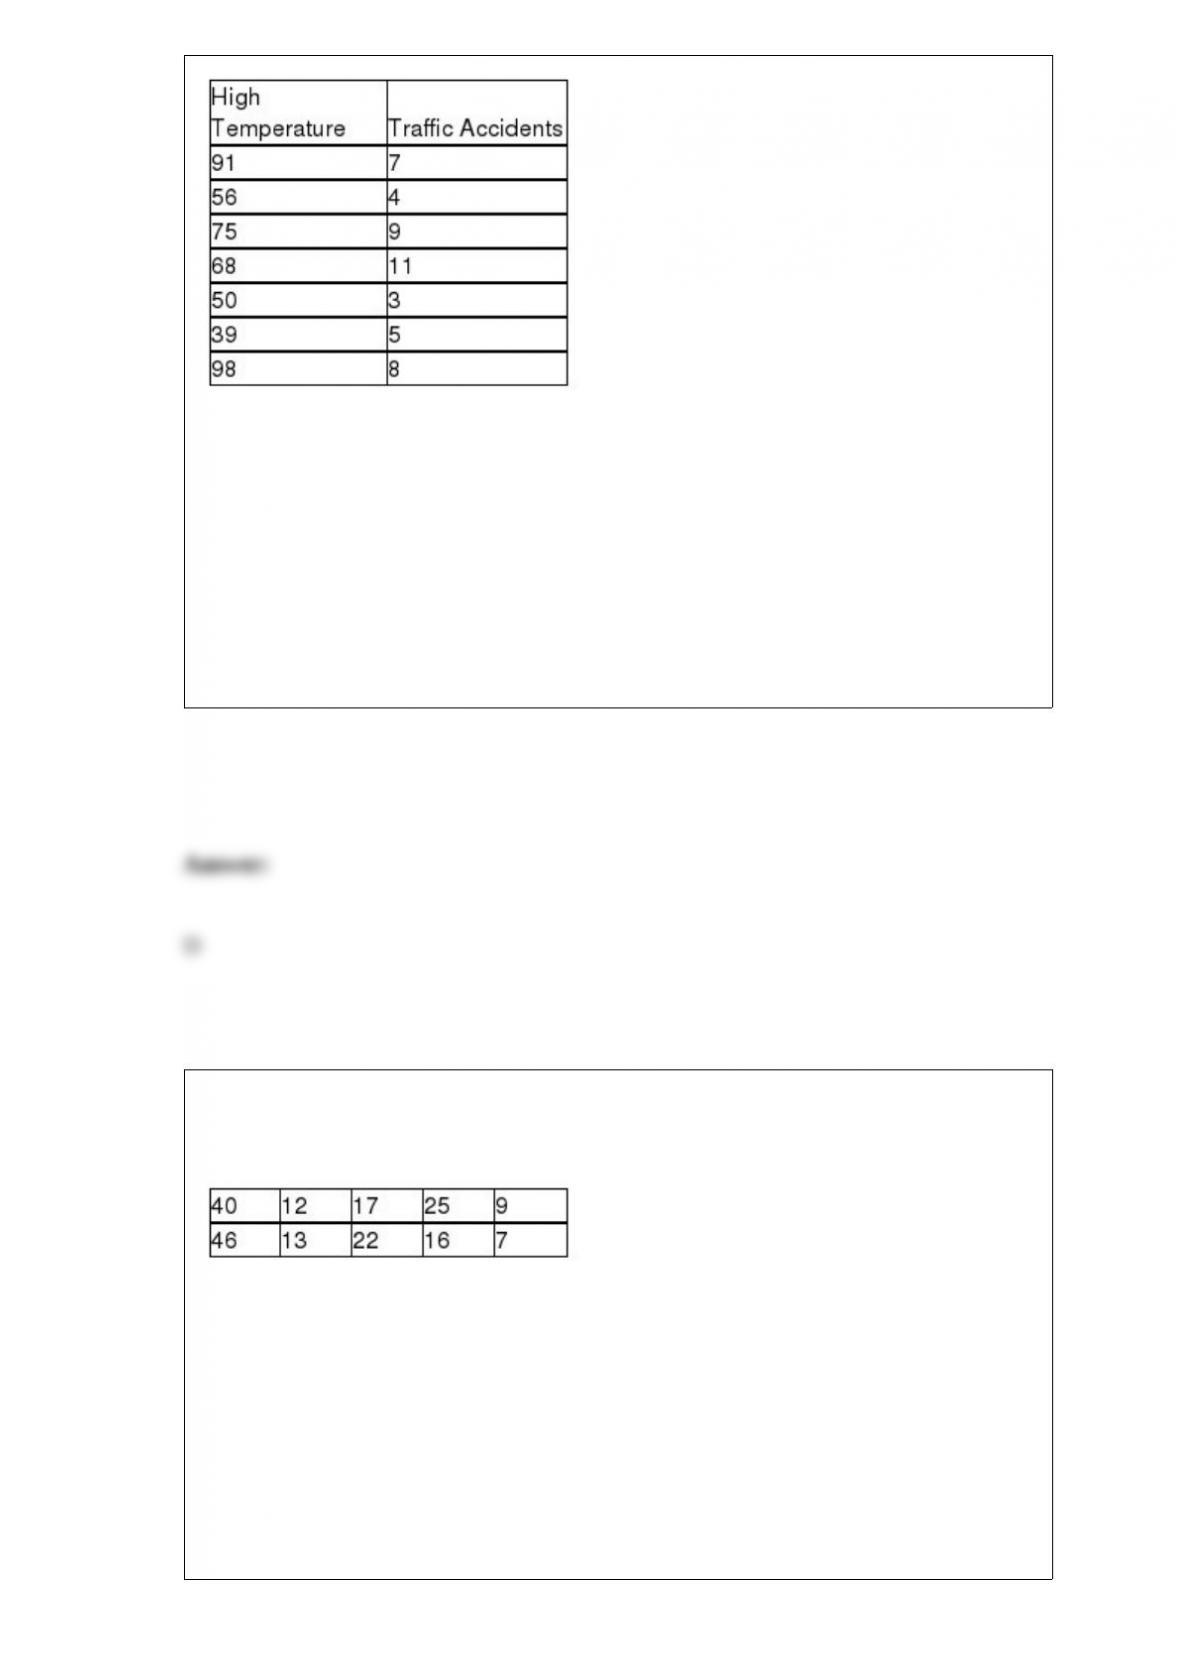
Given this data the sample correlation is:
A) -0.57
B) 0.64
C) 1.54
D) 0.57
The following data reflect the number of customers who return merchandise for a
refund on Monday. Note these data reflect the population of all 10 Mondays for which
data are available.
Based on these data, what is the standard deviation?
A) 13.03
B) 12.36
C) 39
D) 152.8

The Empirical Rule states that for a bell-shaped distribution, approximately 95 percent
of data should lie within:
A) one standard deviation from either side of the mean.
B) two standard deviations from either side of the mean.
C) three standard deviations from either side of the mean.
D) four standard deviations from either side of the mean.
The human resources department at a major high tech company recently conducted an
employee satisfaction survey of 100 of its 3000 employees. Data were collected on such
variables as age, gender, marital status, current salary, level of overall satisfaction on a
scale from 1 to 5, number of years with the company, and job title. Which of the
variables listed are considered to be ratio level data?
A) Age and years with the company
B) Gender and marital status
C) Job title
D) None of the variables is ratio level.
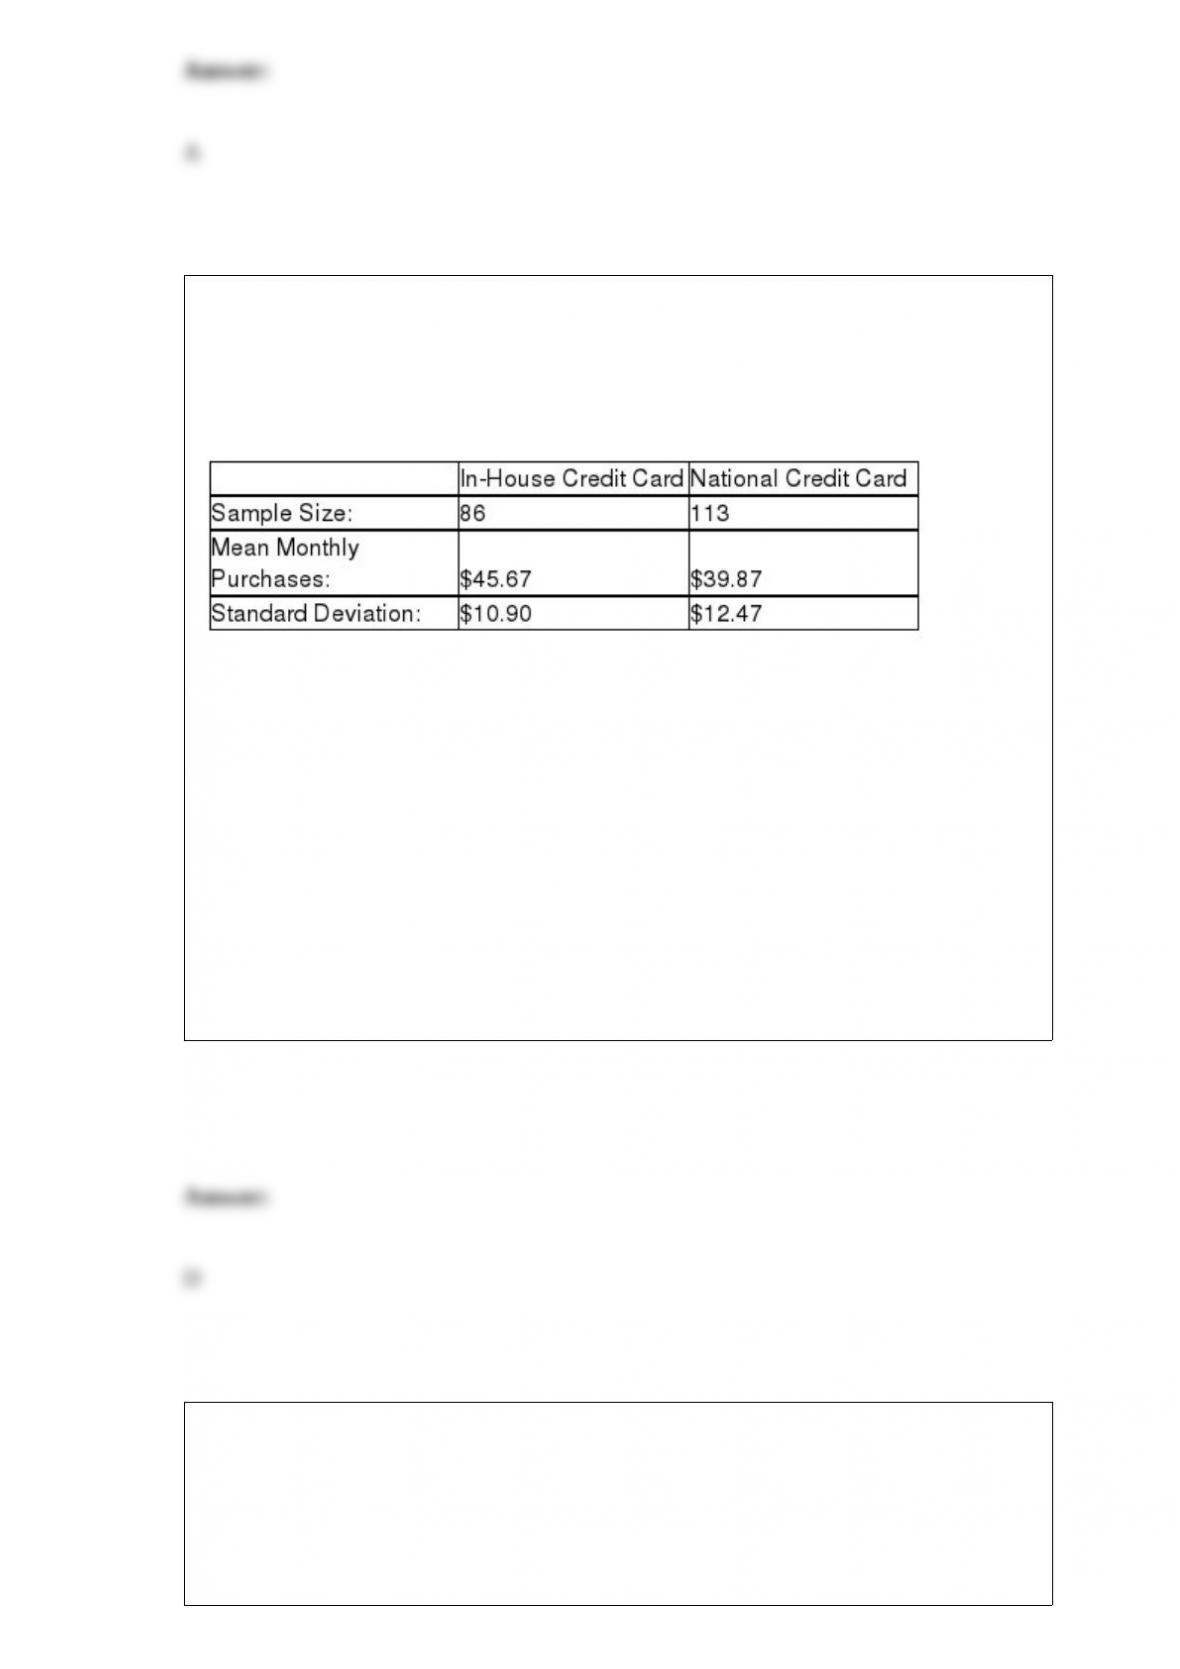
A major retail clothing store is interested in estimating the difference in mean monthly
purchases by customers who use the store’s in-house credit card versus using a Visa,
Mastercard, or one of the other major credit cards. To do this, it has randomly selected a
sample of customers who have made one or more purchases with each of the types of
credit cards. The following represents the results of the sampling:
Suppose that the managers wished to test whether there is a statistical difference in the
mean monthly purchases by customers using the two types of credit cards, using a
significance level of .05, what is the value of the test statistic assuming the standard
deviations are known?
A) t = 3.49
B) z = 11.91
C) z = 2.86
D) z = 3.49
One of the major challenges for developing a good written questionnaire or telephone
survey instrument is that:
A) nonresponses are too high.
B) there will always be missed data.
C) bias cannot be controlled.
D) wording can influence responses.
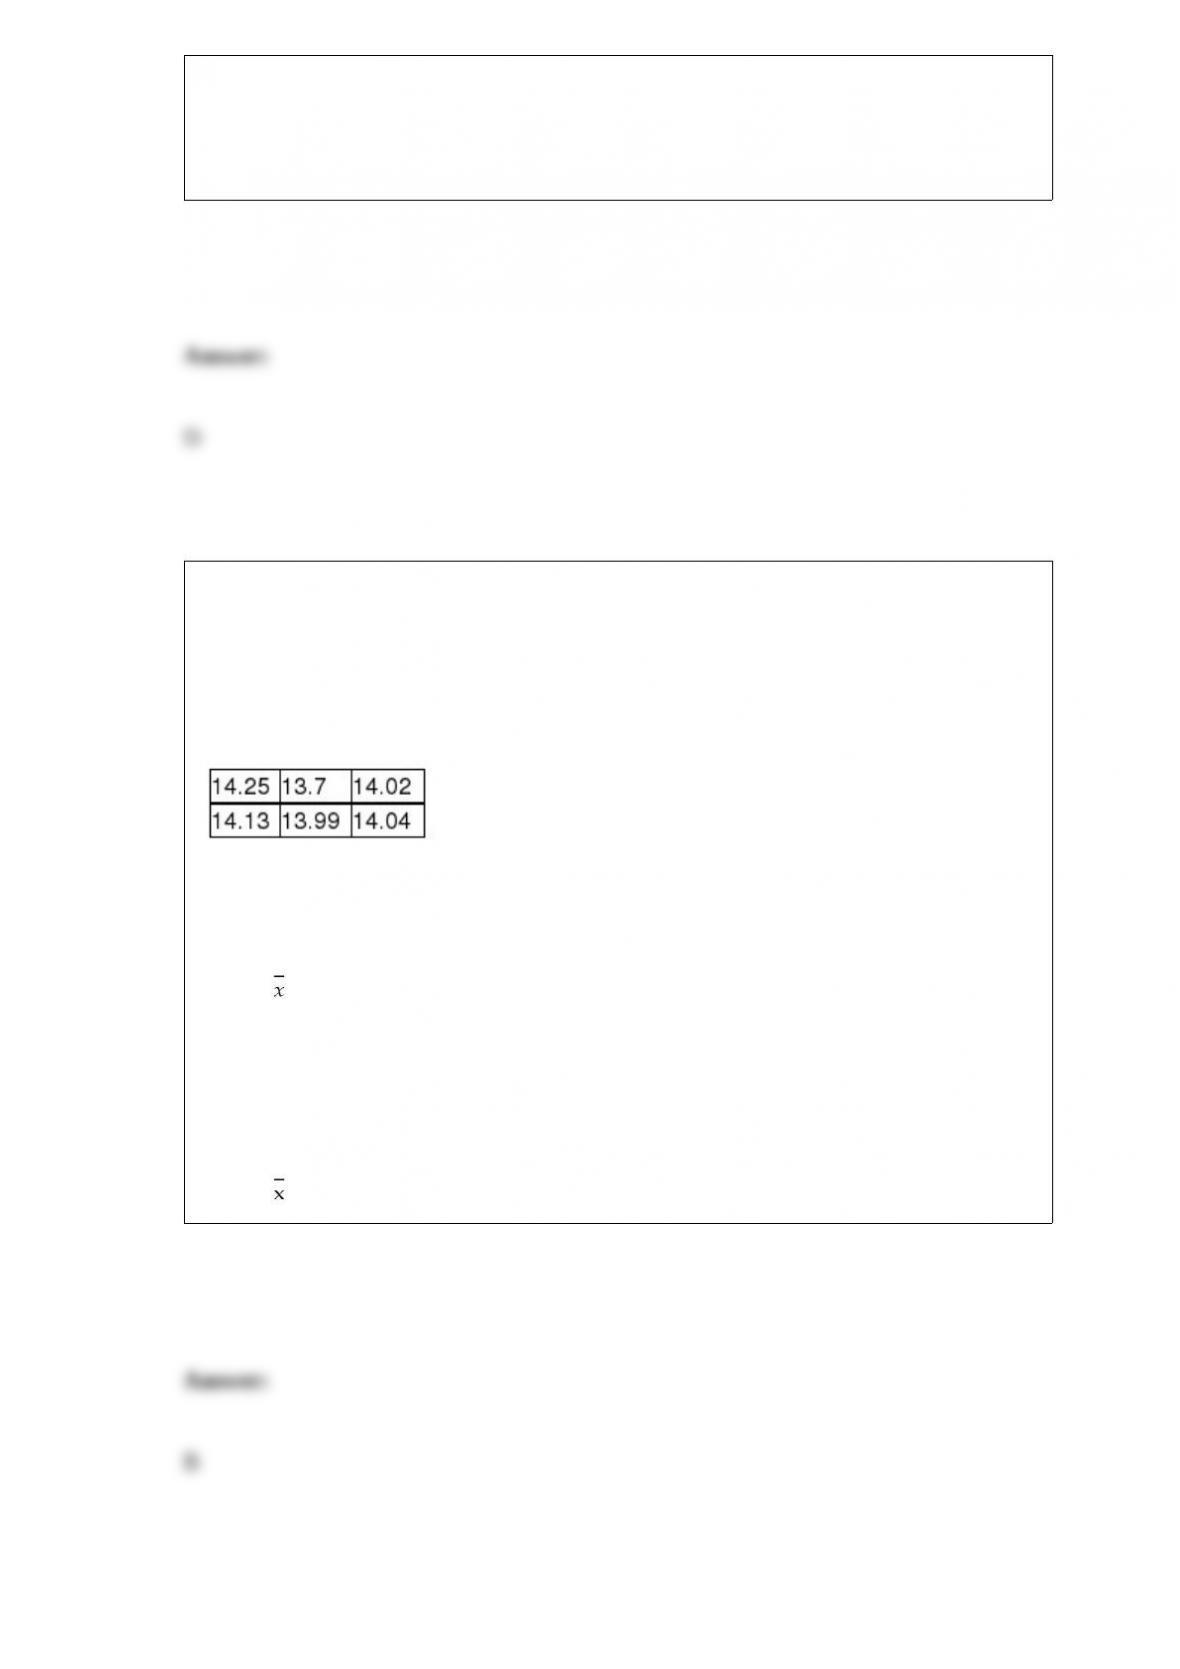
The R.D. Wilson Company makes a soft drink dispensing machine that allows
customers to get soft drinks from the machine in a cup with ice. When the machine is
running properly, the average number of fluid ounces in the cup should be 14.
Periodically the machines need to be tested to make sure that they have not gone out of
adjustment. To do this, six cups are filled by the machine and a technician carefully
measures the volume in each cup. In one such test, the following data were observed:
Which of the following would be the correct null hypothesis if the company wishes to
test the machine?
A) H0 : = 14 ounces
B) H0: μ = 14 ounces
C) H0 : μ ≠ 14 ounces
D) H0 : ≠ 14 ounces

SeeClear Windows makes windows for use in homes and commercial buildings. The
standards for glass thickness call for the glass to average 0.375 inches with a standard
deviation equal to 0.050 inch. Suppose a random sample of n = 50 windows yields a
sample mean of 0.392 inches. What is the probability if the windows meet the
standards?
A) 0.0612
B) 0.0082
C) 0.0015
D) 0.0009
The URS construction company has submitted two bids, one to build a large hotel in
London and the other to build a commercial office building in New York City. The
company believes it has a 40% chance of winning the hotel bid and a 25% chance of
winning the office building bid. The company also believes that winning the hotel bid is
independent of winning the office building bid.
What is the probability the company will lose both contracts?
A) 0.55
B) 0.45
C) 0.10
D) 0.75
The reason for using the t-distribution in a hypothesis test about the population mean is:
A) the population standard deviation is unknown.
B) it results in a lower probability of a Type I error occurring.
C) it provides a smaller critical value than the standard normal distribution for a given
sample size.
D) the population is not normally distributed.
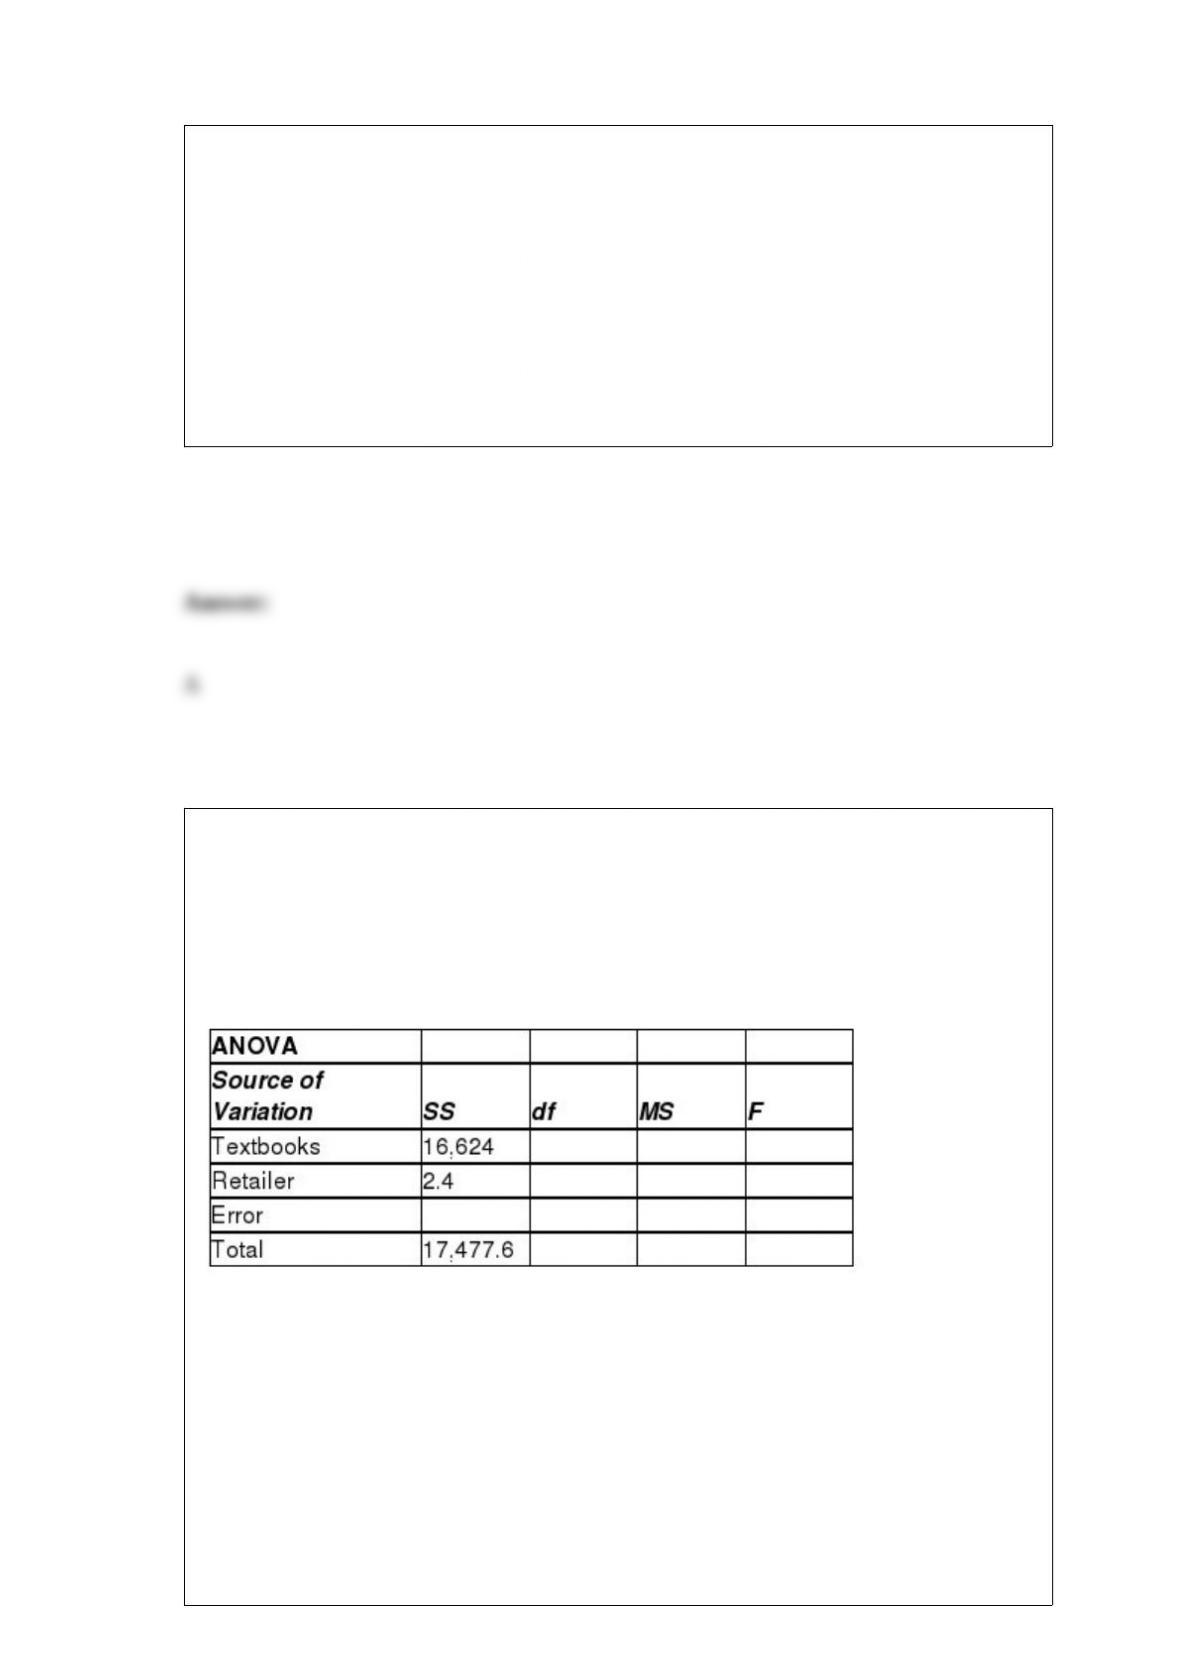
A study was conducted to determine if differences in new textbook prices exist between
on-campus bookstores, off-campus bookstores, and Internet bookstores. To control for
differences in textbook prices that might exist across disciplines, the study randomly
selected 12 textbooks and recorded the price of each of the 12 books at each of the three
retailers. You may assume normality and equal-variance assumptions have been met.
The partially completed ANOVA table based on the study’s findings is shown here:
Based on the study’s findings, was it correct to block for differences in textbooks?
Conduct the appropriate test at the alpha = 0.10 level of significance.
A) Since F = 39.05 > Fα=0.10 = 1.88, reject the null hypothesis. This means that based
on these sample data we can conclude that blocking is effective.
B) Since F = 39.05 > Fα=0.10 = 1.88, do not reject the null hypothesis. This means that
based on these sample data we can conclude that blocking is not effective.
C) Since F = 40.05 > Fα=0.10 = 1.88, reject the null hypothesis. This means that based
on these sample data we can conclude that blocking is effective.
D) Since F = 40.05 > Fα=0.10 = 1.88, do not reject the null hypothesis. This means that
based on these sample data we can conclude that blocking is not effective
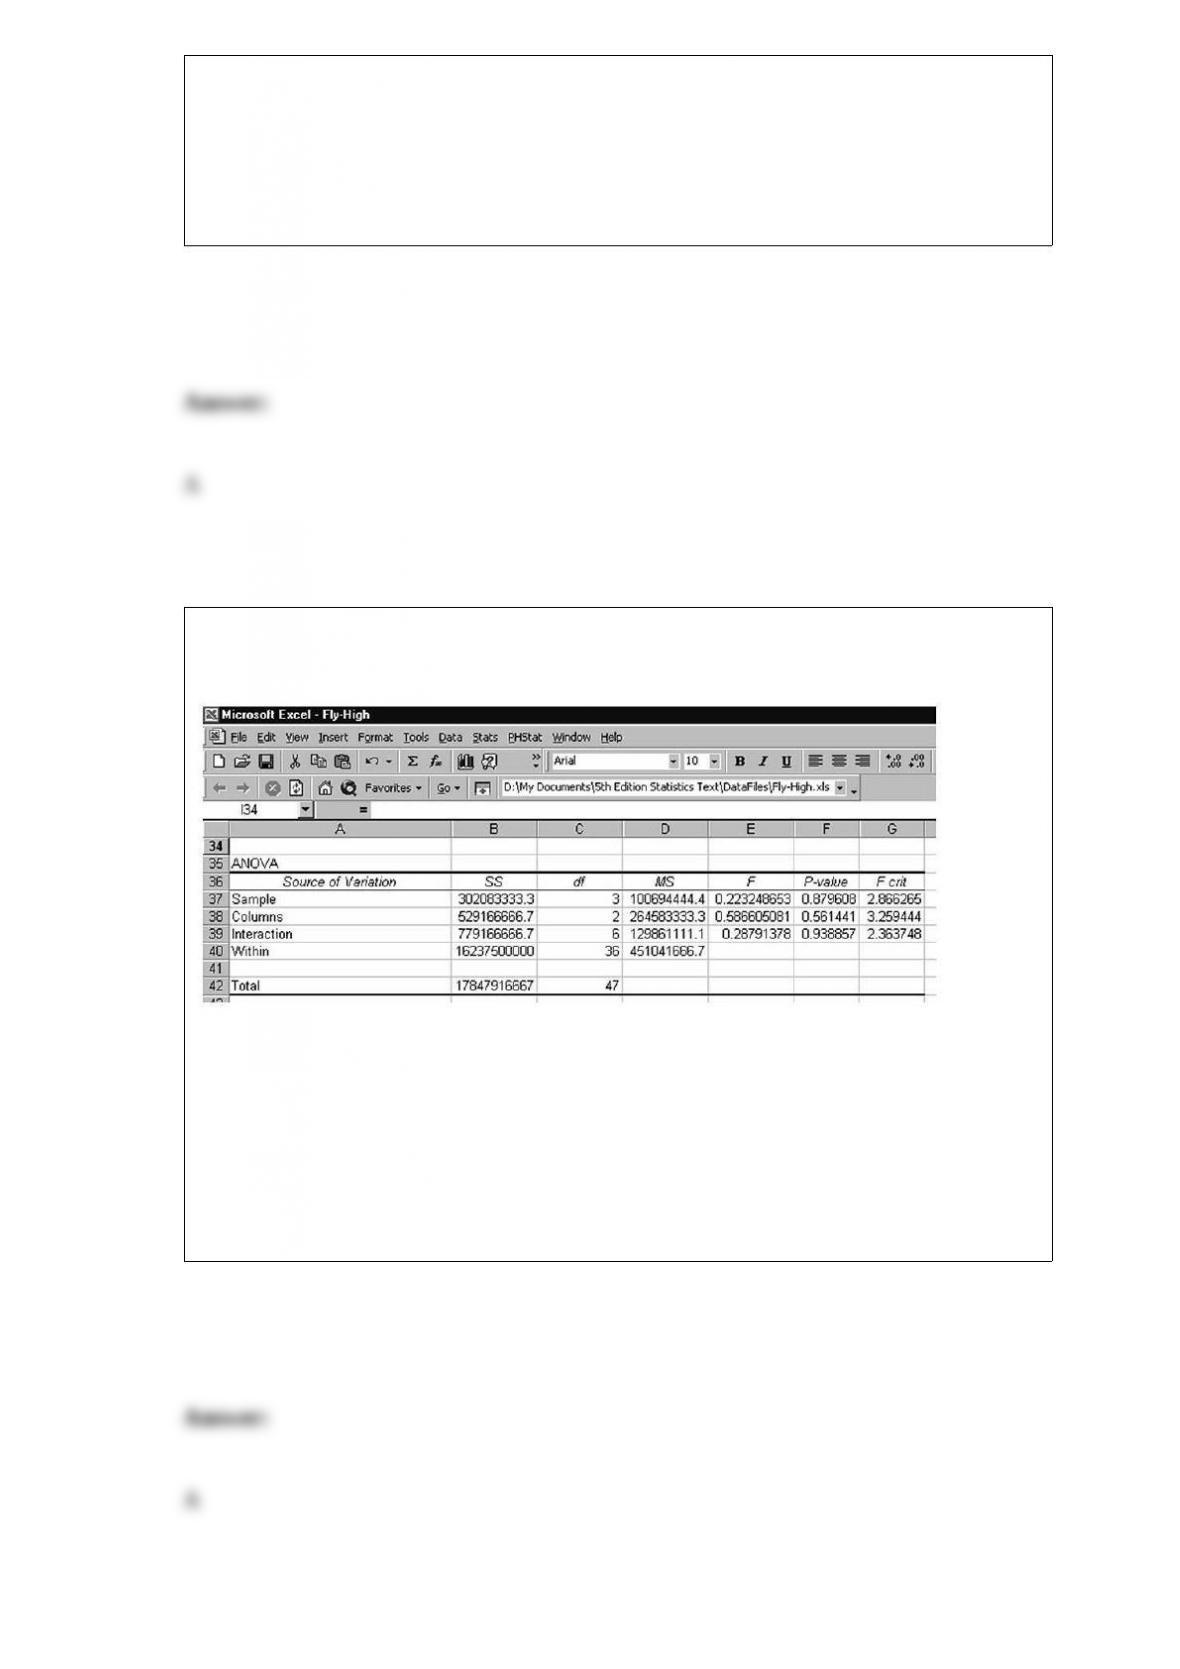
Considering the following printout for a two-factor ANOVA design, which of the
following is a proper conclusion to reach?
A) There is no significant interaction between the two factors.
B) The levels of factor A (Sample) have significantly different means.
C) The levels of factor B (Columns) have significantly different means.
D) The total number of observations is 47.
Many Walmart stores have automotive departments where customers can buy tires,
have their vehicles serviced, and obtain other automotive services. Recently, the
manager at an Ohio Walmart collected data on the time customers had to wait to get the
desired automotive service. Of the 500 cars in the sample, the shortest time any
customer spent waiting was 3 minutes and the longest time was 183 minutes. Assuming
that the manager wishes to develop a frequency distribution with 9 classes, which of the
following would be an appropriate class width for each class?
A) 10.50
B) 19.99
C) 20.00
D) 3 to 23
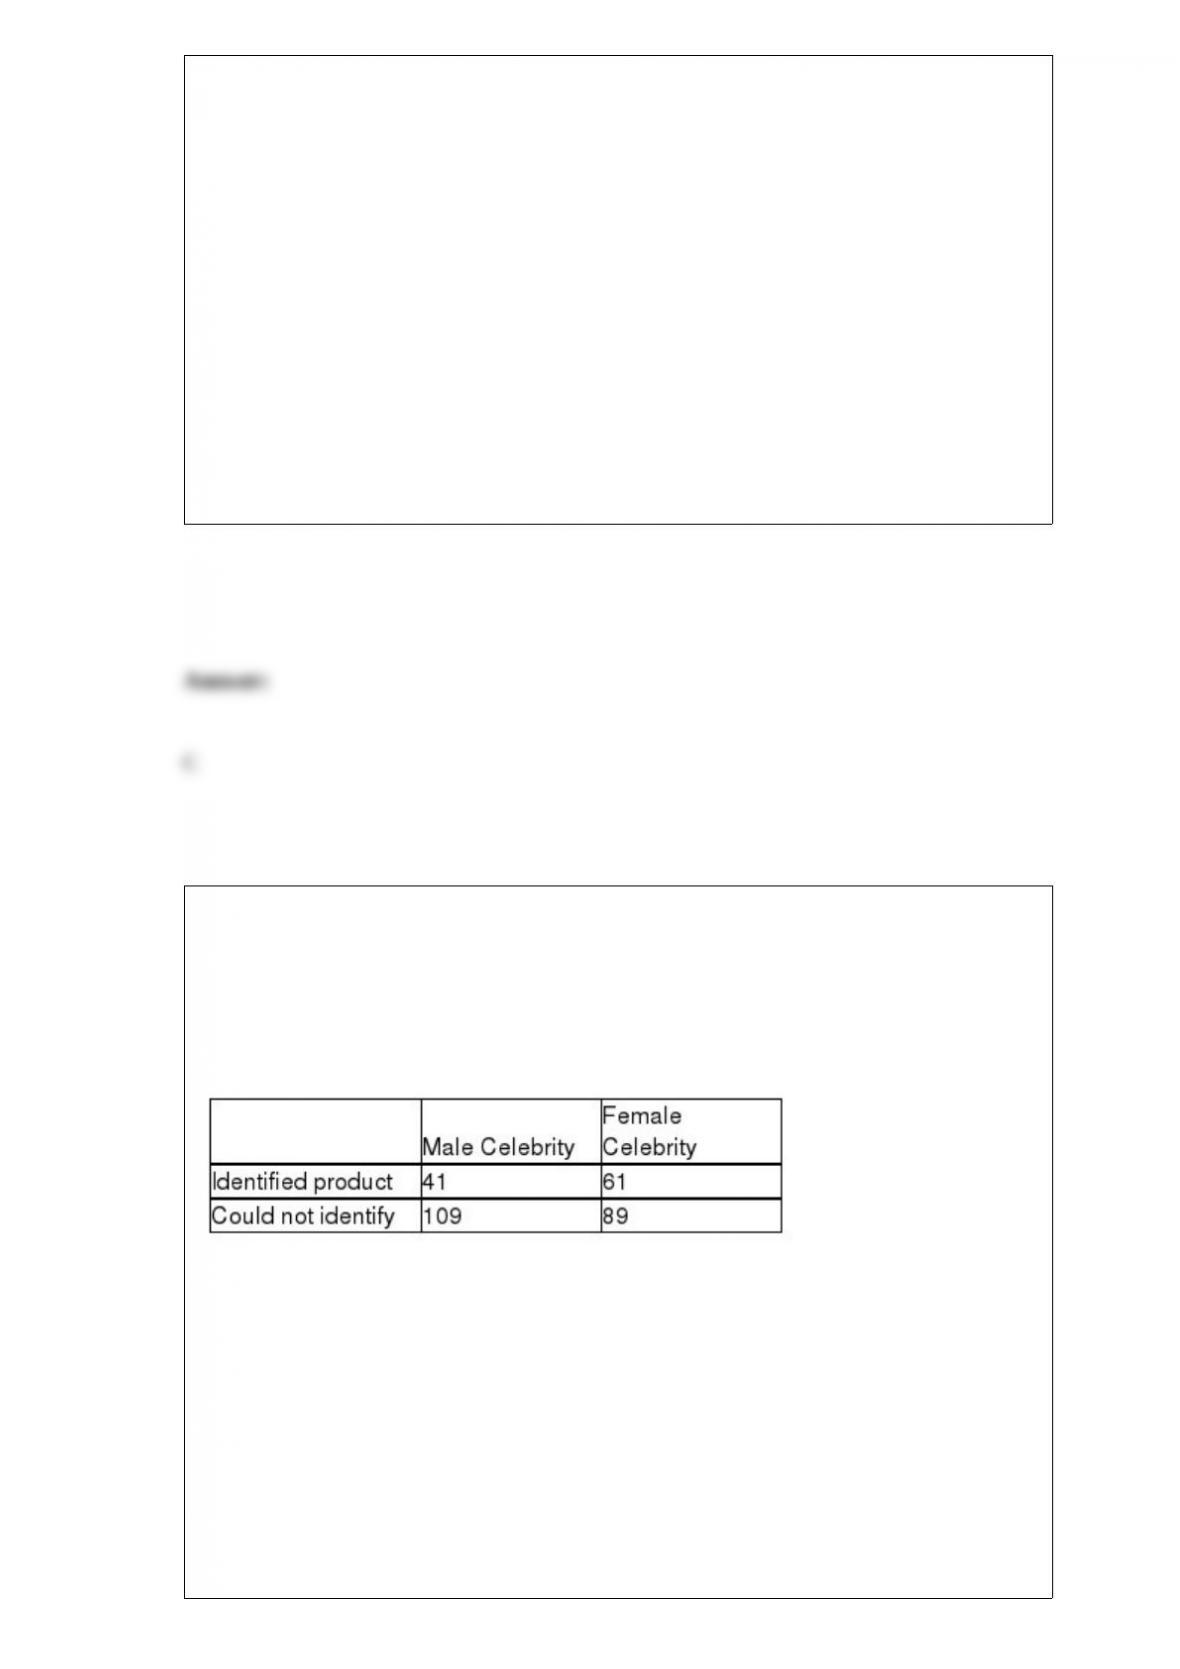
Many companies use well-known celebrities as spokespeople in their TV
advertisements. A study was conducted to determine whether brand awareness of
female TV viewers and the gender of the spokesperson are independent. Each in a
sample of 300 female TV viewers was asked to identify a product advertised by a
celebrity spokesperson. The gender of the spokesperson and whether or not the viewer
could identify the product was recorded. The numbers in each category are given below.
Referring to these sample data, which test would be used to properly analyze the data in
this experiment?
A) x2 test for independence in a two-way contingency table
B) x2 test for equal proportions in a one-way table
C) ANOVA F-test for main treatment effect
D) x2 goodness-of-fit test

Nationwide Mutual Insurance, based in Columbus, Ohio, is one of the largest
diversified insurance and financial services organizations in the world, with more than
$157 billion in assets. Nationwide ranked 108th on the Fortune 100 list in 2008. The
company provides a full range of insurance and financial services. In a recent news
release Nationwide reported the results of a new survey of 1,097 identity theft victims.
The survey shows victims spend an average of 81 hours trying to resolve their cases. If
the true average time spent was 81 hours, determine the probability that a test of
hypothesis designed to test that the average was less than 85 hours would reject the
research hypothesis. Use α= 0.05 and a standard deviation of 50.
A) 0.0123
B) 0.5182
C) 0.1241
D) 0.1587
A consumer group plans to test whether a new passenger car that is advertised to have a
mean highway miles per gallon of at least 33 actually meets this level. They plan to test
the hypothesis using a significance level of 0.05 and a sample size of n = 100 cars. It is
believed that the population standard deviation is 3 mpg. Based upon this information,
if the “true” population mean is 32.0 mpg, what is the probability that the test will lead
the consumer group to reject the claimed mileage for this car?
A) About 0.075
B) Approximately 0.95

C) 0.05
D) None of the above
For the normal distribution with parameters μ = 5, σ = 4; calculate P(0 < x < 8).
A) 0.8841
B) 0.8812
C) 0.4215
D) 0.6678
In a regression analysis situation, the standard error of the slope is:
A) a measure of the variation in the regression slope from sample to sample.
B) equal to the square root of the standard error of the estimate.
C) a measure of the amount of change in y that will occur for a one-unit change in x.
D) All of the above
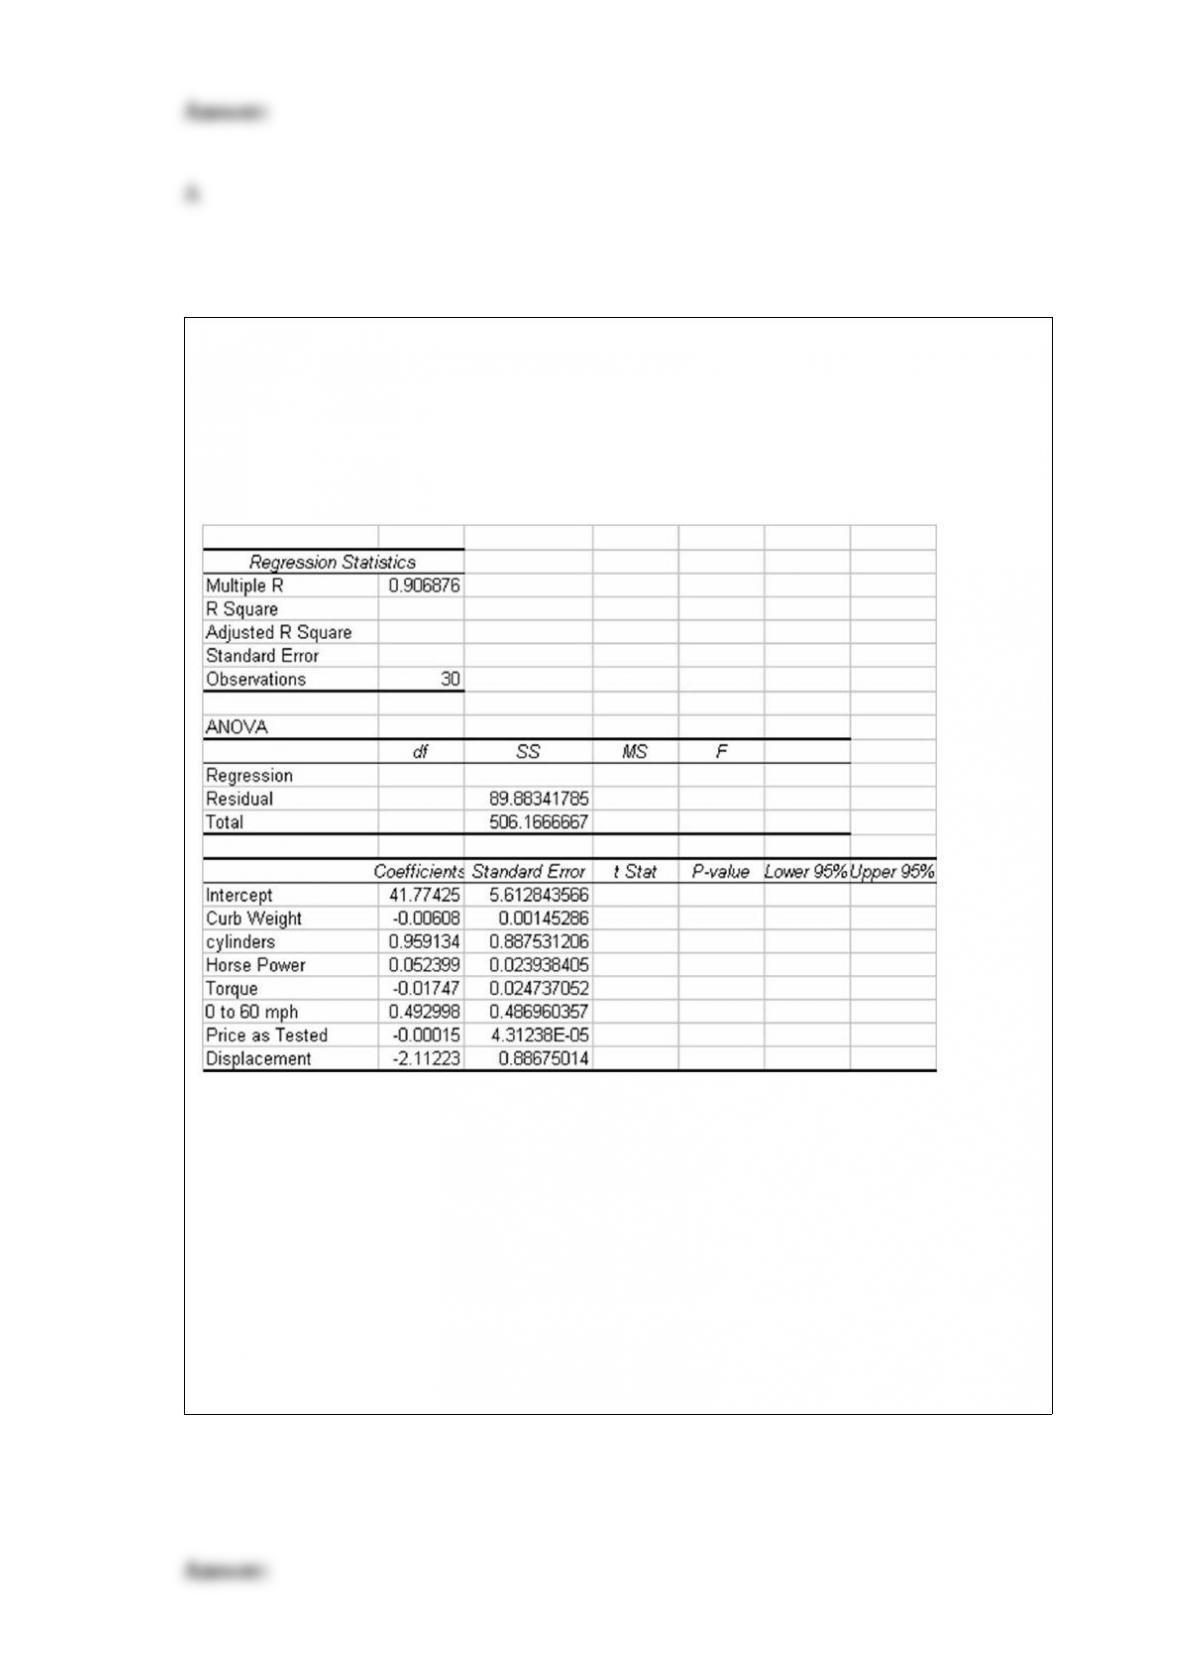
The editors of a national automotive magazine recently studied 30 different automobiles
sold in the United States with the intent of seeing whether they could develop a multiple
regression model to explain the variation in highway miles per gallon. A number of
different independent variables were collected. The following regression output (with
some values missing) was recently presented to the editors by the magazine’s analysts:
Based on this output and your understanding of multiple regression analysis, what is the
adjusted R-square value for this model?
A) About 0.82
B) Approximately 0.90
C) Just under 0.48
D) None of the above