
A commuter travels many miles to work each morning. She has timed this trip 5 times
during the last month. The time (in minutes) required to make this trip was 38, 33, 36,
47, and 41. What is the standard deviation for this sample data?
a) 28.5
b) 11
c) 22.8
d) 5.34
e) 4.77
Twenty five individuals are randomly selected out of 100 shoppers leaving a local
bedding store. Each shopper was asked if they made a purchase during their visit. Each
of the shoppers has the same probability of answering “yes’ to having made a purchase.
The probability that exactly four of the twenty-five shoppers made a purchase could
best be found by _______.
a) using the normal distribution
b) using the binomial distribution
c) using the Poisson distribution
d) using the exponential distribution
e) using the uniform distribution
According to Chebyshev’s Theorem how many values in a data set will be within 3
standard deviations of the mean?
a) At least 75%
b) At least 68%
c) At least 95%
d) At least 89%
e) At least 99%
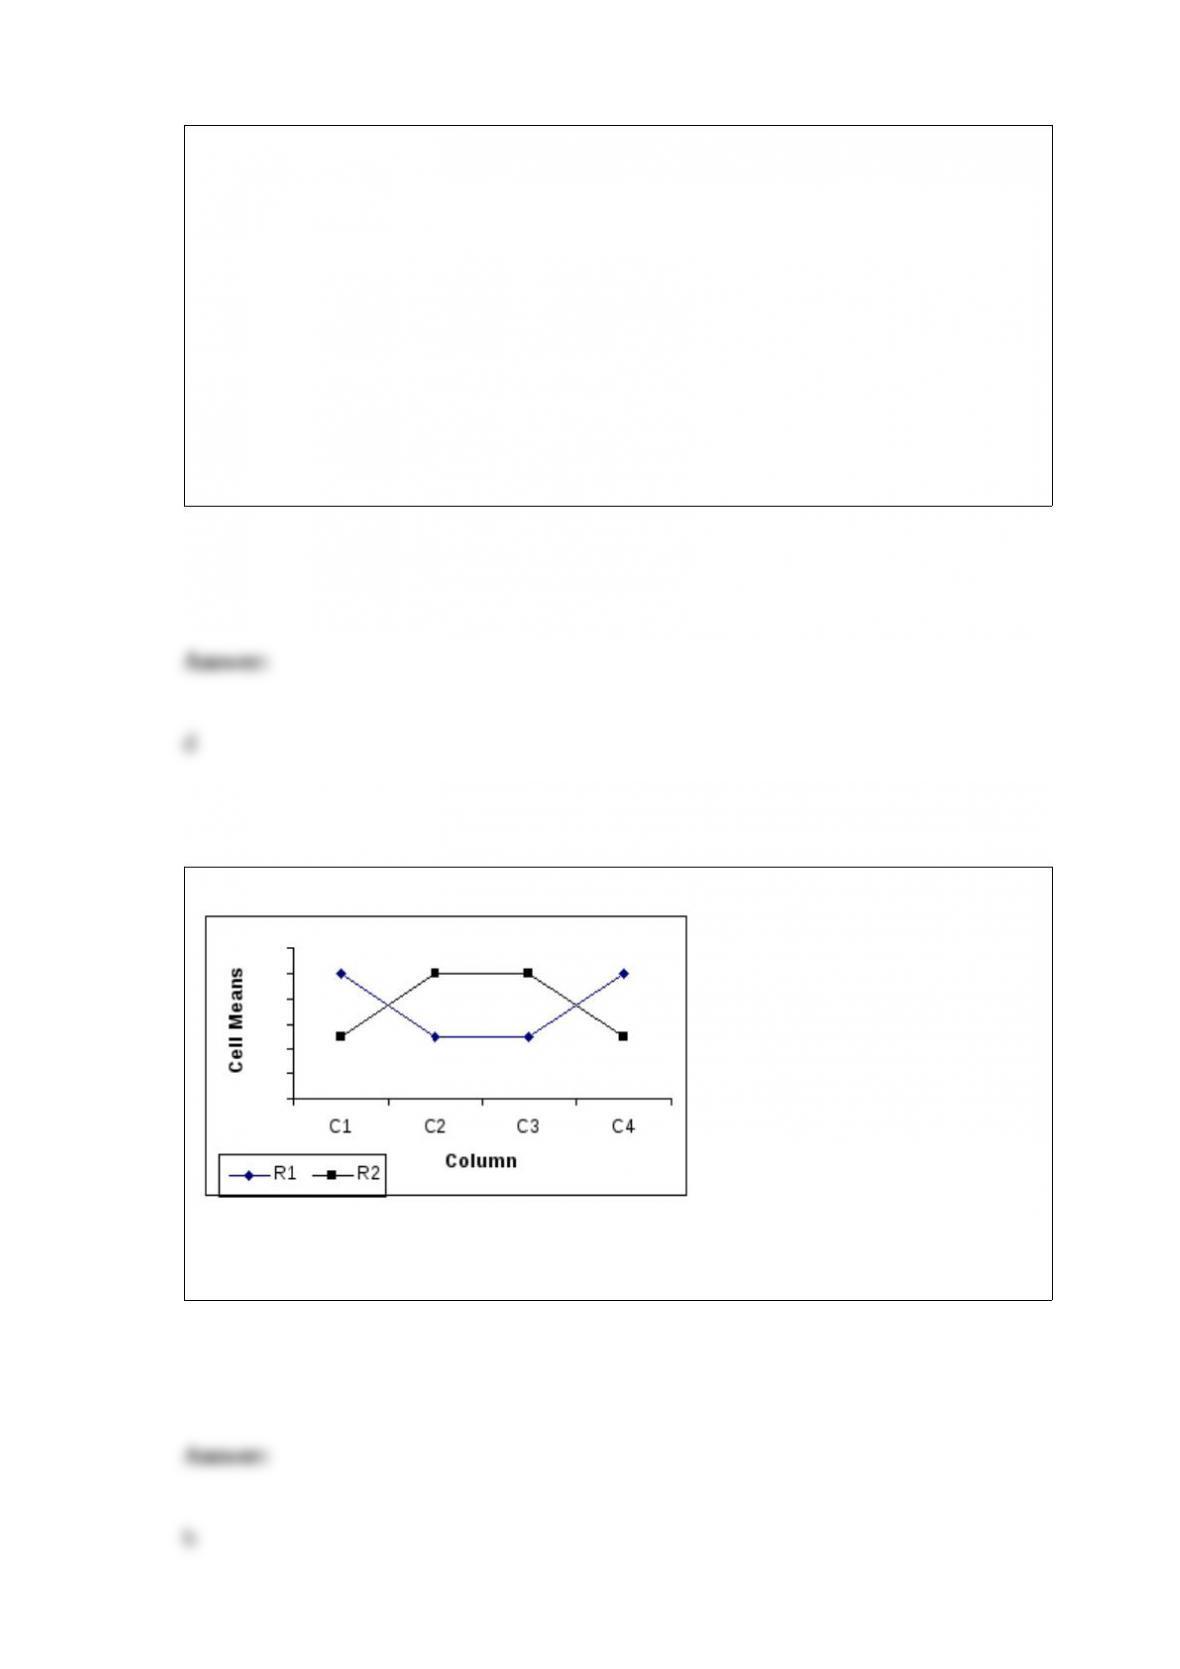
The following graph indicates a _______________.
a) 2 3 factorial design with
interaction
b) 2 4 factorial design
with interaction
c) 4 2 factorial design with
interaction
d) 4 2 factorial design
with no interaction
e) completely randomized design

What is the Spearman rank correlation coefficient for the following set of data?
a) -0.20
b) 1.00
c) 0.20
d) 0.80
e) -1.20
A market researcher believes that industry type is independent of the operating margin.
He compiles a table with seven industry classifications and classifies operating margin
into five levels. When applying a chi-square test of independence to this table, the
number of degrees of freedom is _____.
a) 24
b) 35
c) 12
d) 10
e) 11
Suppose a population has a mean of 870 and a variance of 8,100. If a random sample of
size 36 is drawn from the population, the probability that the sample mean is between
840 and 900 is _______.
a) 0.9544
b) 0.6826
c) 0.8185
d) 0.5899
e) 0.0897
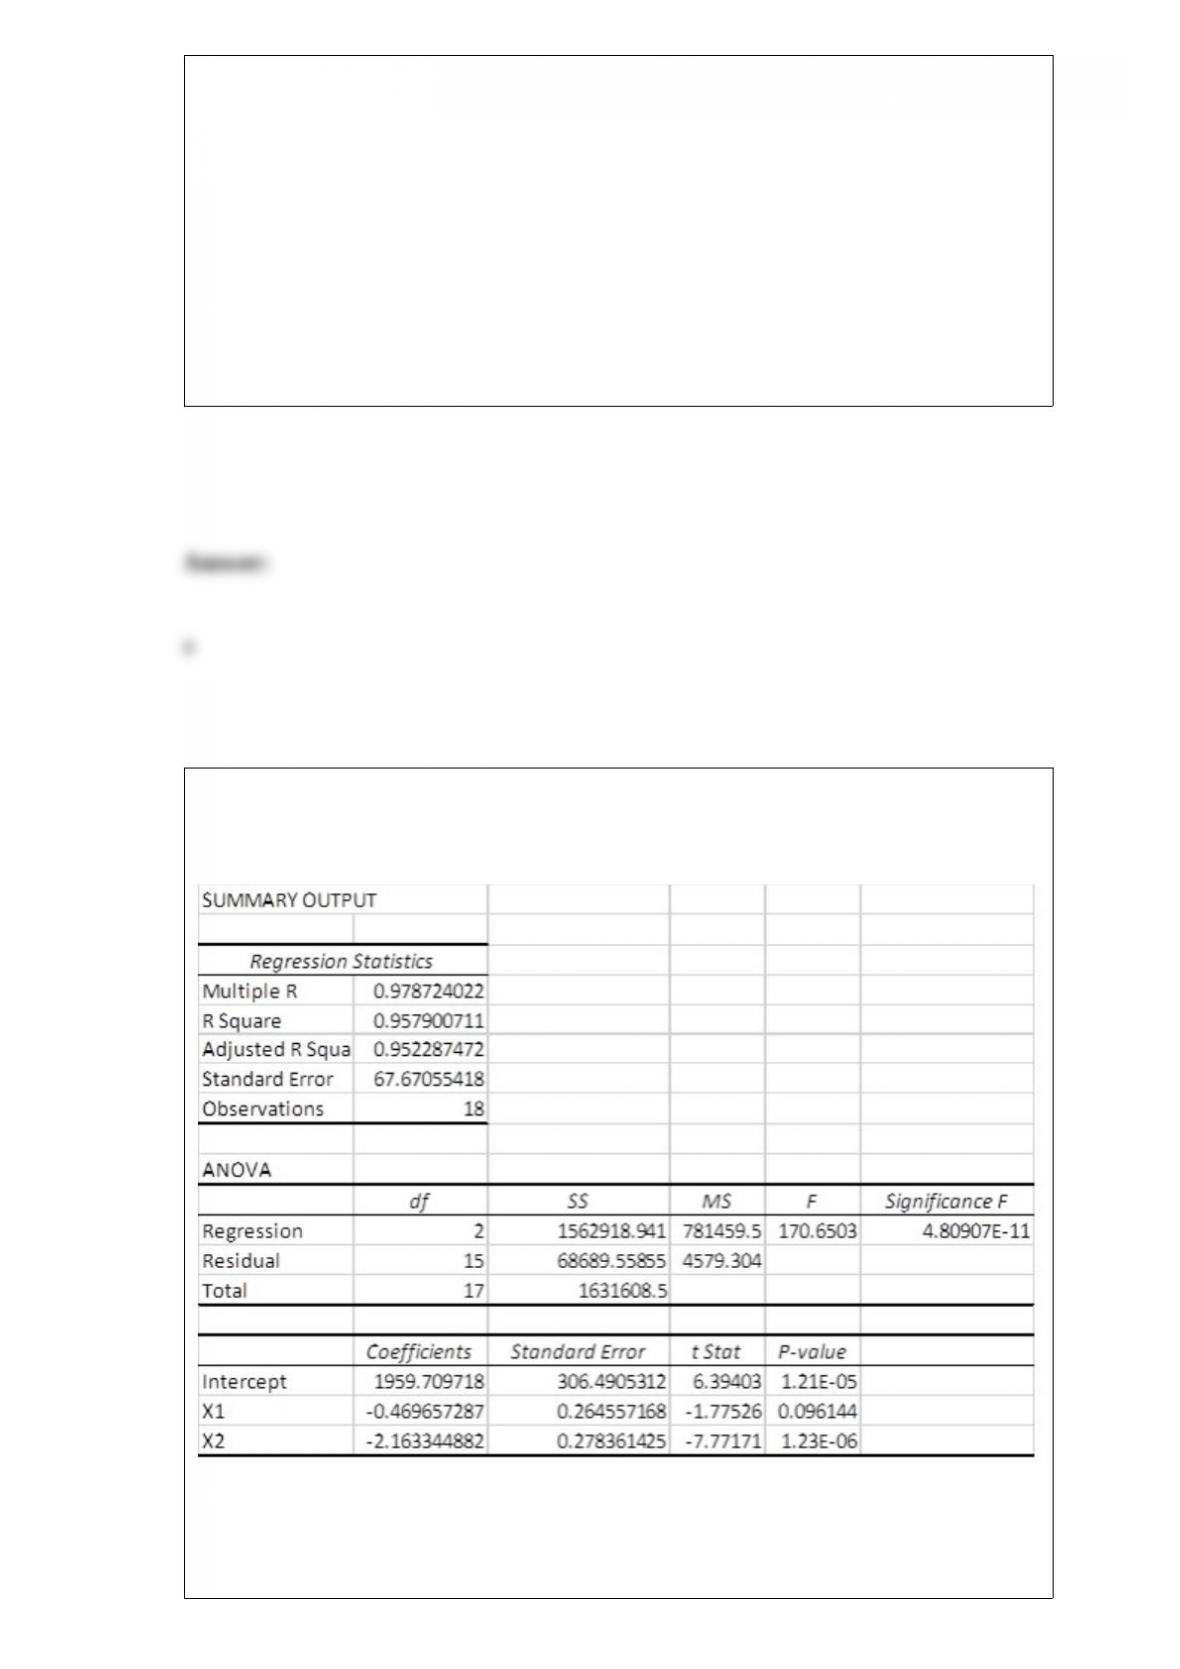
A multiple regression analysis produced the following tables.
These results indicate that ____________.
a) none of the predictor variables are significant at the 10% level
b) each predictor variable is significant at the 10% level
c) x1is significant at the 10% level
d) x2is significant at the 10% level
e) the intercept is not significant at 10% level
The number of phone calls arriving at a switchboard each hour has been recorded, and
the following frequency distribution has been developed.
What is the relative frequency of the second class?
a) 0.455
b) 0.900
c) 0.225
d) 0.750
e) 0.725
The following ANOVA table is from a multiple regression analysis with n = 35 and four
independent variables.
The number of degrees of freedom for error is __________.
a) 1
b) 4
c) 34
d) 30
e) 35
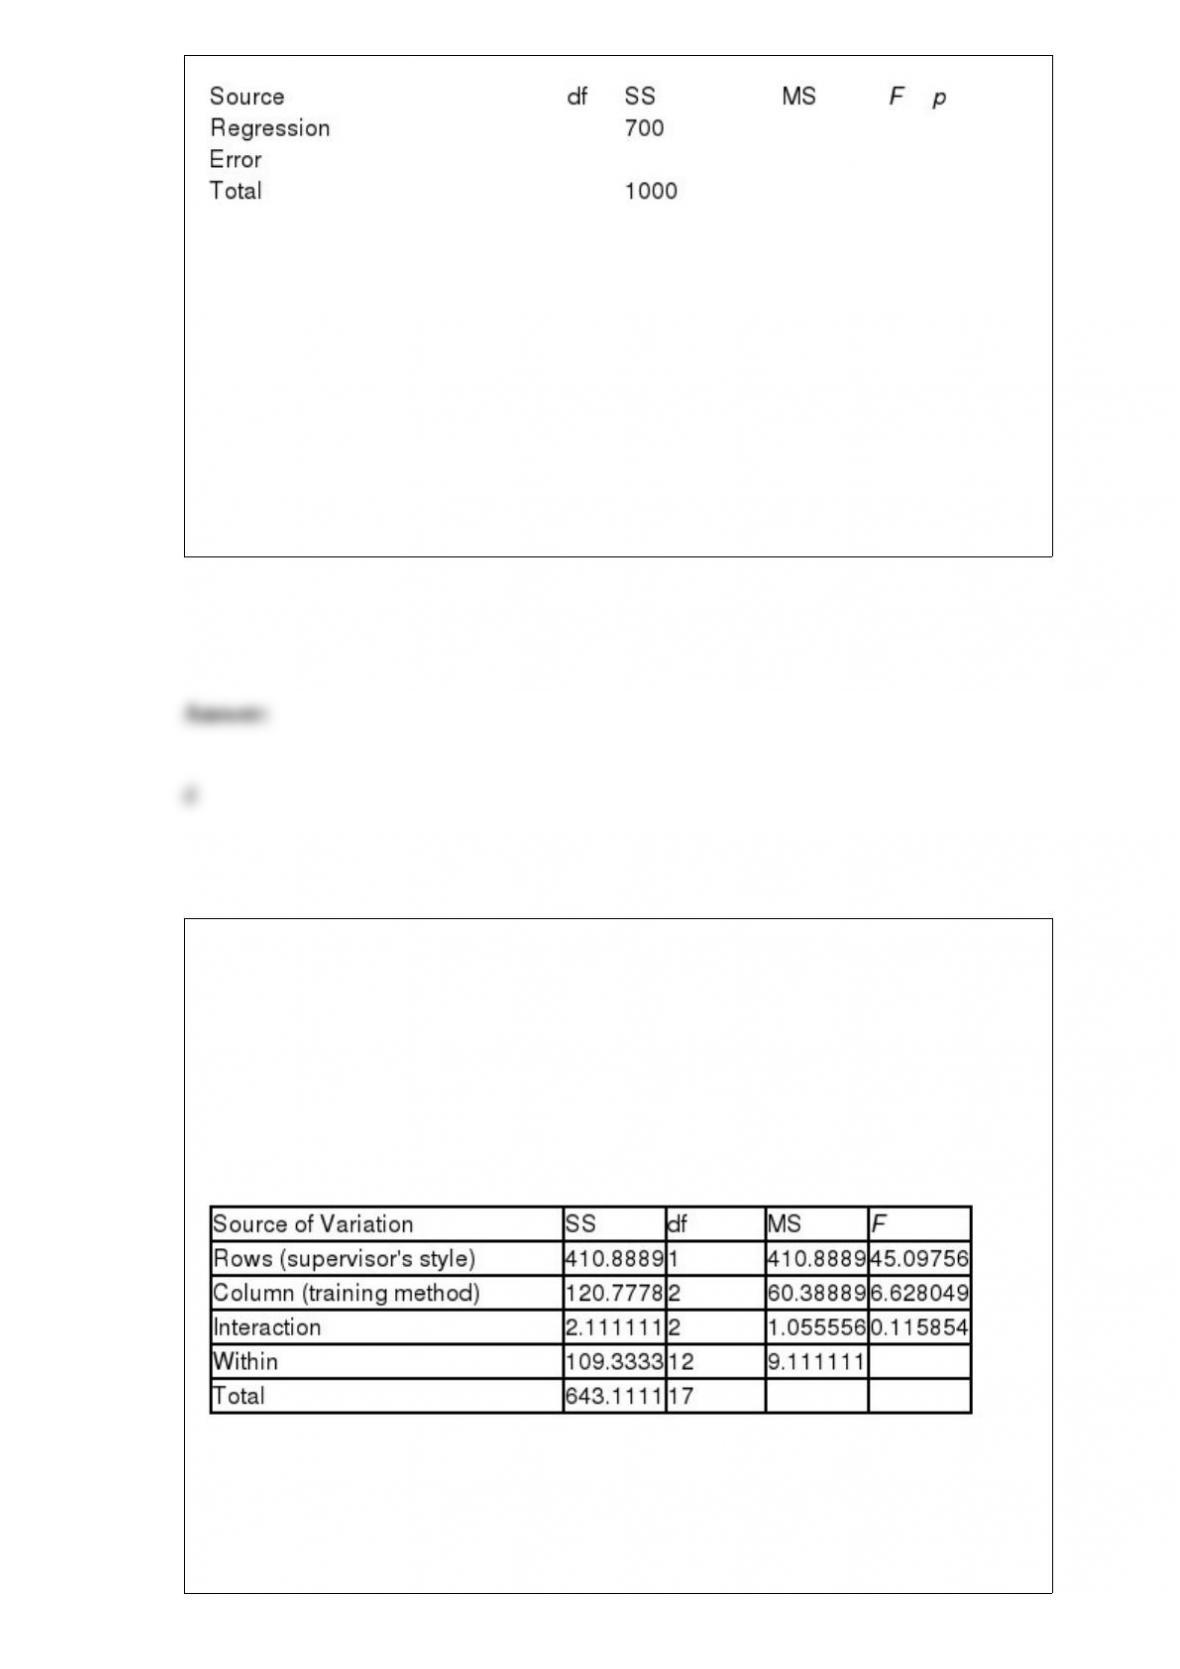
While reviewing staffing plans for a new pilot plant, Colin Chenaux, VP of Operations
at Clovis Chemicals, Inc., designed an experiment to test the effects of “supervisor’s
style” and “training method” on the productivity of operators. The treatment levels
were: (1) authoritarian, and participatory for supervisor’s style, and (2) technical
manuals, training films, and multimedia for training method. Three qualified applicants
were randomly selected and assigned to each of the six cells. Analysis of Colin’s data
produced the following ANOVA table.
Using
= .05, the appropriate decision for “training method” effects is _____________.
a) reject the null hypothesis
1
3
b) reject the null hypothesis
1
2
3
c) do not reject the null hypothesis
1
2

d) do not reject the null hypothesis
1
2
e) do nothing
Brian Vanecek, VP of Operations at Portland Trust Bank, is evaluating the service level
provided to walk-in customers. Accordingly, his staff recorded the waiting times for 45
randomly selected walk-in customers, and calculated that their mean waiting time was
15 minutes. If Brian concludes that the average waiting time for all walk-in customers
is 15 minutes, he is using a ________.
a) a range estimate
b) a statistical parameter
c) an interval estimate
d) a point estimate
e) an exact estimate
BigShots, Inc. is a specialty e-tailer that operates 87 catalog Web sites on the Internet.
Kevin Conn, Sales Director, feels that the style (color scheme, graphics, fonts, etc.) of a
Web site may affect its sales. He chooses three levels of design style (neon, old world
and sophisticated) and randomly assigns six catalog Web sites to each design style.
Analysis of Kevin’s data yielded the following ANOVA table.
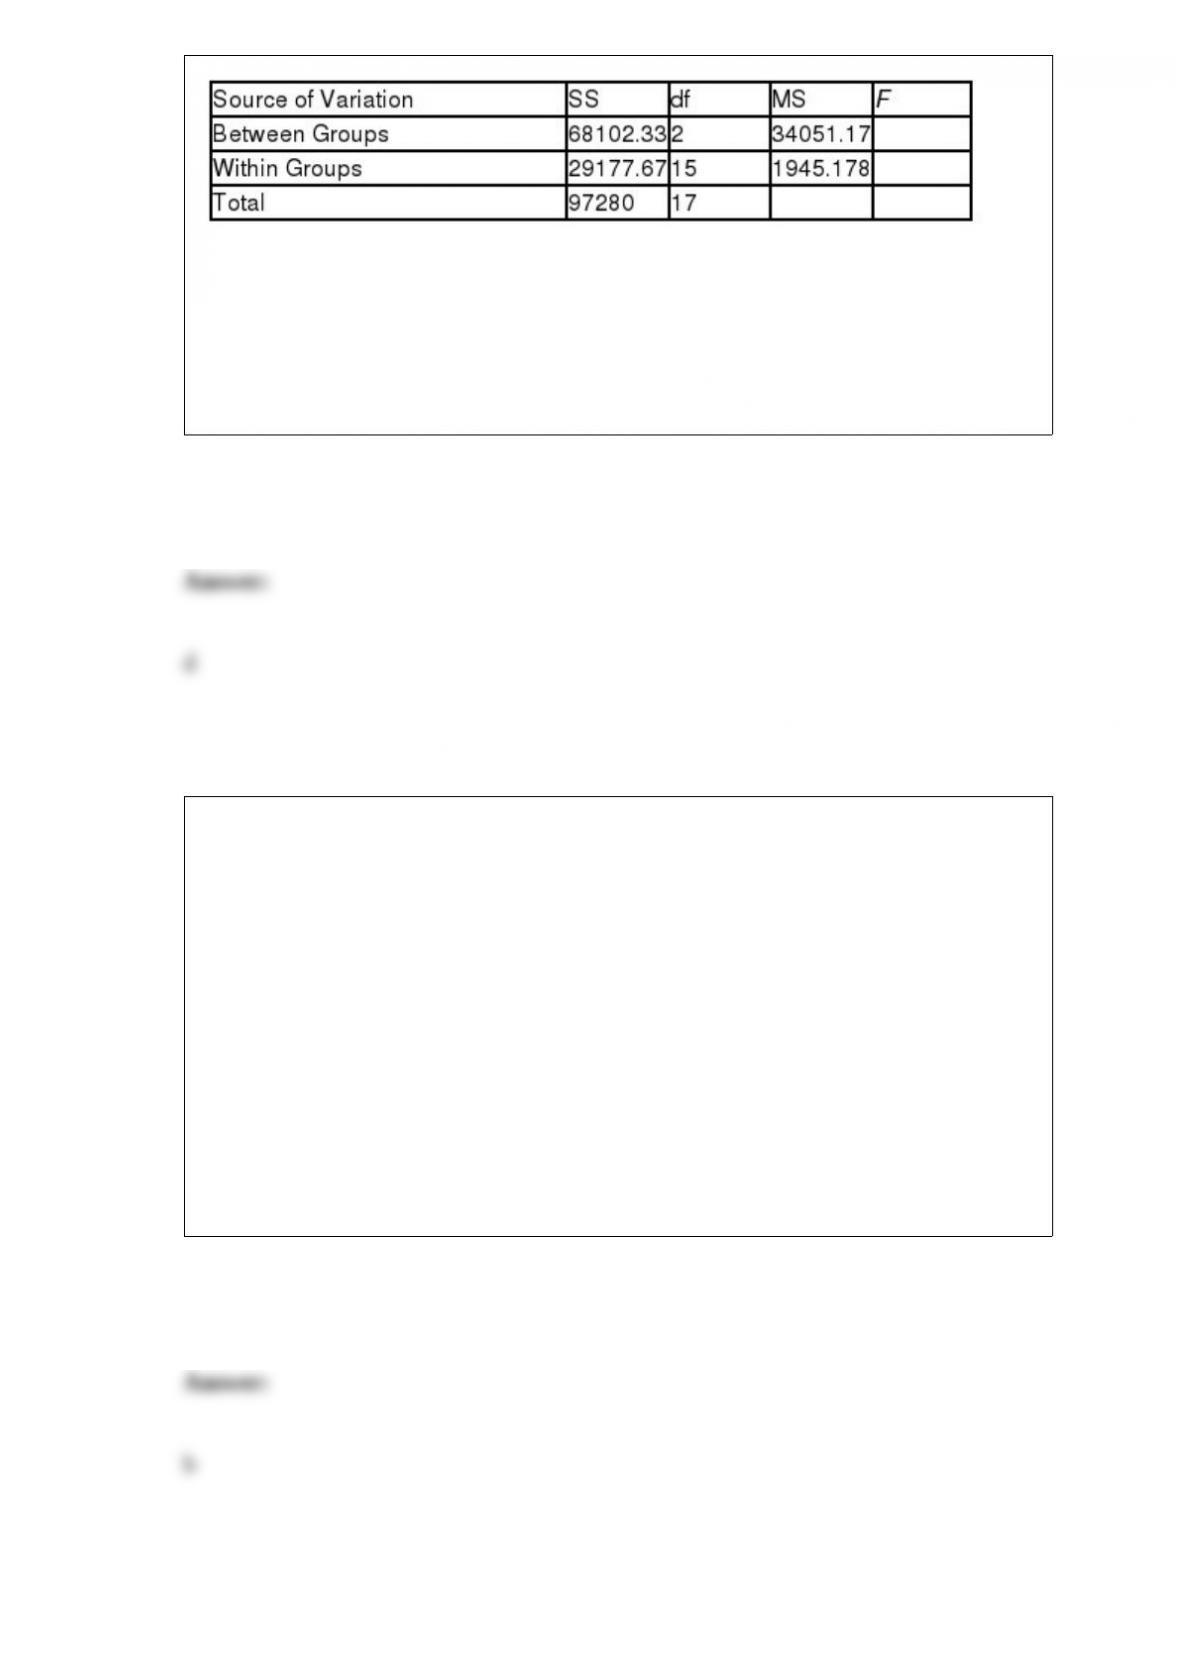
Using
= 0.05, the observed F value is _____________.
a) 0.5022
b) 0.1333
c) 1.9911
d) 17.5100
e) 22.4567
The weights of aluminum castings produced by a process are normally distributed. A
random sample of 5 castings is selected; the sample mean weight is 2.21 pounds; and
the sample standard deviation is 0.12 pound. The 98% confidence interval for the
population mean casting weight is _________.
a) 1.76 to 2.66
b) 2.00 to 2.41
c) 2.08 to 2.34
d) 1.93 to 2.49
e) 2.49 to 2.67
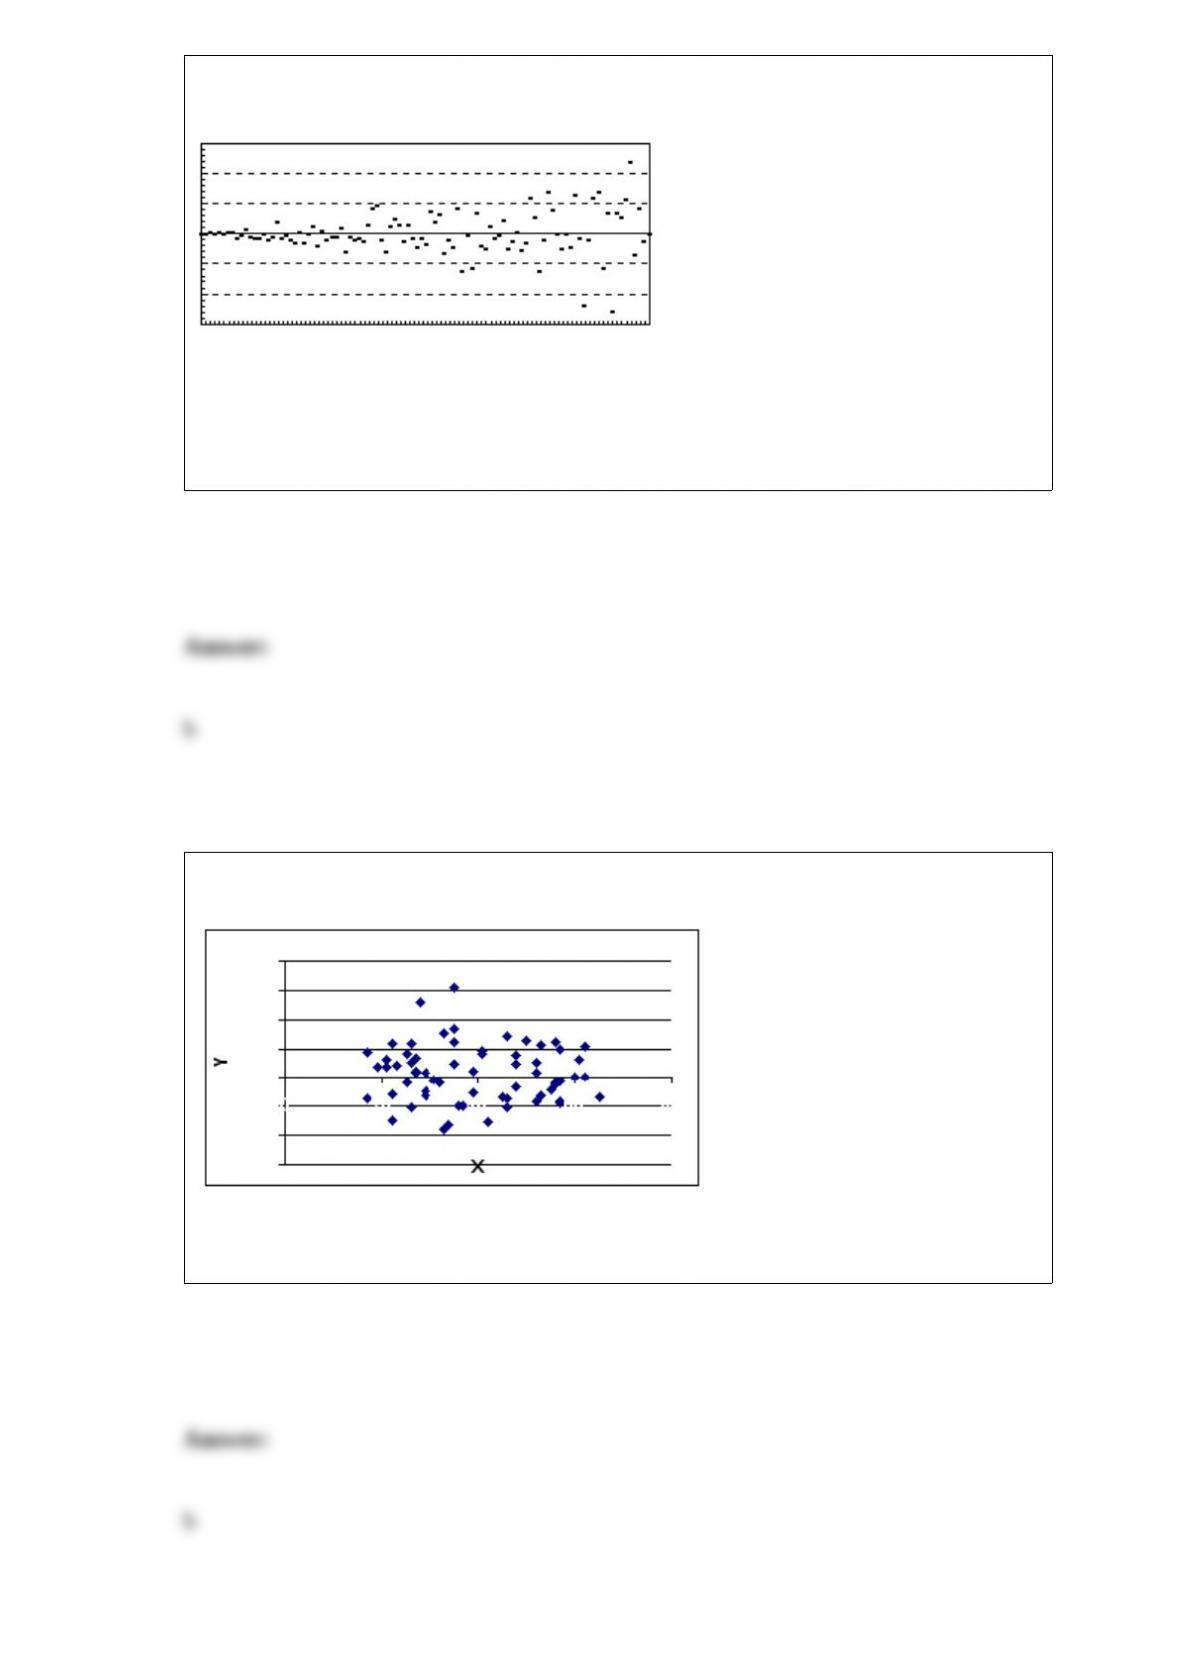
The following residuals plot indicates _______________.
a) a nonlinear relation
b) a nonconstant error variance
c) the simple regression assumptions are met
d) the sample is biased
e) the sample is random
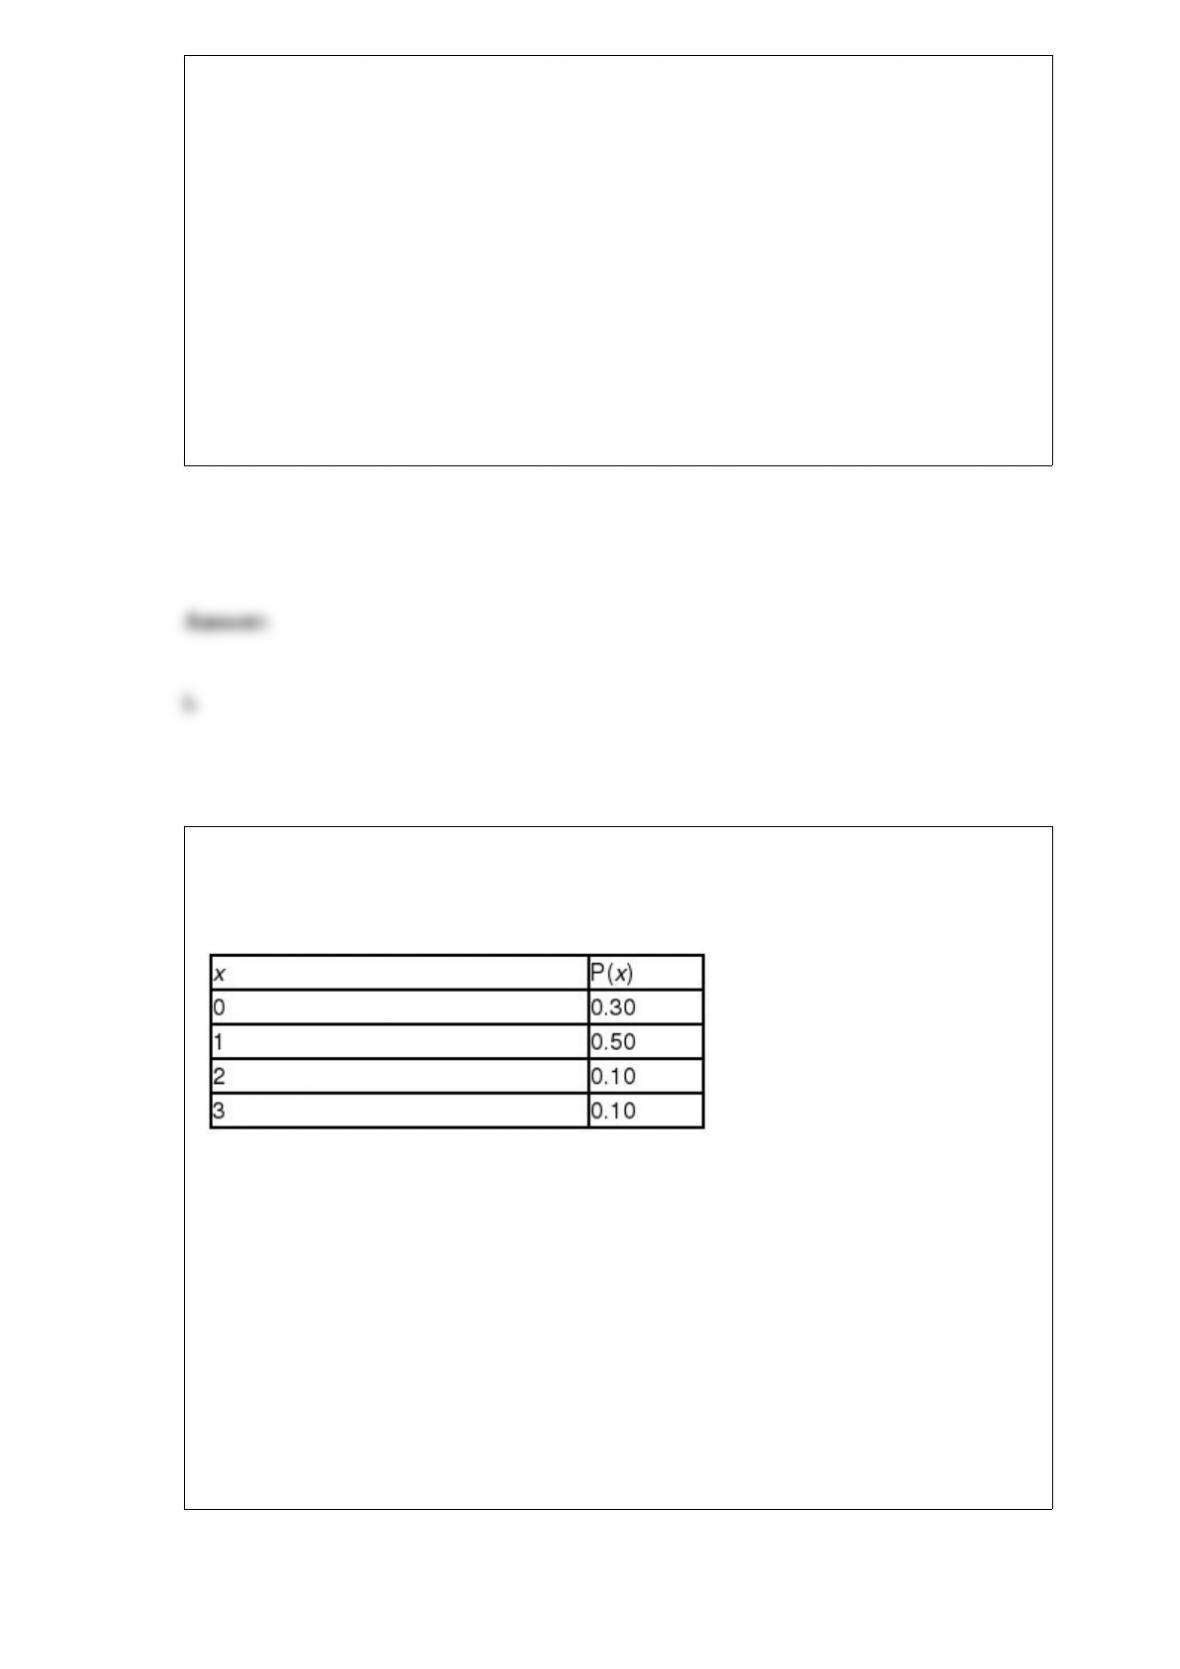
From the following scatter plot, we can say that between y and x there is _______.
a) perfect positive
correlation
b) virtually no
correlation
c) positive correlation
d) negative correlation
e) perfect negative correlation
A researcher wants to estimate the proportion of the population which possesses a given
characteristic. A random sample of size 800 is taken resulting in 360 items which
possess the characteristic. The point estimate for this population proportion is _______.
a) 0.55
b) 0.45
c) 0.35
d) 0.65
e) 0.70
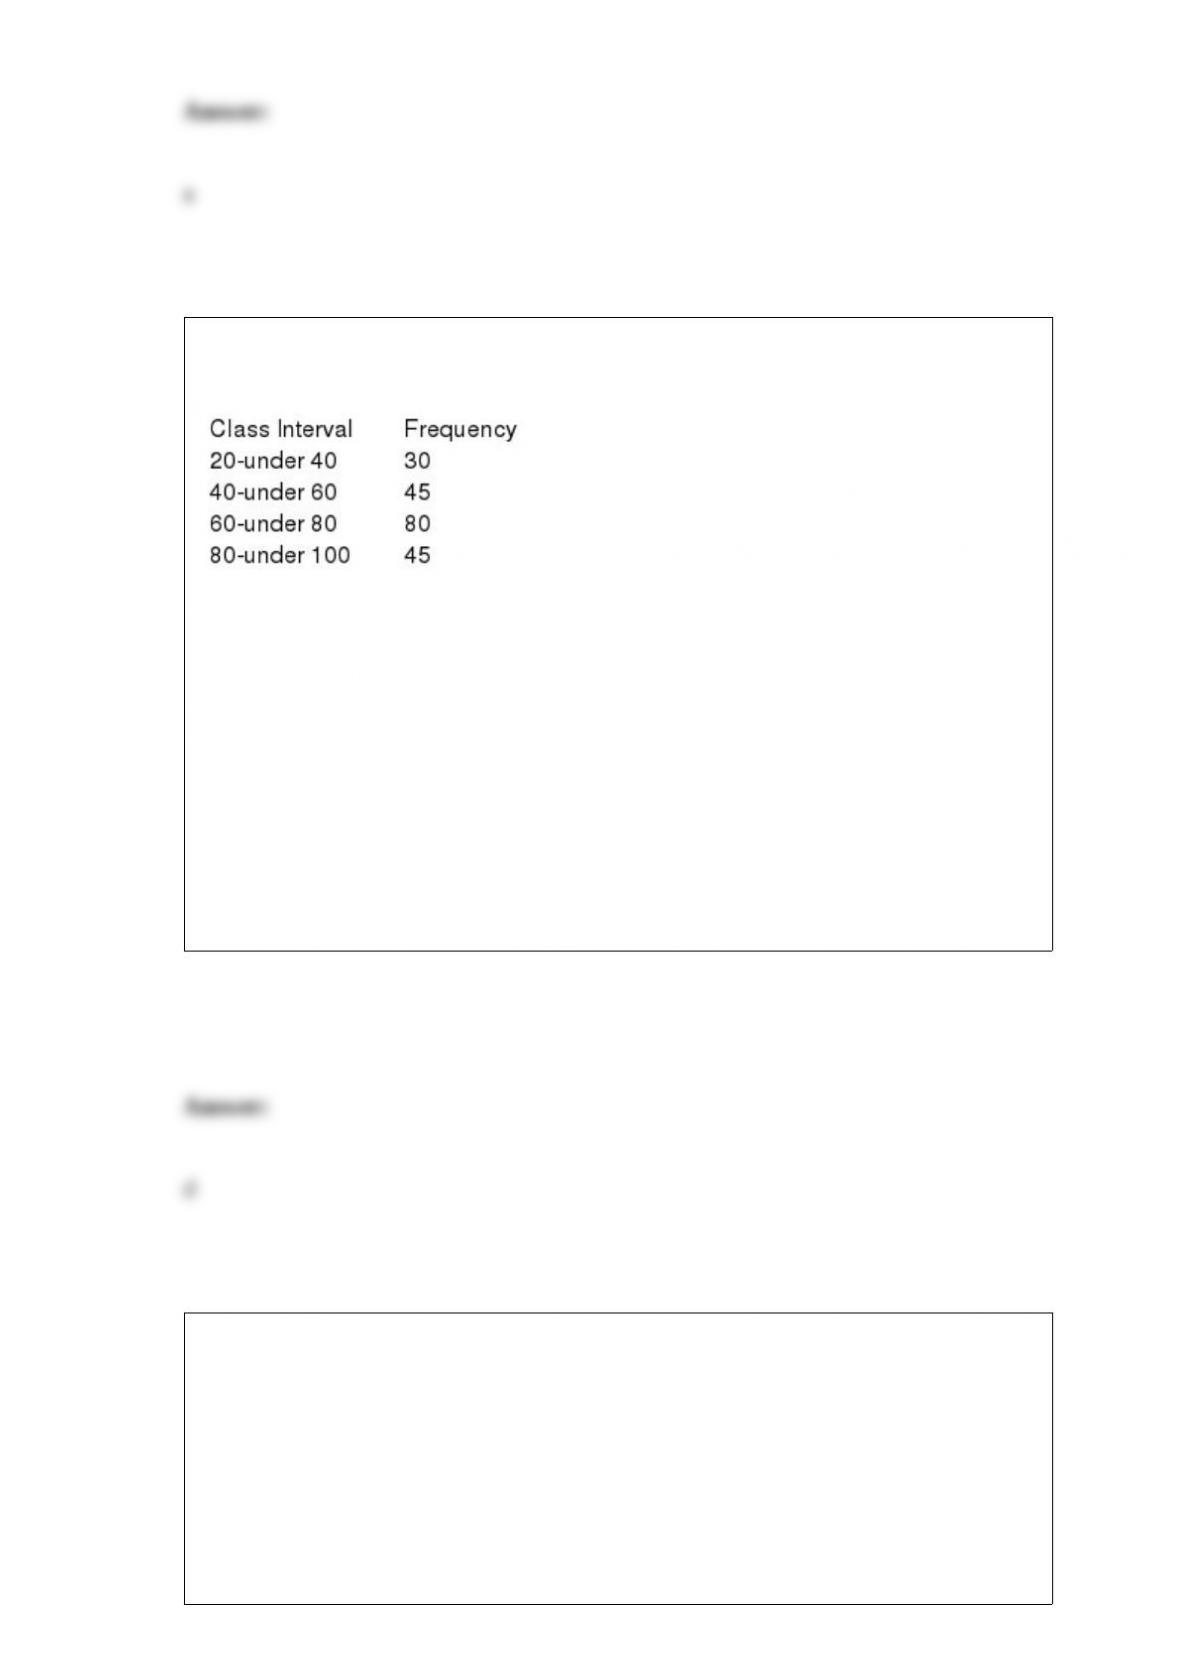
A market research team compiled the following discrete probability distribution for
families residing in Randolph County. In this distribution, x represents the number of
evenings the family dines outside their home during a week.
The mean (average) value of x is _______________.
a) 1.0
b) 1.5
c) 2.0
d) 2.5
e) 3.0
The number of phone calls arriving at a switchboard each hour has been recorded, and
the following frequency distribution has been developed.
What is the midpoint of the last class?
a) 80
b) 100
c) 95
d) 90
e) 85
On Saturdays, cars arrive at David Zebda’s Scrub and Shine Car Wash at the rate of 80
cars per hour during the ten-hour shift. David wants a sample of 40 Saturday customers
to answer the long version of his quality service questionnaire. He randomly selects 9 as
a starting point and instructs the crew to select the 9th customer and each customer at
intervals of 20 (9, 29, 49, etc.). His sample is a __________.
a) convenience sample
b) simple random sample
c) unsystematic sample
d) stratified sample
e) systematic sample
The number of phone calls arriving at a switchboard each hour has been recorded, and
the following frequency distribution has been developed.
What is the cumulative frequency of the third class?
a) 80
b) 0.40
c) 155
d) 75
e) 105

Cindy Ho, VP of Finance at Discrete Components, Inc. (DCI), theorizes that the
discount level offered to credit customers affects the average collection period on credit
sales. Accordingly, she has designed an experiment to test her theory using four sales
discount rates (0%, 2%, 4%, and 6%). Cindy wants to control for the size of the
customer but not to test for it as the main variable of interest so she classified DCI’s
credit customers into three categories by total assets (small, medium, and large). Then,
she randomly assigned four customers from each category to a sales discount rate. In
Cindy’s experiment “total asset size of credit customer” is ________.
a) a surrogate variable
b) the dependent variable
c) a blocking variable
d) a treatment variable
e) a constant
The empirical rule says that approximately what percentage of the values would be
within 2 standard deviations of the mean in a bell shaped set of data?
a) 95%
b) 68%
c) 50%
d) 97.7%
e) 100%
Suppose 5% of the population have a certain disease. A laboratory blood test gives a
positive reading for 95% of people who have the disease and 10% positive reading of
people who do not have the disease. . What is the probability that a randomly selected
person has the disease given that this person is testing positive?
a) 0.0475
b) 0.1425
c) 0.95
d) 0.9
e) 0.3333
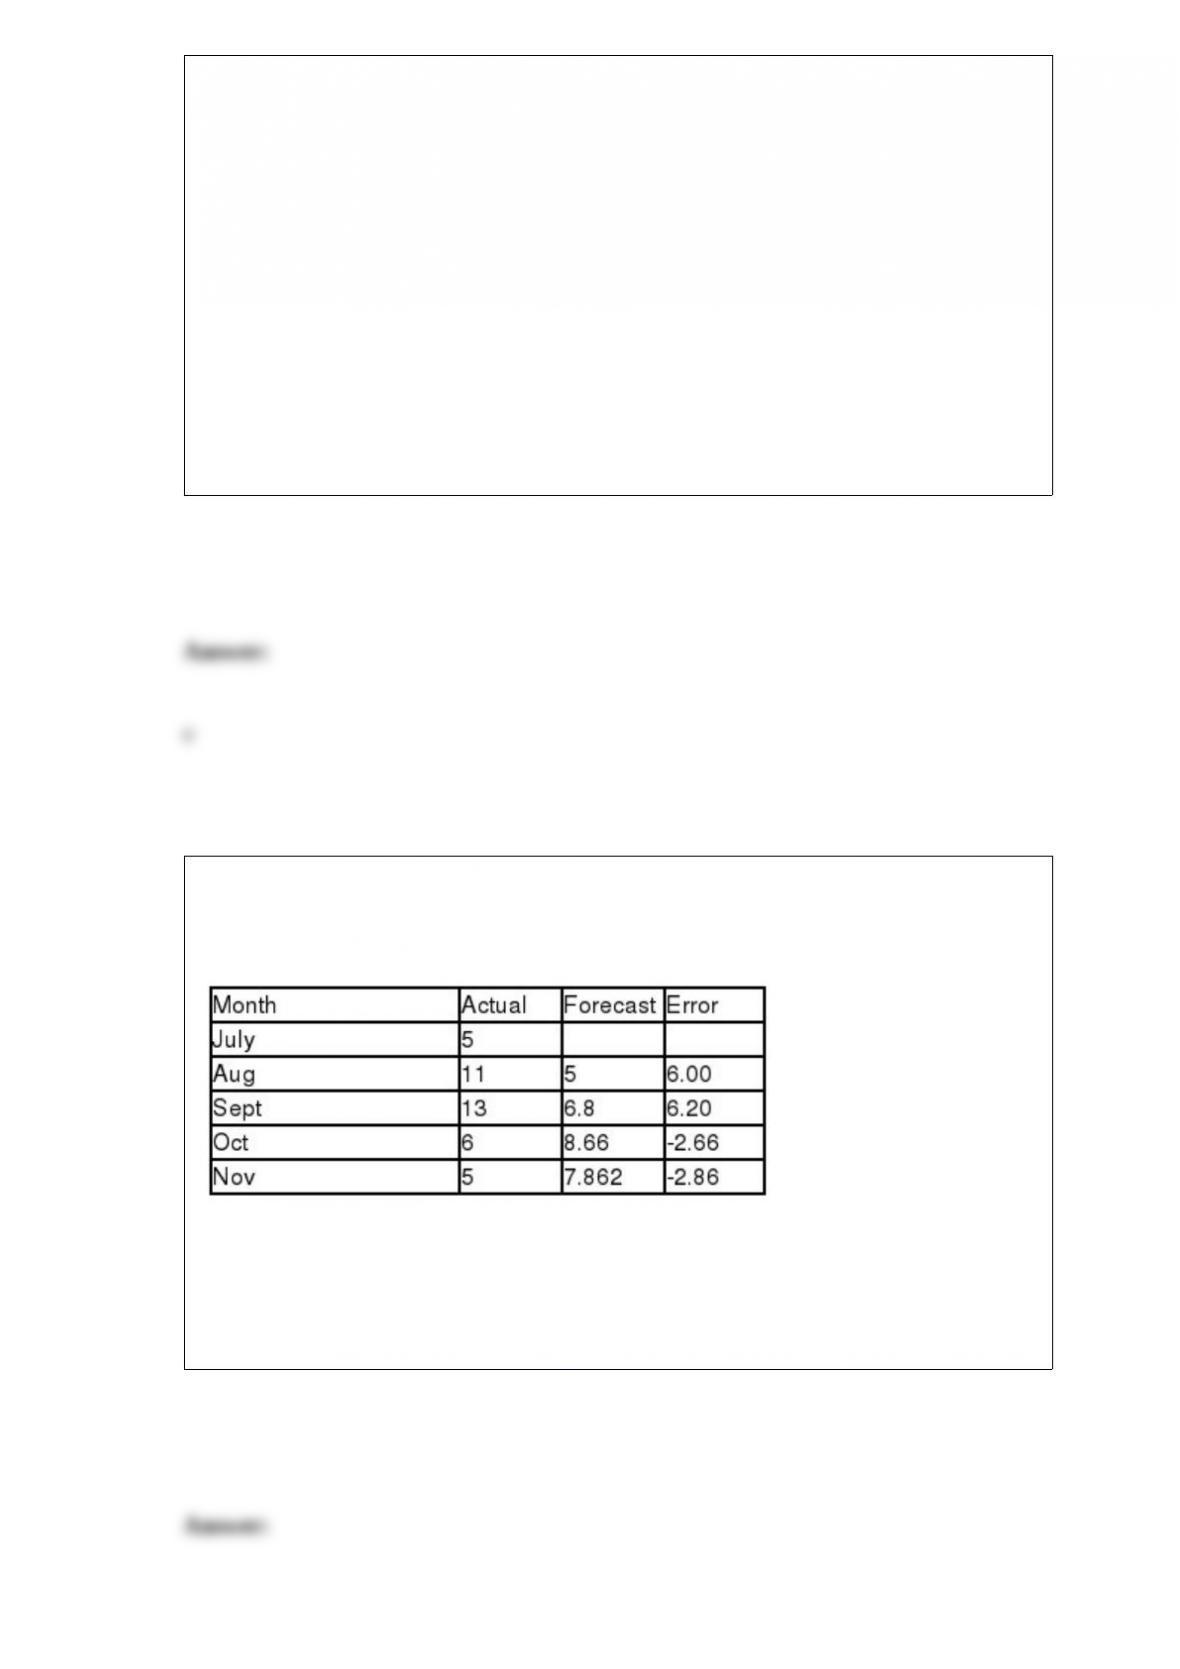
A time series with forecast values and error terms is presented in the following table.
The mean squared error (MSE) for this forecast is ___________.
a) 13.33
b) 17.94
c) 89.71
d) 22.43
e) 32.34
The median for ungrouped raw data is more complicated to compute then the median
for grouped data.
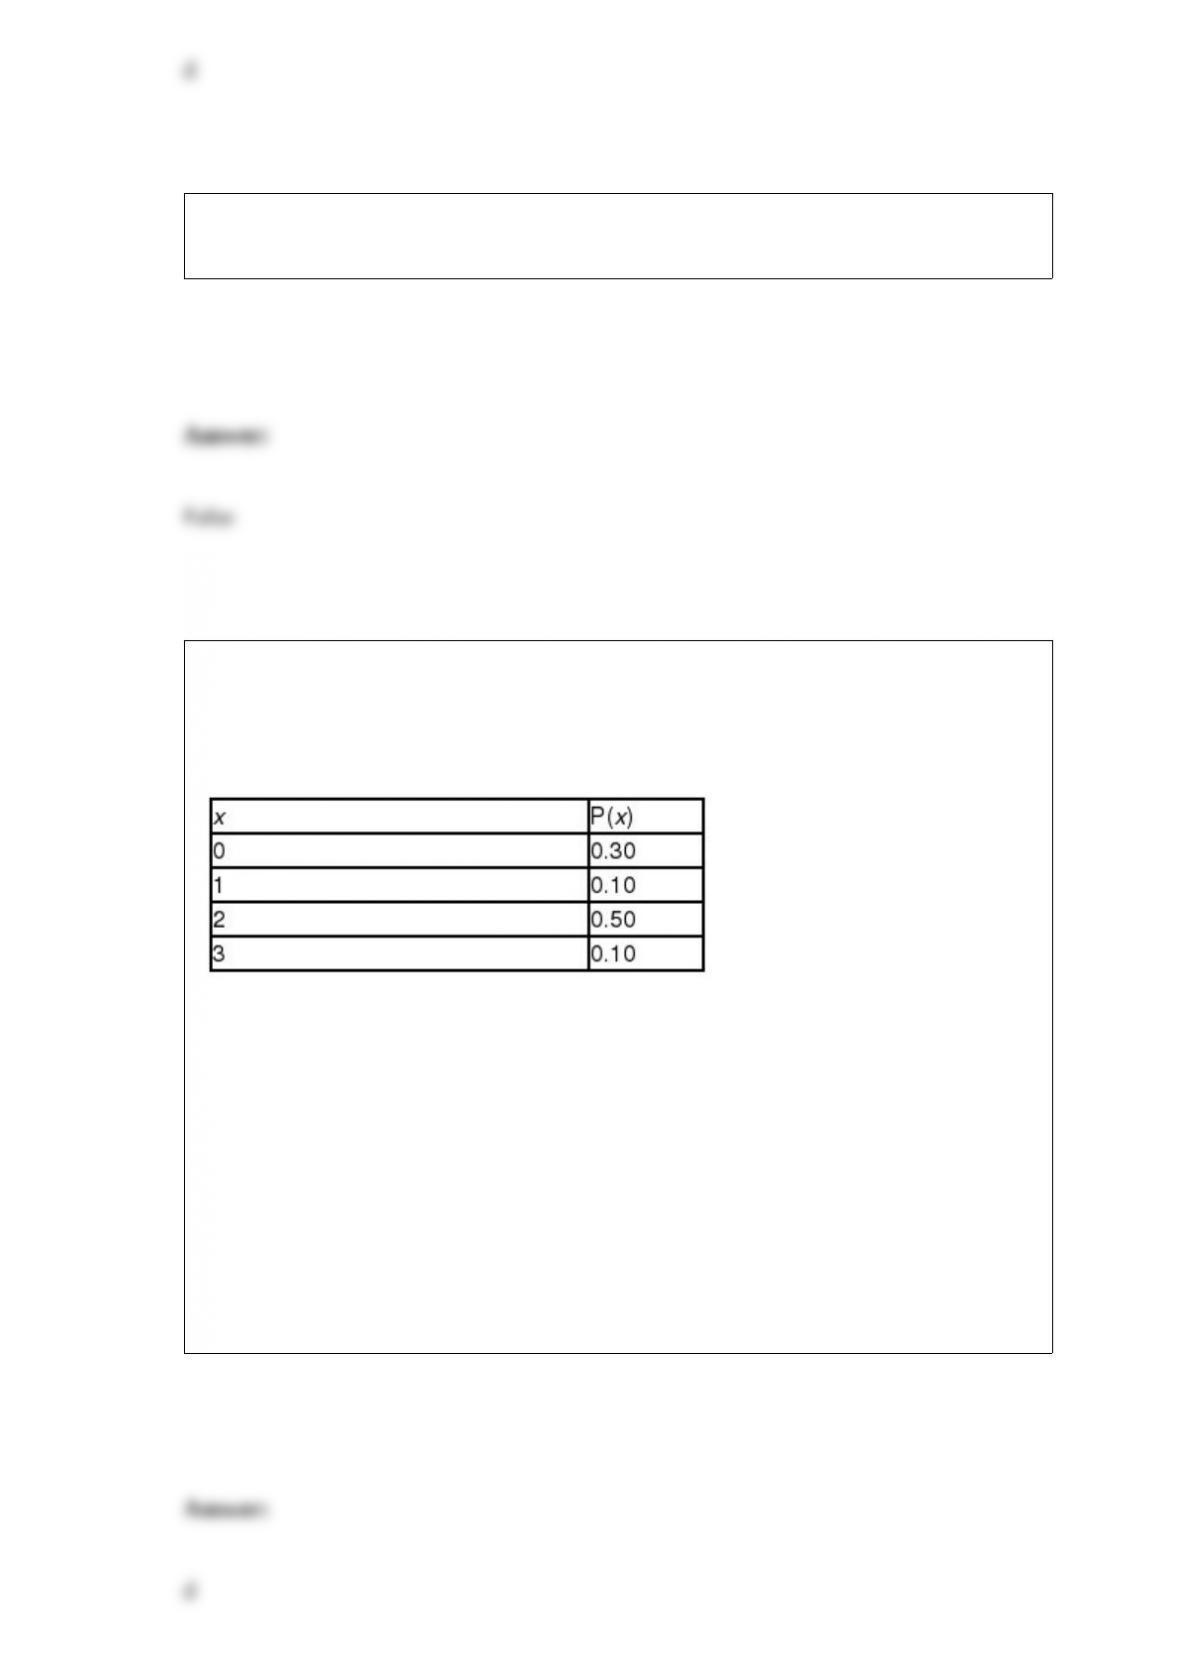
A market research team compiled the following discrete probability distribution on the
number of sodas the average adult drinks each day. In this distribution, x represents the
number of sodas which an adult drinks.
The standard deviation of x is _______________.
a) 1.04
b) 0.89
c) 1.40
d) .506
e) .588
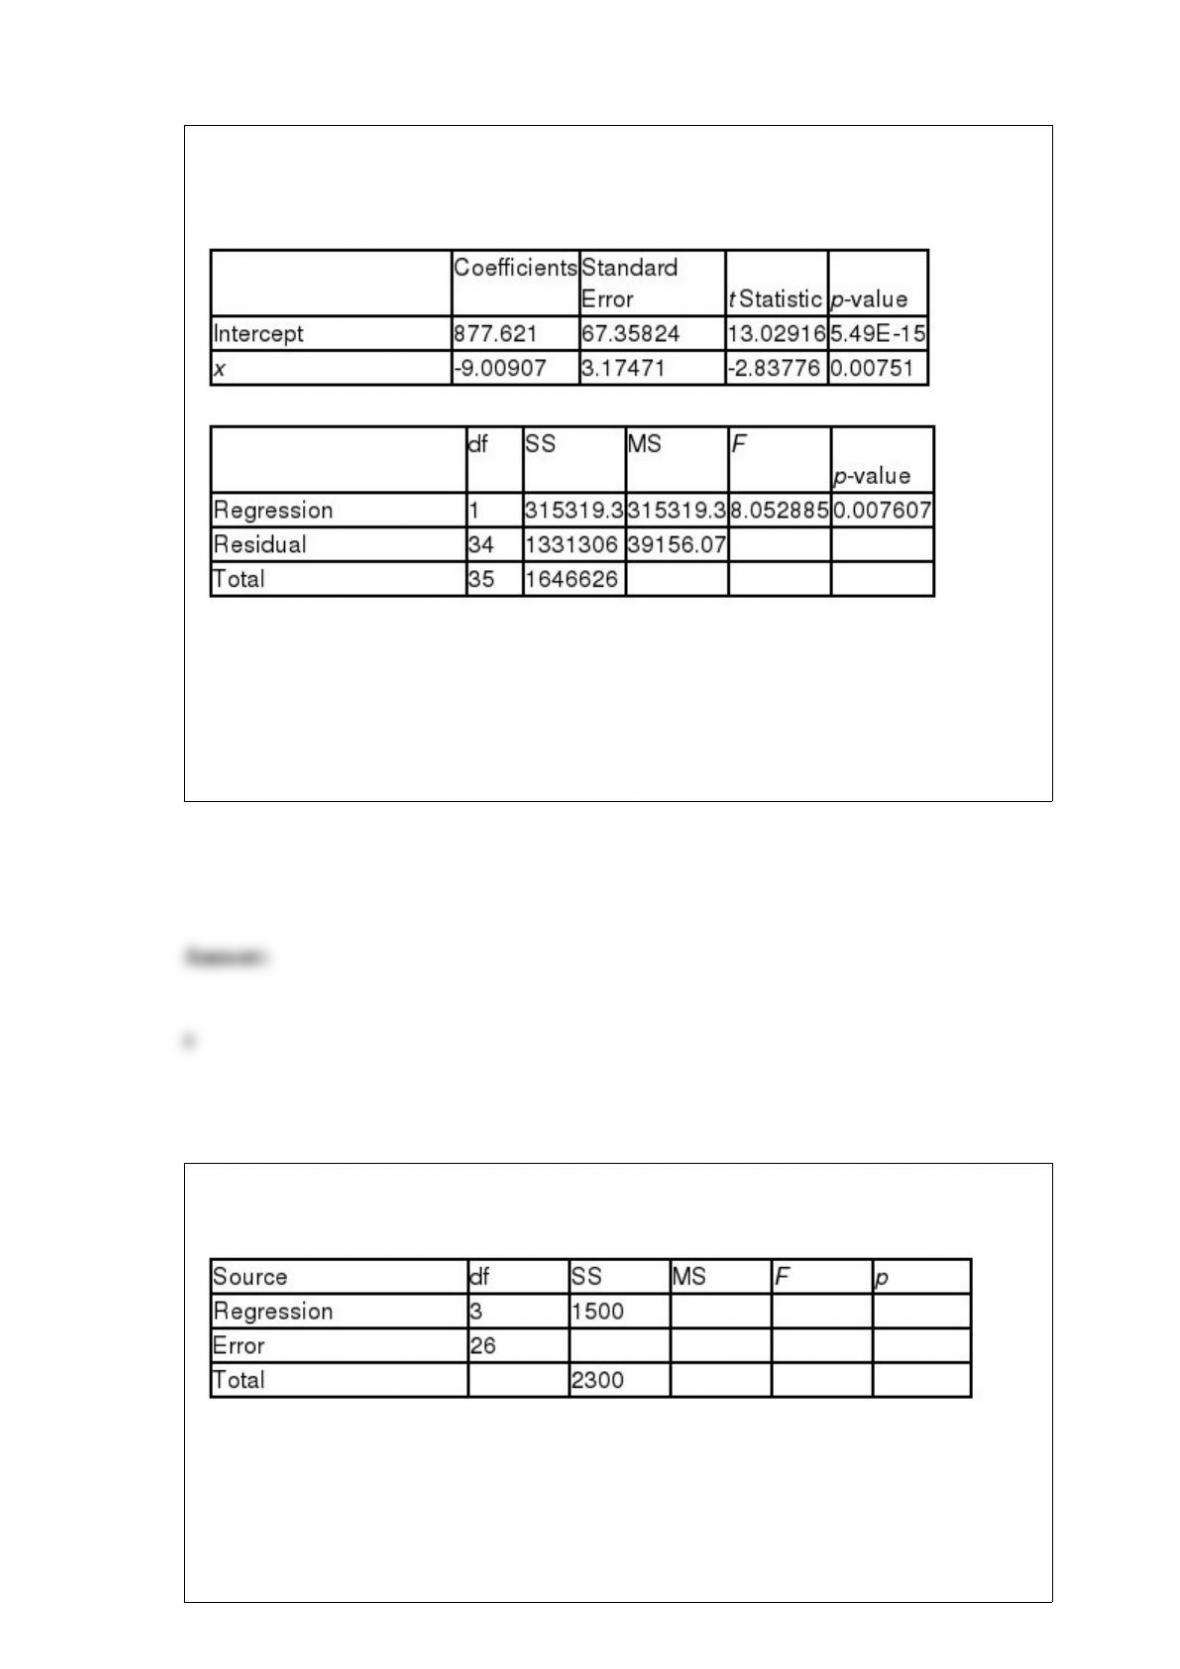
Fitting a linear trend to 36 monthly data points (January 2011 = 1, February 2011 =2,
March 2011 = 3, etc.) produced the following tables.
The projected trend value for January 2014 is ________.
a) 544.29
b) 868.61
c) 652.39
d) 760.50
e) 876.90
The following ANOVA table is from a multiple regression analysis.
The SSE value is __________.
a) 30
b) 1500
c) 500
d) 800
e) 2300
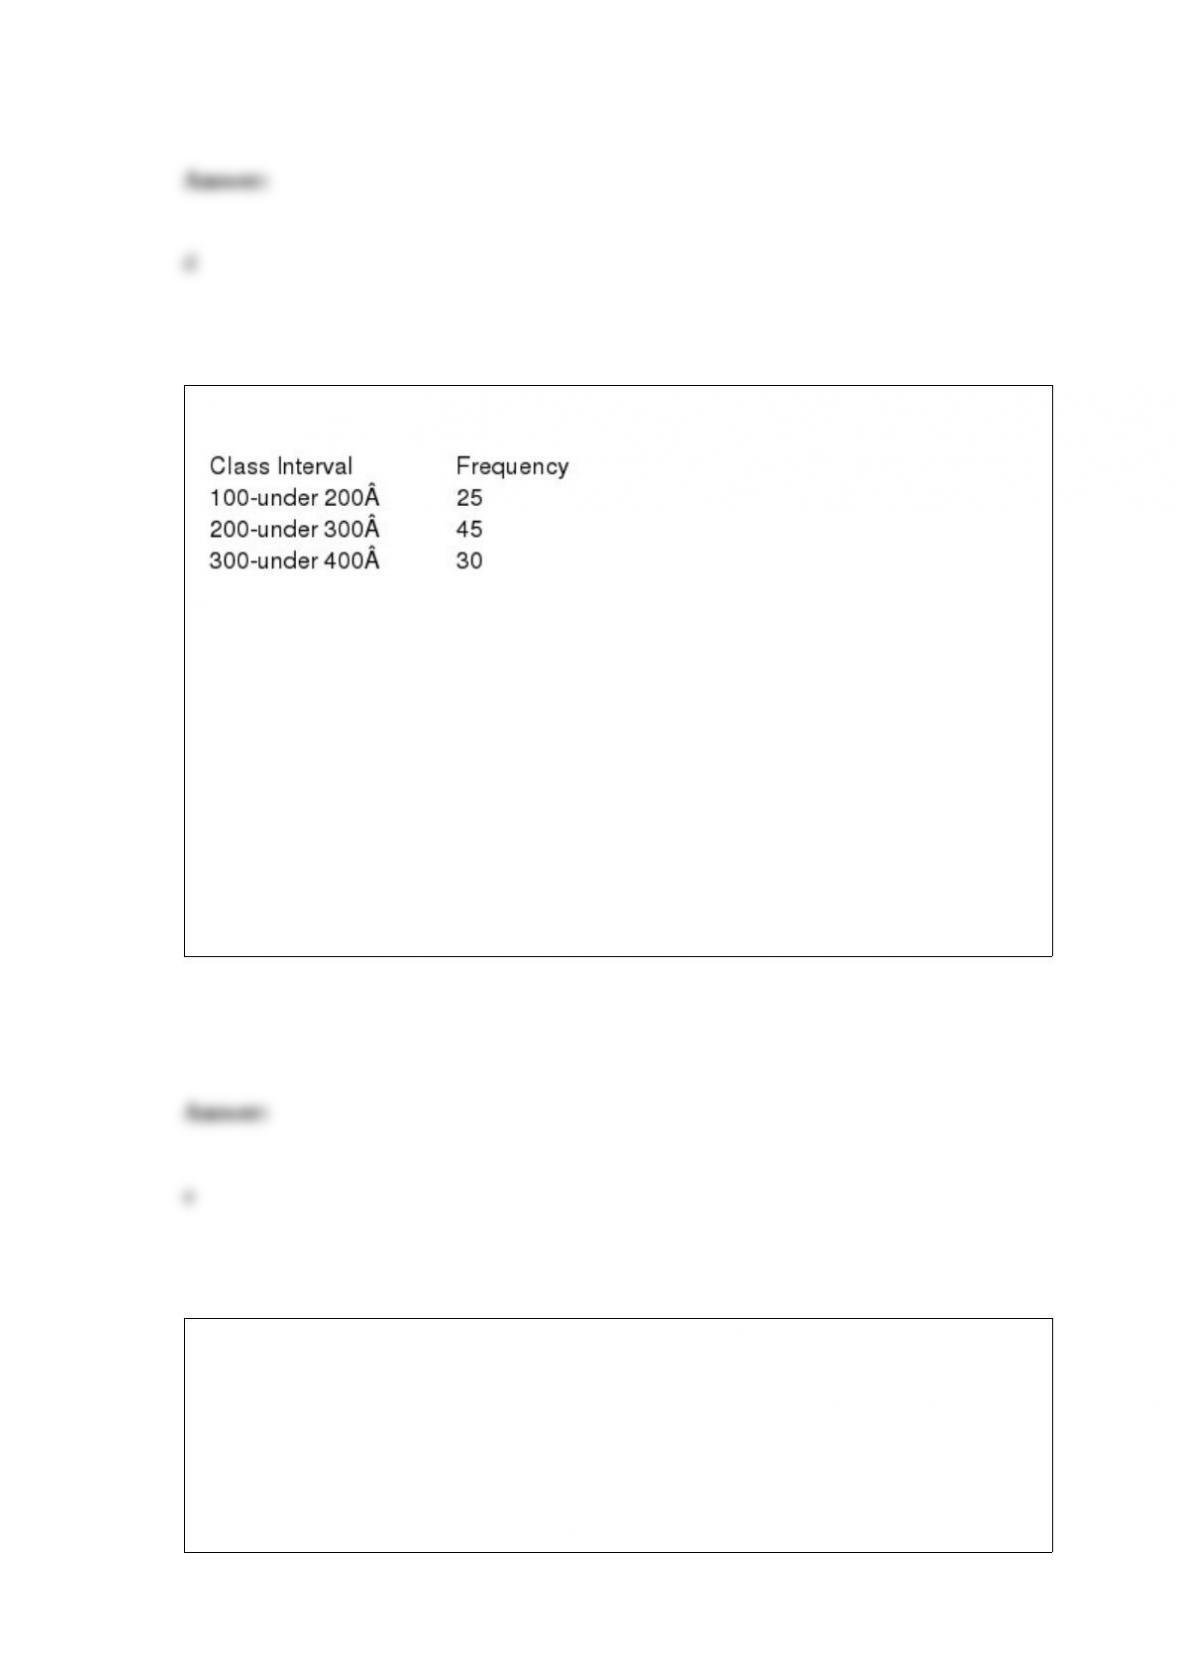
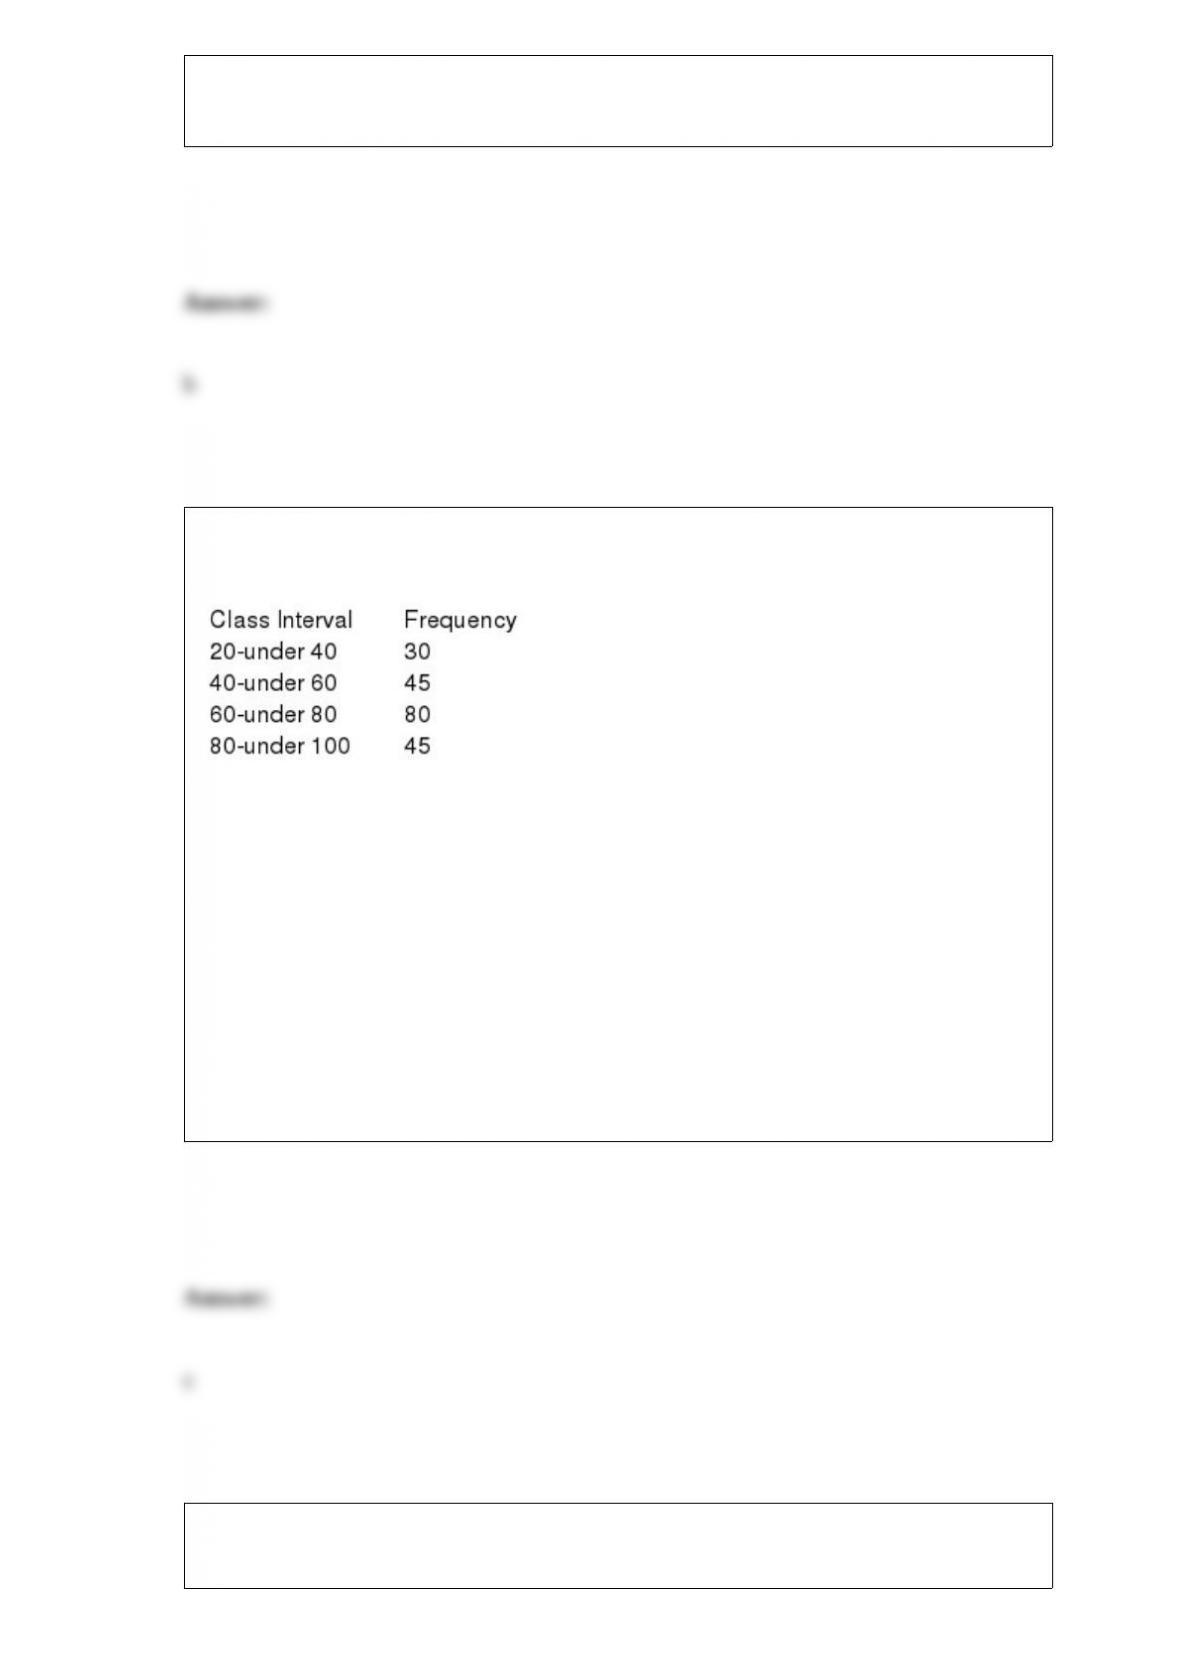
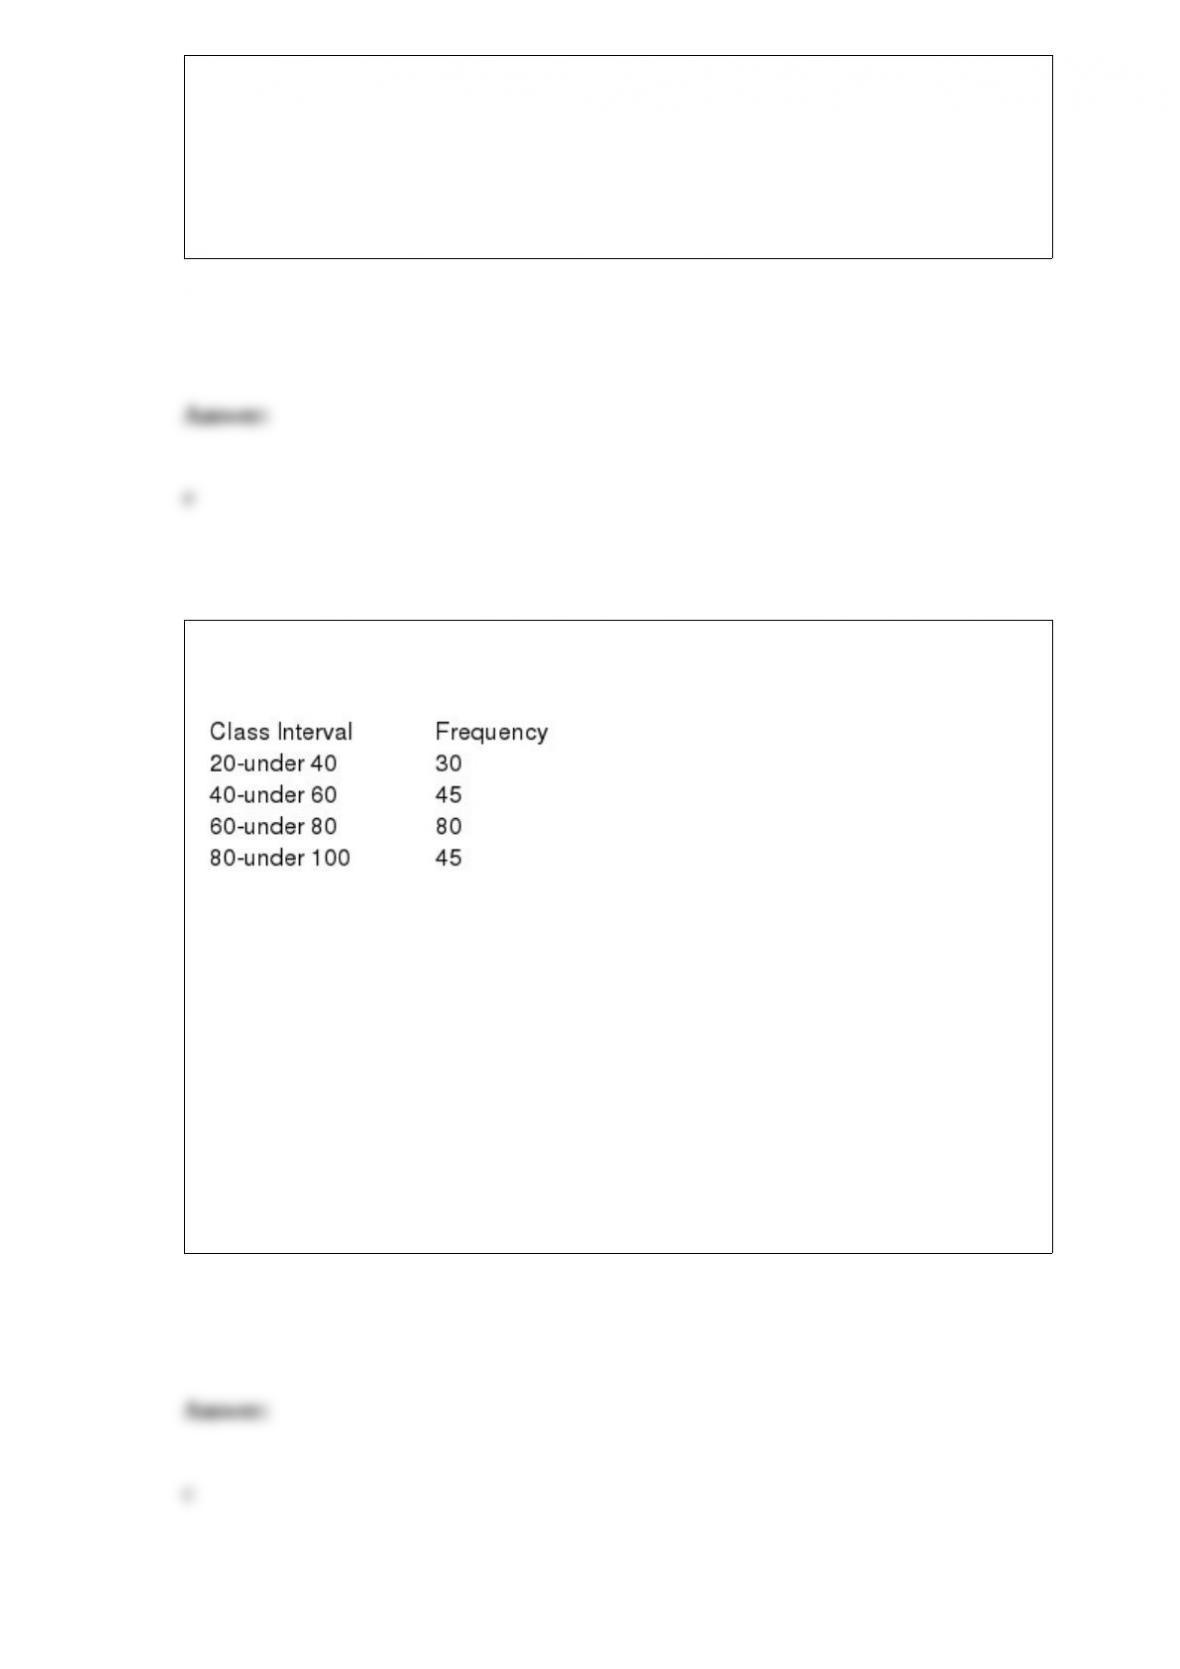
Consider the following frequency distribution:
What is the relative frequency of the second class interval?
a) 0.45
b) 0.70
c) 0.30
d) 0.33
e) 0.50
In regression analysis, outliers may be identified by examining the ________.
a) coefficient of determination
b) coefficient of correlation
c) p-values for the partial coefficients
d) residuals
e) R-squared value
The table t value associated with the upper 5% of the t distribution and 14 degrees of
freedom is _______.
a) 2.977
b) 2.624
c) 2.145
d) 1.761
e) 1.345
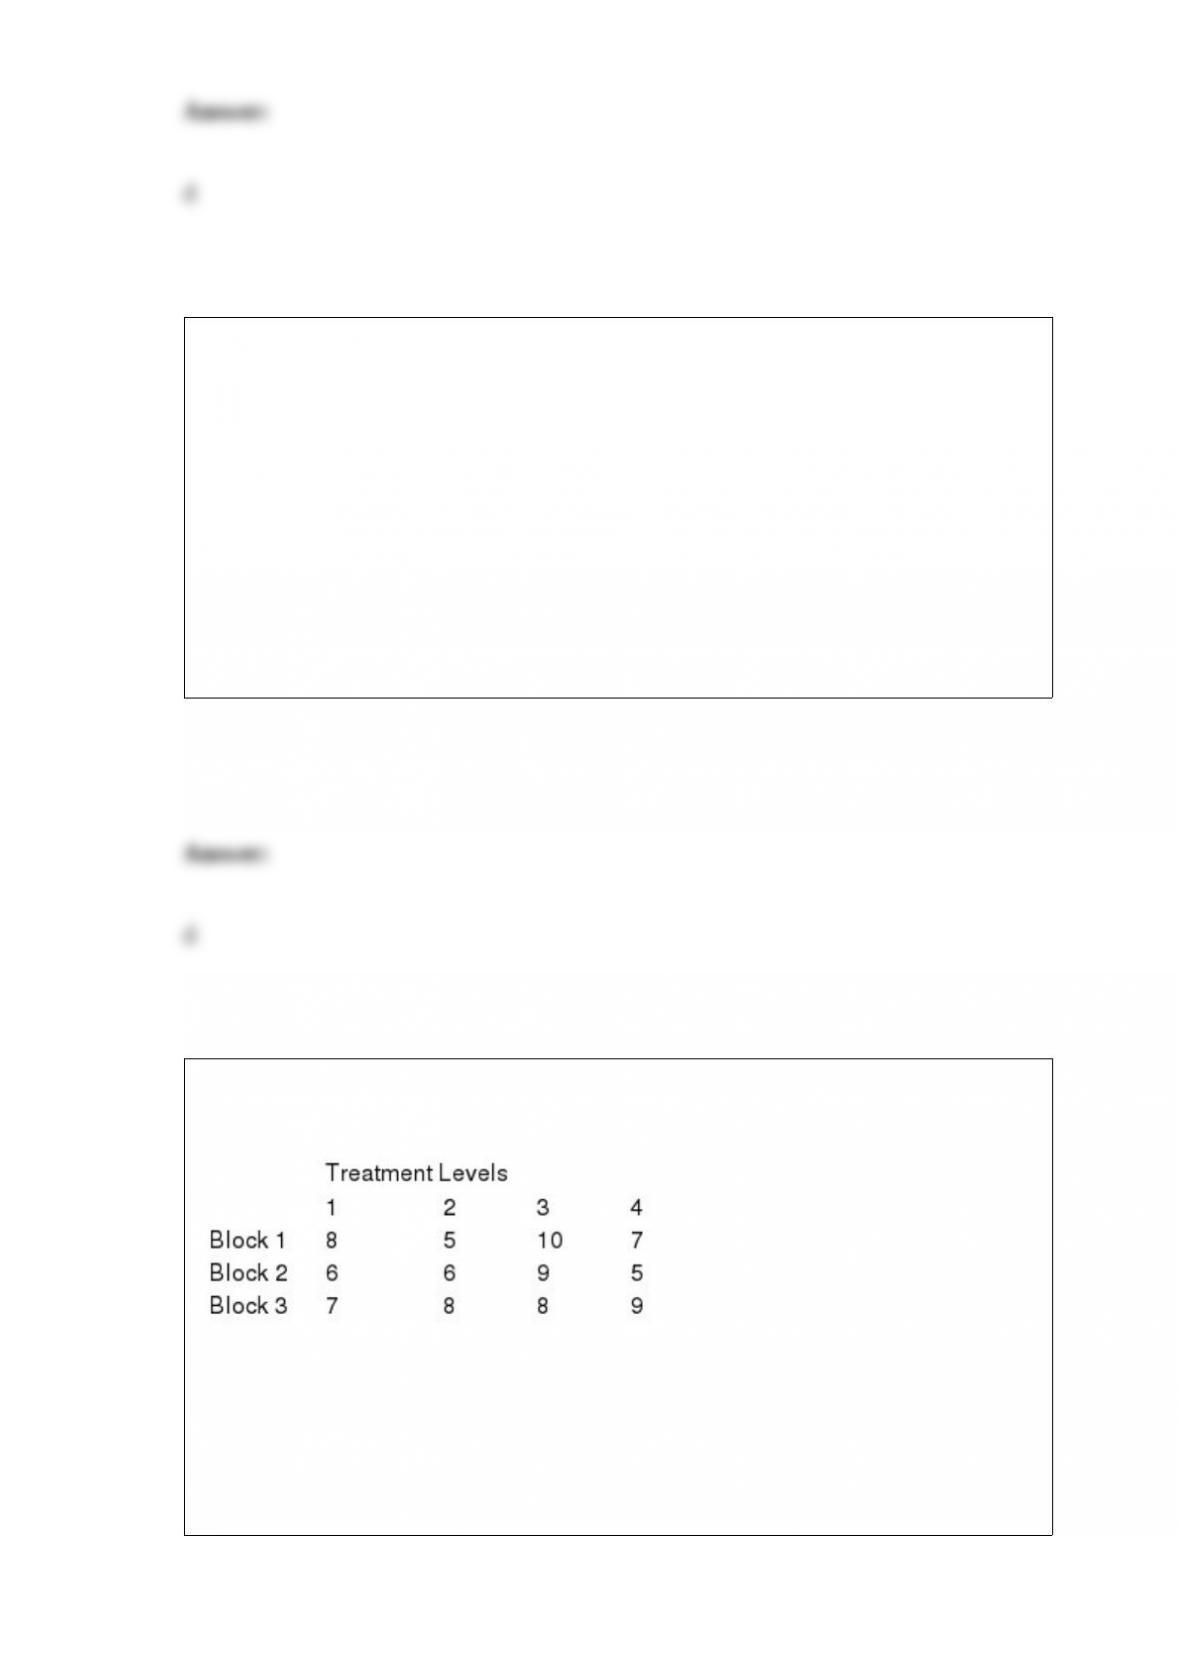
Data from a randomized block design are shown in the following table.
The Total Sum of Squares (SST) is ________.
a) 4.67
b) 12
c) 2.33
d) 28.67
e) 11

A production run of 500 items resulted in 29 defectives items. A defective item is coded
as 1 and a good item as 0. The following is an output from Minitab.
Using α=0.1, the conclusion is __________________.
a) successive items did not constitute a random sample.
b) successive items constituted a random sample
c) do not reject the hypothesis that successive items constituted a random sample
d) reject the hypothesis that successive items constituted a random sample
e) the distribution is binomial