All other things held constant, increasing the level of confidence for a confidence
interval estimate for the difference between two population means will result in a wider
confidence interval estimate.
A random variable is generated when a variable’s value is determined by using classical
probability.
The number of calls to an Internet service provider during the hour between 6:00 and
7:00 p.m. is described by a Poisson distribution with mean equal to 15. Given this
information, the standard deviation for the call distribution is about 3.87 calls.
Models can be specified as linear or nonlinear.
If a decision maker wishes to test to determine whether the medians are equal for two
populations the Mann-Whitney U test is appropriate for either independent or
dependent sampling situations.
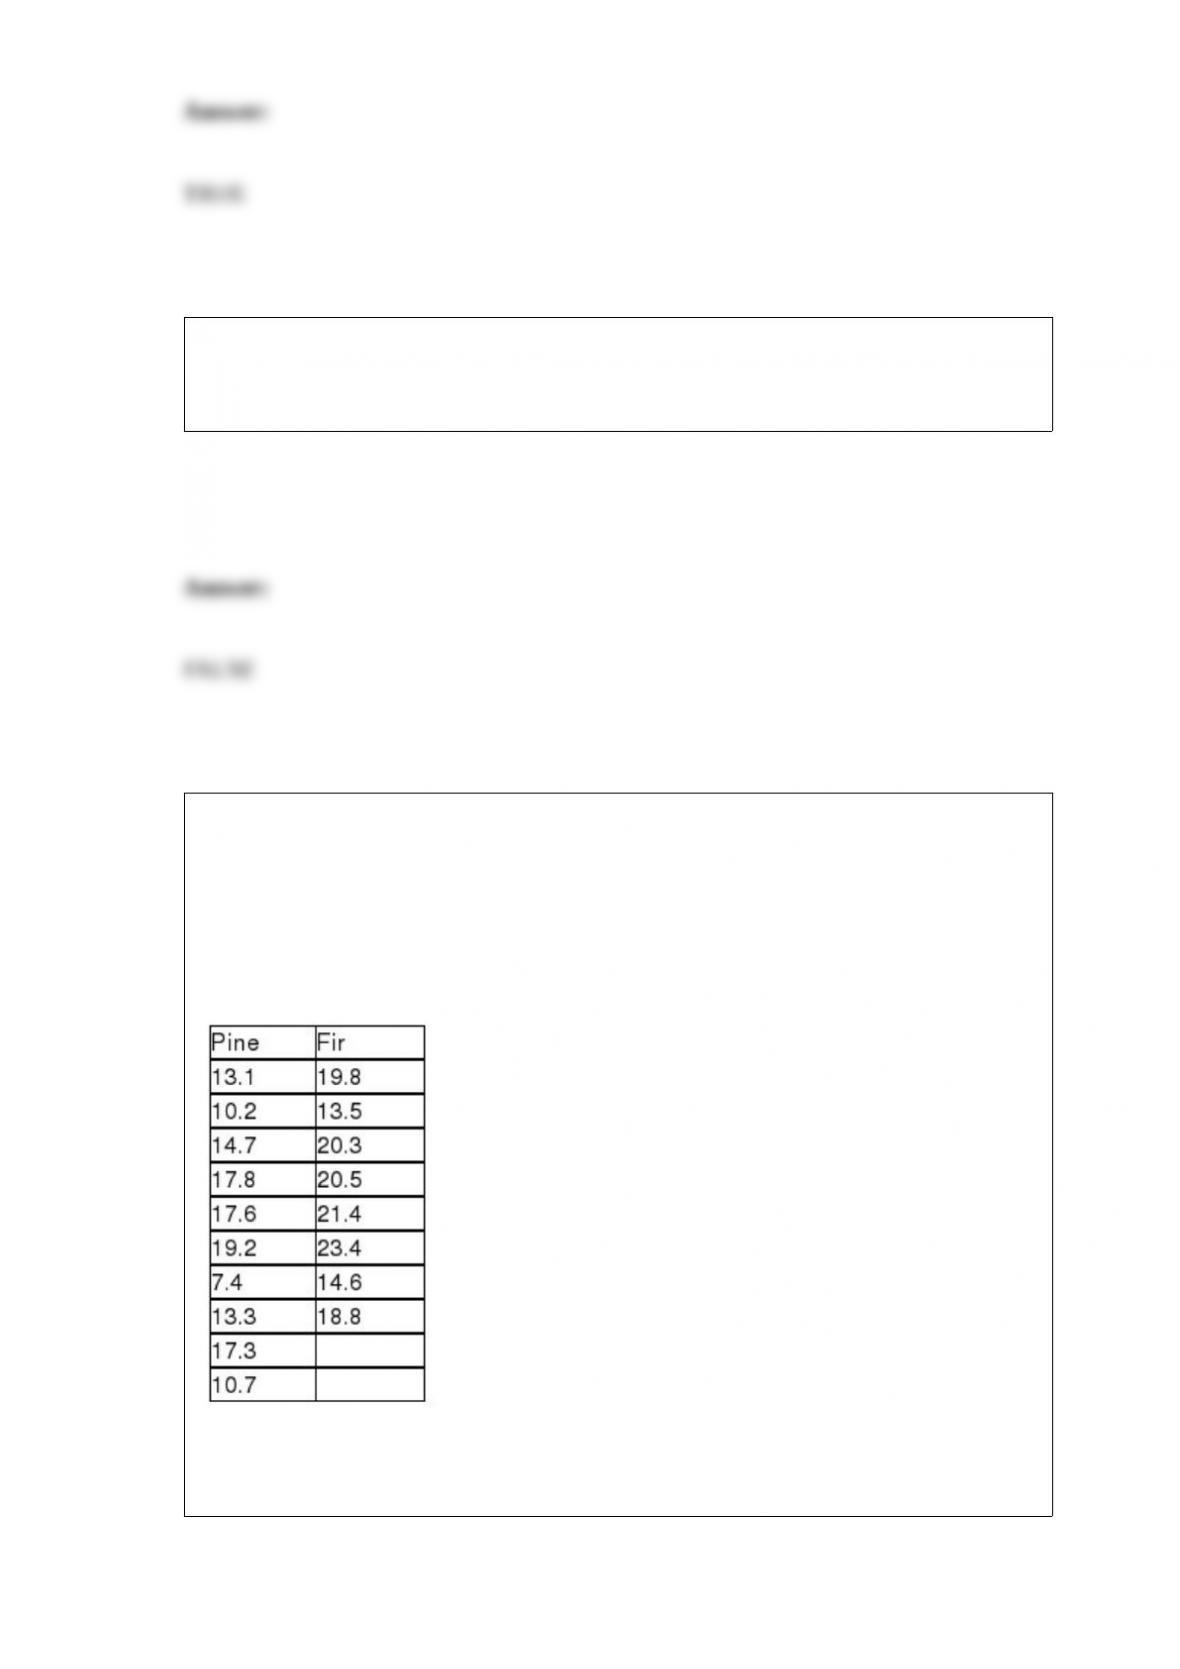
The Sergio Lumber Company manufactures plywood. One step in the process is the one
where the veneer is dried by passing through a huge dryer (similar to an oven) where
much of the moisture in the veneer is extracted. At the end of this step, samples of
veneer are tested for moisture content. It is believed that pine veneer will be less moist
on average than will fir veneer. The following data were reported recently where the
values represent the percent moisture in the wood:
Based on these data, the critical t value from the t-distribution will be 1.7459 if the
significance level is set at 0.05 and variances are presumed equal.
Variation exists naturally in the world around us so all processes and products can be
expected to vary.
In an unstructured interview the questions are scripted.
When a group of university students takes a poll of their fellow students on whether
they support a proposed fee increase, the sampling method they would use when
students walking near the library are surveyed would be called a random sample.
A joint frequency distribution is used to describe the number of occurrences where two
observations in a data set have the same value.
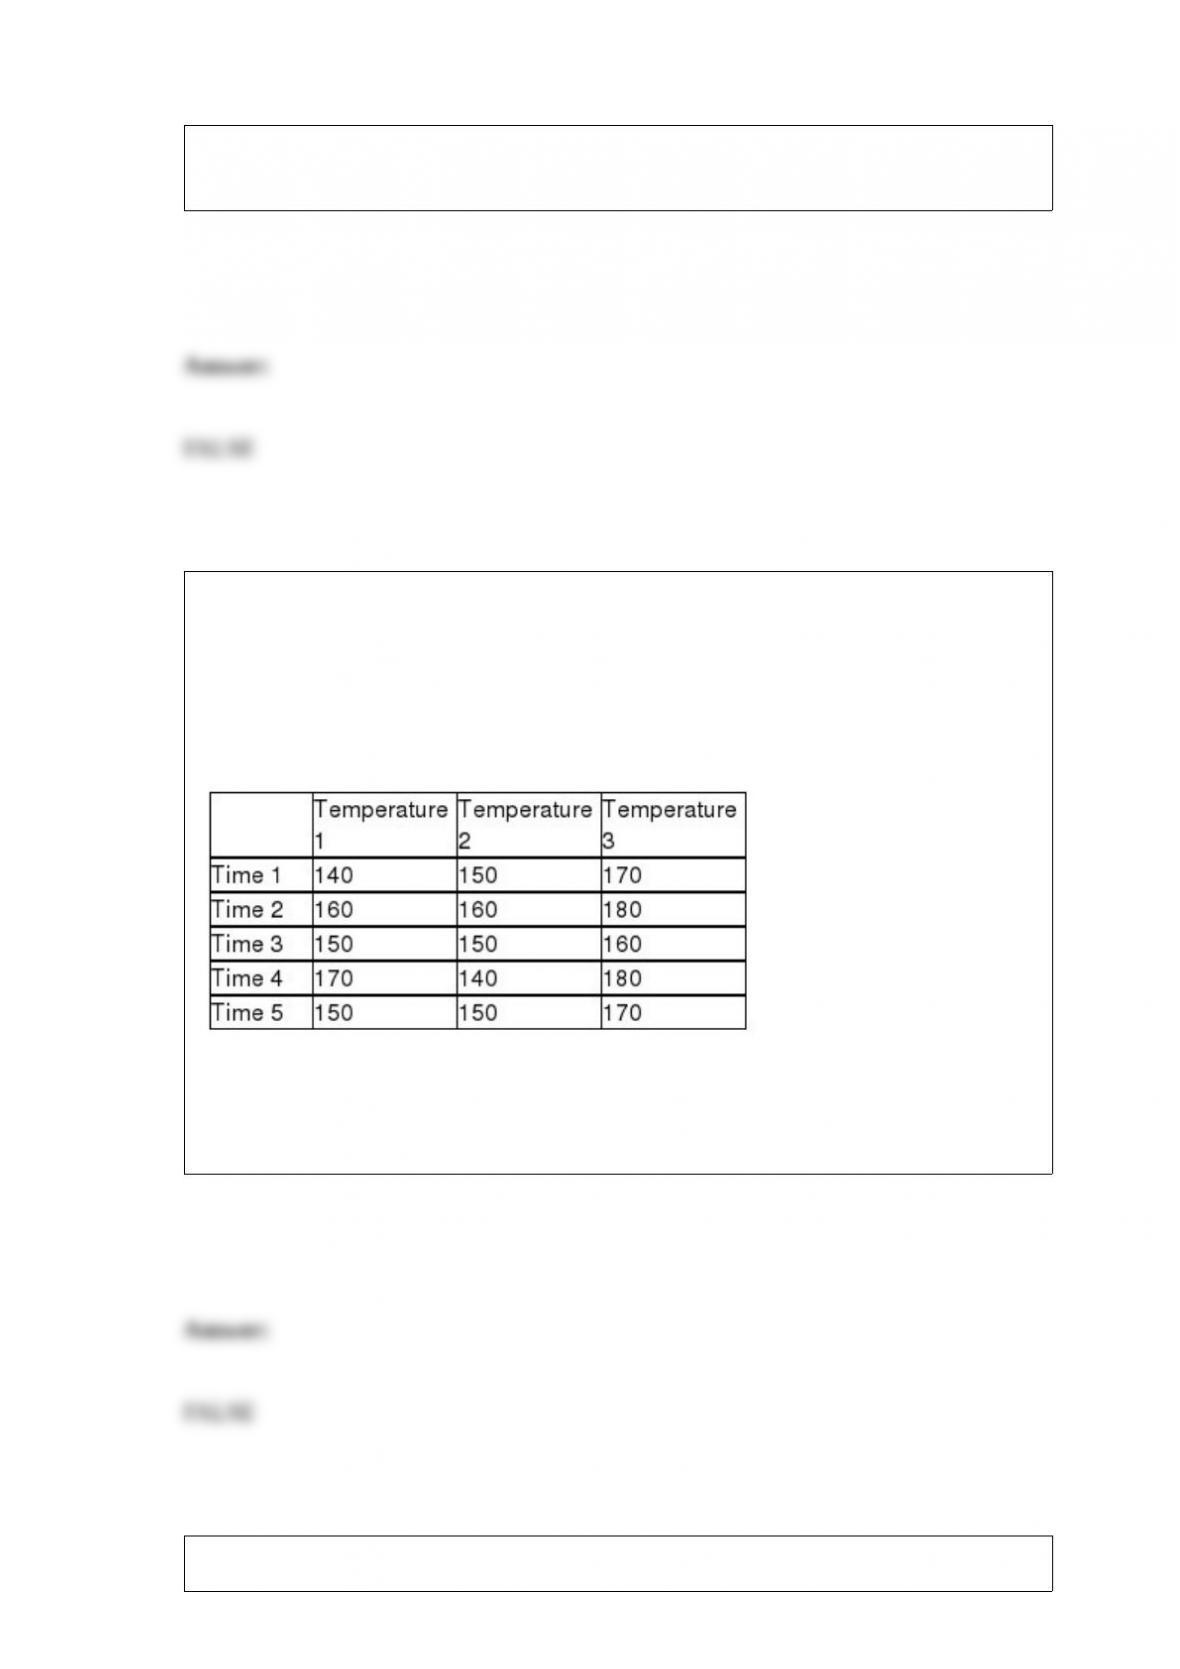
A company has established an experiment with its production process in which three
temperature settings are used and five elapsed times are used for each setting. The
company then produces one product under each and measures the resulting strength of
the product. The managers are mainly interested in determining whether the mean
strength is the same at all temperature settings, but they know that controlling for
process time is important. The following data were observed from the experiment:
Based on these data and experimental design, for a significance level of 0.05, the
managers should conclude that they were justified in blocking on the basis of
processing time.
A survey was recently conducted in which males and females were asked whether they
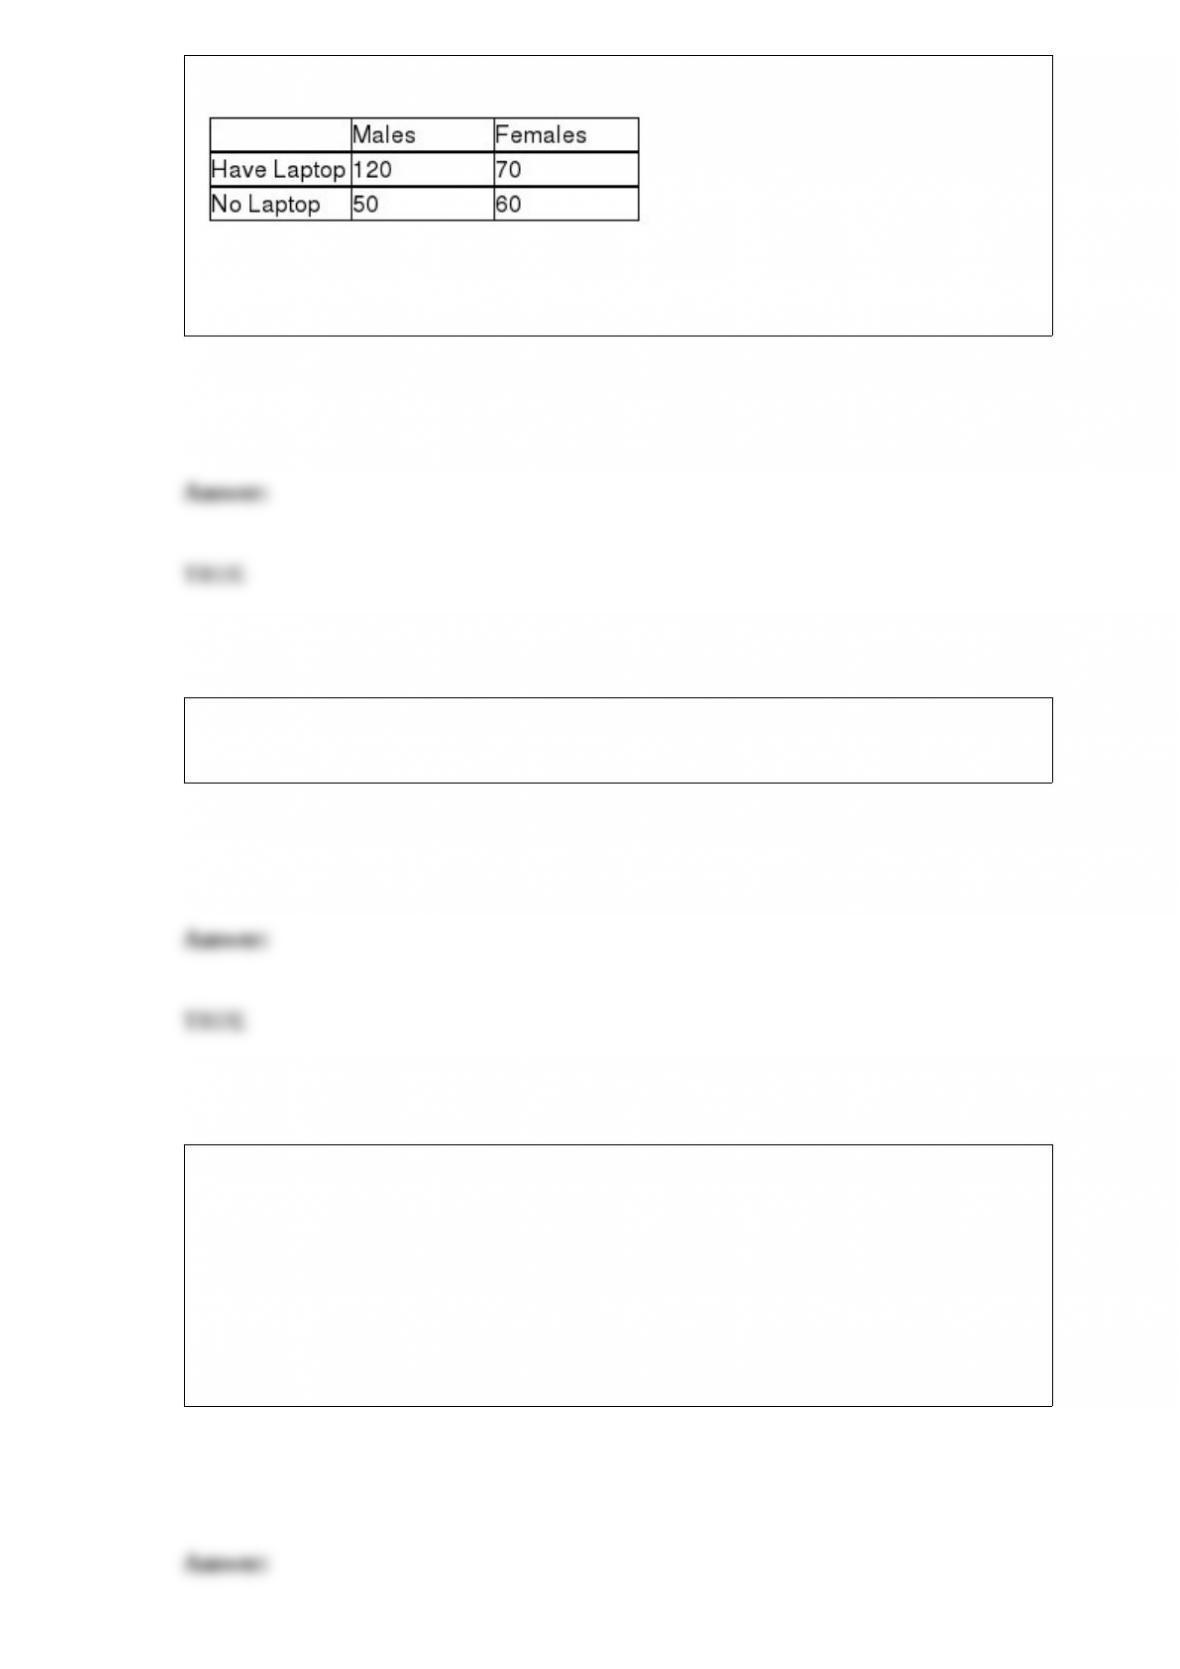
owned a laptop personal computer. The following data were observed:
Given this information, if an alpha level of .05 is used, the sum of the expected cell
frequencies will be equal to the sum of the observed cell frequencies.
In a multiple regression model, it is assumed that the errors or residuals are normally
distributed.
There are three general locations that a taxi can go to: the airport, downtown, and
elsewhere. When a taxi driver starts in the downtown location, there is a 0.40 chance
that his first call will take him to the airport and a 0.40 chance of going to another
downtown location. Once a taxi is at the airport, there is a 0.80 probability that the next
fare will take him downtown and a 0.20 chance of going elsewhere. The probability of a
call from anywhere except downtown taking him to the airport is 0.20. Therefore, the
probability that the taxi is at the airport when the third call arrives after going on shift is
0.20.
Variation exists naturally in the world around us so all processes and products can be
expected to vary.
A stable process is typically defined as one in which all output is operating within 3
standard deviations of the process center.
If the R-square for a multiple regression model with two independent variables is .64,
the correlation between the two independent variables will be .80
In conducting a Mann-Whitney U test when the sample size is greater than 20, the U
test statistic can be assumed normally distributed.
An electronics repair shop has determined that the time between failures for a particular
electronic component part is exponentially distributed with a mean time between
failures of 200 hours. Based on this information, the probability that a part will fail in
the first 20 hours is approximately 0.095.
Recently, a study was done to determine whether the median speed on a section of
highway is the same for cars versus trucks. A sample of 12 cars (n1 = 12) and 15 trucks
(n2 = 15) was collected. If the Mann-Whitney U test is to be performed using an alpha =
.05, the test critical U value is 49.
When a regression equation includes a term such as x1x2 where two independent
variables are multiplied, this is an interaction term.
The scatter plot is a two dimensional graph that is used to graphically represent the
relationship between two variables.
Recently, an analyst in a company’s marketing department surveyed customers
regarding how often they buy a particular product. One customer indicated that she
purchased the product 17 times in the last six months, but the analyst recorded the
response as 71 times. This is an example of observer bias.
A large tire manufacturing company has claimed that its top line tire will average more
than 80,000 miles. If a consumer group wished to test this claim, they would formulate
the following null and alternative hypotheses:
H0 : μ ≥ 80,000
Hα : μ ≠ 80,000
It is possible for a set of data to have multiple modes as well as multiple medians, but
there can be only one mean.
There is no difference between cumulative frequency and relative frequency.
If one or more parameters are left unspecified in a goodness-of-fit test, they must be
estimated from the sample data and one degree of freedom is lost for each parameter
that must be estimated.

Recently, a study was done to determine whether the median speed on a section of
highway is the same for cars versus trucks. A sample of 12 cars (n1 = 12) and 15 trucks
(n2 = 15) was collected. If the Mann-Whitney U test is to be performed using an alpha =
.05 and if the U test statistic is calculated to be 68, the null hypothesis should be
rejected.
The difference between bar charts and histograms is that bar charts always show
percentage while histograms always show frequency.
Analysis of variance can only be done for fixed effects.
If the calculated chi-square statistic is large, this is evidence to suggest the fit of the
actual data to the hypothesized distribution is not good, and H0 should be rejected.
The size of the standard error of the sample proportion is dependent on the value of the
population proportion and the closer the population proportion is to .50, the larger the
standard error for a given sample size will be.
A car salesman has noted that the probability that the dealership sells a car on a
Saturday morning is .30. Then the probability of the dealership not selling a car on
Saturday morning is .70.
In a recent study of retail daily sales by stores at a mall in Kansas, the minimum daily
sales was $700 and the maximum was $51,000. If you wish to construct a frequency
distribution with 10 classes, the minimum class width would be $5,100.
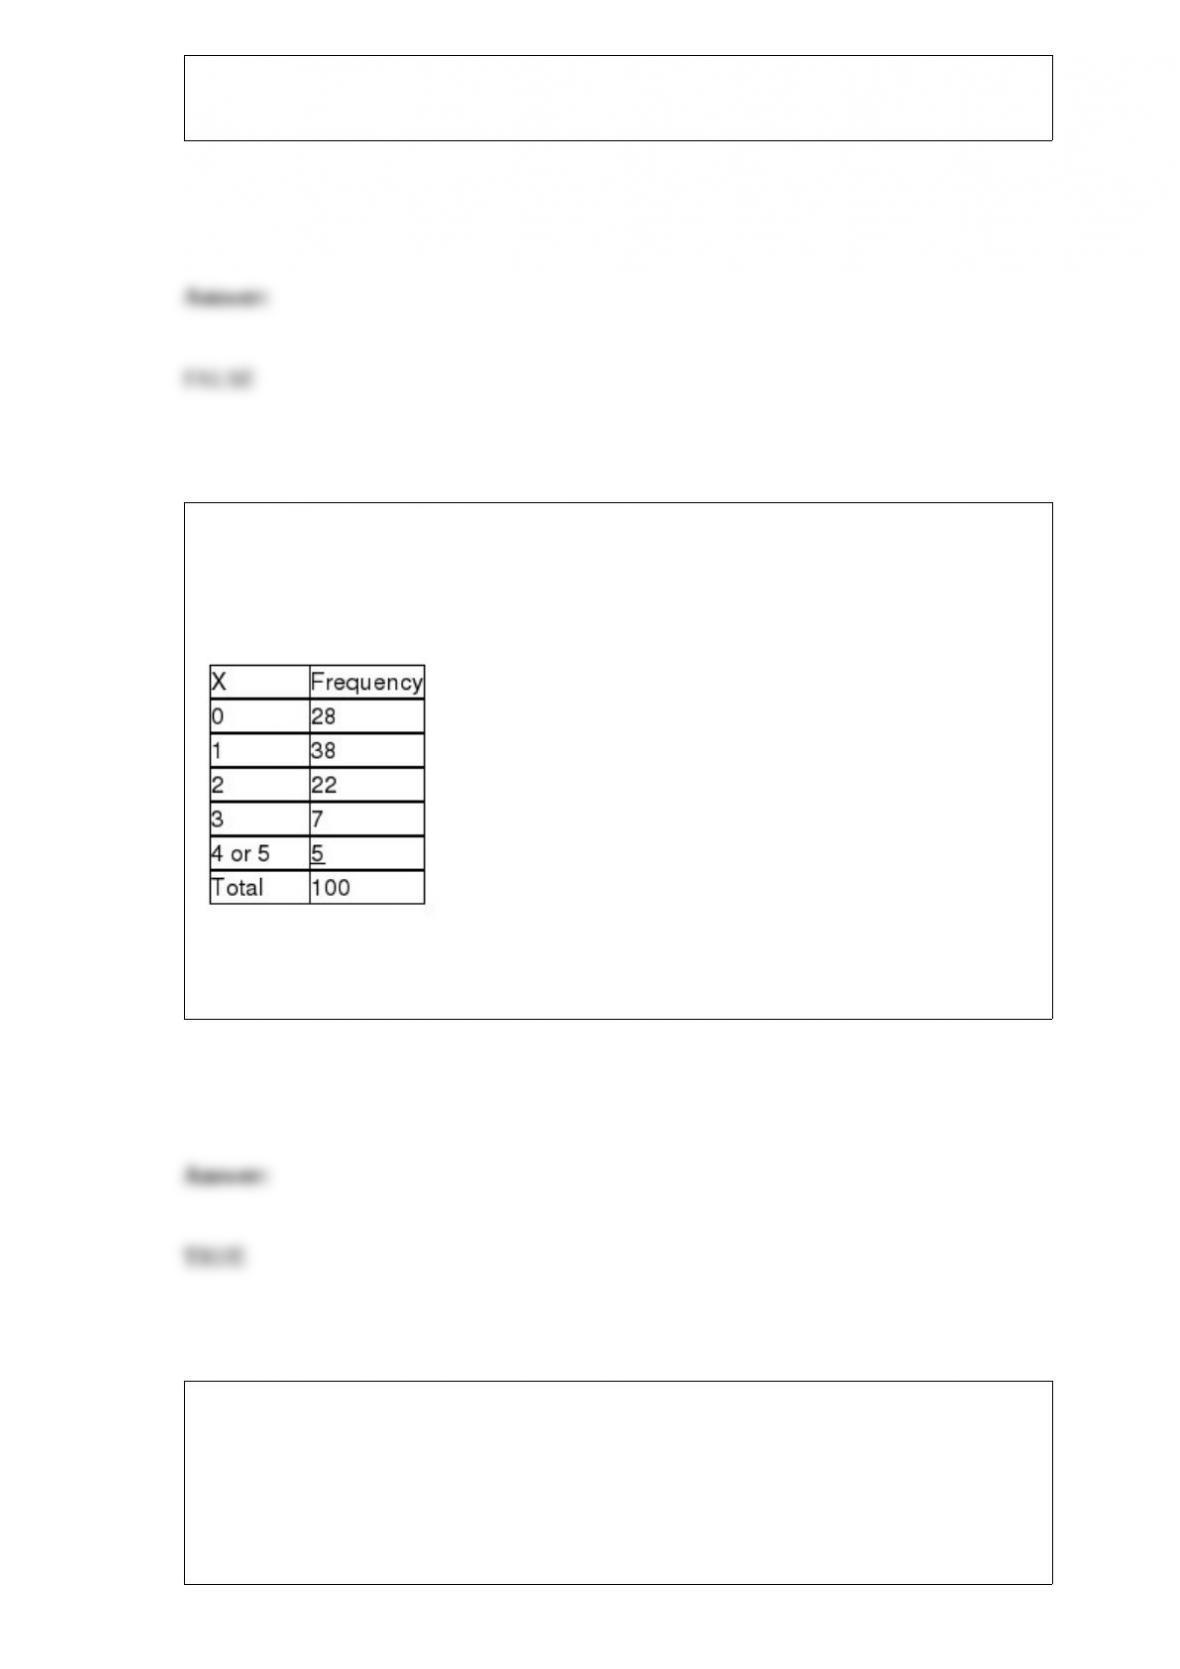
A business with 5 copy machines keeps track of how many copy machines need service
on a given day. It believes this is binomially distributed with a probability of p = 0.2 of
each machine needing service on any given day. It has collected the following based on
a random sample of 100 days.
Given this information the expected number of days on which exactly 1 machine breaks
down is 40.96.
The Varden Packaging Company has a contract to fill 50-gallon barrels with gasoline
for use by the U.S. Army. The machine that Varden uses has an adjustable device that
allows the average fill per barrel to be adjusted as desired. However, the actual
distribution of fill volume from the machine is known to be normally distributed with a
standard deviation equal to 0.5 gallons. The contract that Varden has with the military
calls for no more than 2 percent of all barrels to contain less than 49.2 gallons of
gasoline. Suppose Varden managers are unwilling to set the mean fill at any level higher
than 50 gallons. Given that, in order to meet the requirements, they will need to
increase the standard deviation of fill volume.
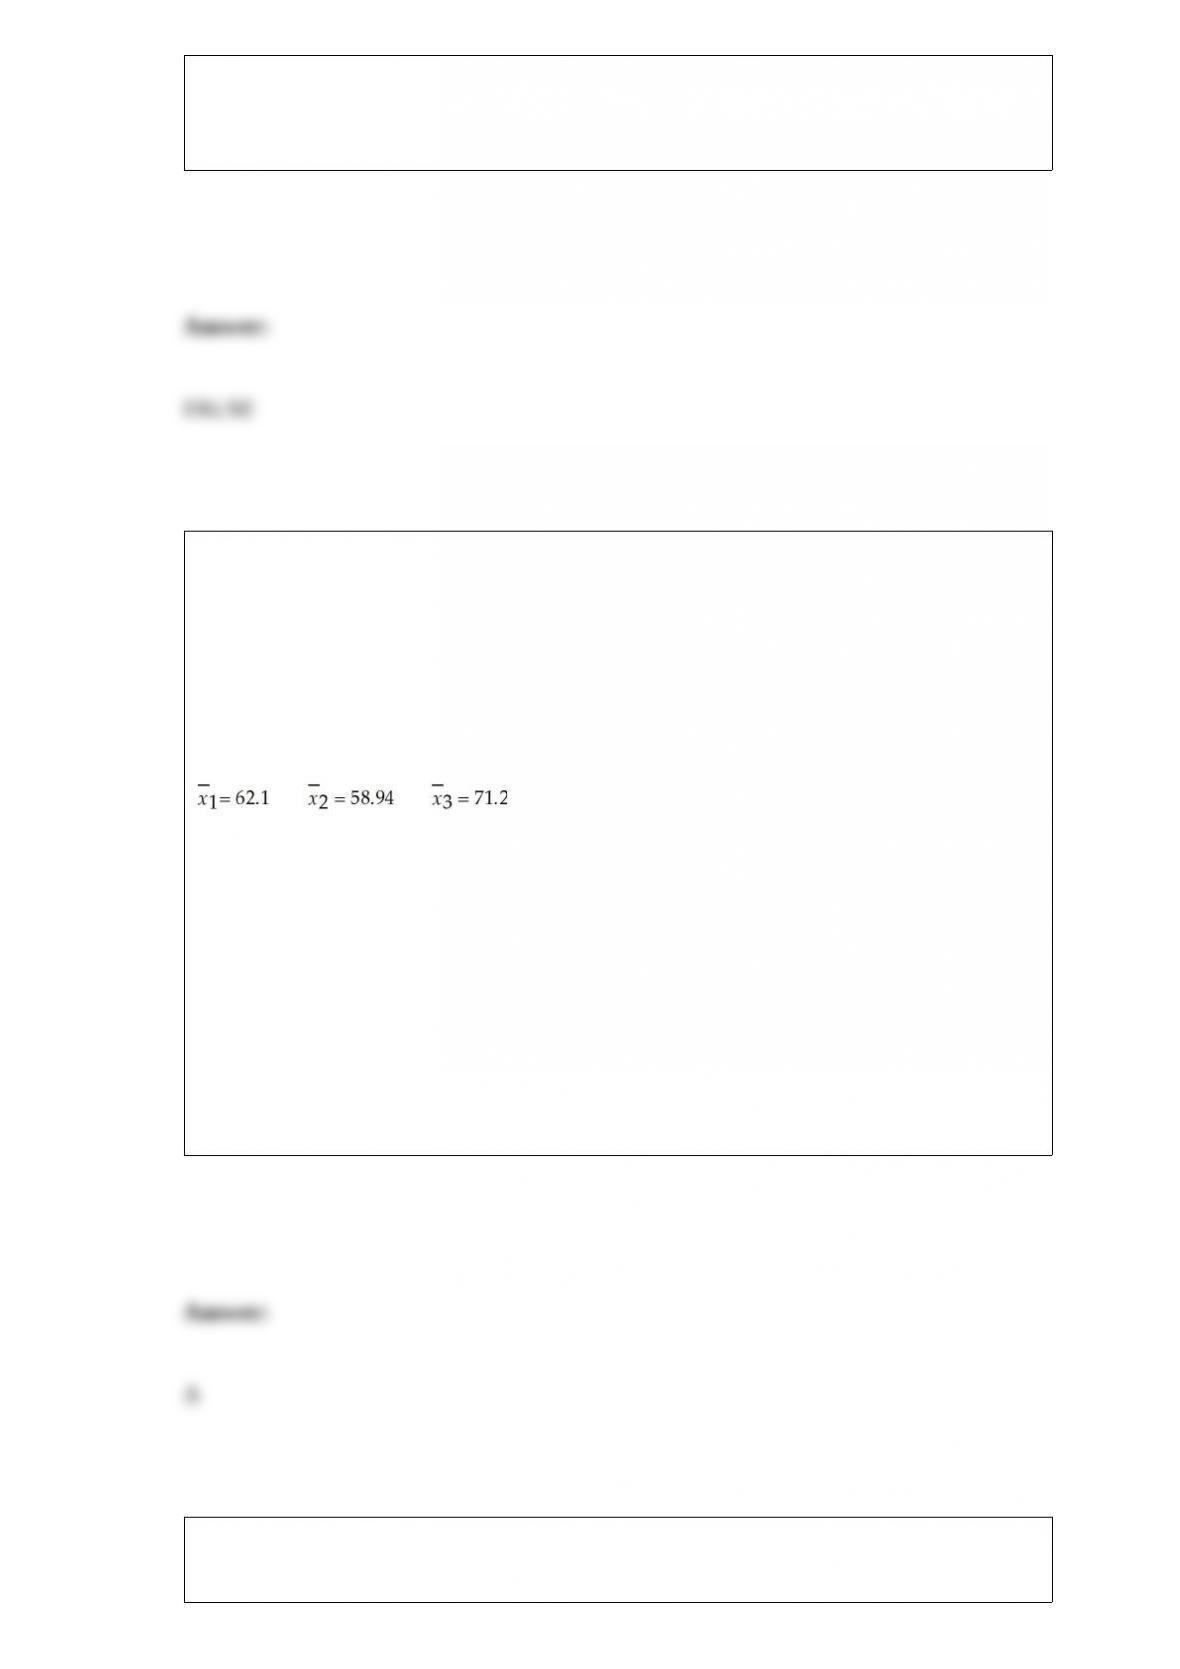
The State Transportation Department is thinking of changing its speed limit signs. It is
considering two new options in addition to the existing sign design. At question is
whether the three sign designs will produce the same mean speed. To test this, the
department has conducted a limited test in which a stretch of roadway was selected.
With the original signs up, a random sample of 30 cars was selected and the speeds
were measured. Then, on different days, the two new designs were installed, 30 cars
each day were sampled, and their speeds were recorded. Suppose that the following
summary statistics were computed based on the data:
Based on these sample results and significance level equal to 0.05, what is the critical
value for this hypothesis test?
A) F = approximately 3.15
B) F = approximately 4.90
C) F = approximately 29.47
D) F = approximately 2.70
For the normal distribution with parameters μ = 3, σ = 2; calculate P(0 < x < 8).

A) 0.3124
B) 0.9270
C) 0.8123
D) 0.6723
In testing a hypothesis, statements for the null and alternative hypotheses as well as the
selection of the level of significance should precede the collection and examination of
the data.
Jennings Assembly in Hartford, Connecticut, uses a component supplied by a company
in Brazil. The component is expensive to carry in inventory and consequently is not
always available in stock when requested. Furthermore, shipping schedules are such
that the lead time for transportation of the component is not a constant. Using historical
records, the manufacturing firm has developed the following probability distribution for
the product’s lead time. The distribution is shown here, where the random variable is the
number of days between the placement of the replenishment order and the receipt of the
item.
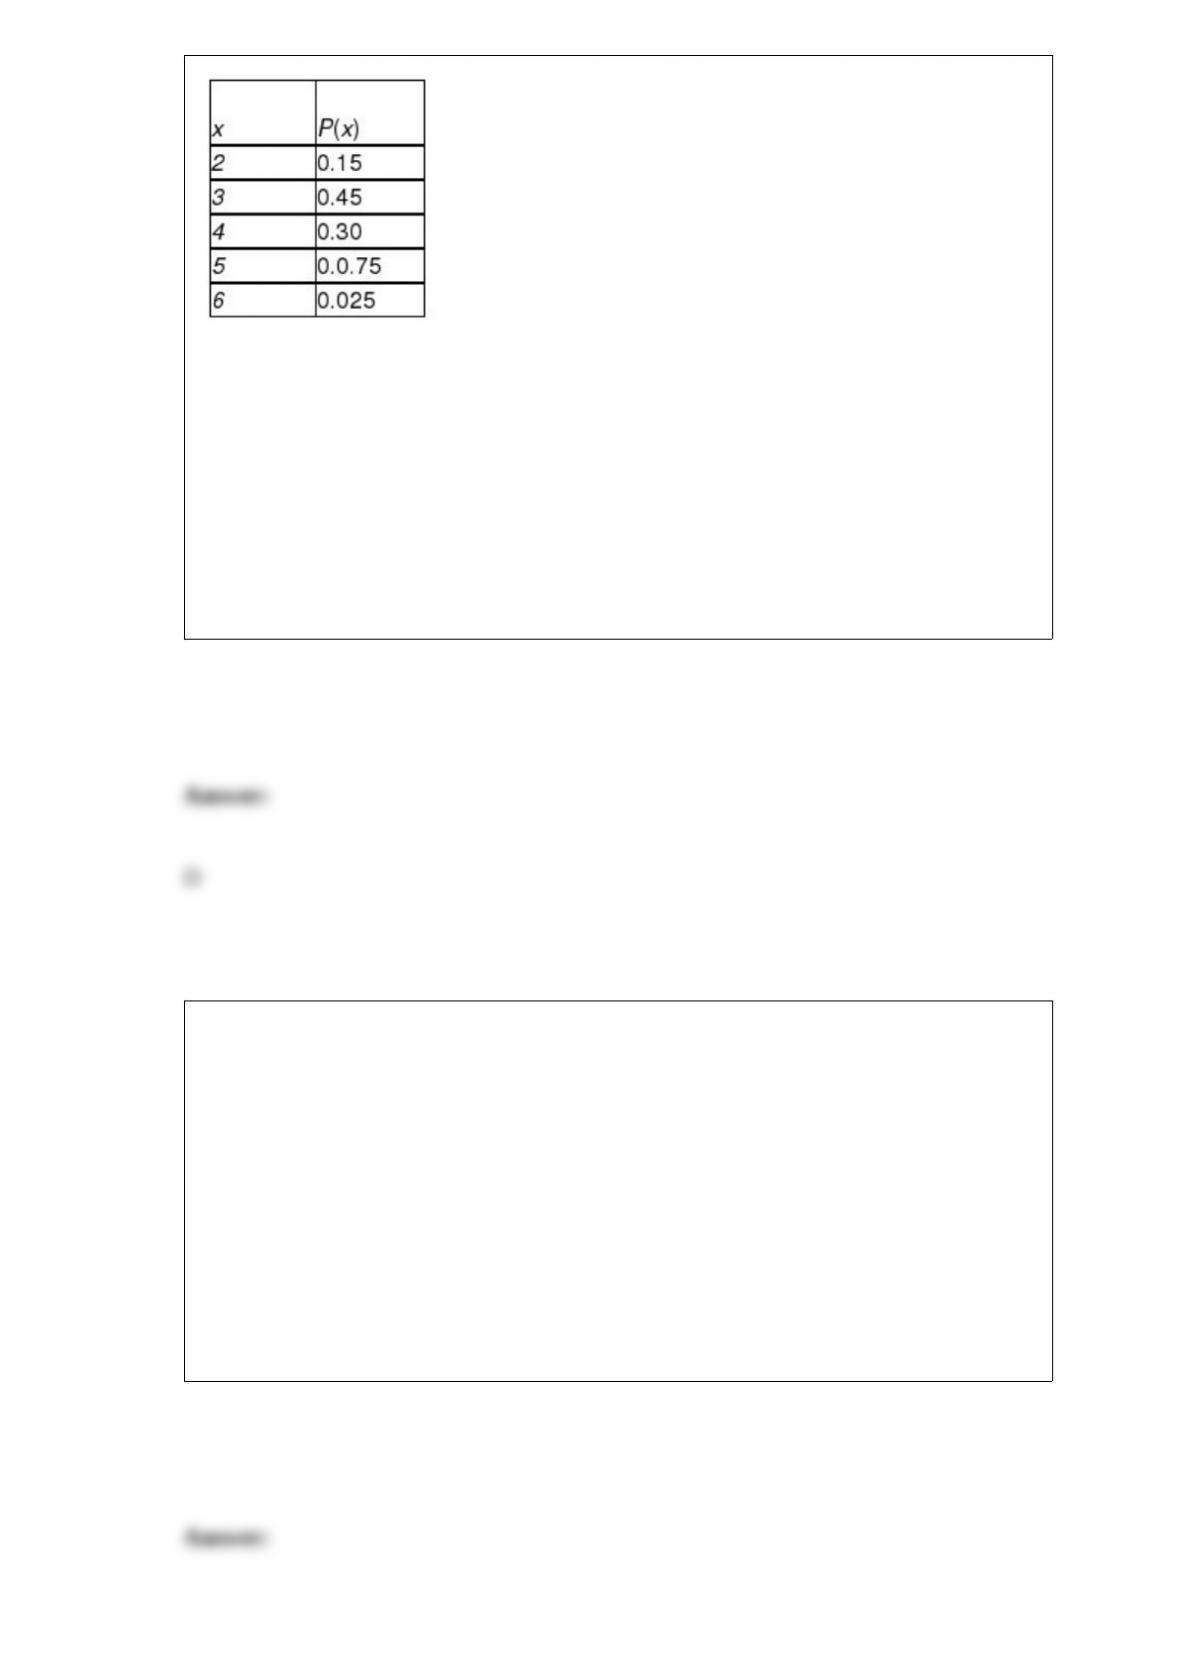
What is the average lead time for the component?
A) 2.375
B) 2.875
C) 3.275
D) 3.375
Which of the following statements is correct?
A) A scatter plot showing two variables with a positive linear relationship will have all
points on a straight line.
B) The stronger the linear relationship between two variables, the closer the correlation
coefficient will be to 1.0.
C) Two variables that are uncorrelated with one another may still be related in a
nonlinear manner.
D) All of the above are correct.
If a sample of n = 30 people is selected and the sample correlation between two
variables is r = 0.468, what is the test statistic value for testing whether the true
population correlation coefficient is equal to zero?
A) About t = 2.80
B) About t = -.3.01
C) t = 2.0484
D) Can’t be determined without knowing the level of significance for the test.
A test is conducted to compare three different income tax software packages to
determine whether there is any difference in the average time it takes to prepare income
tax returns using the three different software packages. Ten different persons’ income
tax returns are done by each of the three software packages and the time is recorded for
each. The computer results are shown below.
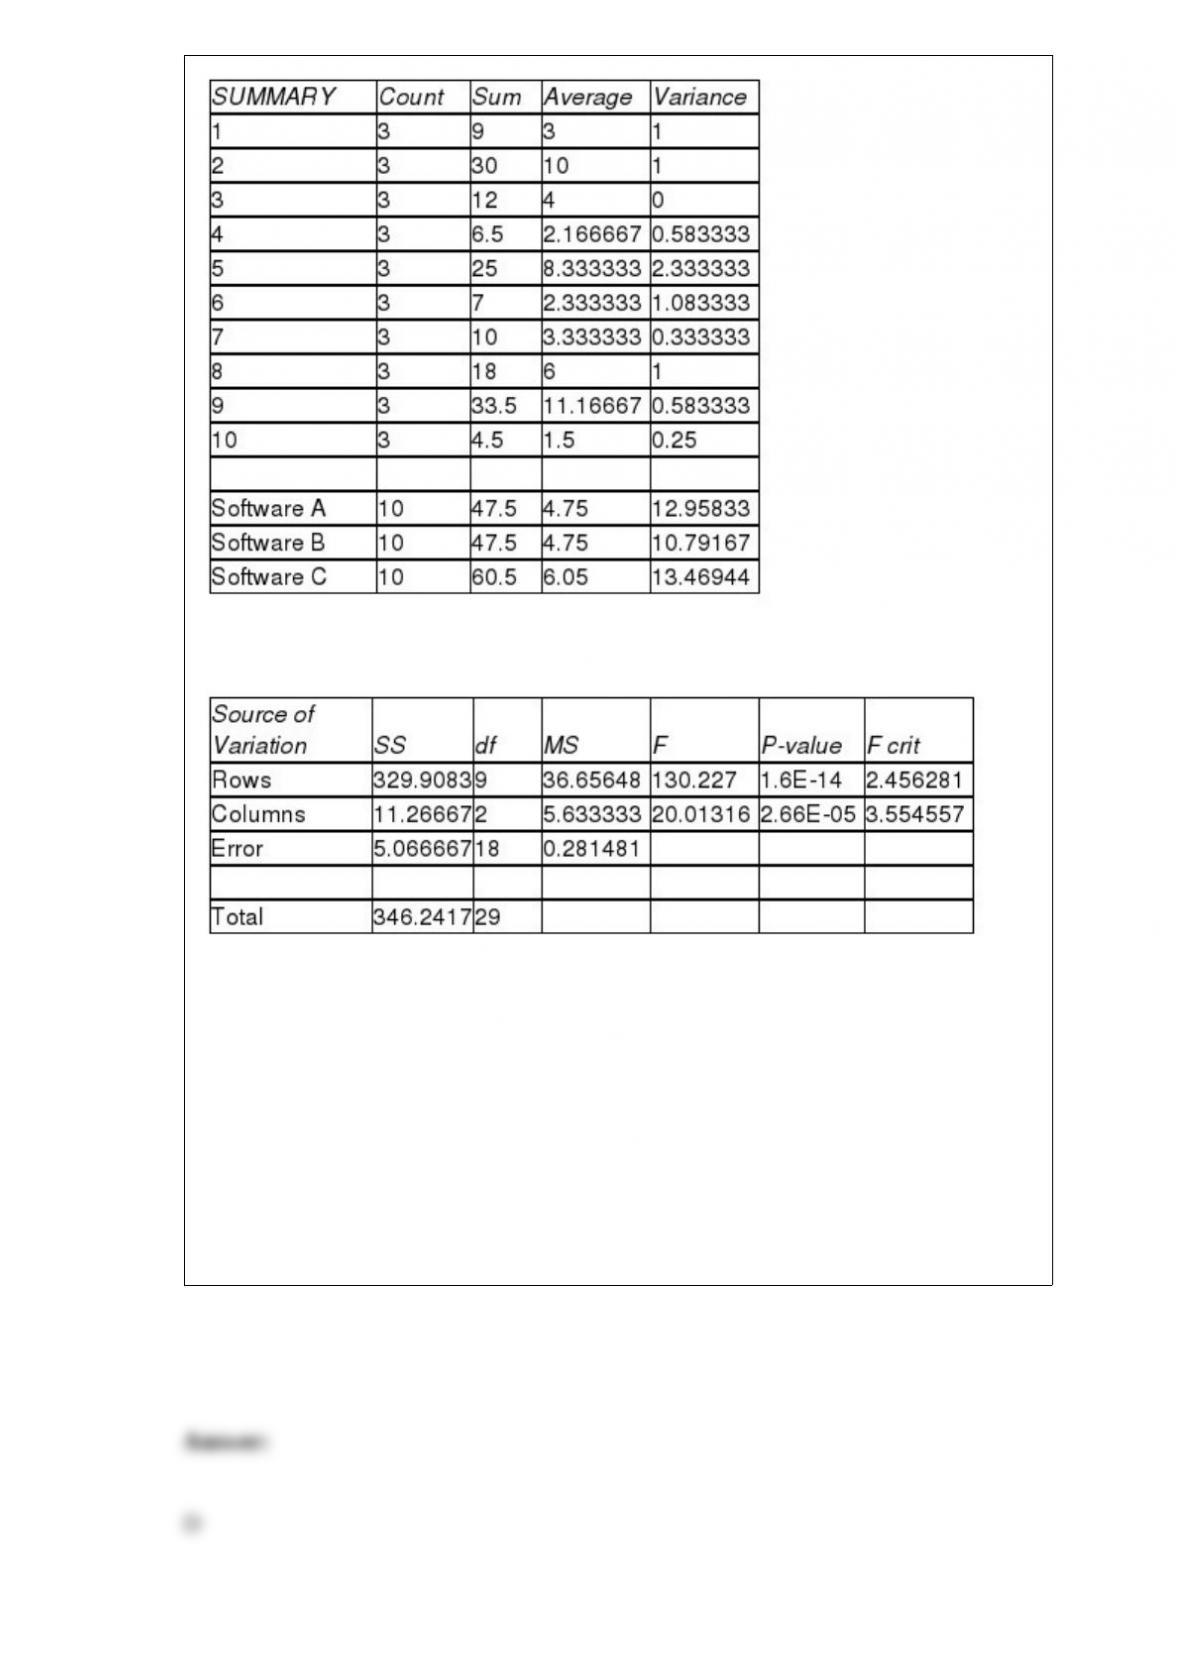
ANOVA
Based on these results and using a 0.05 level of significance which is correct regarding
blocking?
A) Blocking was not effective because p-value = 2.66 is greater than 0.05.
B) Blocking was effective because p-value = 2.66E – 5 is less than 0.05.
C) Blocking was not effective because p-value = 1.6 is greater than 0.05.
D) Blocking was effective because p-value = 1.6E-14 is less than 0.05.

A researcher is using a chi-square test to determine whether there are any preferences
among 4 brands of orange juice. With alpha = 0.05 and n = 30, the critical region for the
hypothesis test would have a boundary of:
A) 7.81
B) 8.71
C) 8.17
D) 42.25
The Vardon Exploration Company is getting ready to leave for South America to
explore for oil. One piece of equipment requires 10 batteries that must operate for more
than 2 hours. The batteries being used have a 15 percent chance of failing within 2
hours. The exploration leader plans to take 15 batteries. Assuming that the conditions of
the binomial apply, the probability that the supply of batteries will not contain enough
good ones to operate the equipment is:
A) 0.0449
B) 0.0132
C) 0.9832
D) 0.0168
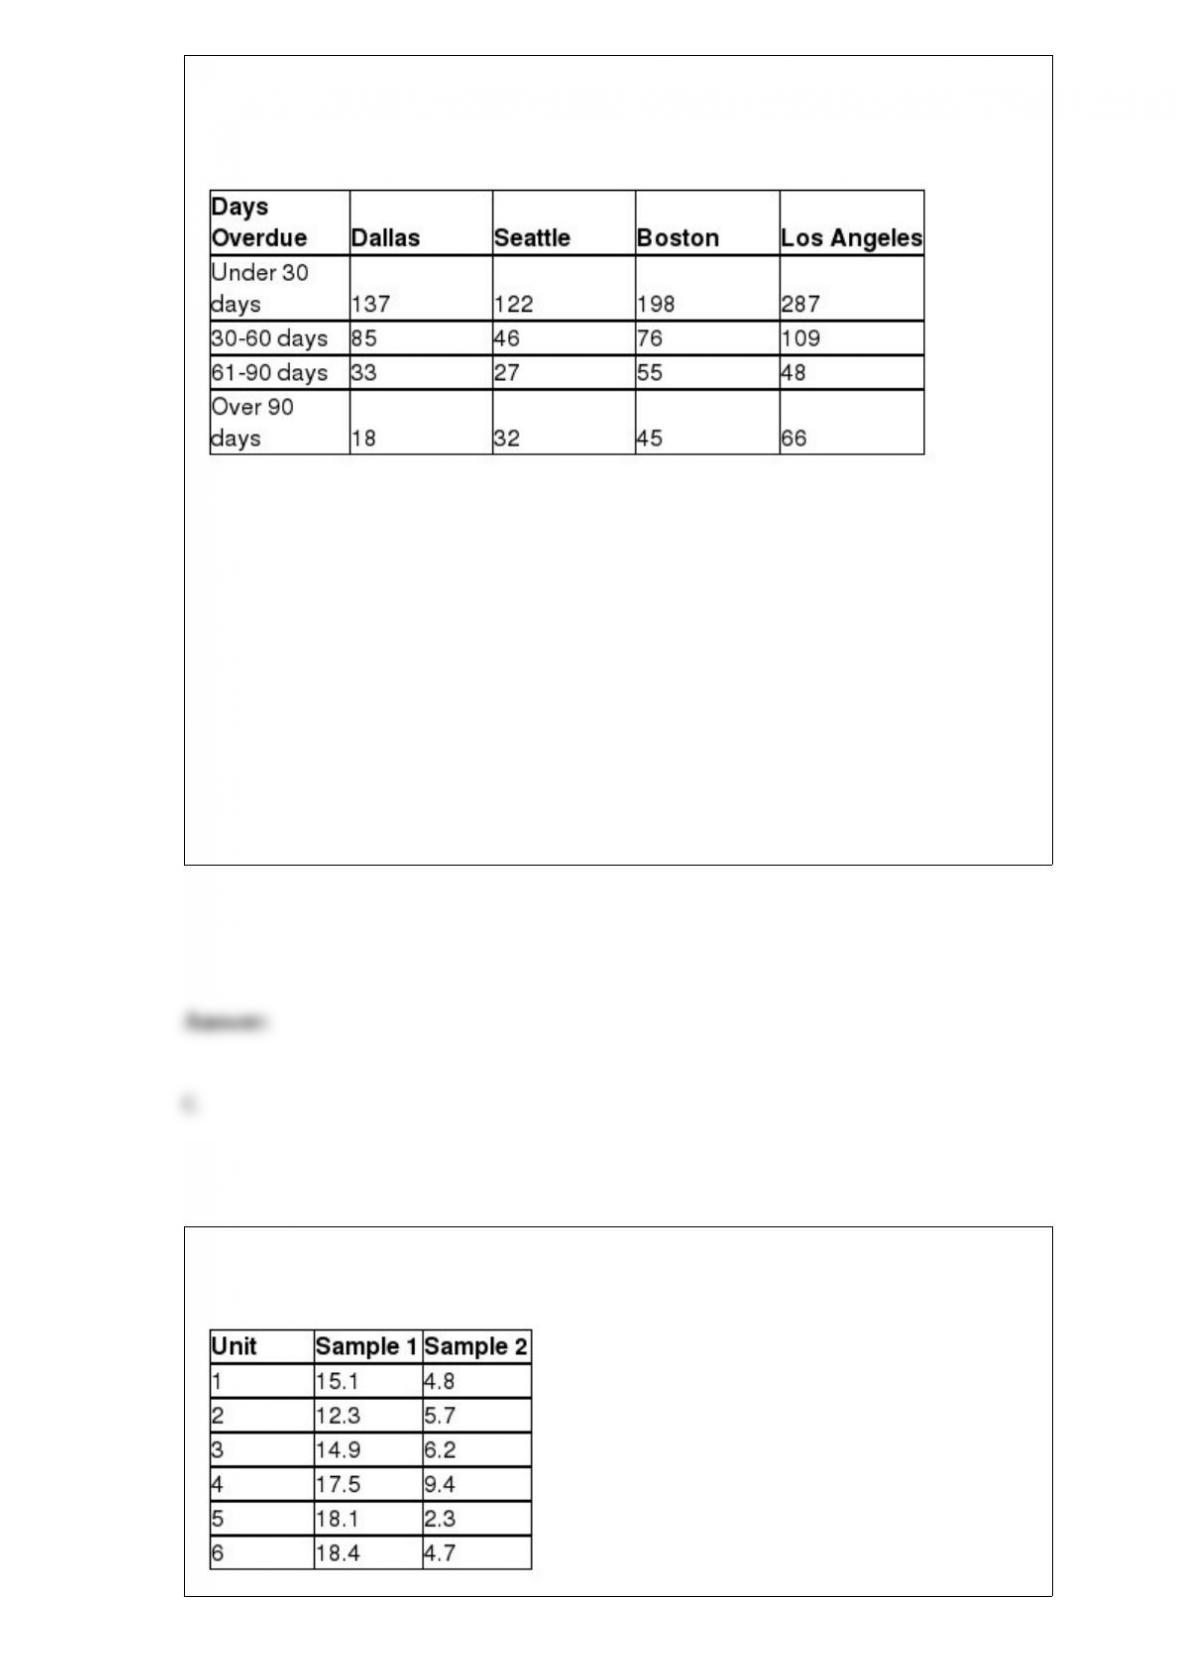
Micron Technology has sales offices located in four cities: Dallas, Seattle, Boston, and
Los Angeles. An analysis of the company’s accounts receivables reveals the number of
overdue invoices by days, as shown here.
Assume the invoices are stored and managed from a central database.
What is the probability that a randomly selected invoice from the database is between
30 and 90 days overdue?
A) 0.2702
B) 0.0231
C) 0.3461
D) 0.7765
The following samples are observations taken from the same elements at two different
times:
Assume that the populations are normally distributed and construct a 90% confidence
interval for the difference in the means of the distribution at the times in which the
samples were taken.
A) (7.6232, 13.4434)
B) (5.2825, 15.8127)
C) (6.8212, 14.7821)
D) (7.4122, 14.6801)
The National Club Association does periodic studies on issues important to its
membership. The 2012 Executive Summary of the Club Managers Association of
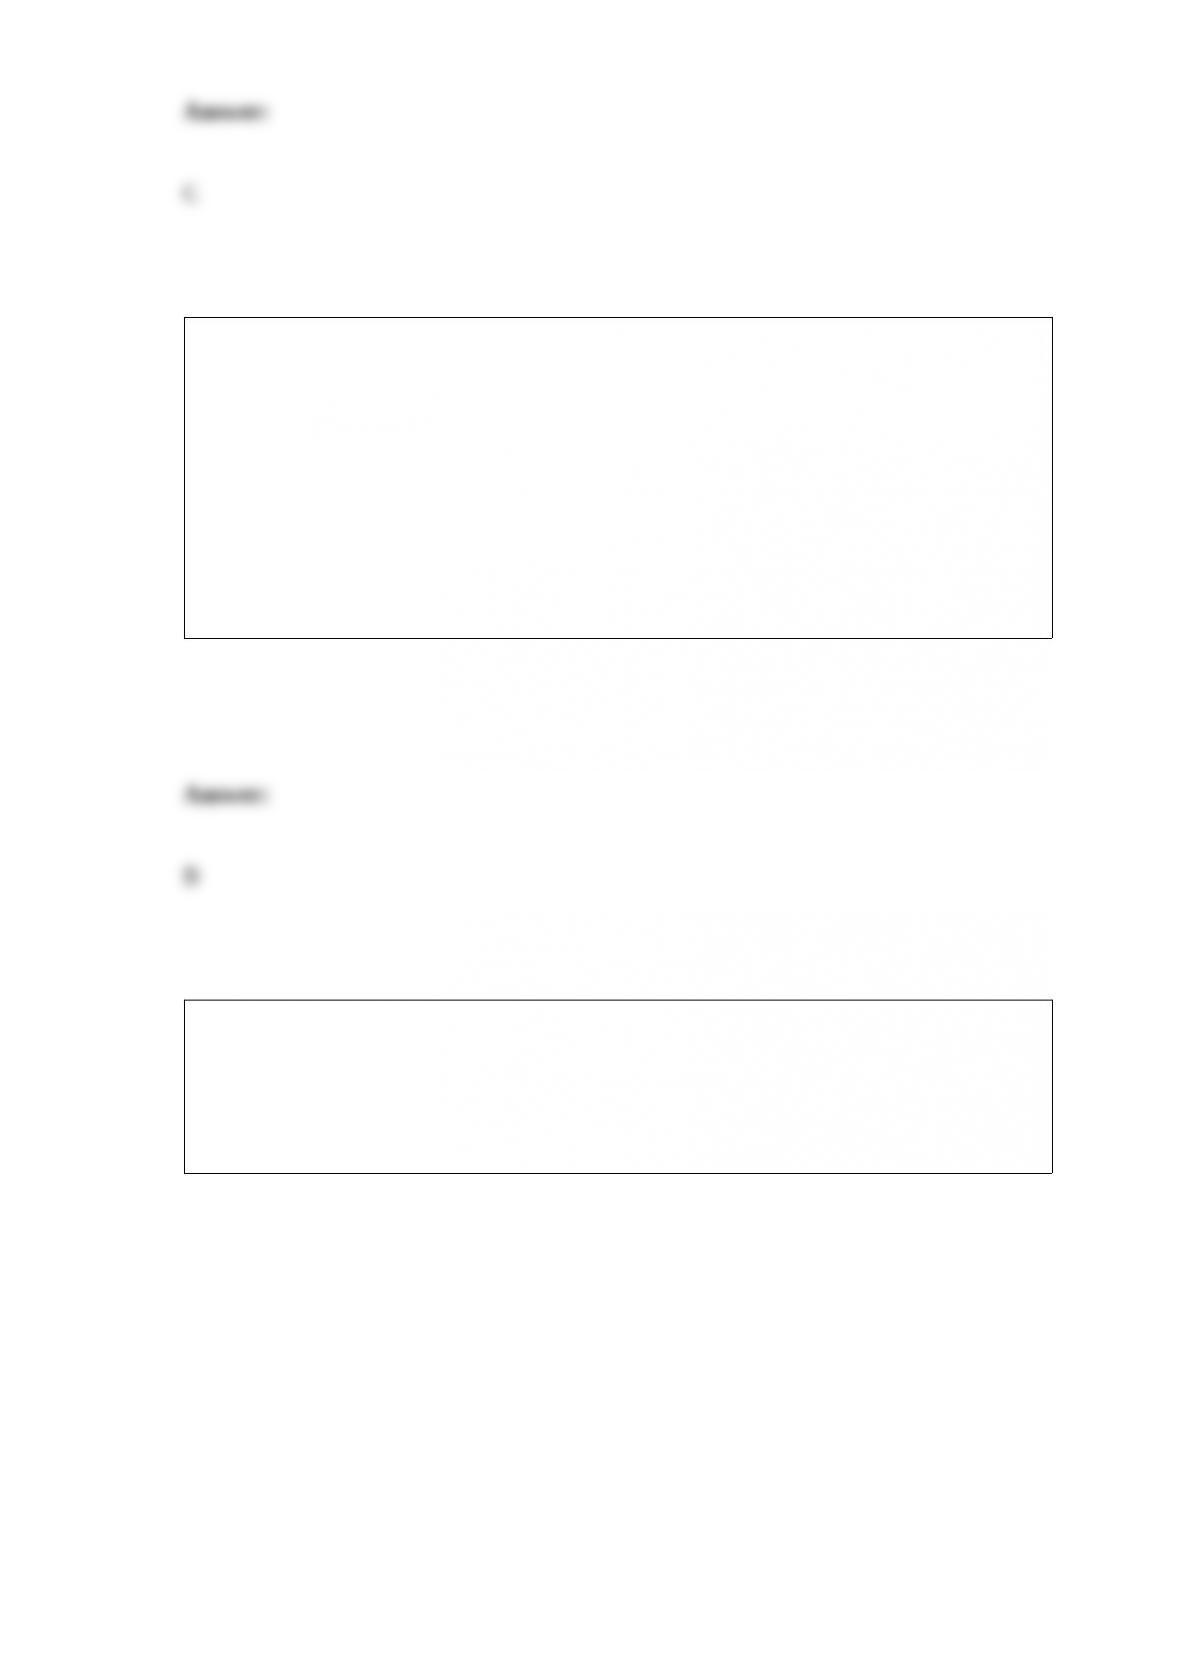
America reported that the average country club initiation fee was $31,912. Suppose a
random sample taken in 2009 of 12 country clubs produced the following initiation
fees:
Based on the sample information, can you conclude at the α = 0.05 level of significance
that the average 2009 country club initiation fees are lower than the 2008 average?
Conduct your test at the level of significance.
A) Because t = -0.4324 is not less than t critical = -1.4512, do not reject Ho. The 2009
average country club initiation fee is not less than the 2008 average.
B) Because t = -0.4324 is not less than t critical = -1.4512, reject Ho. The 2009 average
country club initiation fee is less than the 2008 average.
C) Because t = -0.5394 is not less than t critical = -1.7959, do not reject Ho. The 2009
average country club initiation fee is not less than the 2008 average.
D) Because t = -0.5394 is not less than t critical = -1.7959, reject Ho. The 2009 average
country club initiation fee is less than the 2008 average.
If the hypothesis test you are conducting is a two-tailed test, which of the following is a
possible step that you could take to increase the power of the test?
A) Reduce the sample size
B) Increase alpha
C) Increase beta
D) Use the t-distribution
The editors of a national automotive magazine recently studied 30 different automobiles
sold in the United States with the intent of seeing whether they could develop a multiple
regression model to explain the variation in highway miles per gallon. A number of
different independent variables were collected. The following regression output (with
some values missing) was recently presented to the editors by the magazine’s analysts:
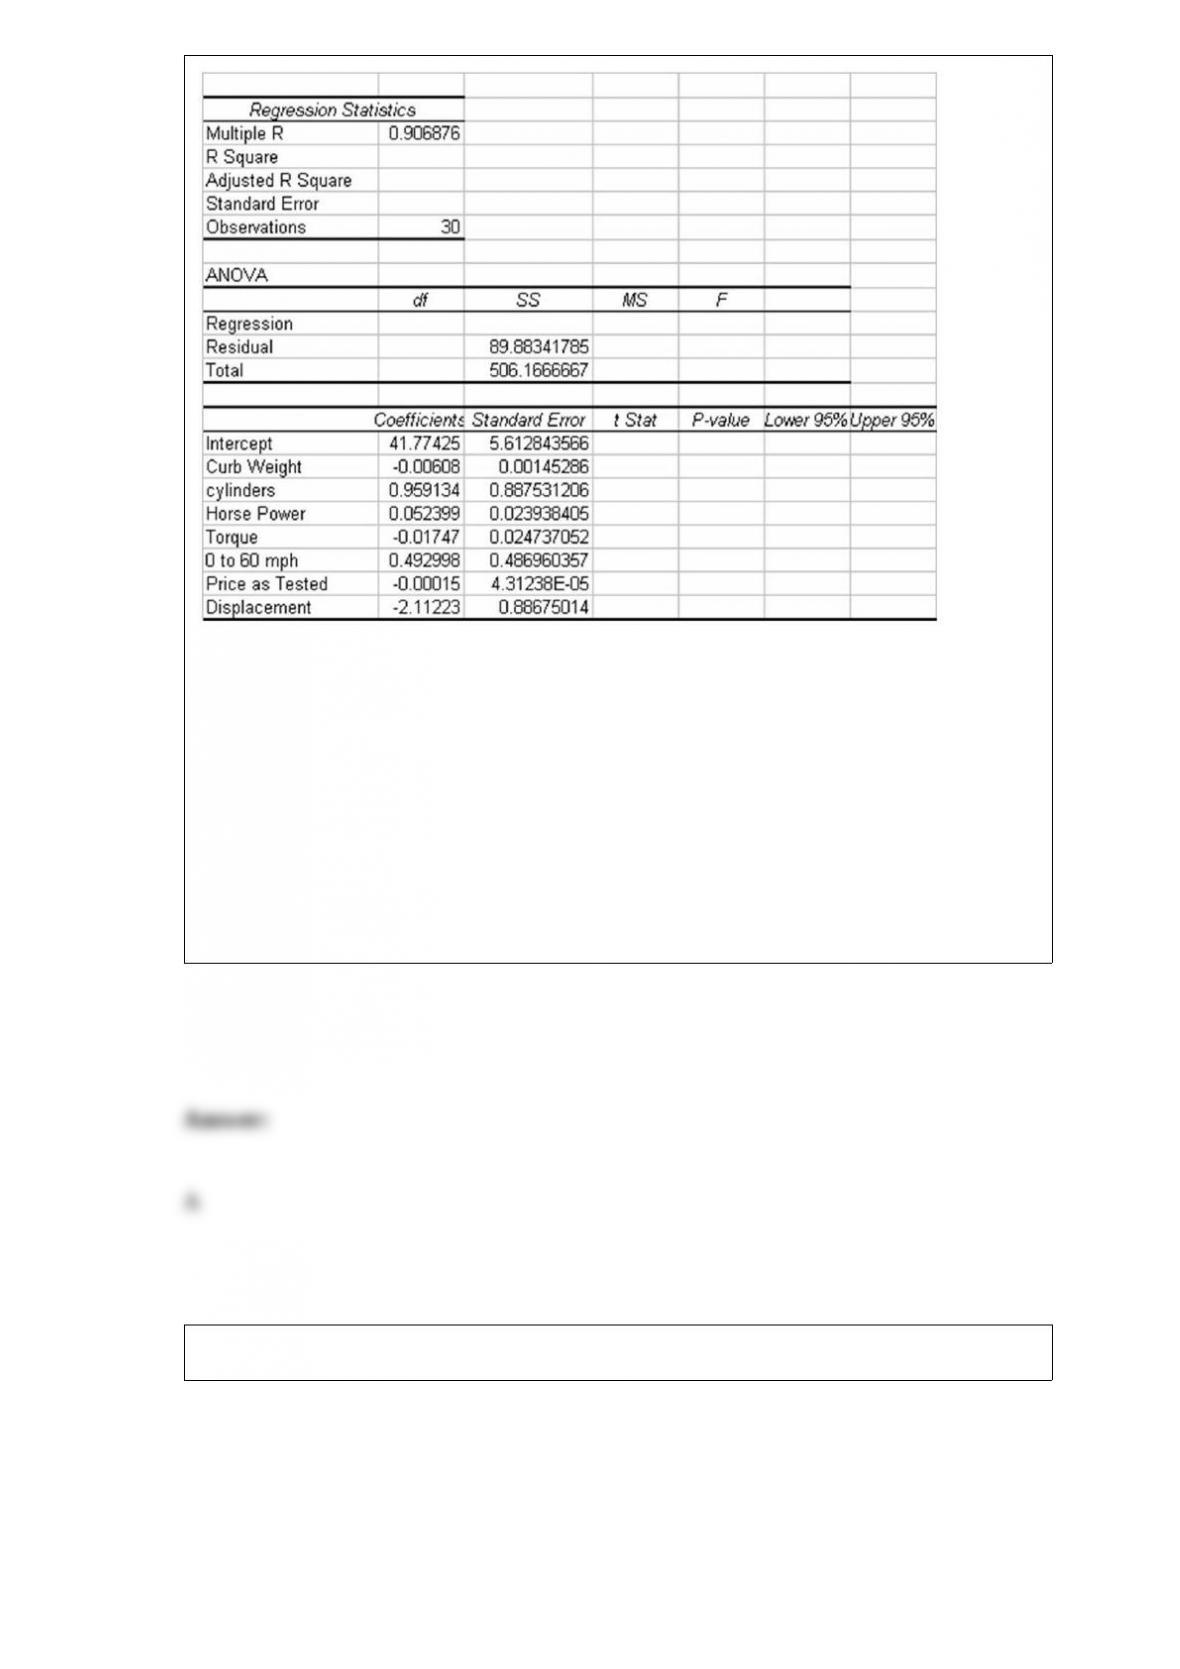
Based on this output and your understanding of multiple regression analysis, what
percentage of variation in the dependent variable is explained by the regression model?
A) Approximately 82 percent
B) Over 90 percent
C) About 37 percent
D) None of the above
Given the following sample data
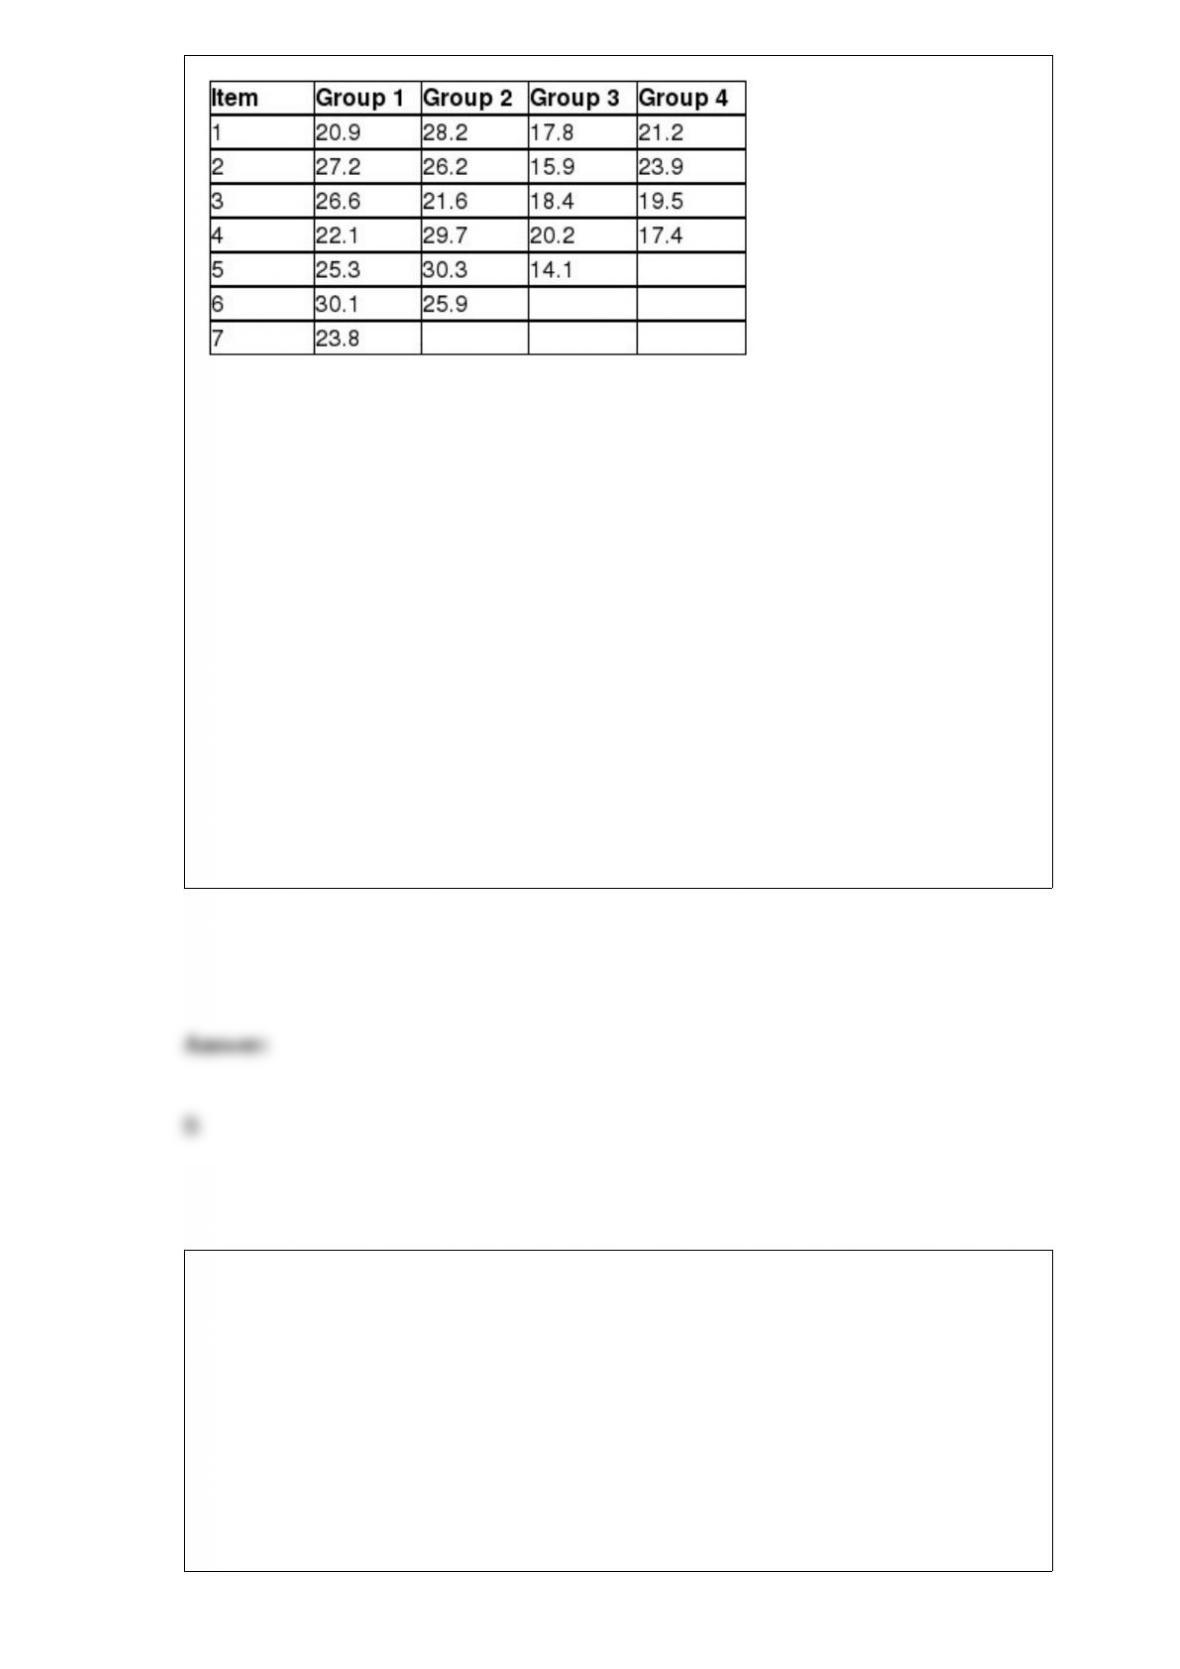
Based on the computations for the within- and between-sample variation, develop the
ANOVA table and test the appropriate null hypothesis using alpha= 0.05. Use the
p-value approach.
A) Since p-value = 0.0678 > 0.05 reject H0 and conclude that at least two population
means are different.
B) Since p-value = 0.000136 < 0.05 reject H0 and conclude that at least two population
means are different.
C) Since p-value = 0.0678 > 0.05 accept H0 and conclude that all population means are
the same.
D) Since p-value = 0.000136 < 0.05 accept H0 and conclude that all population means
are the same.
If two variables show a positive linear relationship in a scatter diagram:
A) most of the data values will plot in the lower left-hand quadrant.
B) most of the data values will plot in the lower left-hand and upper right-hand
quadrants.
C) most of the data values will cluster close to the x and y axes.
D) the data will cluster in the center of the graph.

A recent study of 15 shoppers showed that the correlation between the time spent in the
store and the dollars spent was 0.235. Using a significance level equal to 0.05, which of
the following is the test statistic for testing whether the true population correlation is
equal to zero?
A) t = 0.245
B) t = 1.76
C) t = 2.1604
D) t = 0.872
If a two-tailed Wilcoxon Matched-Pairs Signed Rank test is conducted for a sample of n
= 8 and an alpha level equal to .05, the critical value is:
A) 4
B) 1.96
C) 30
D) 2
Woof Chow Dog Food Company believes that it has a market share of 25 percent. It
surveys n = 100 dog owners and ask whether or not Woof Chow is their regular brand
of dog food, and 23 people say yes. Based upon this information, what is the critical
value if the hypothesis is to be tested at the 0.05 level of significance?
A) 1.28
B) 1.645
C) 1.96
D) 2.575
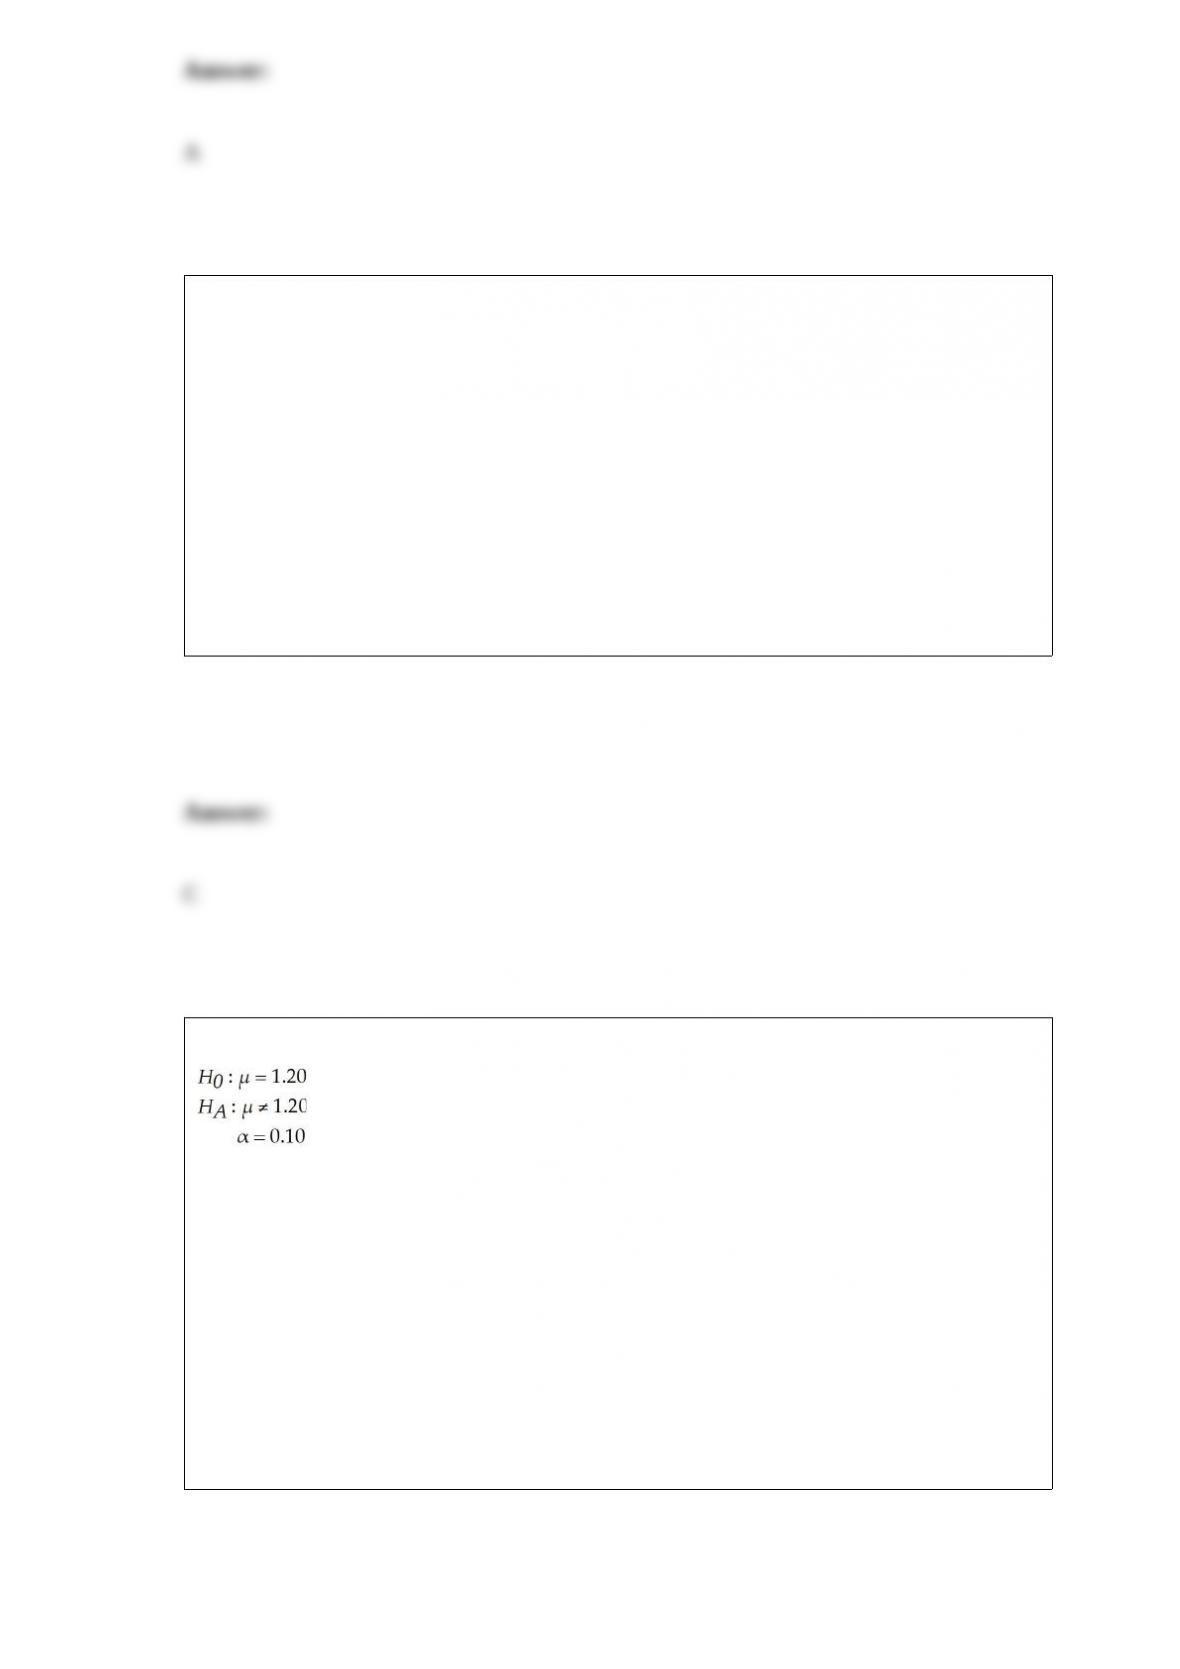
You are given the following null and alternative hypotheses:
If the true population mean is 1.25, calculate the power of the test. Assume the
population standard deviation is known to be 0.50 and the sample size is 60.
A) 0.49
B) 0.20
C) 0.96
D) 0.60

If a stratified random sample is to be conducted, which of the following is true?
A) The population will be broken down into subgroups called strata.
B) Each subgroup should contain items that are homogeneous with respect to the
characteristic of interest.
C) If effective, the total required sample size should be less than that which would be
needed if a simple random sample were selected.
D) All of the above.
A sample of 25 observations is taken to estimate a population proportion π. The
sampling distribution of sample proportion p is:
A) not normal since n < 30.
B) approximately normal because is always normally distributed.
C) approximately normal if np ≥ 5 and n(1 – p) ≥ 5.
D) approximately normal if p approaches 0.50.
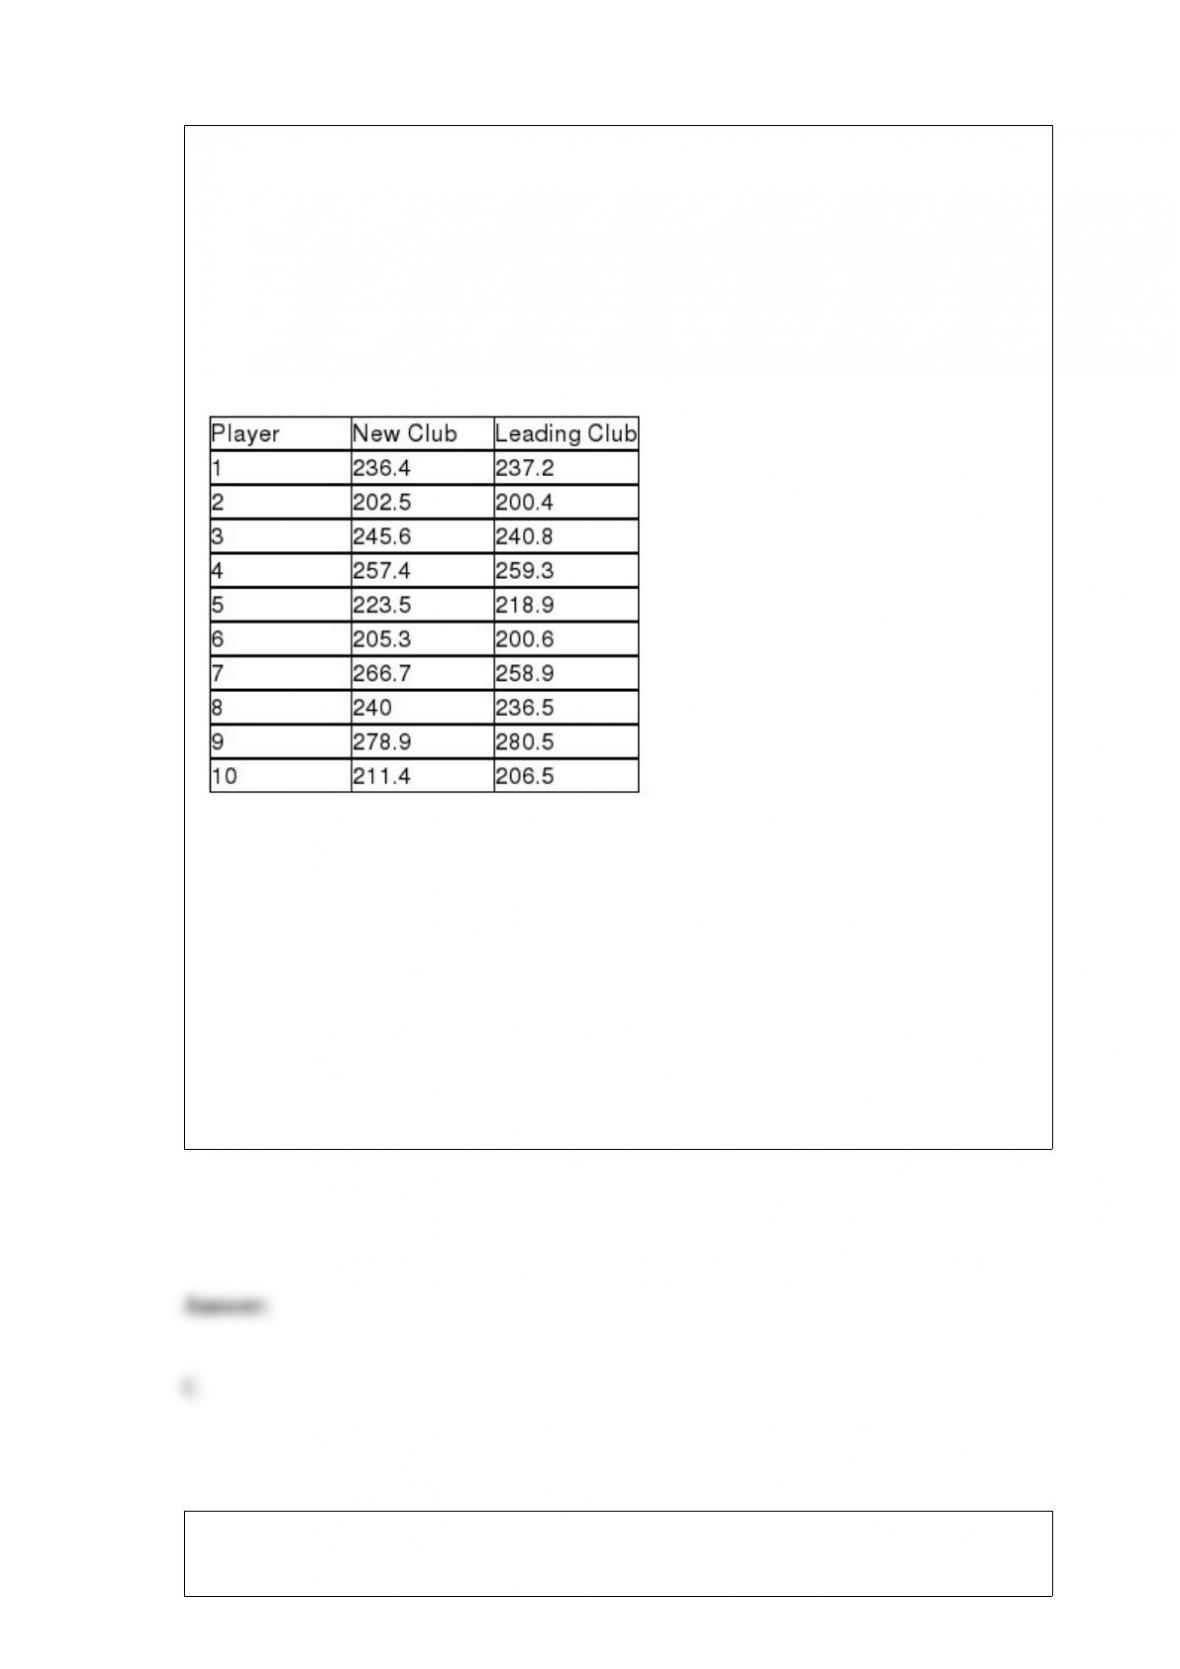
Most companies that make golf balls and golf clubs use a one-armed robot named “Iron
Byron” to test their balls for length and accuracy, but because of swing variations by
real golfers, these test robots don’t always indicate how the clubs will perform in actual
use. One company in the golfing industry is interested in testing its new driver to see if
it has greater length off the tee than the best-selling driver. To do this, it has selected a
group of golfers of differing abilities and ages. Its plan is to have each player use each
of the two clubs and hit five balls. It will record the average length of the drives with
each club for each player. The resulting data for a sample of 10 players are:
What is an appropriate null hypothesis to be tested?
A) H0 : μ1 = μ2
B) H0 : μ1 ≥ μ2
C) H0 : μd ≤ 0
D) H0 : μD = 0
A mail-order business prides itself in its ability to fill customers’ orders in six calendar
days or less on the average. Periodically, the operations manager selects a random

sample of customer orders and determines the number of days required to fill the
orders. Based on this sample information, he decides if the desired standard is not being
met. He will assume that the average number of days to fill customers’ orders is six or
less unless the data suggest strongly otherwise. On one occasion where a sample of 40
customers was selected, the average number of days was 6.65, with a sample standard
deviation of 1.5 days. Can the operations manager conclude that his mail-order business
is achieving its goal? Use a significance level of 0.025 to answer this question.
A) Since 2.2216 < 2.4511, reject H0 and conclude that the mail-order business is not
achieving its goal
B) Since 2.7406 > 2.023, reject H0 and conclude that the mail-order business is not
achieving its goal.
C) Since 2.4421 > 2.023, reject H0 and conclude that the mail-order business is not
achieving its goal.
D) Since 2.2346 < 2.5113, reject H0 and conclude that the mail-order business is not
achieving its goal.
In an effort to estimate the mean dollars spent per visit by customers of a food store, the
manager has selected a random sample of 100 cash register receipts. The mean of these
was $45.67 with a sample standard deviation equal to $12.30. Assuming that he wants
to develop a 90 percent confidence interval estimate, the upper limit of the confidence
interval estimate is:
A) about $2.02
B) approximately $65.90
C) about $47.69
D) None of the above

If we are testing for the difference between the means of two independent populations
with samples of n1 = 20 and n2 = 20, the number of degrees of freedom is equal to:
A) 39
B) 38
C) 19
D) 18
A large orchard owner in the state of Washington is interested in determining whether
the mean number of bushels of peaches per acre is the same or different depending on
the type of tree that is used. He also thinks that production may be affected by the type
of fertilizer that is used. To test, he has set up a test in which a one-acre plot of peach
trees with a combination each of 5 varieties and 3 fertilizer types are studied. In this
case, the number of treatments is:
A) 5
B) 3
C) 15
D) Can’t be determined without knowing how many trees are planted on each acre.
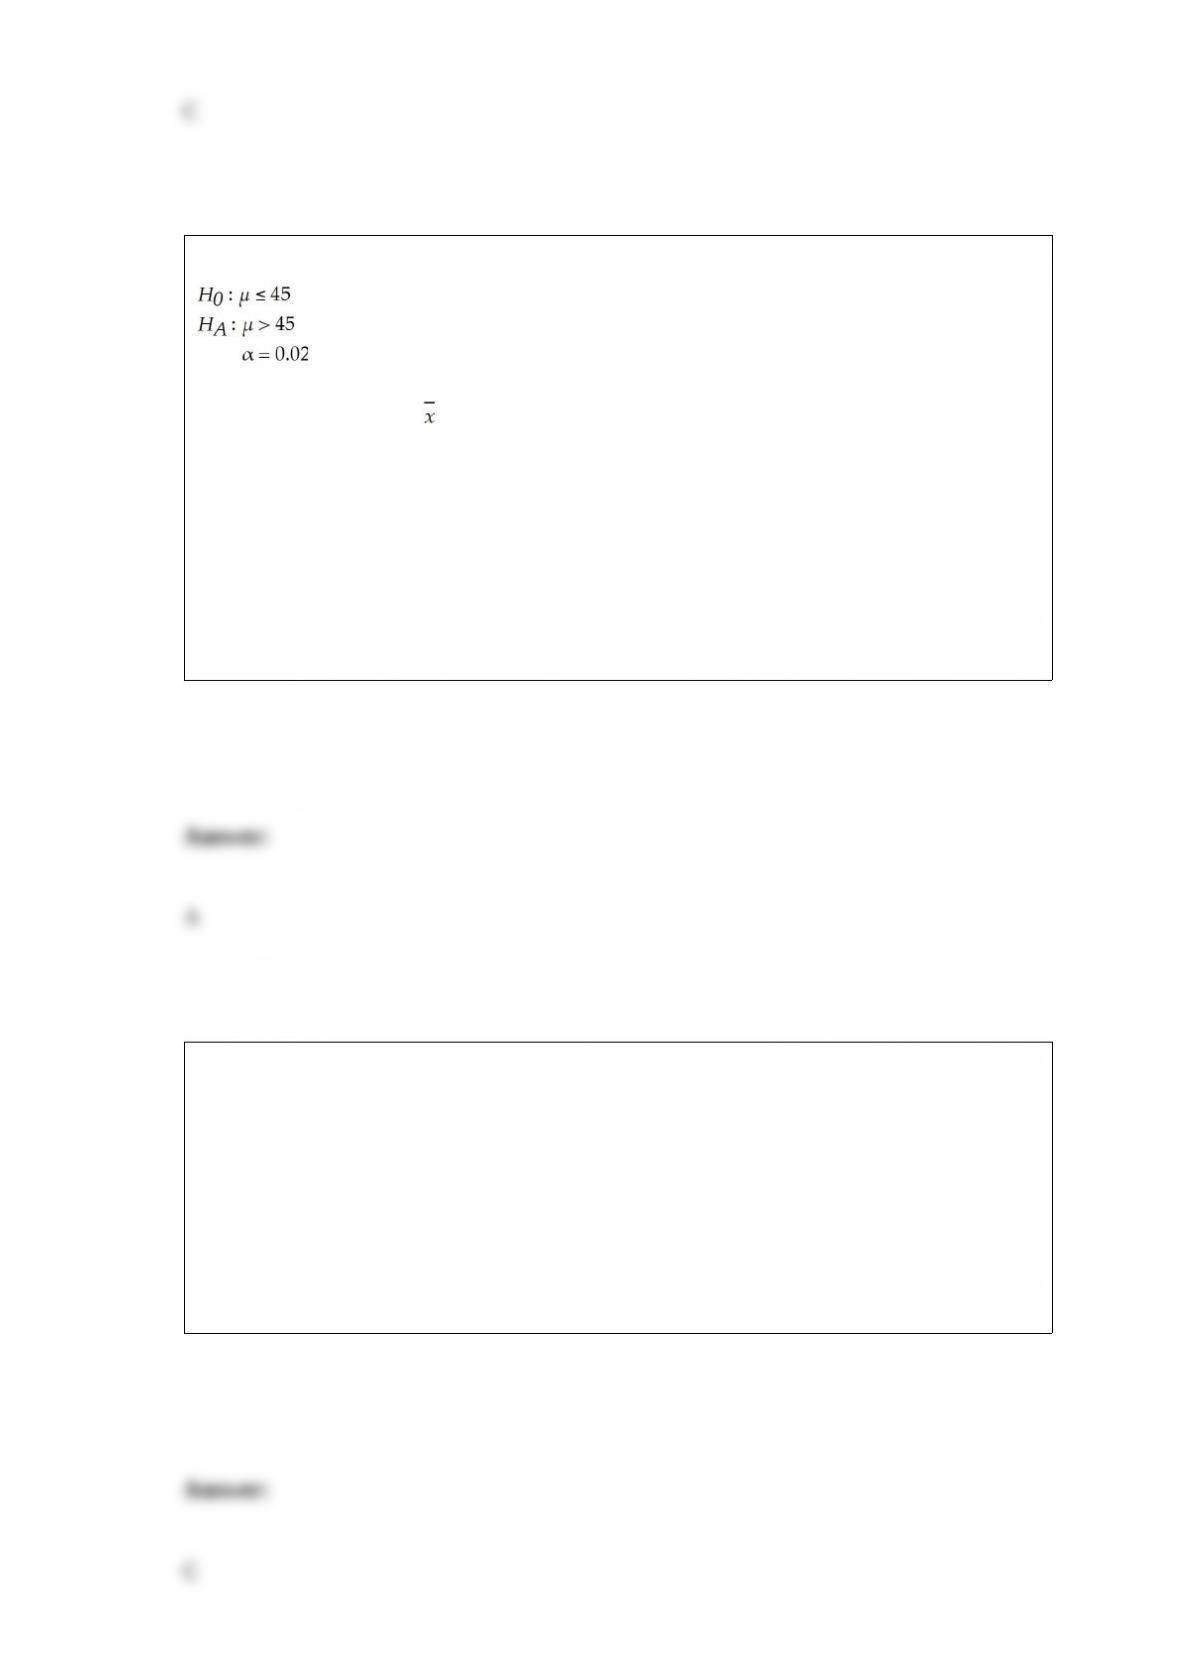
For the following hypothesis test:
With n = 80, σ = 9, and = 47.1, state the appropriate p-value.
A) 0.0183
B) 0.0314
C) 0.0512
D) 0.0218
Which type of ANOVA can include interaction?
A) One-way
B) Randomized complete block
C) Two-factor
D) All types of ANOVA

A company that fills soft drinks into bottles wishes to establish an -chart to monitor the
average fill level in the bottles. To do this, the company has taken a series of samples of
size n = 4 bottles. The overall average fill is 12.03 ounces. The average range for the
subgroups has been .06 ounces. Based on this information, what is the upper limit of the
3-sigma control limit?
A) .729
B) .0437
C) 12.09
D) 12.074