Holding everything else constant, a decrease in the price of GPS systems will result in
A) a decrease in the quantity of GPS systems demanded.
B) an increase in the demand for GPS systems.
C) a decrease in the supply of GPS systems.
D) an increase in the quantity of GPS systems demanded.
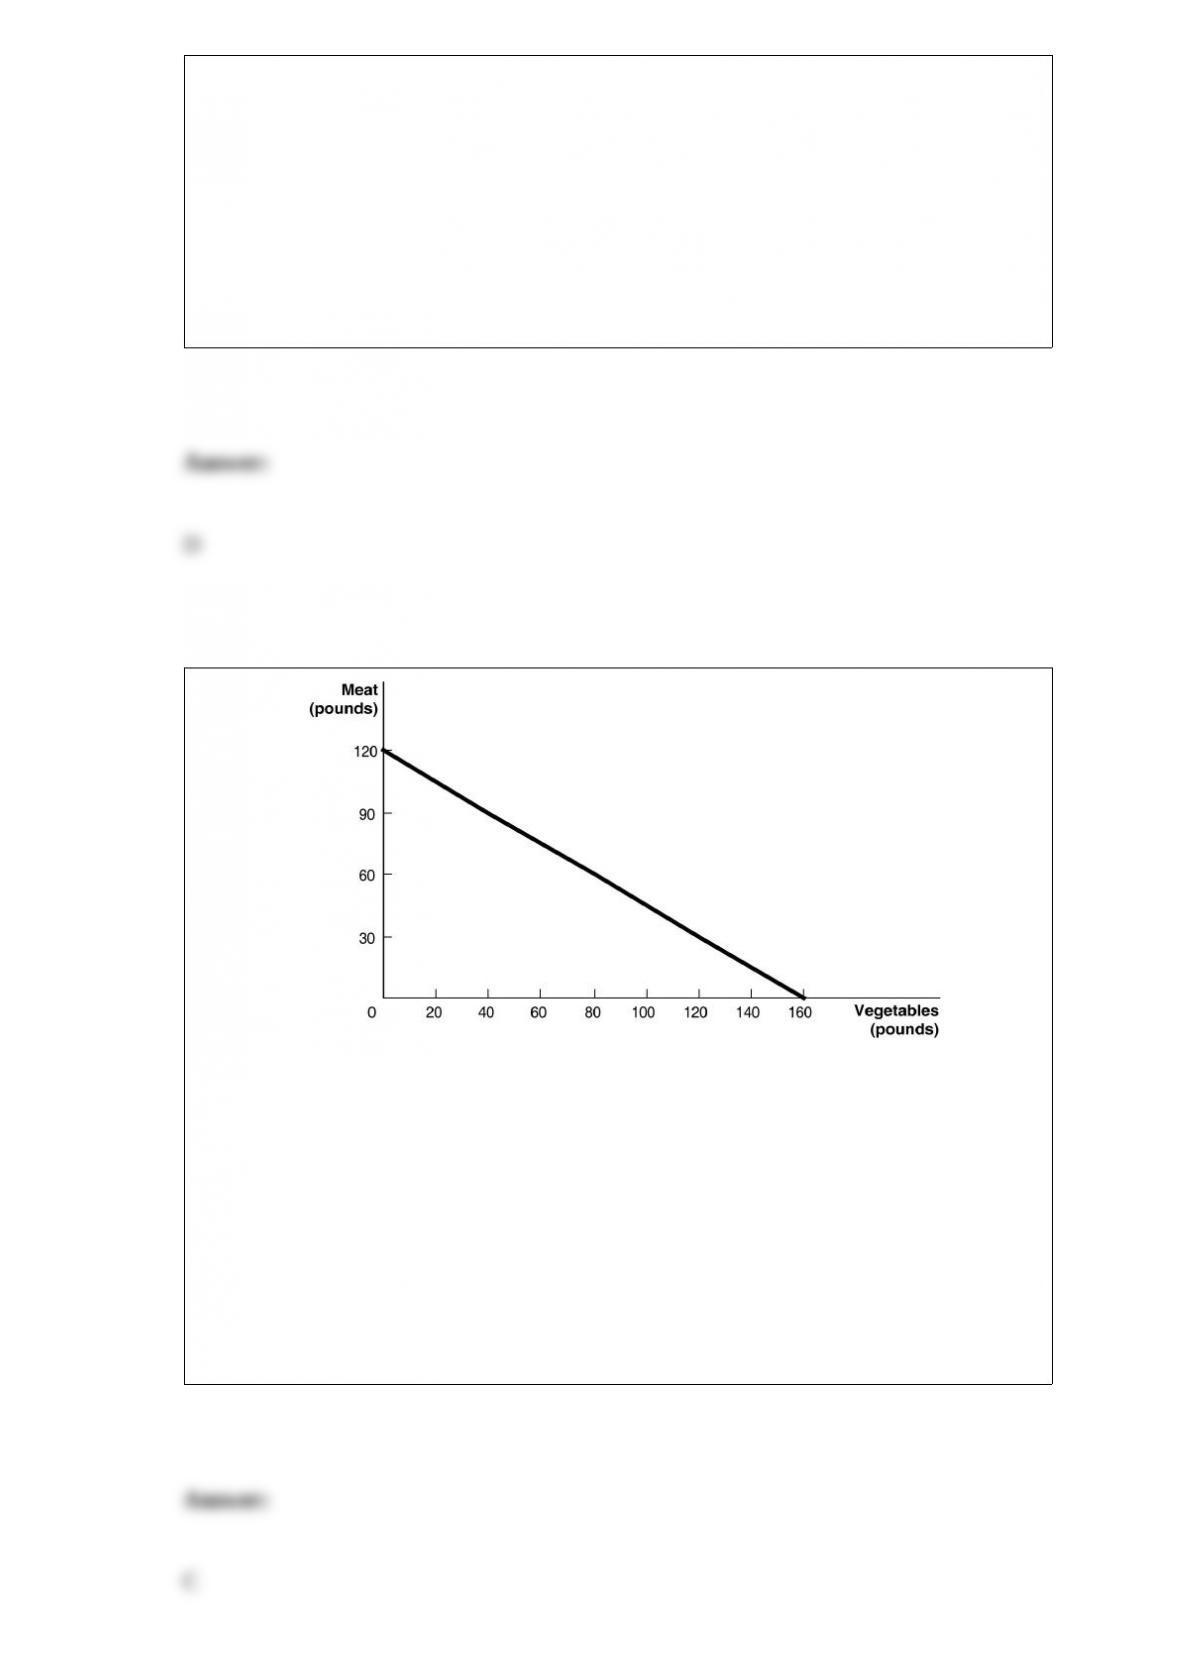
Figure 2-2 Figure
2-2 above shows the production possibilities frontier for Mendonca, an agrarian nation
that produces two goods, meat and vegetables. The linear production possibilities
frontier in the figure indicates that
A) Mendonca has a comparative advantage in the production of vegetables.
B) Mendonca has a comparative disadvantage in the production of meat.
C) the tradeoff between meat and vegetables is constant.
D) it is progressively more expensive to produce meat.
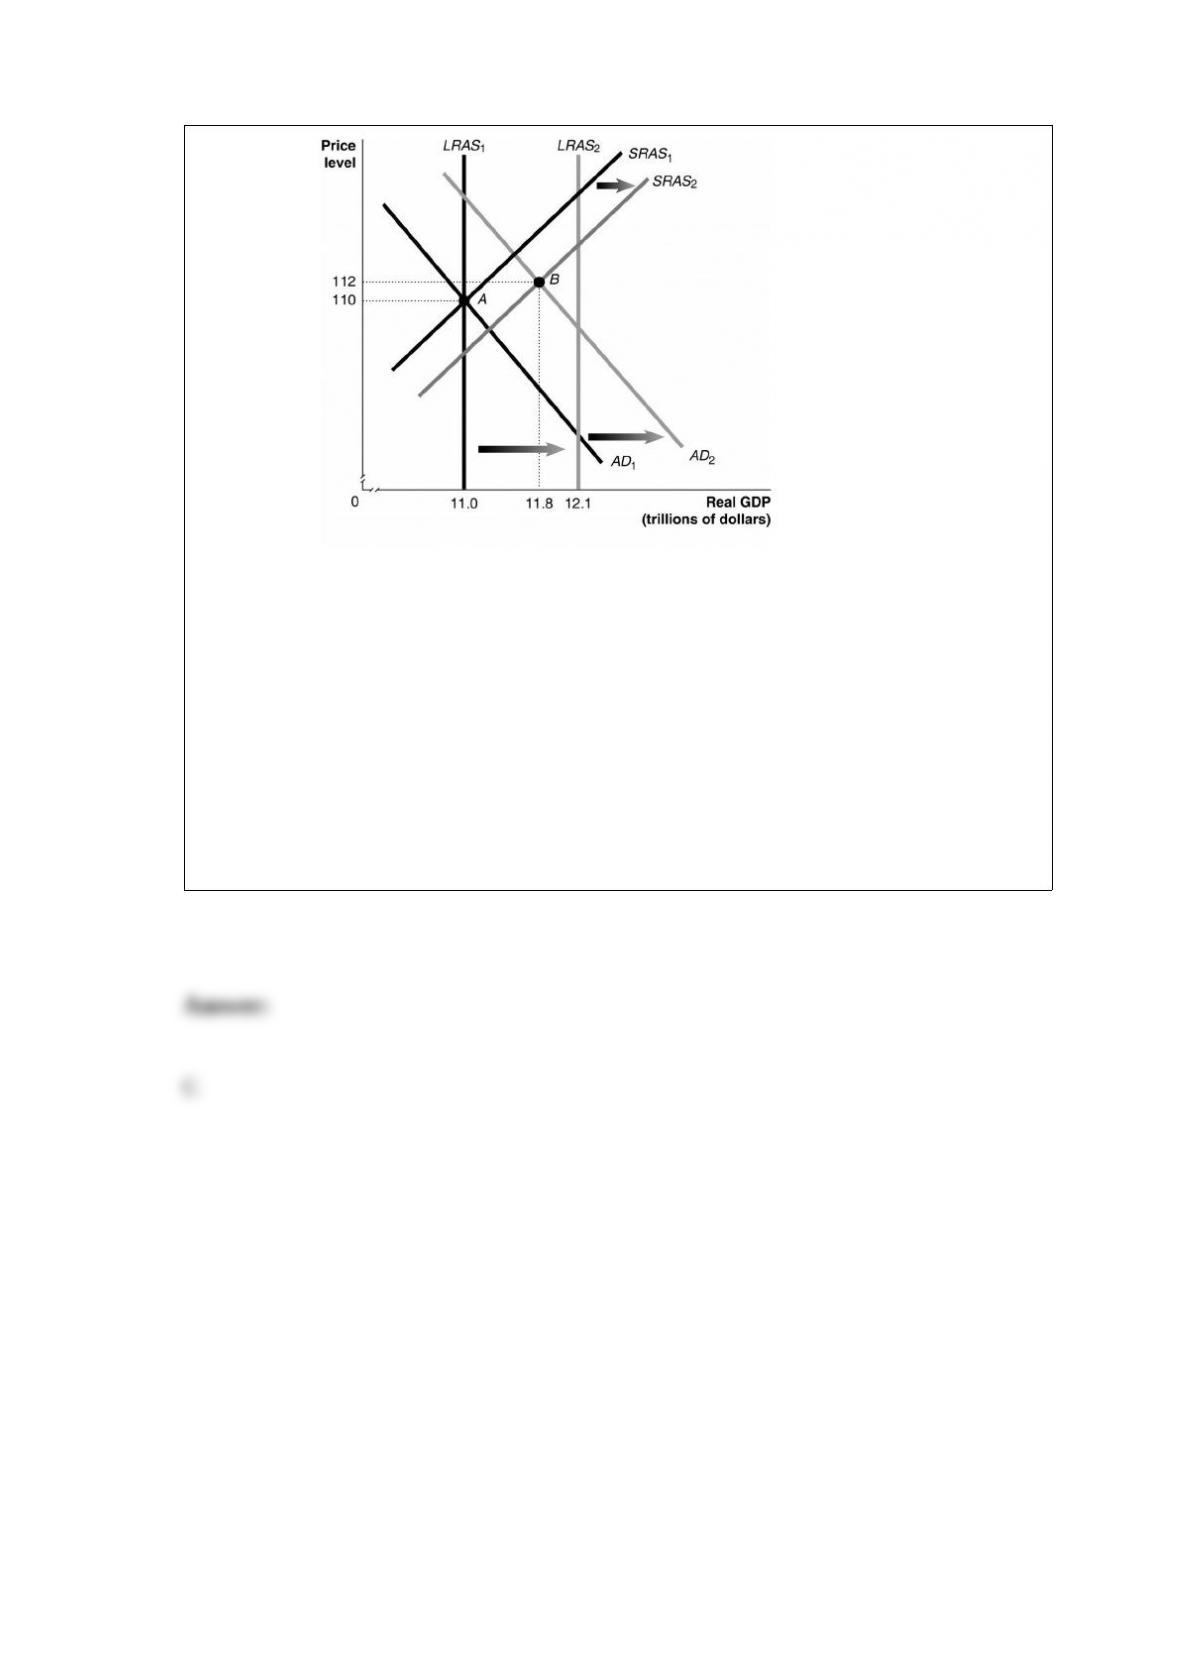
Figure 24-4
Given the economy is at point A in year 1, what is the difference between the actual
growth rate in GDP in year 2 and the potential growth rate in GDP in year 2?
A) 0.3%
B) 1.1%
C) 2.7%
D) 3.7%
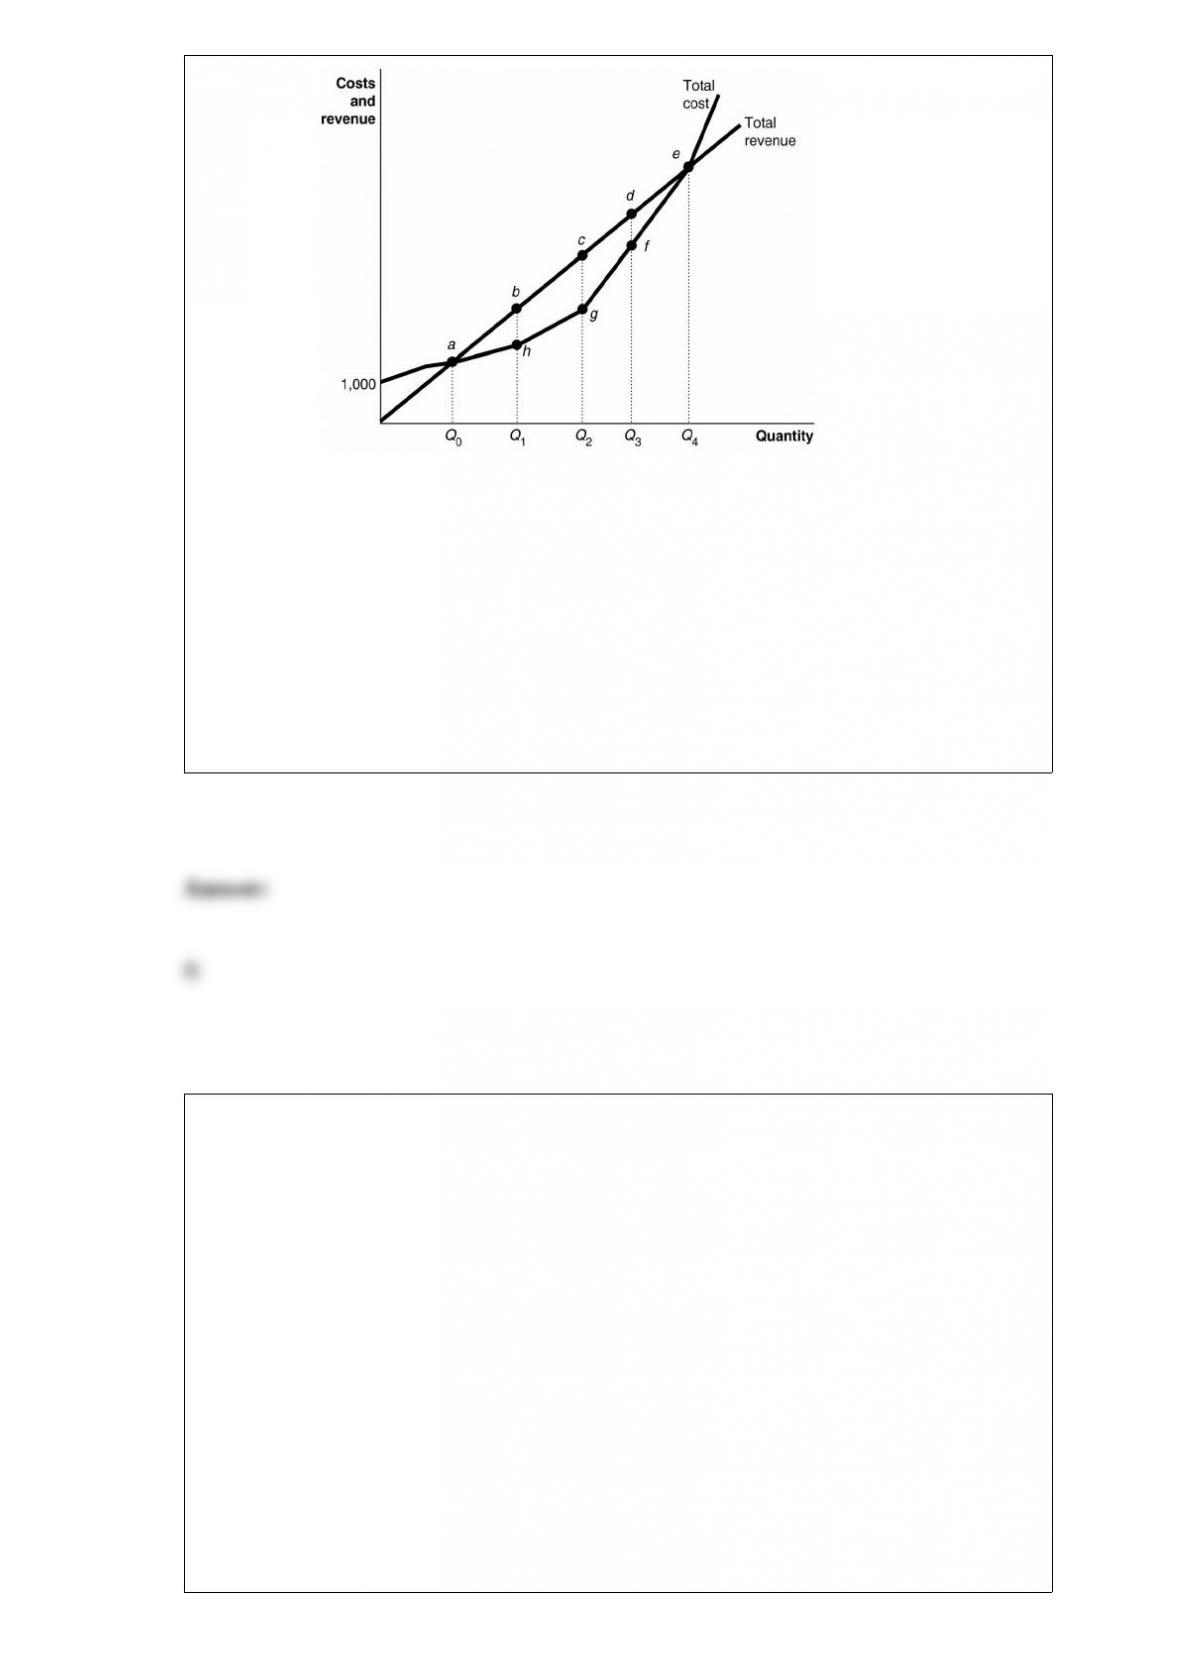
Figure 12-2
What happens if the firm produces more than Q4 units?
A) Its profit increases.
B) It makes a loss.
C) Its total revenue is increasing faster than its total cost.
D) It could make a profit or a loss depending on what happens to demand.
During a study session for an economics exam with three other students, Peter Daltry
commented on an example of a consumer who had to decide the on number of slices of
pizza and cups of Coca-Cola he would consume. Peter explained that “To maximize his
utility this consumer must equate the marginal utility per dollar for pizza and
Coca-Cola.” Was Peter’s analysis correct?
A) Peter described one of the conditions necessary for utility maximization. The
consumer also must equate the marginal utility of pizza and the marginal utility of cups
of Coca-Cola.
B) Peter’s statement is correct.
C) Peter’s statement is correct but we must also assume that the consumer is rational.
D) Peter describes one of the conditions necessary for utility maximization. The second
condition is that total spending on both goods must equal the amount available to be
spent.
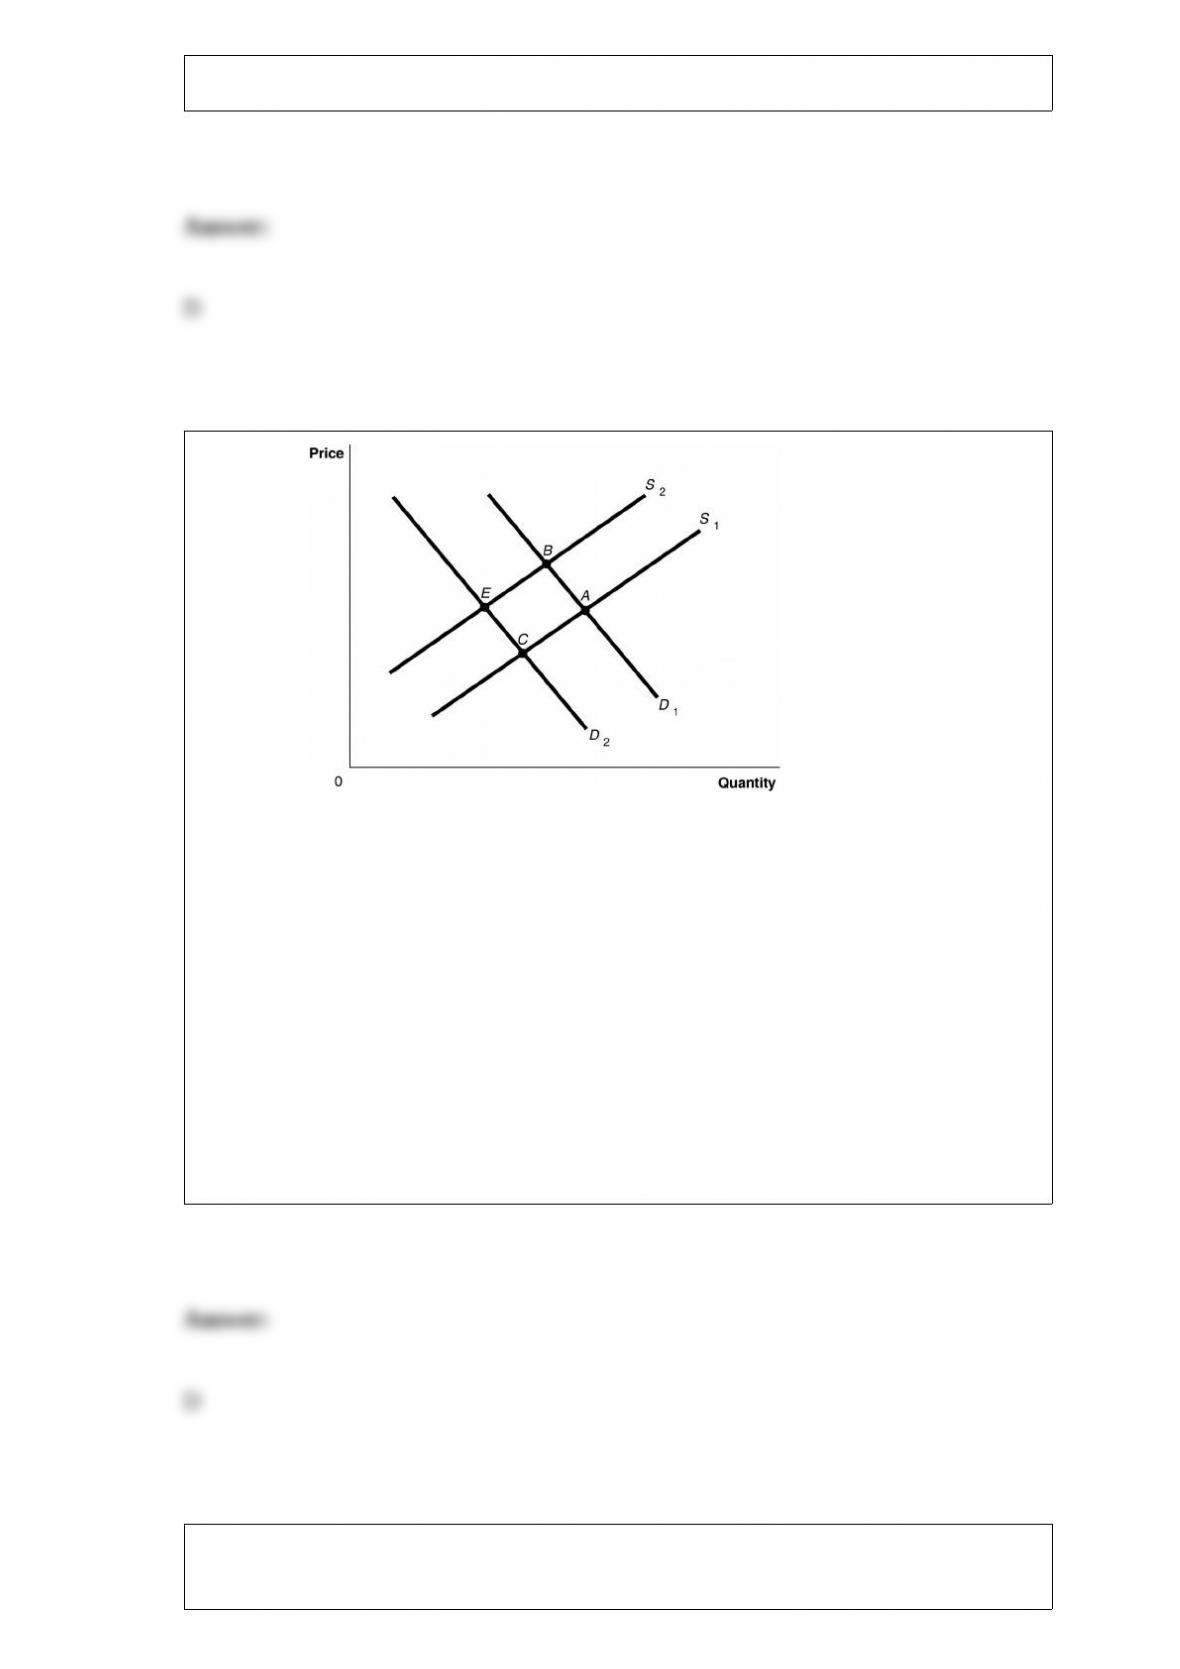
Figure 3-8
The graph in this figure illustrates an initial competitive equilibrium in the market for
sugar at the intersection of D1 and S1 (point A). If there is an increase in the price of
fertilizer used on sugar cane and there is a decrease in tastes for sugar-sweetened soft
drinks, how will the equilibrium point change?
A) The equilibrium point will move from A to B.
B) The equilibrium point will move from A to C.
C) There will be no change in the equilibrium point.
D) The equilibrium point will move from A to E.
Consider the following pairs of items:
a. shampoo and conditioner
b. iPhones and earbuds
c. a laptop computer and a desktop computer
d. beef and pork
e. air-travel and weed killer Which of the pairs listed will have a negative cross-price
elasticity?
A) a and b only
B) c and d only
C) e only
D) a, b, and c only
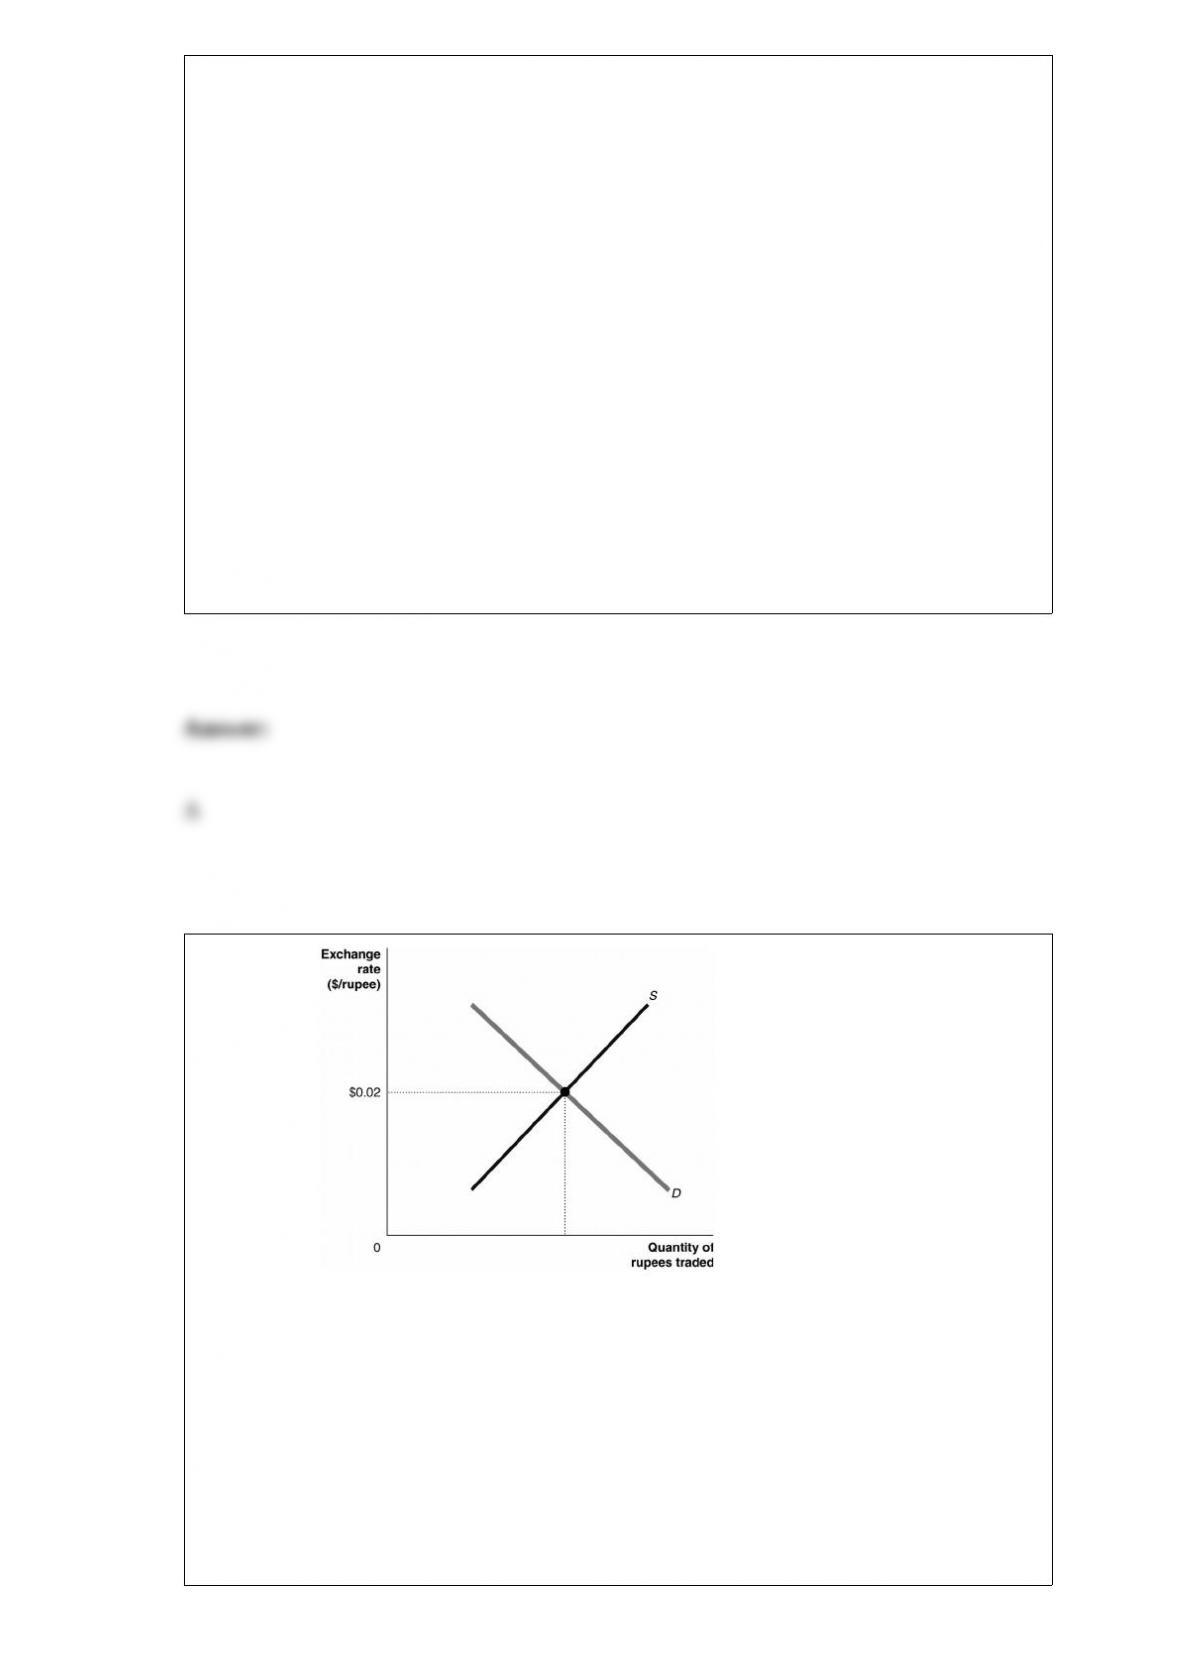
Figure 19-7
If the Indian government pegs its currency to the dollar at a value above $.02/rupee, we
would say the currency is
A) undervalued.
B) overvalued.
C) parity valued.
D) equilibrium valued.
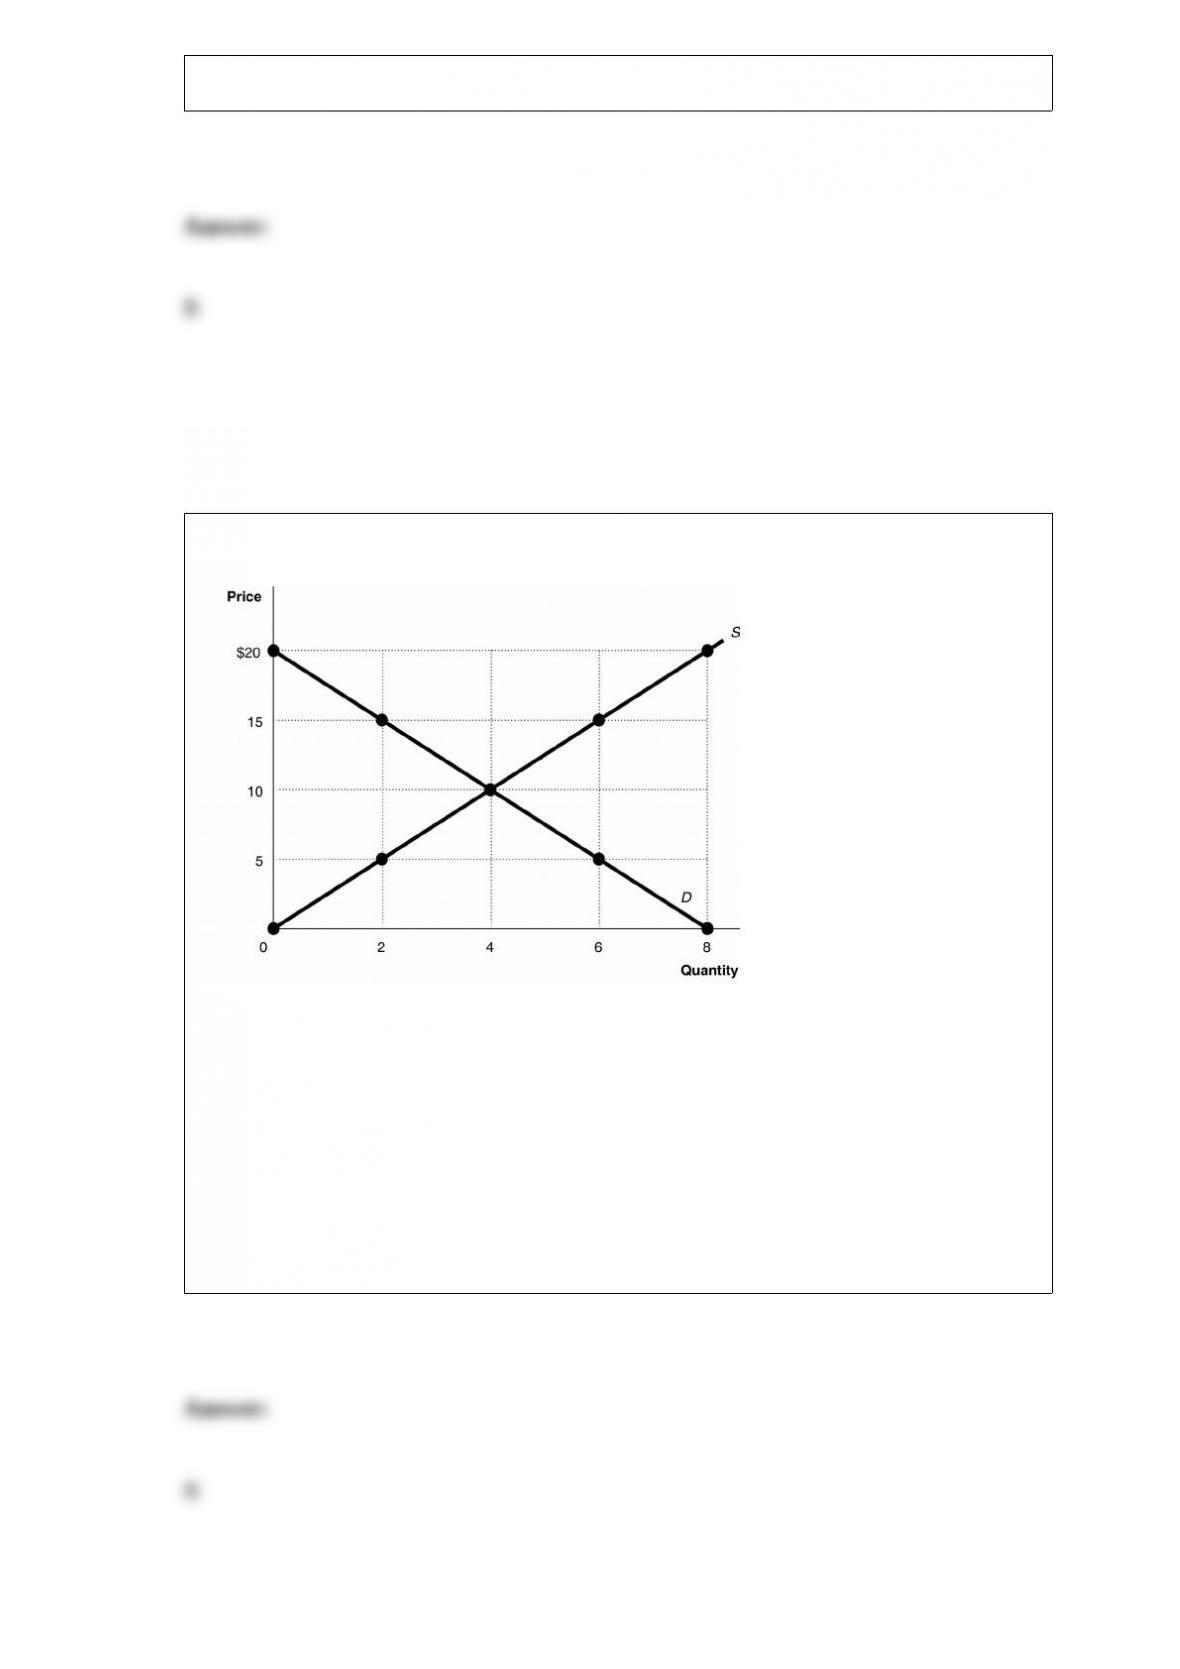
Figure 3-5
At a price of $10, the quantity sold
A) is 2 units.
B) is 4 units.
C) is 6 units.
D) is 8 units.

Pierre can produce either a combination of 20 bow ties and 30 neckties or a
combination of 35 bow ties and 15 neckties. If he now produces 35 bow ties and 15
neckties, what is the opportunity cost of producing an additional 15 neckties?
A) 2 bow ties
B) 15 bow ties
C) 20 bow ties
D) 35 bow ties