
The staffs of the accounting and the quality control departments rated their respective
supervisor’s leadership style as either (1) authoritarian or (2) participatory. Sixty-eight
percent of the accounting staff rated their supervisor “authoritarian,” and thirty-two
percent rated him “participatory.” Forty percent of the quality control staff rated their
supervisor “authoritarian,” and sixty percent rated her “participatory.” The best graphic
depiction of these data would be two ___________________.
a) histograms
b) frequency polygons
c) ogives
d) pie charts
e) scatter plots
The Magnolia Swimming Pool Company wants to determine the average number of
years it takes before a major repair is required on one of the pools that the company
constructs. The president of the company asks Rick Johnson, a company accountant, to
randomly contact fifty families that built Magnolia pools in the past ten years and
determine how long it was in each case until a major repair. The information will then
be used to estimate the average number of years until a major repair for all pools sold
by Magnolia. The average based on the data gathered from the fifty families can best be
described as a _______.
a) parameter
b) sample
c) population
d) statistic
e) frame

A researcher wants to estimate the percent of the population that uses the radio to stay
informed on local news issues. The researcher wants to estimate the population
proportion with a 90% level of confidence. He estimates from previous studies that no
more than 30% of the population stay informed on local issues through the radio. The
researcher wants the estimate to have an error of no more than .02. The necessary
sample size is at least _______.
a) 29
b) 47
c) 298
d) 1421
e) 1500
The following represent the ages of students in a class:
19, 23, 21, 19, 19, 20, 22, 31, 21, 20
If a stem and leaf plot were to be developed from this, how many stems would there be?
a) 2
b) 3
c) 4
d) 5
e) 10
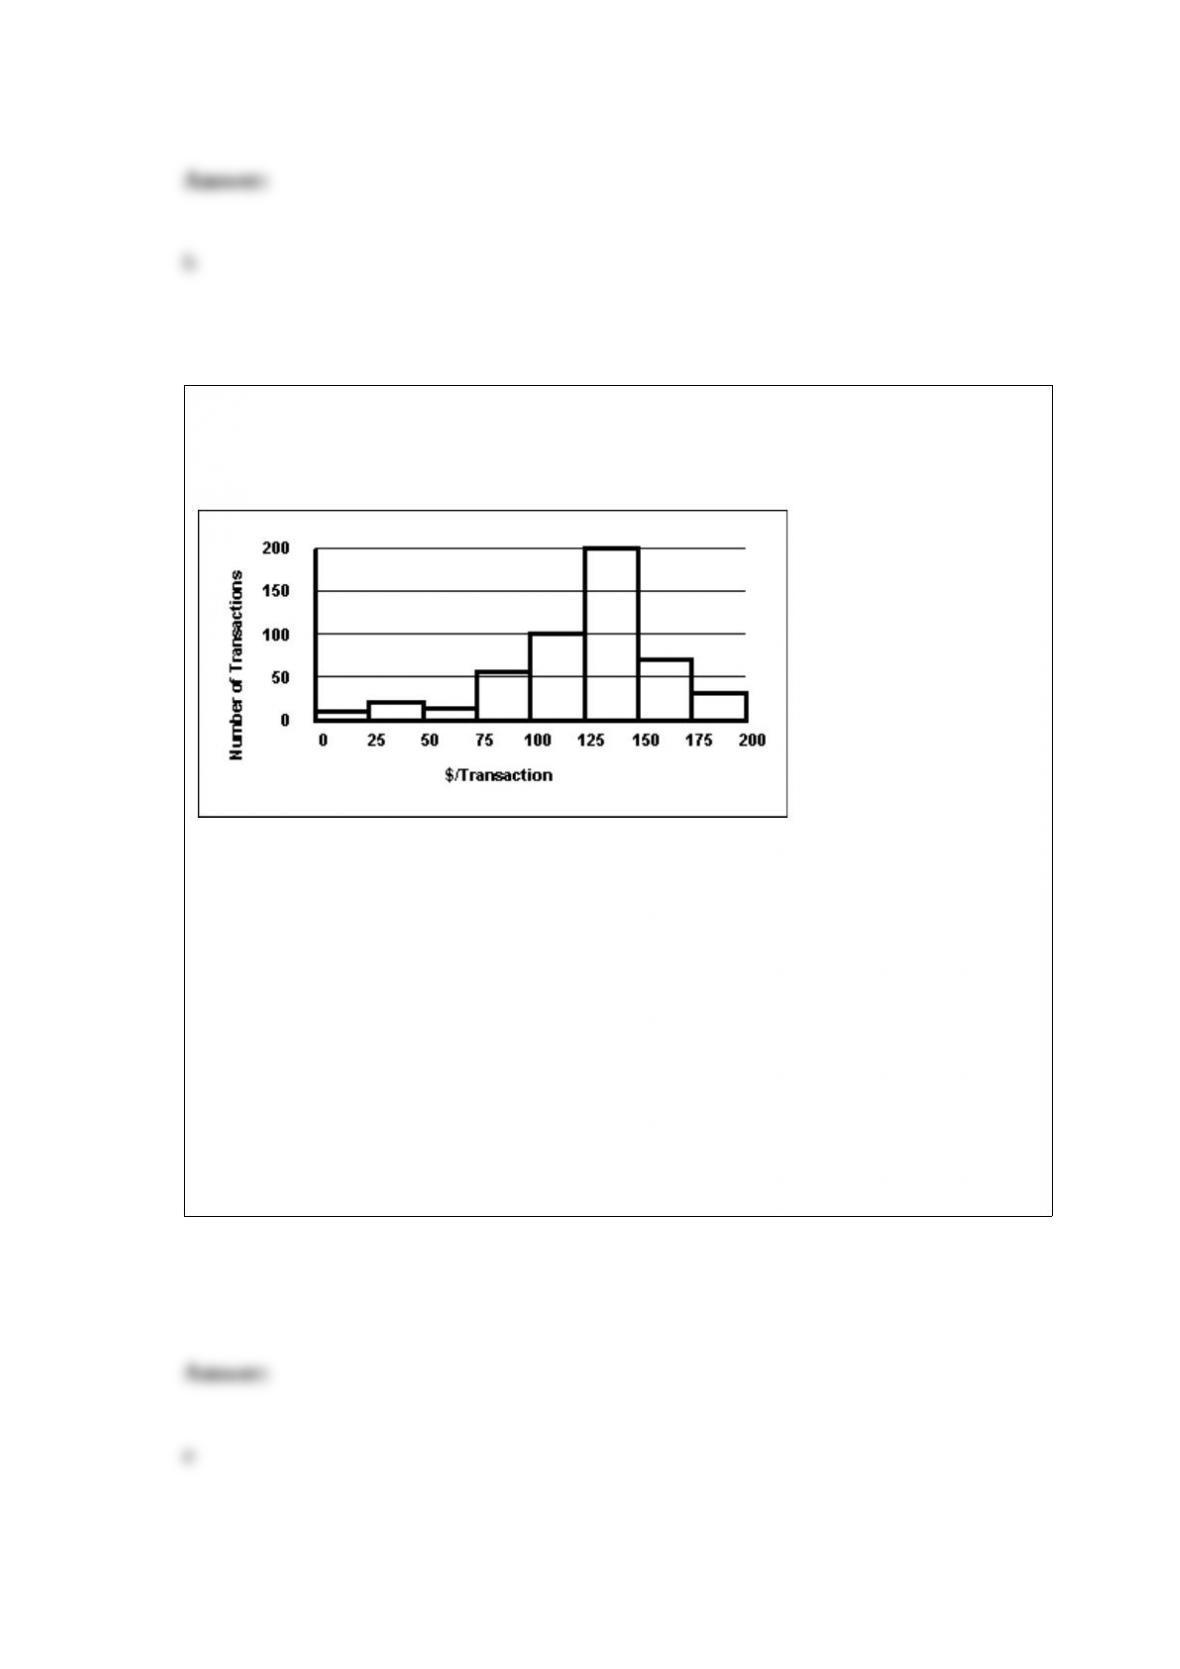
Each day, the manager at Jamie’s Auto Care Shop prepares a frequency distribution and
a histogram of sales transactions by dollar value of the transactions. Friday’s histogram
follows.
On Friday, the approximate number of sales transactions in the 75-under 100 category
was _____________.
a) 50
b) 100
c) 150
d) 200
e) 60
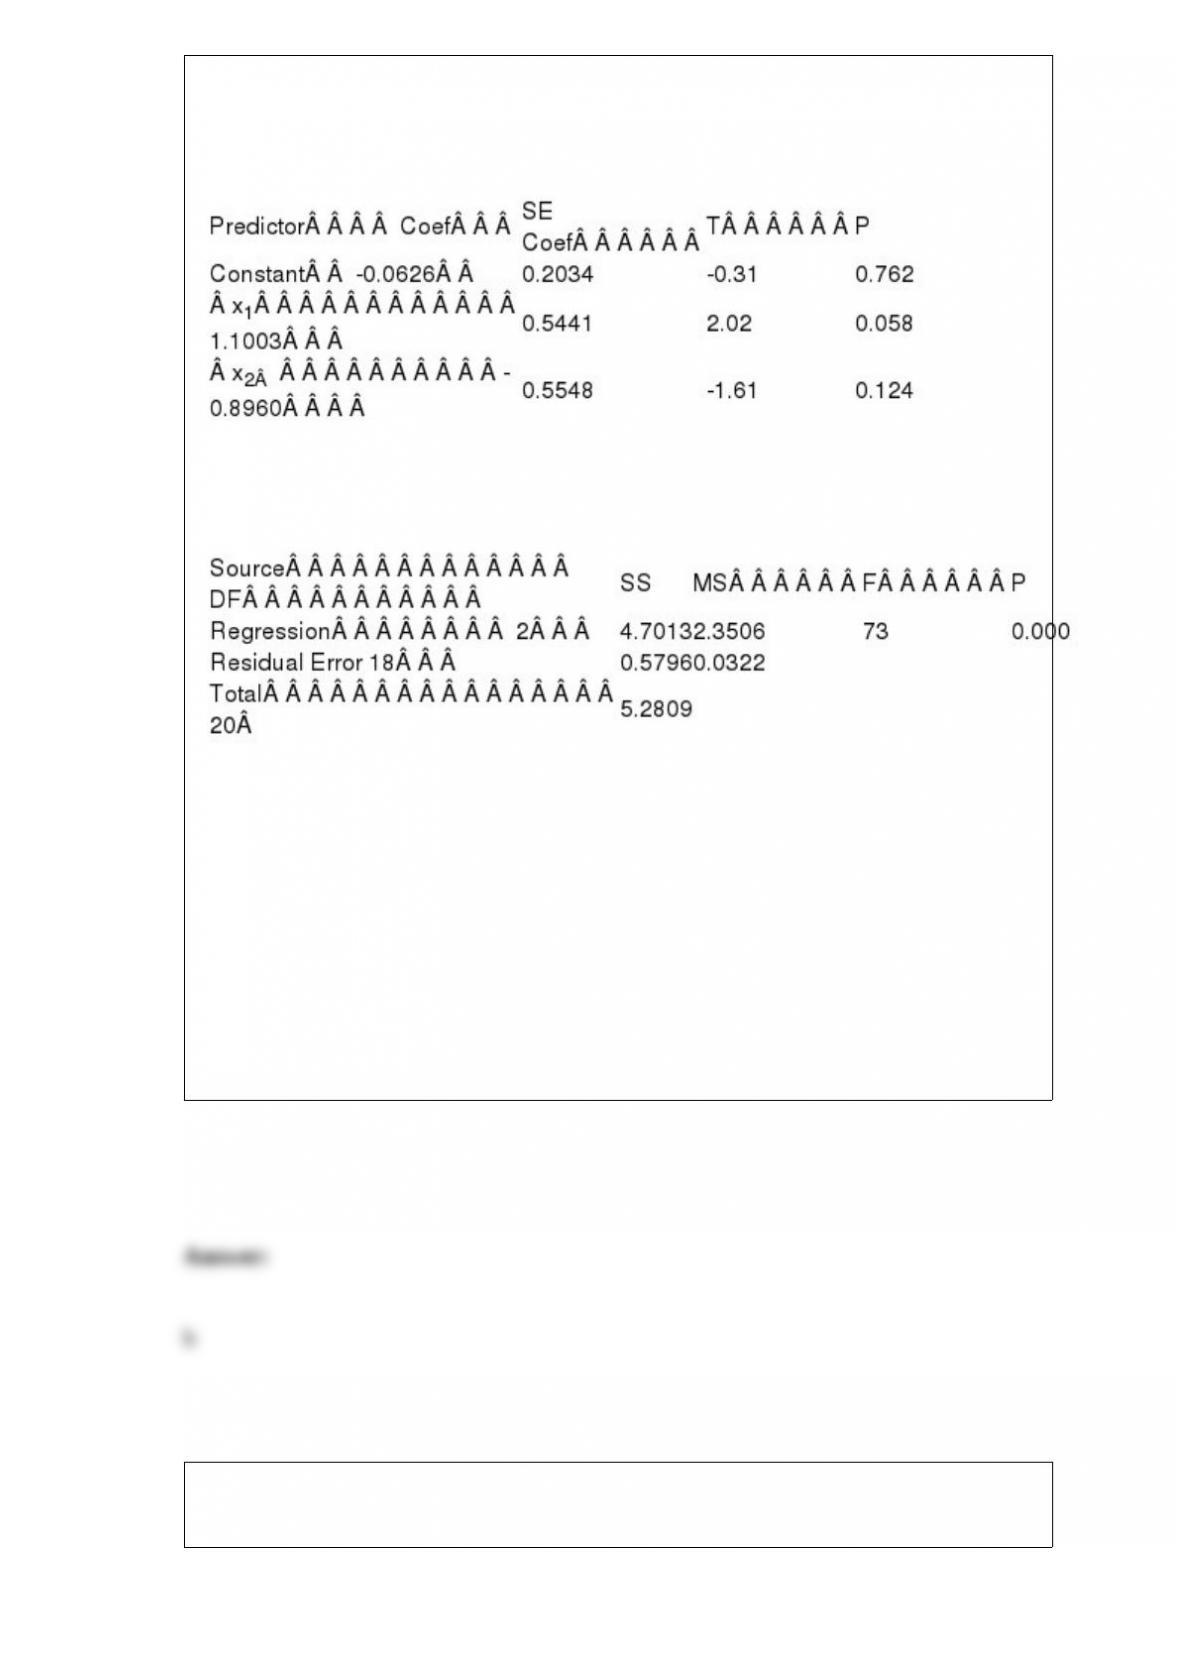
A multiple regression analysis produced the following output from Minitab.
Regression Analysis: Y versus x1 and x2
S = 0.179449 R-Sq = 89.0% R-Sq(adj) = 87.8%
Analysis of Variance
The overall proportion of variation of y accounted by x1 and x2 is _______
a) 0.179
b) 0.89
c) 0.878
d) 0.203
e) 0.5441
The following ANOVA table is from a multiple regression analysis with n = 35 and four
independent variables.
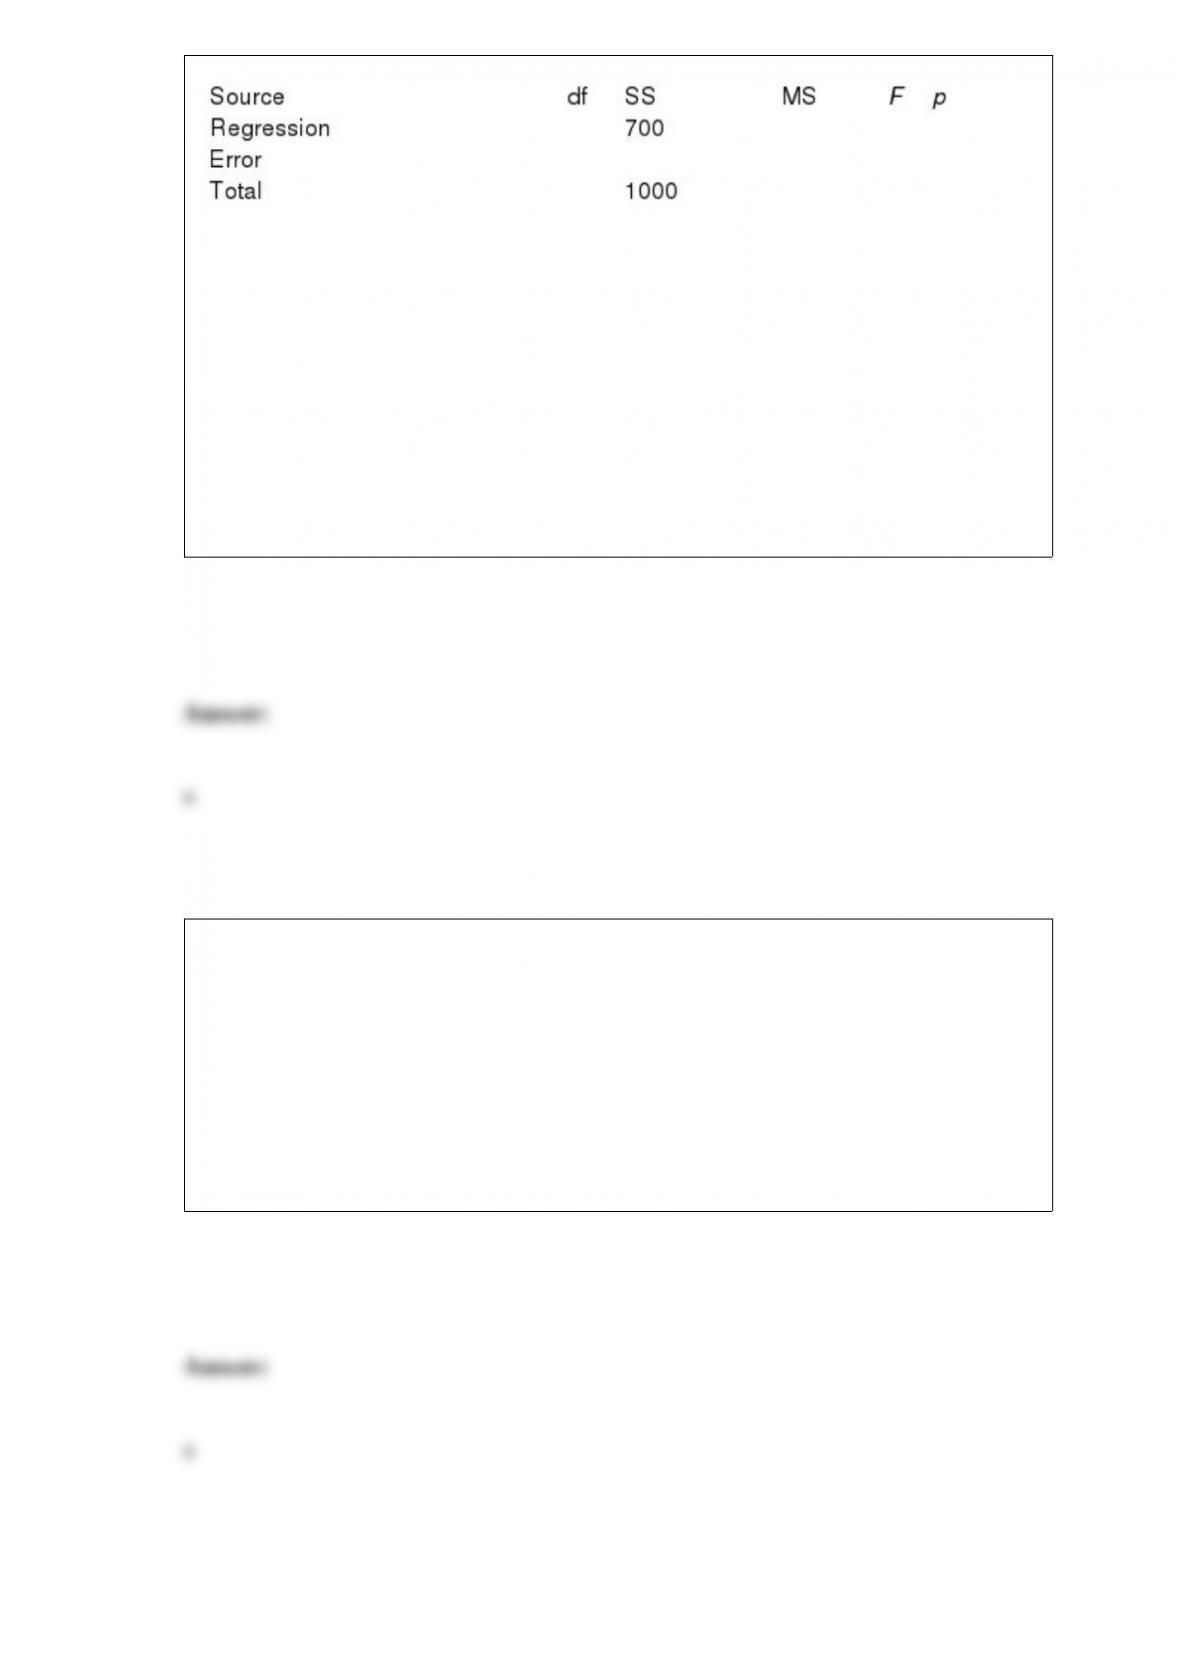
The observed F value is __________.
a) 17.50
b) 2.33
c) 0.70
d) 0.43
e) 0.50
Which of the following iterative search procedures for model-building in a multiple
regression analysis starts with all independent variables in the model and then drops
non-significant independent variables is a step-by-step manner?
a) Backward elimination
b) Stepwise regression
c) Forward selection
d) All possible regressions
e) Backward selection
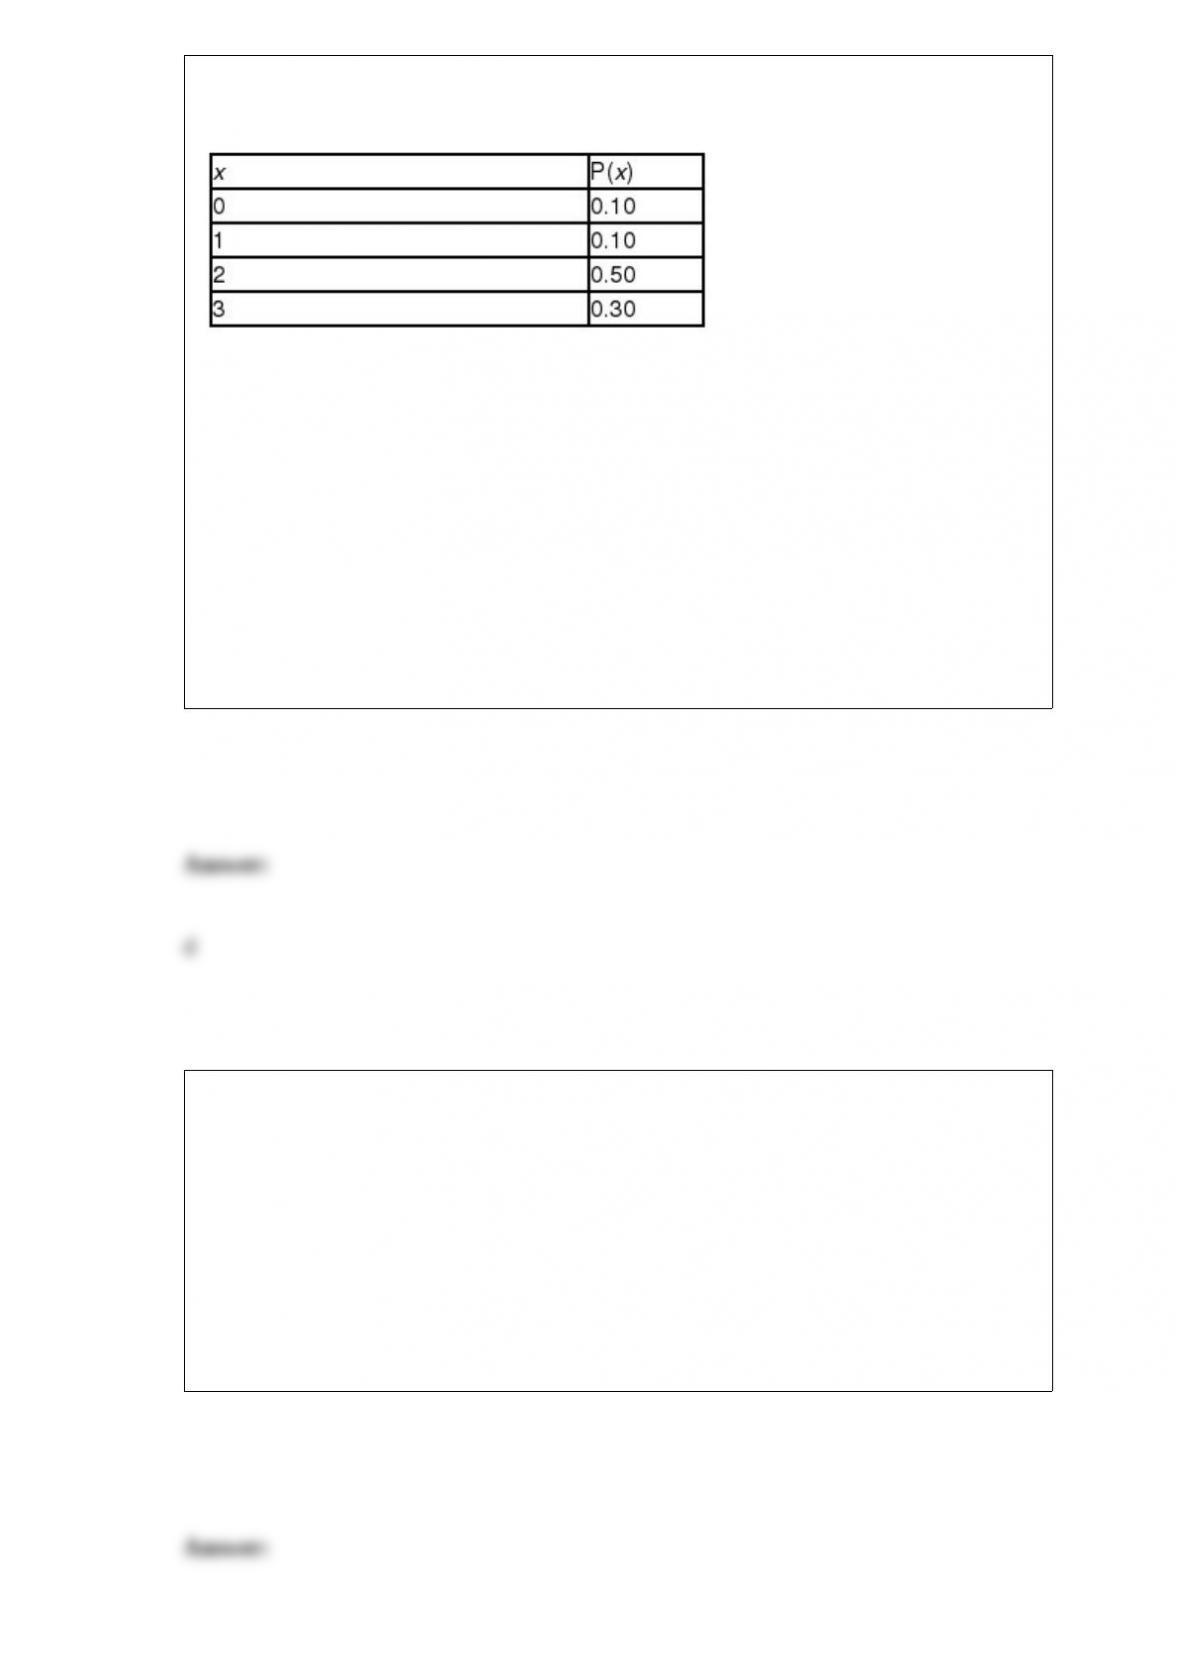
A market research team compiled the following discrete probability distribution. In this
distribution, x represents the number of automobiles owned by a family.
Which of the following statements is true?
a) This distribution is skewed to the right.
b) This is a binomial distribution.
c) This is a normal distribution.
d) This distribution is skewed to the left.
e) This distribution is bimodal.
A human resources analyst is developing a regression model to predict electricity
production plant manager compensation as a function of production capacity of the
plant, number of employees at the plant, and plant technology (coal, oil, and nuclear).
The “number of employees at the plant” variable in this model is ______.
a) a qualitative variable
b) a dependent variable
c) a response variable
d) an indicator variable
e) an independent variable
The z value associated with a two”sided 95% confidence interval is _______.
a) 1.28
b) 1.645
c) 1.96
d) 2.575
e) 2.33
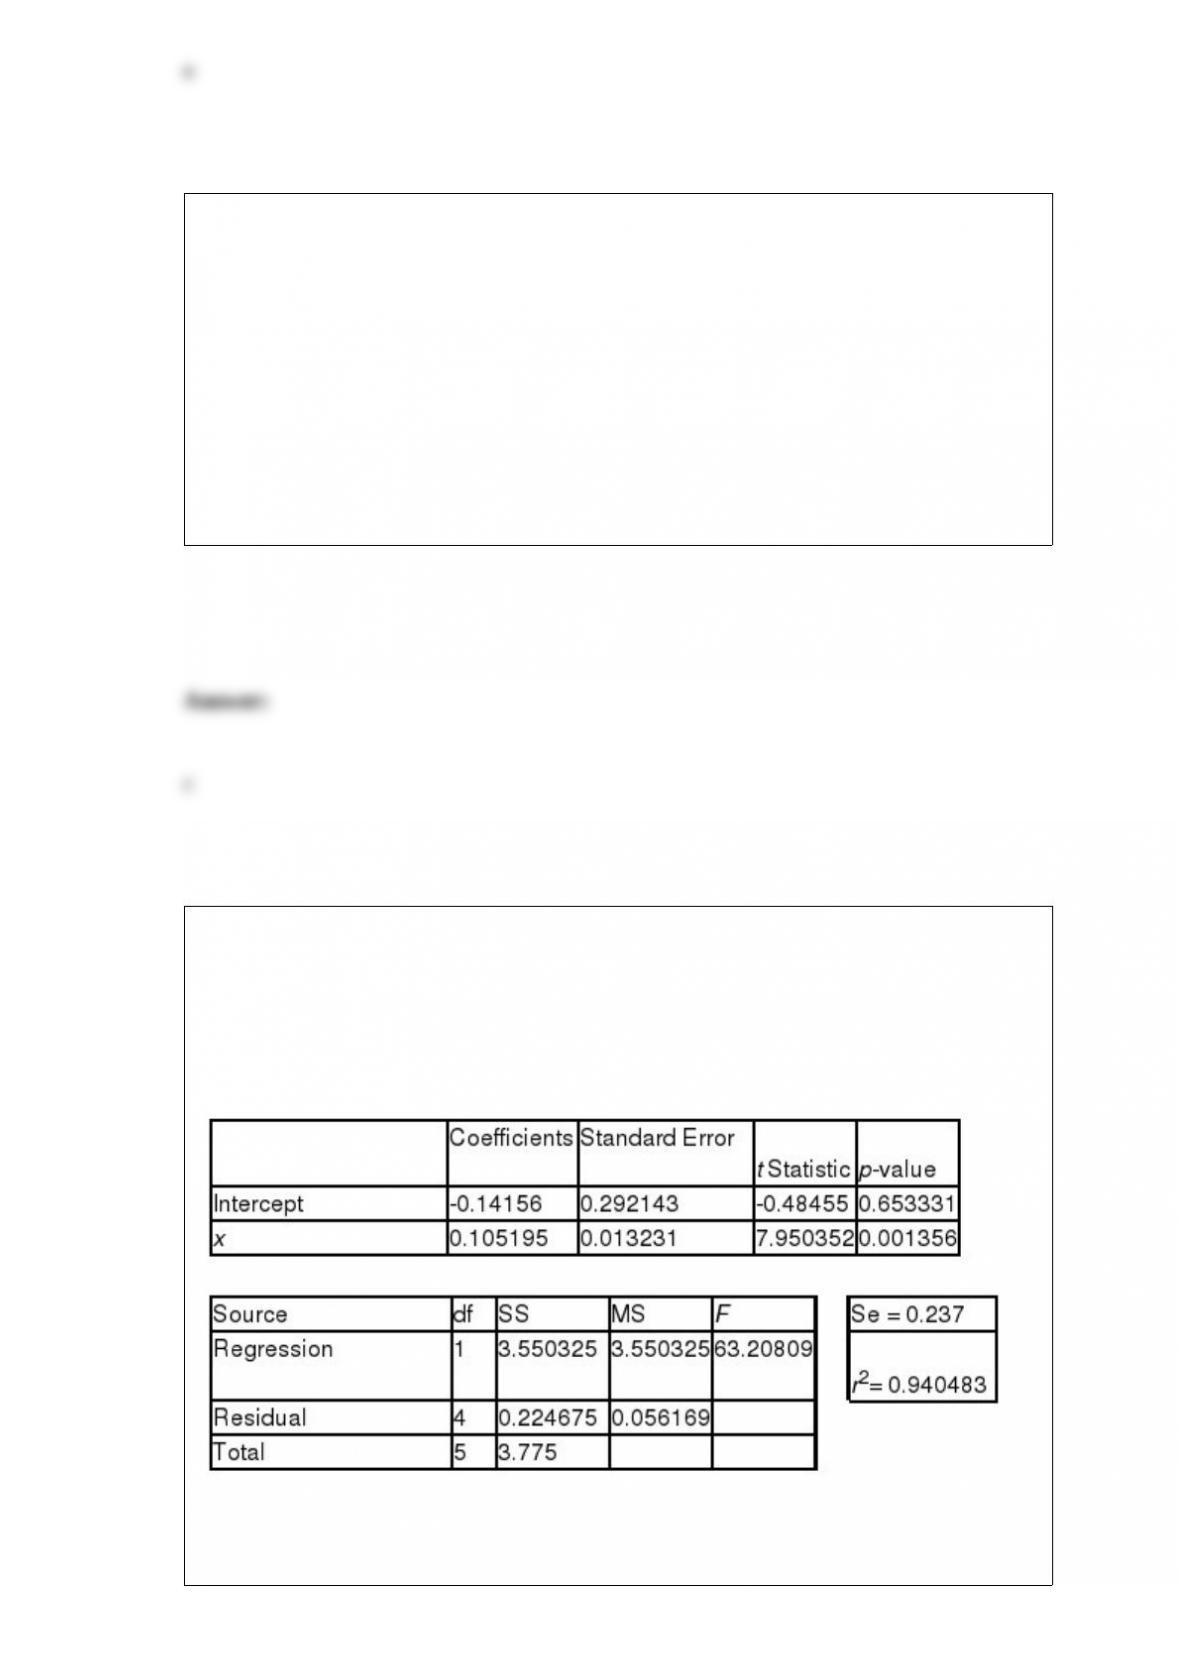
Annie Mikhail, market analyst for a national company specializing in historic city tours,
is analyzing the relationship between the sales revenue from historic city tours and the
size of the city. She gathers data from six cities in which the tours are offered. Annie’s
dependent variable is annual sales revenues and her independent variable is the city
population. Regression analysis of the data yielded the following tables.
Annie’s sample size is __________.
a) 2
b) 4

c) 6
d) 8
e) 10
Elwin Osbourne, CIO at GFS, Inc., suspects that at least 25% of e-mail messages sent
by GFS employees are not business related. A random sample of 300 e-mail messages
was selected to test this hypothesis at the 0.01 level of significance. Fifty-four of the
messages were not business related. The appropriate decision is _______.
a) increase the sample size
b) gather more data
c) reject the null hypothesis
d) fail to reject the null hypothesis
e) maintain status quo
A variable contains five categories. It is expected that data are uniformly distributed
across these five categories. To test this, a sample of observed data is gathered on this
variable resulting in frequencies of 27, 30, 29, 21, and 24. Using
= .01, the observed
value of chi-square is _______.
a) 12.09
b) 9.82
c) 13.28
d) 17.81
e) 2.09

Ophelia O’Brien, VP of Consumer Credit of American First Banks (AFB), monitors the
default rate on personal loans at the AFB member banks. One of her standards is “no
more than 5% of personal loans should be in default.” On each Friday, the default rate
is calculated for a sample of 500 personal loans. Last Friday’s sample contained 38
defaulted loans. Using = 0.10, the appropriate decision is _______.
a) reduce the sample size
b) increase the sample size
c) reject the null hypothesis
d) fail to reject the null hypothesis
e) do nothing
Which of the following quality control chart conditions is an indicator that the process
is potentially out-of-control?
a) several consecutive data points between the UCL and the LCL
b) a data point below the LCL
c) a data point below the UCL
d) a data point in the outer 1/3 region
e) a data point on the center line
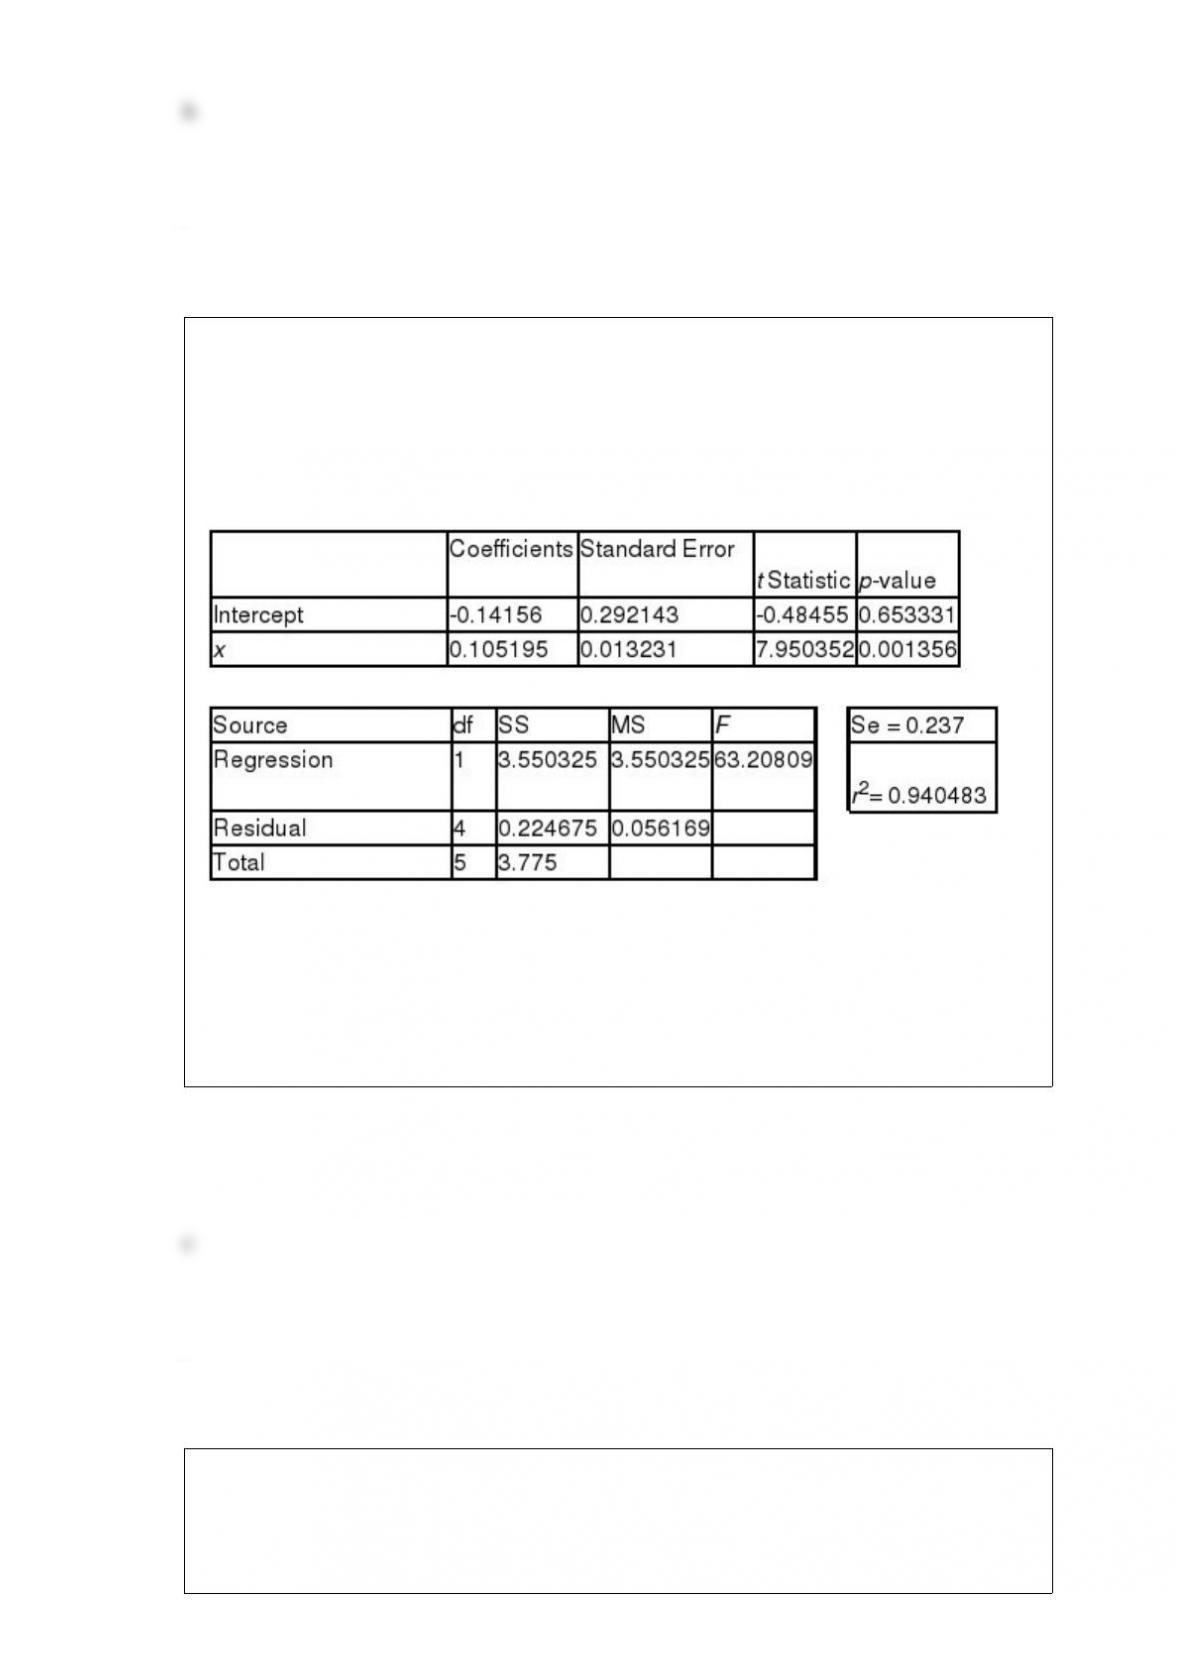
Annie Mikhail, market analyst for a national company specializing in historic city tours,
is analyzing the relationship between the sales revenue from historic city tours and the
size of the city. She gathers data from six cities in which the tours are offered. Annie’s
dependent variable is annual sales revenues and her independent variable is the city
population. Regression analysis of the data yielded the following tables.
Annie’s regression model can be written as: __________.
a) y = 7.950352 – 0.48455x
b) y = -0.48455 + 7.950352x
c) y = -0.14156 + 0.105195x
d) y = 0.105195 – 0.14156x
e) y = 0.105195 + 0.14156x
Catherine Chao, Director of Marketing Research, is evaluating consumer acceptance of
a new toothpaste package. Her staff reports that 17% of a random sample of 200
households prefers the new package to all other package designs. If Catherine
concludes that 17% of all households prefer the new package, she is using _______.
a) a point estimate
b) a range estimate
c) a statistical parameter
d) an interval estimate
e) an exact estimate
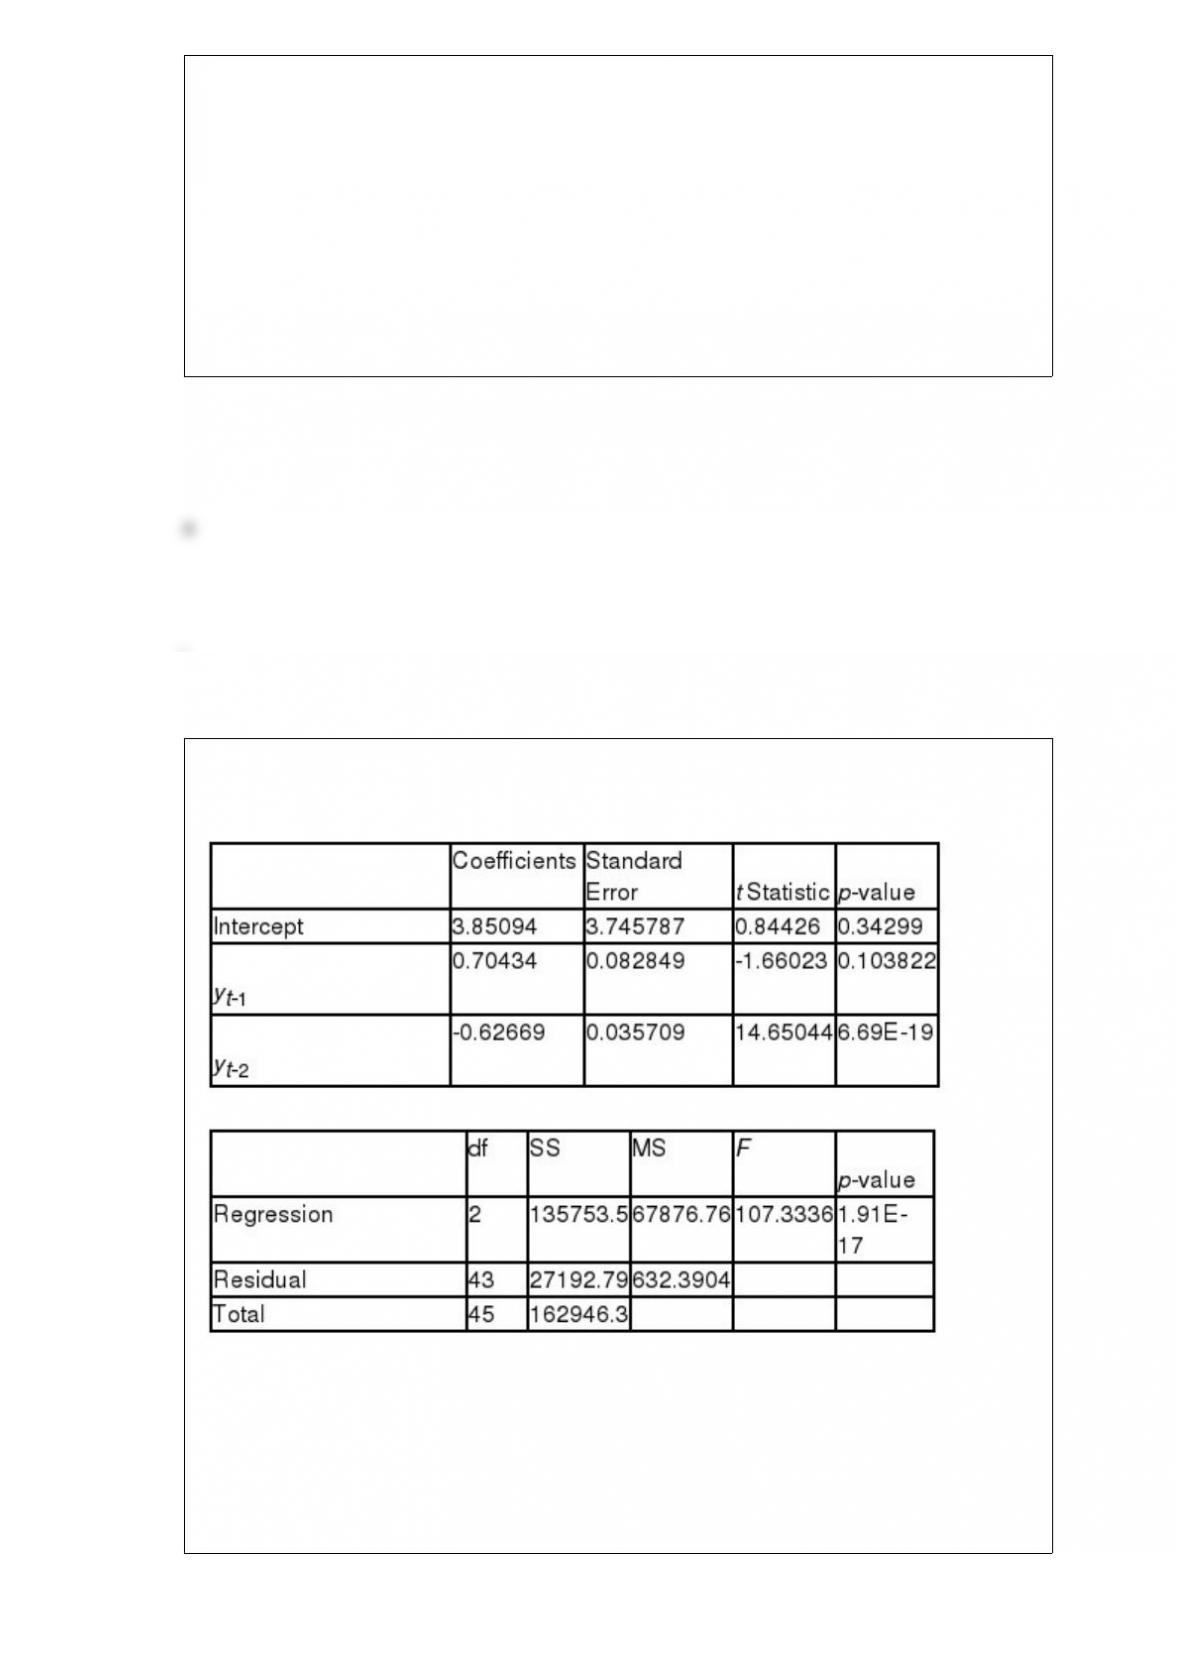
Analysis of data for an autoregressive forecasting model produced the following tables.
The results indicate that __________.
a) the first predictor, yt-1, is significant at the 10% level
b) the second predictor, yt-2, is significant at the 1% level
c) all predictor variables are significant at the 5% level
d) none of the predictor variables are significant at the 5% level
e) the overall regression model is not significant at 5% level
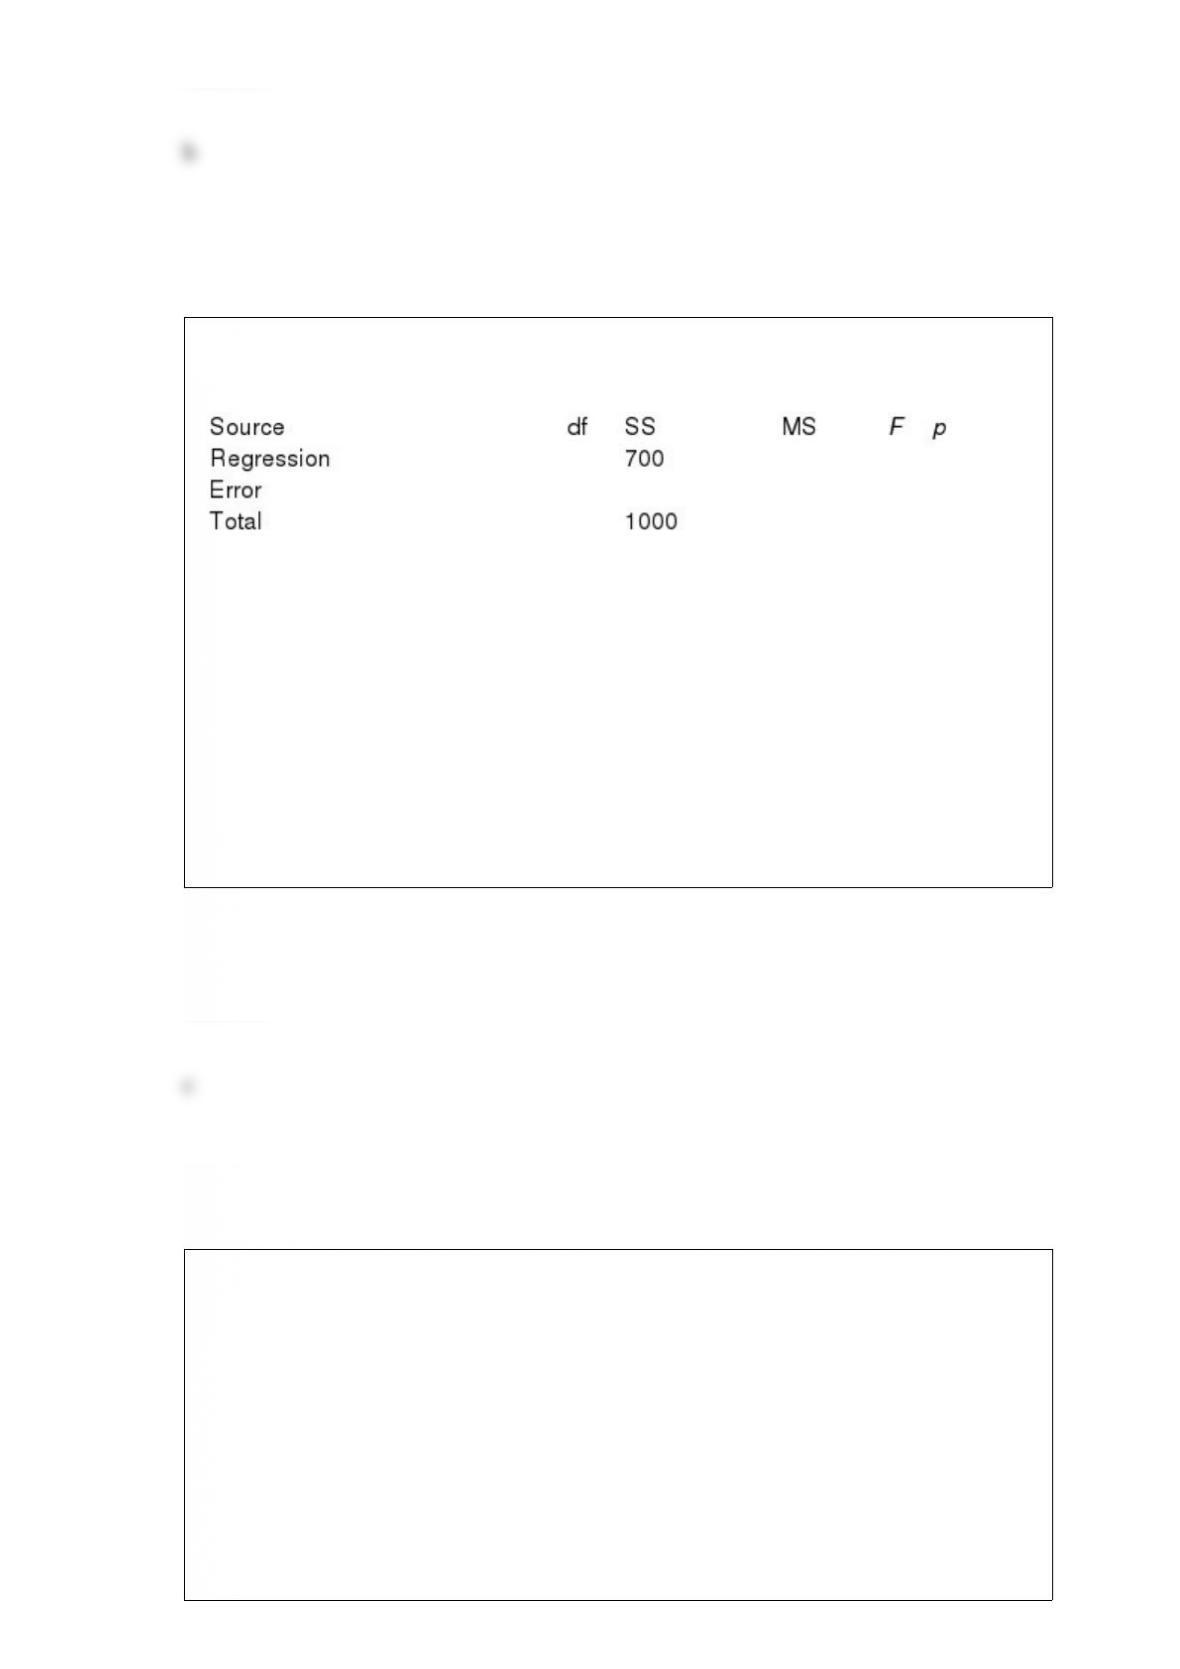
The following ANOVA table is from a multiple regression analysis with n = 35 and four
independent variables.
The MSE value is __________.
a) 8.57
b) 8.82
c) 10.00
d) 75.00
e) 20.00
Scholastic Aptitude Test scores are an example of what type of measurement scale?
a) Interval level data
b) Ordinal level data
c) Nominal level data
d) Ratio level data
e) Relative level data

A variable contains five categories. It is expected that data are uniformly distributed
across these five categories. To test this, a sample of observed data is gathered on this
variable resulting in frequencies of 27, 30, 29, 21, and 24. Using
= .01, the critical
value of chi-square is _______.
a) 7.78
b) 15.09
c) 9.24
d) 13.28
e) 15.48
Consider the following decision table with rewards in $ millions.
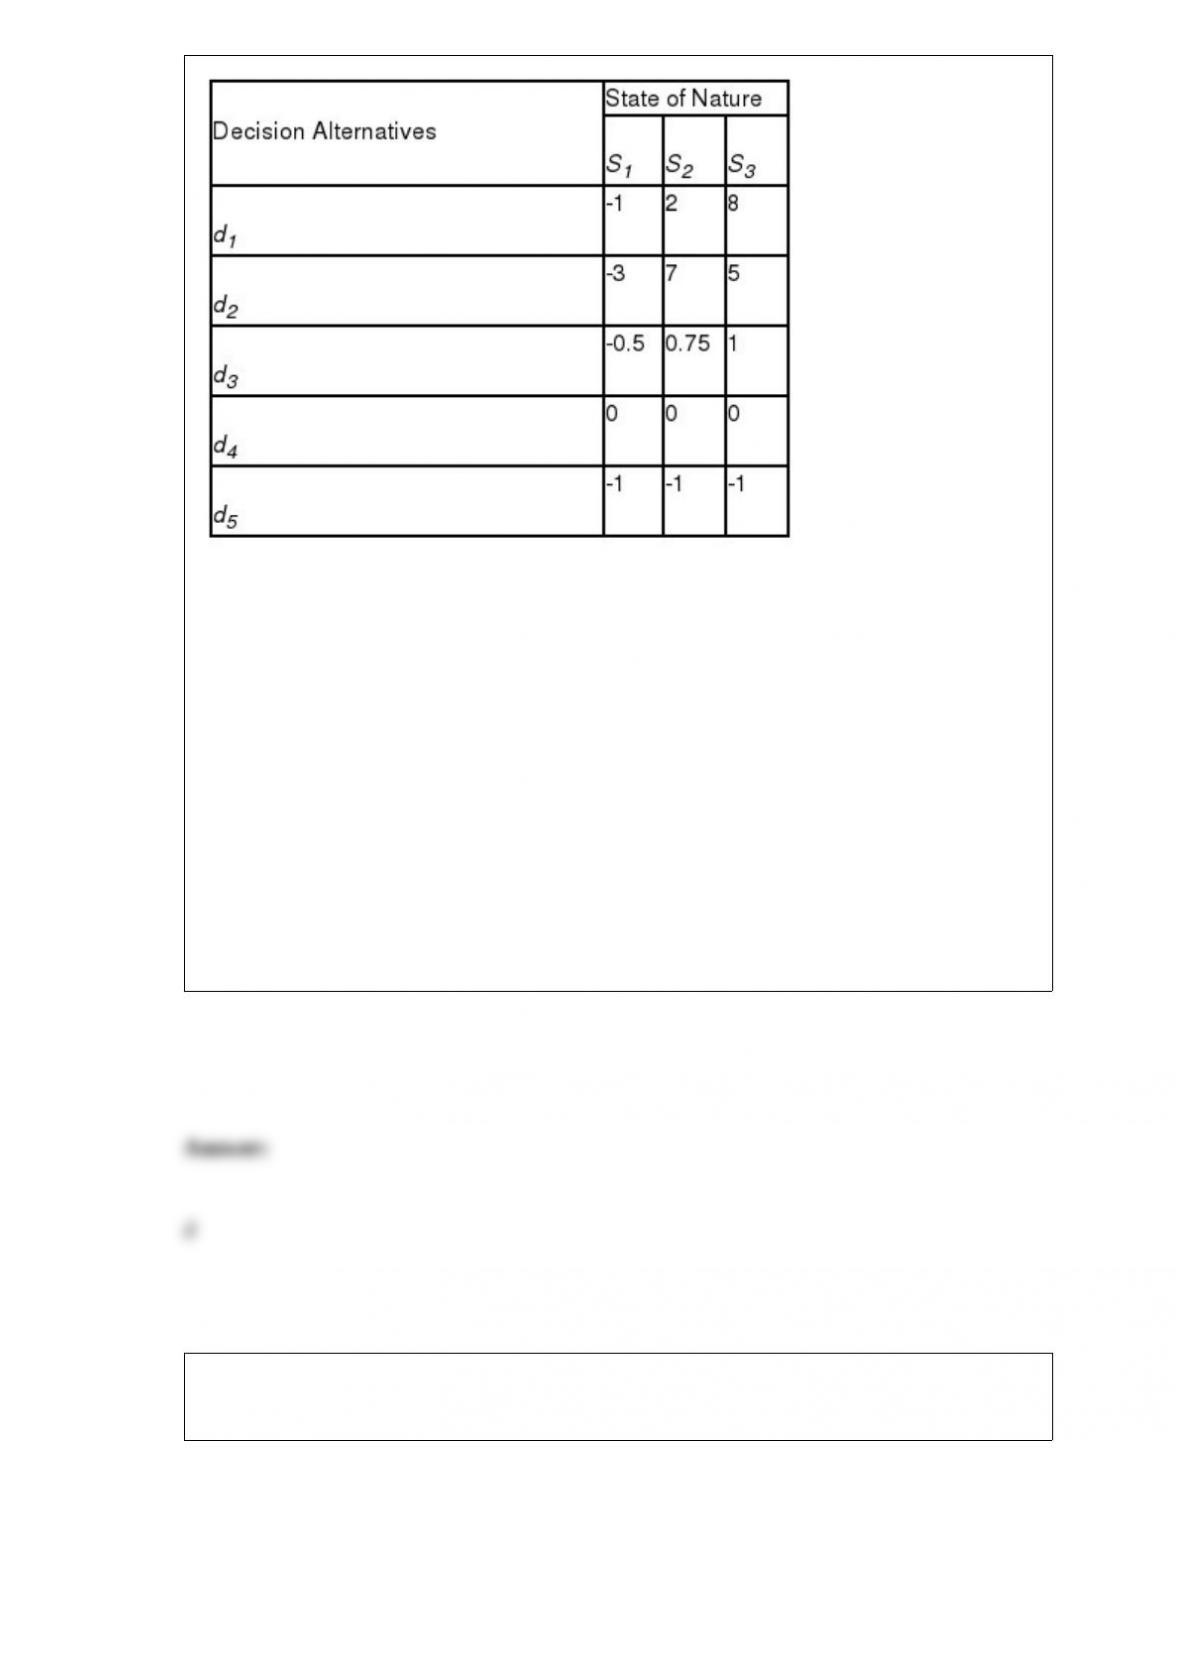
Using the Hurwicz criterion with alpha = 0.1, the appropriate choice would be
________.
a) d1
b) d2
c) d3
d) d4
e) d5
Data from a randomized block design are shown in the following table.
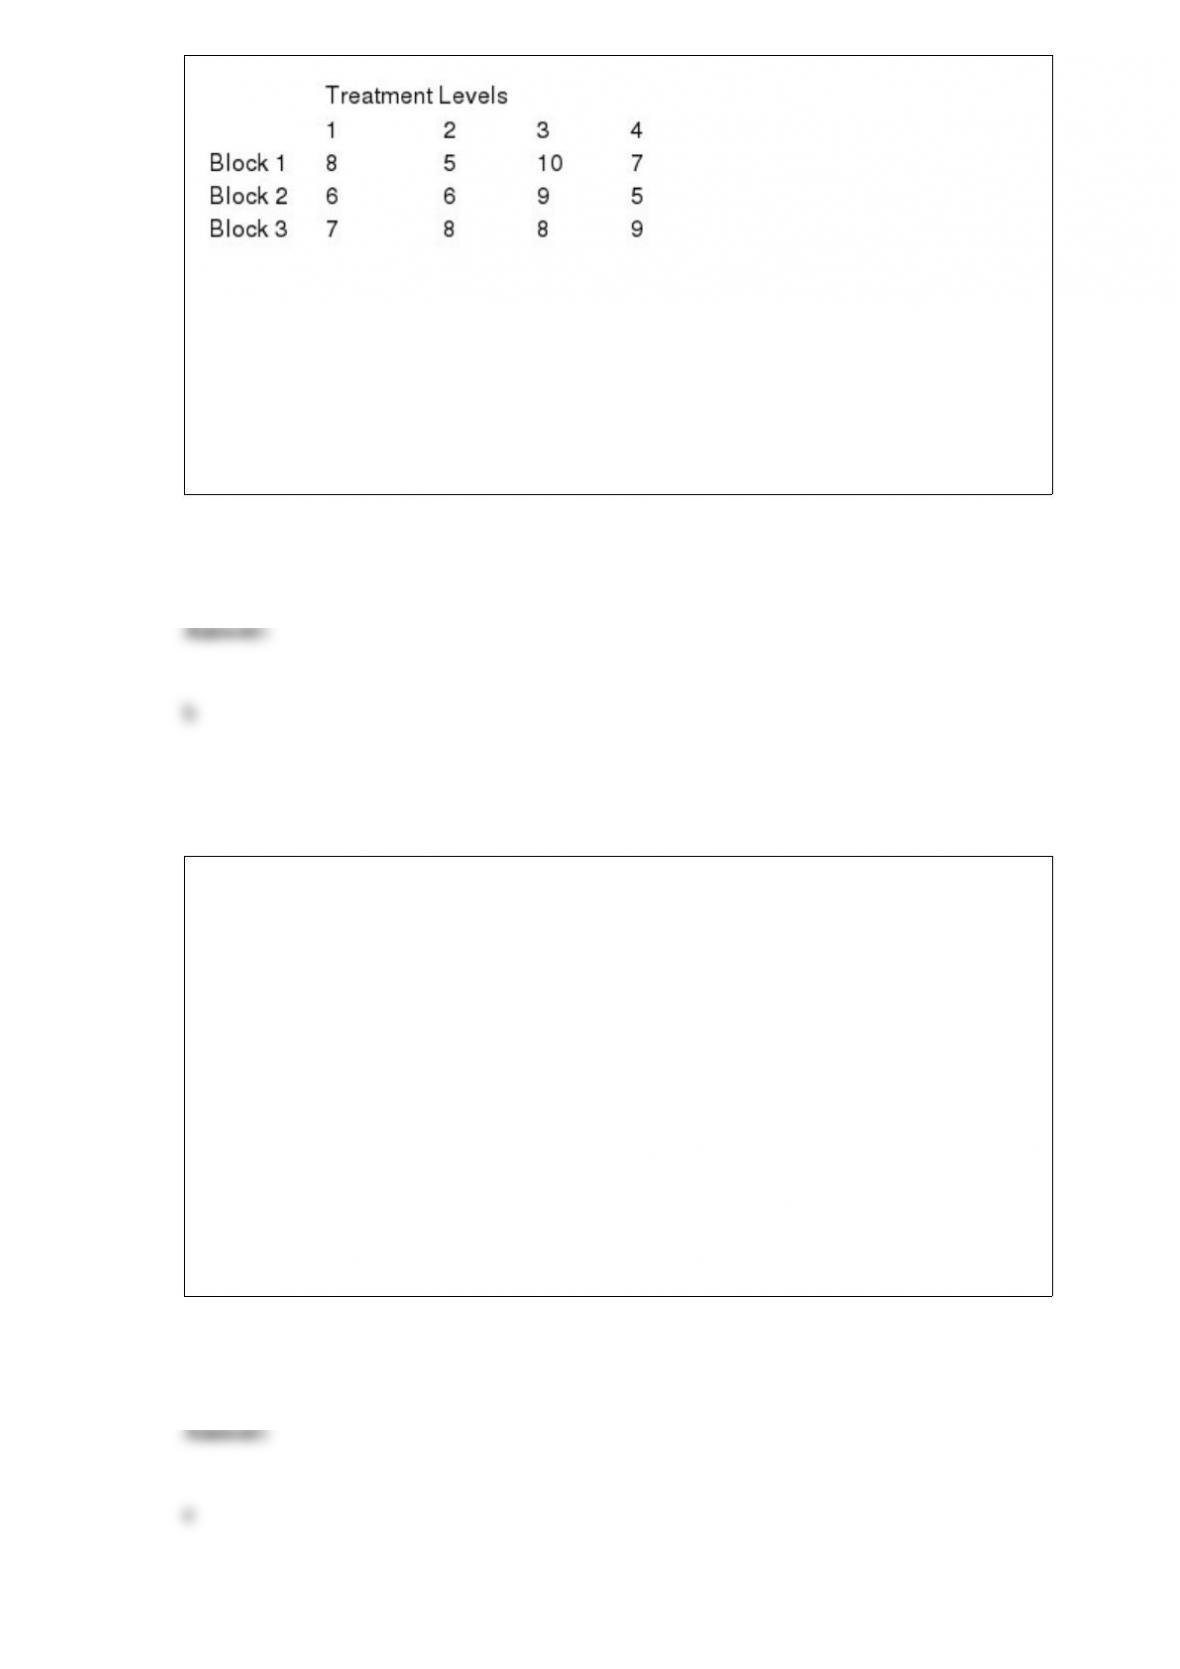
Using
= 0.05, the appropriate decision for the treatments is ________.
a) do not reject the null hypothesis
1=
2=
3
b) do not reject the null hypothesis
1
4
c) do not reject the null hypothesis
1
2
3
4
d) do not reject the null hypothesis
1
2
3
e) do nothing
It is known that 20% of all students in some large university are overweight, 20%
exercise regularly and 2% are overweight and exercise regularly. What is the
probability that a randomly selected student is overweight given that this student
exercises regularly?
a) 0.40
b) 0.38
c) 0.20
d) 0.42
e) 0.10

The hypergeometric distribution must be used instead of the binomial distribution when
______
a) sampling is done with replacement
b) sampling is done without replacement
c) n≥5% N
d) both b and c
e) there are more than two possible outcomes
Which of the following tests should be used to compare the means of three populations
if the sample data is ordinal?
a) one-way analysis of variance
b) Kruskal-Wallis test
c) Wilcoxon test
d) Mann-Whitney test
e) Friedman test
In performing a hypothesis test where the null hypothesis is that the population mean is
23 against the alternative hypothesis that the population mean is not equal to 23, a
random sample of 17 items is selected. The sample mean is 24.6 and the sample
standard deviation is 3.3. It can be assumed that the population is normally distributed.
The degrees of freedom associated with this are _______.
a) 17
b) 16
c) 15
d) 2
e) 1
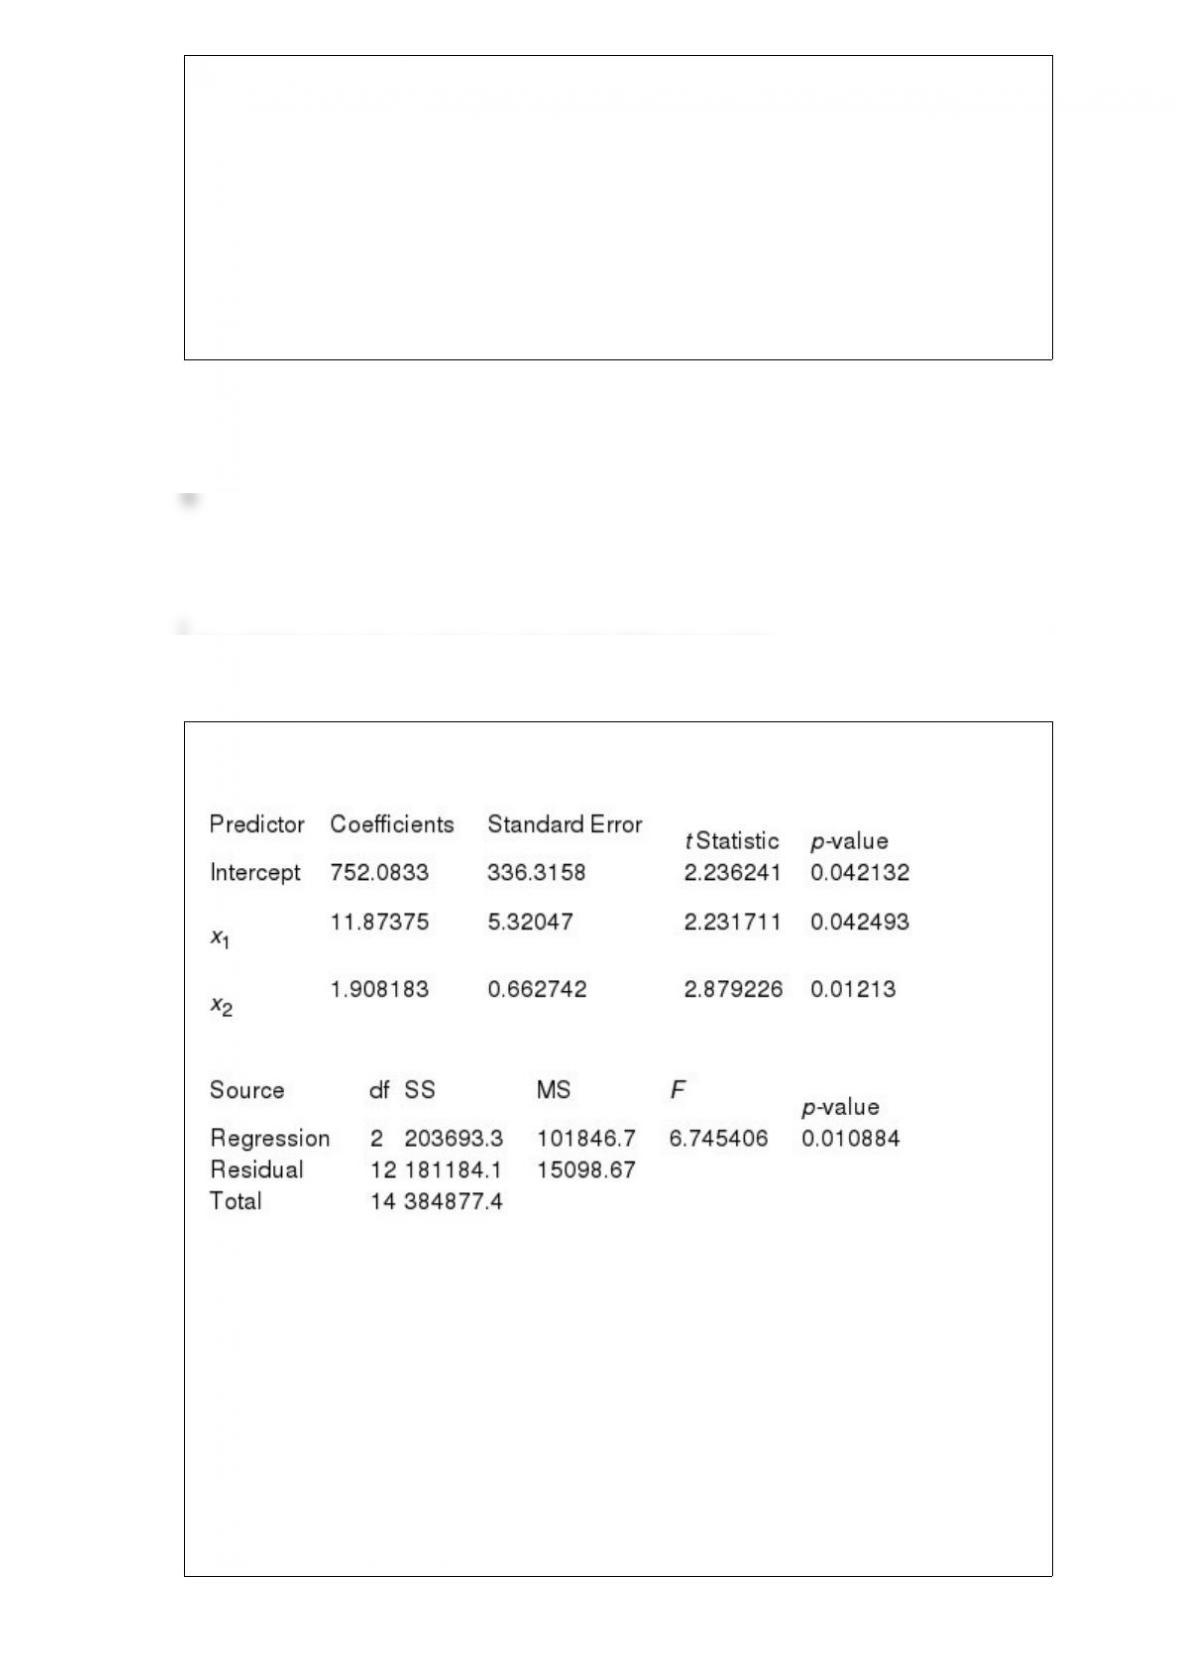
A multiple regression analysis produced the following tables.
Using a = 0.10 to test the null hypothesis H0: b2 = 0, the critical t value is ____.
a) 1.345
b) 1.356
c) 1.761
d) 2.782
e) 1.782

A travel agent believes that vacation destinations are independent of the region of the
country that the vacationer resides. She has compiled a table with six vacation
destinations and five regions throughout the United States. When applying a chi-square
test of independence to this table, the number of degrees of freedom is _____.
a) 9
b) 20
c) 30
d) 11
e) 12
A human resources analyst is developing a regression model to predict electricity
production plant manager compensation as a function of production capacity of the
plant, number of employees at the plant, and plant technology (coal, oil, and nuclear).
The response variable in this model is ______.
a) plant manager compensation
b) plant capacity
c) number of employees
d) plant technology
e) nuclear