Nonparametric statistics can be used for data that is at the nominal or ordinal level of
measurement.
A symmetrical distribution is one in which the right side of the distribution looks like
the mirror image of the left side of the distribution.
The hypothesis test for a single population variance requires that the sample size is
greater than 30.
Fifty employees at CSC Corporation responded to a survey asking for the number of
minutes they commute to work in the morning. Eighteen employees indicated that their
commutes are 15 to less than 20 minutes. The relative frequency for this class in a
frequency distribution would be 0.18.

When performing a hypothesis test comparing two population means, we need to assign
Population 1 to the larger sample mean and Population 2 to the smaller sample mean.
Outliers are not included in a five-number summary.
Fifty employees at CSC Corporation responded to a survey asking for the number of
minutes they commute to work in the morning. Management would like to know the
proportion of employees whose commute is less than 30 minutes. A cumulative relative
frequency distribution using grouped data would provide the information to answer this
question.

When conducting a hypothesis test comparing two populations with dependent samples,
the sample sizes must be equal.
The β calculation is made under the premise that the null hypothesis is true and should
rightfully be accepted.
For a two-tail hypothesis test, if the absolute value of the z- or t-test statistic exceeds the
absolute value of the critical value, we reject the null hypothesis.
The test statistic for the one-tail sign test, S, is the number of plus signs regardless of
the type of alternative hypothesis.
Without the finite population correction factor, the standard error is overestimated when
calculating a confidence interval for a finite population.
The Hurwicz criterion allows the decision maker to choose the level of profit he or she
wants to achieve by choosing , the index of optimism.
The higher the value for for the Hurwicz criterion, the less risky the final
decision.

If the null hypothesis is true, the mean square total is a good estimate for the population
variance.
The purpose of inferential statistics is to make claims or conclusions about a population
based on a sample.
In a two-way ANOVA procedure, the null hypothesis for the hypothesis test for the
interaction of Factors A and B is that Factors A and B do interact.
All analysis of variance procedures require that the populations being compared have

equal variances.
With systematic sampling, there is the risk that the person selecting the next member for
the sample from the population may be biased in his or her choice.
The hypothesis test for the population coefficient of determination can be a one-tail test
or a two-tail test.
A decision table displays all possible combinations of alternatives and states of nature
associated with a problem, and the payoff that will result from each combination.

The shape of the chi-square distribution is left-skewed.
A horizontal slope on an xy scatter plot indicates that there is a strong relationship
between the between the independent and dependent variables.
The average monthly rent for a two-bedroom apartment in City A is $820 with a
standard deviation of $86. The average monthly rent for a two-bedroom apartment in
City B is $790 with a standard deviation of $75. Based on this data, we can conclude
that the rent for two-bedroom apartments in City A is more consistent when compared
to City B.

Negative autocorrelation is present in a time series when the consecutive residuals are
close to one another, resulting in a relatively small Durbin-Watson statistic.
The pooled variance is the weighted average of two sample variances drawn from two
populations.
The z-score follows a normal distribution with μ = 1 and σ = 0, which is known as the
standard normal distribution.
The approximate standard error of the difference between population proportions uses
the sample proportions to estimate the values of the population proportions when
determining the standard deviation.

Histograms displaying continuous data have gaps between their bars.
The appropriate test statistic for the blocking factor for a randomized block ANOVA
follows the F-distribution.
The chi-square goodness-of-fit test has no minimum requirement for the number of
observed frequencies in each category.

The Poisson distribution can be used to approximate the binomial distribution when the
number of trials is greater than 20 and the probability of success is less than or equal to
0.05.
The mean of the binomial distribution represents the long-term average number of
successes to expect based on the number of trials conducted.
Outliers are extreme values above or below the mean that require special consideration.
The mathematical expression that describes the shape of the uniform distribution is
known as the continuous uniform probability density function.

When the main factor is statistically significant with randomized block ANOVA, the
blocking factor will also be statistically significant.
The following data represents the number of home runs that Ryan Howard, a Major
League Baseball player for the Philadelphia Phillies, hit over a six-year period.
The mode for this data set is ________.
A) 22
B) 31
C) 47
D) There is no mode for this data set.
Entertainment Software Association would like to test if the standard deviation for the

age of “gamers” (those that routinely play video games) is equal to 6.0 years. The
standard deviation for the age from a random sample of 24 gamers is 3.8 years. Using α
= 0.05, the lower critical value for this hypothesis test would be ________.
A) 10.235
B) 11.689
C) 12.750
D) 13.477
Edmunds.com would like to test the hypothesis that the standard deviation for the age
of an imported car on the road is greater than the standard deviation for the age of a
domestic car. The following data shows the ages of a random sample of import and
domestic cars.
The standard deviation for the age of import cars would be ________.
A) 2.76
B) 3.93
C) 4.72
D) 6.60
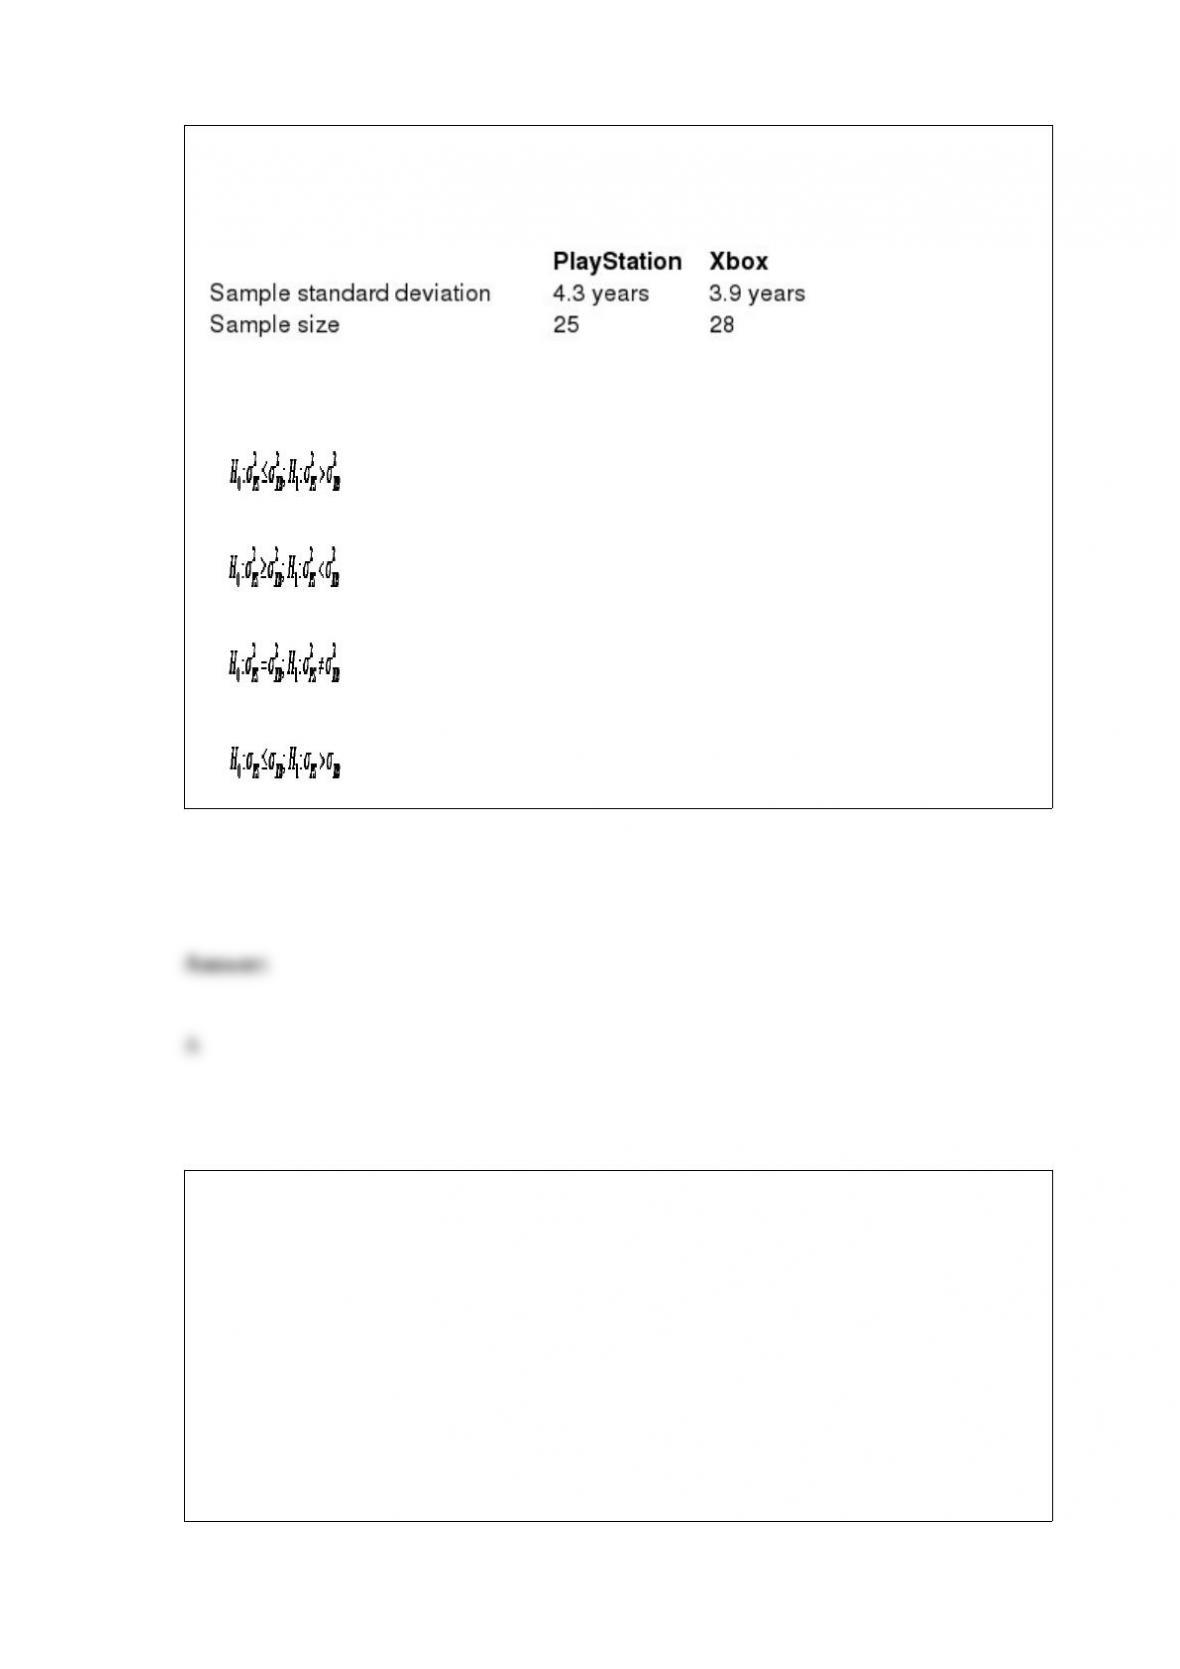
Sony would like to test the hypothesis that the standard deviation for the age of
PlayStation users is higher than the standard deviation for the age of Xbox users. The
following table summarizes sample statistics from each population.
The correct hypothesis statement would be _______________.
A)
B)
C)
D)
At the beginning of a Major League Baseball season, a panel of sports writers decided
that the Los Angeles Dodgers were the most likely team to win the World Series that
year. This is an example of using ________ probability.
A) empirical
B) simple
C) subjective
D) classical
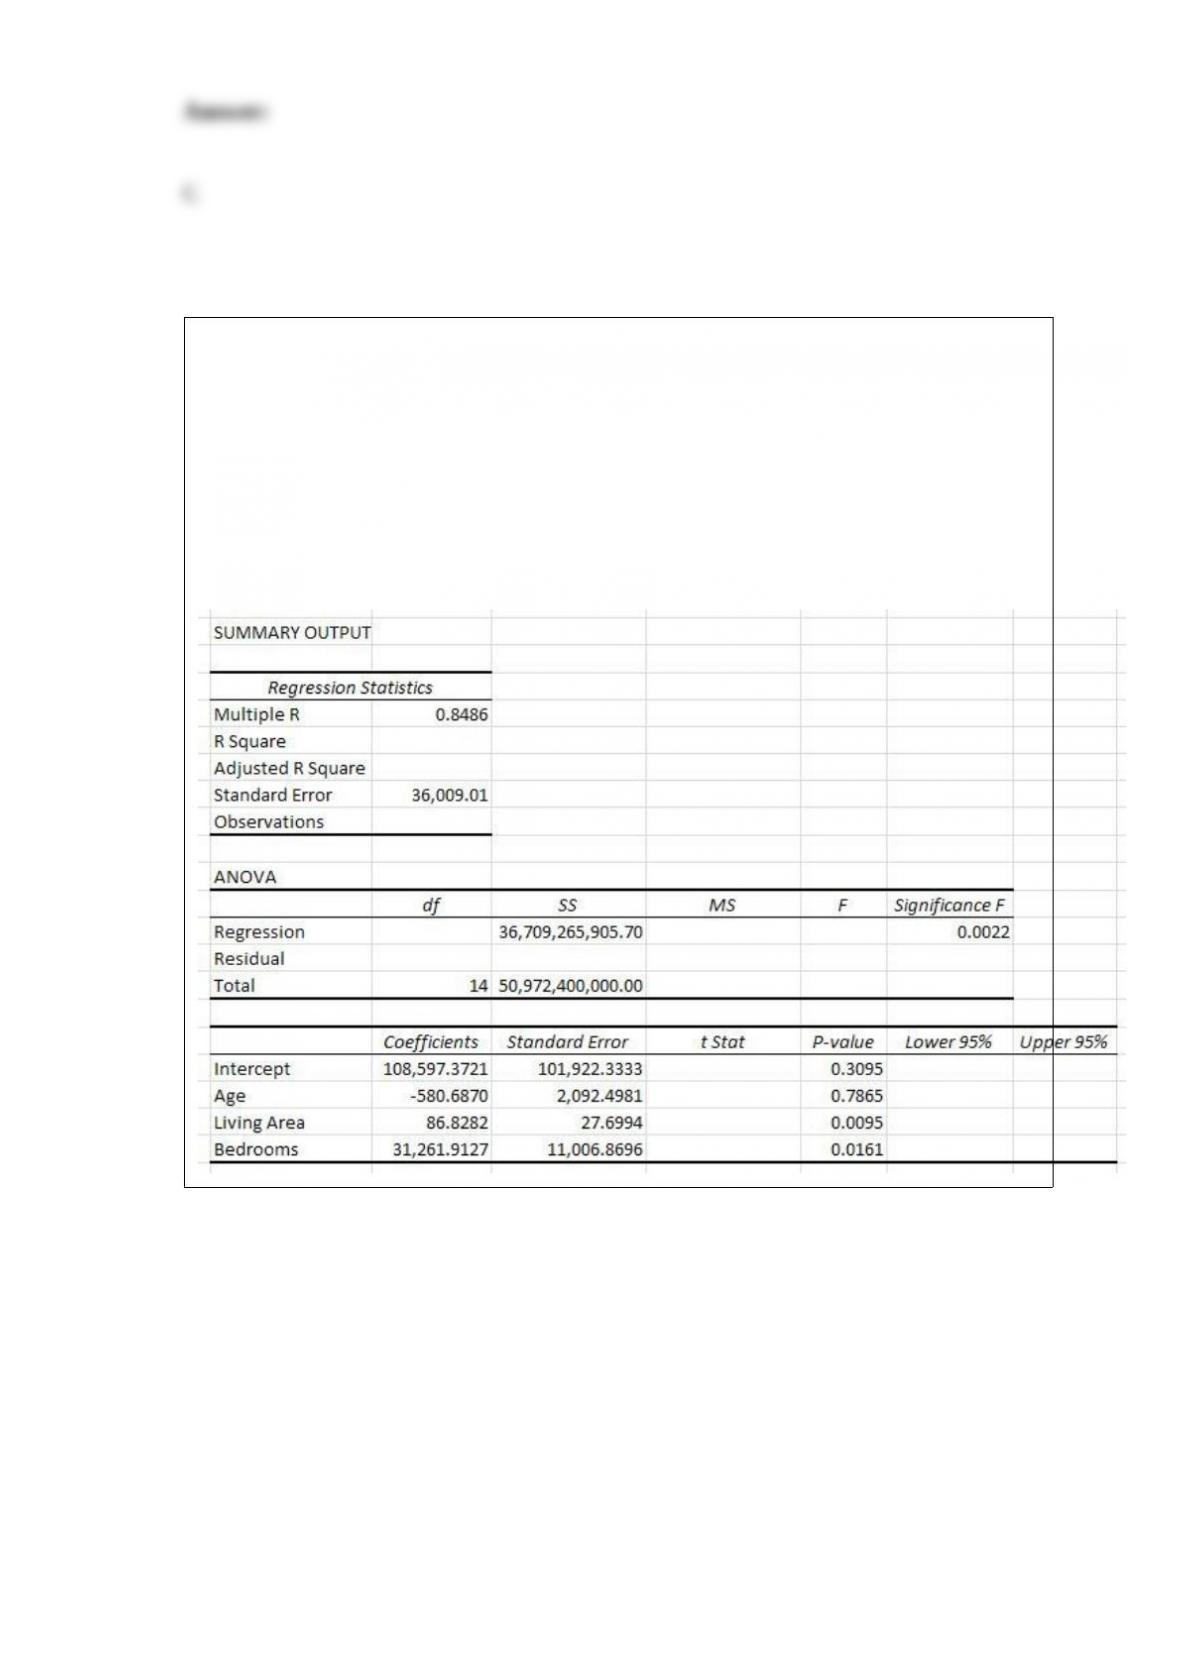
Use the following information to answer the question(s) below.
A home appraisal company would like to develop a regression model that would predict
the selling price of a house based on the age of the house in years (Age), the living area
of the house in square feet (Living Area) and the number of bedrooms (Bedrooms). The
following Excel output shows the partially completed regression output from a random
sample of homes that have recently sold.
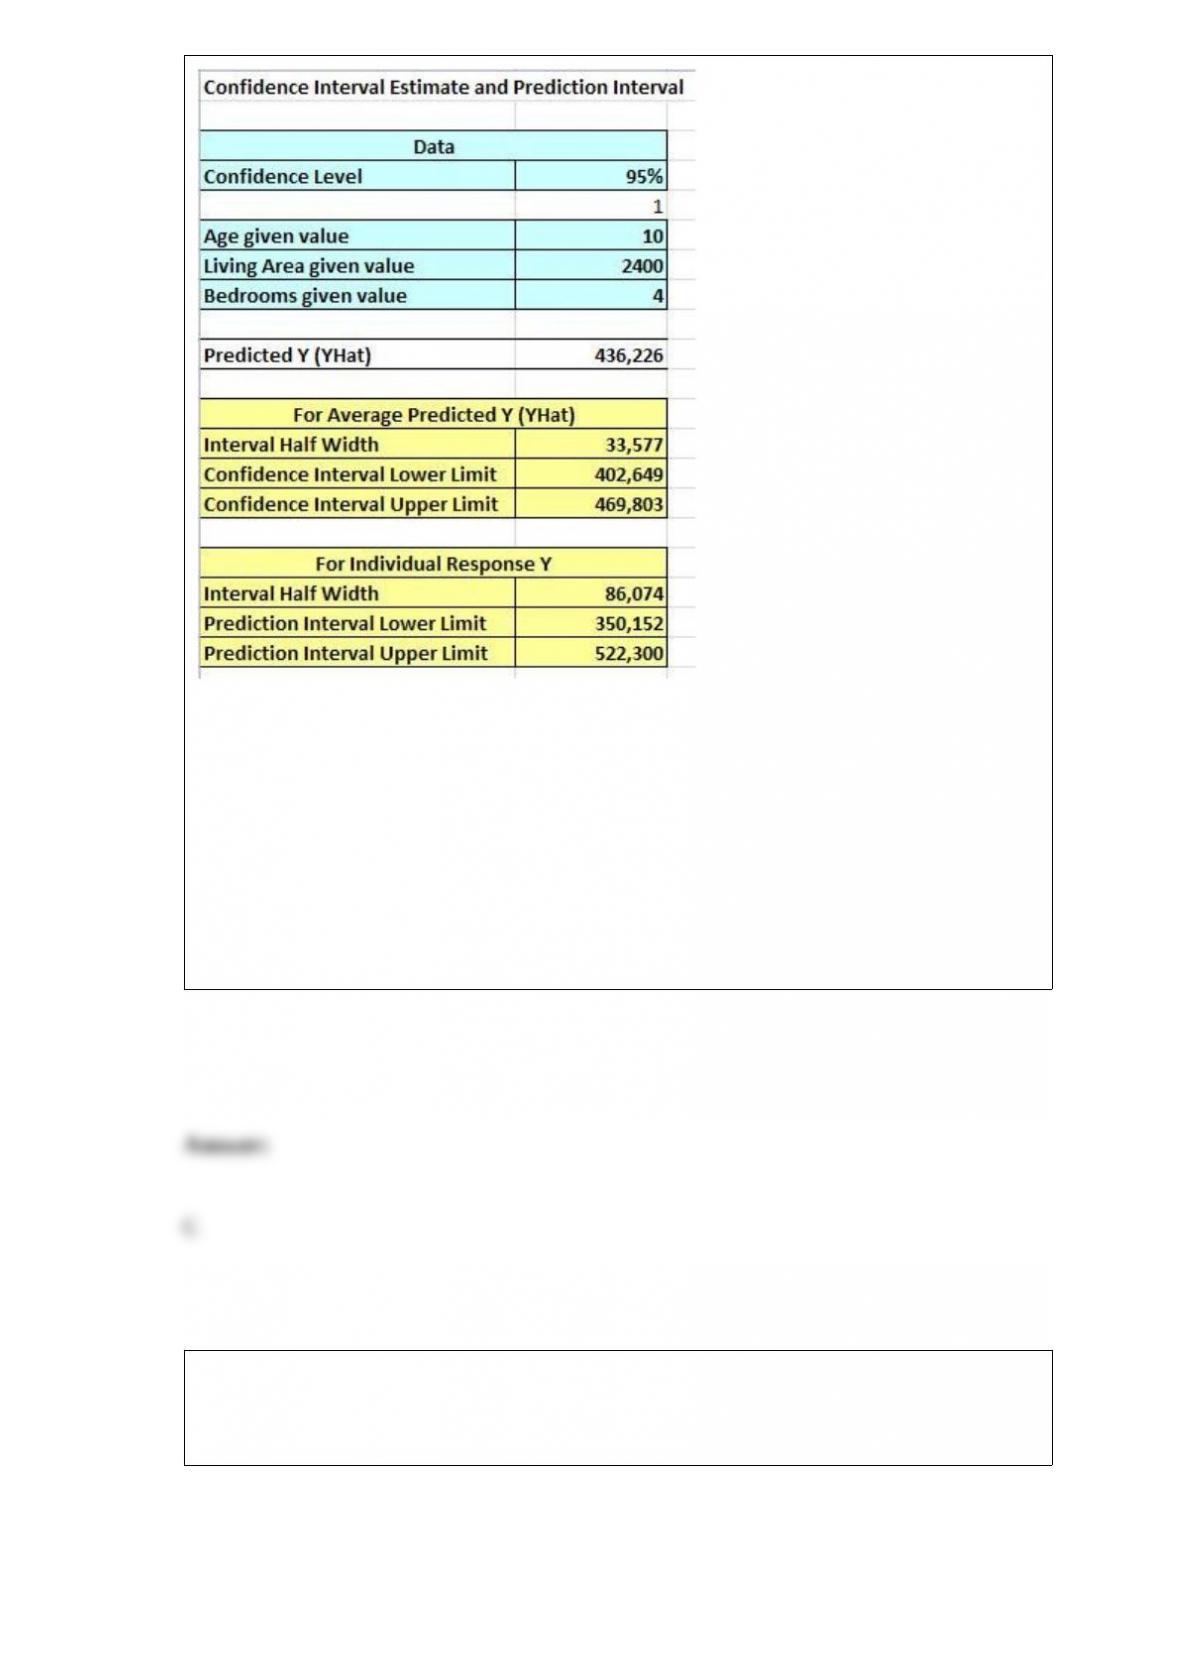
Which group of independent variables is significant in this model using α = 0.05?
A) Age, Living Area, Bedrooms
B) Age, Living Area
C) Living Area, Bedrooms
D) Age, Bedrooms
Costco sells paperback books in their retail stores and wanted to examine the
relationship between price and demand. The price of a particular novel was adjusted
each week and the weekly sales were recorded in the table below.
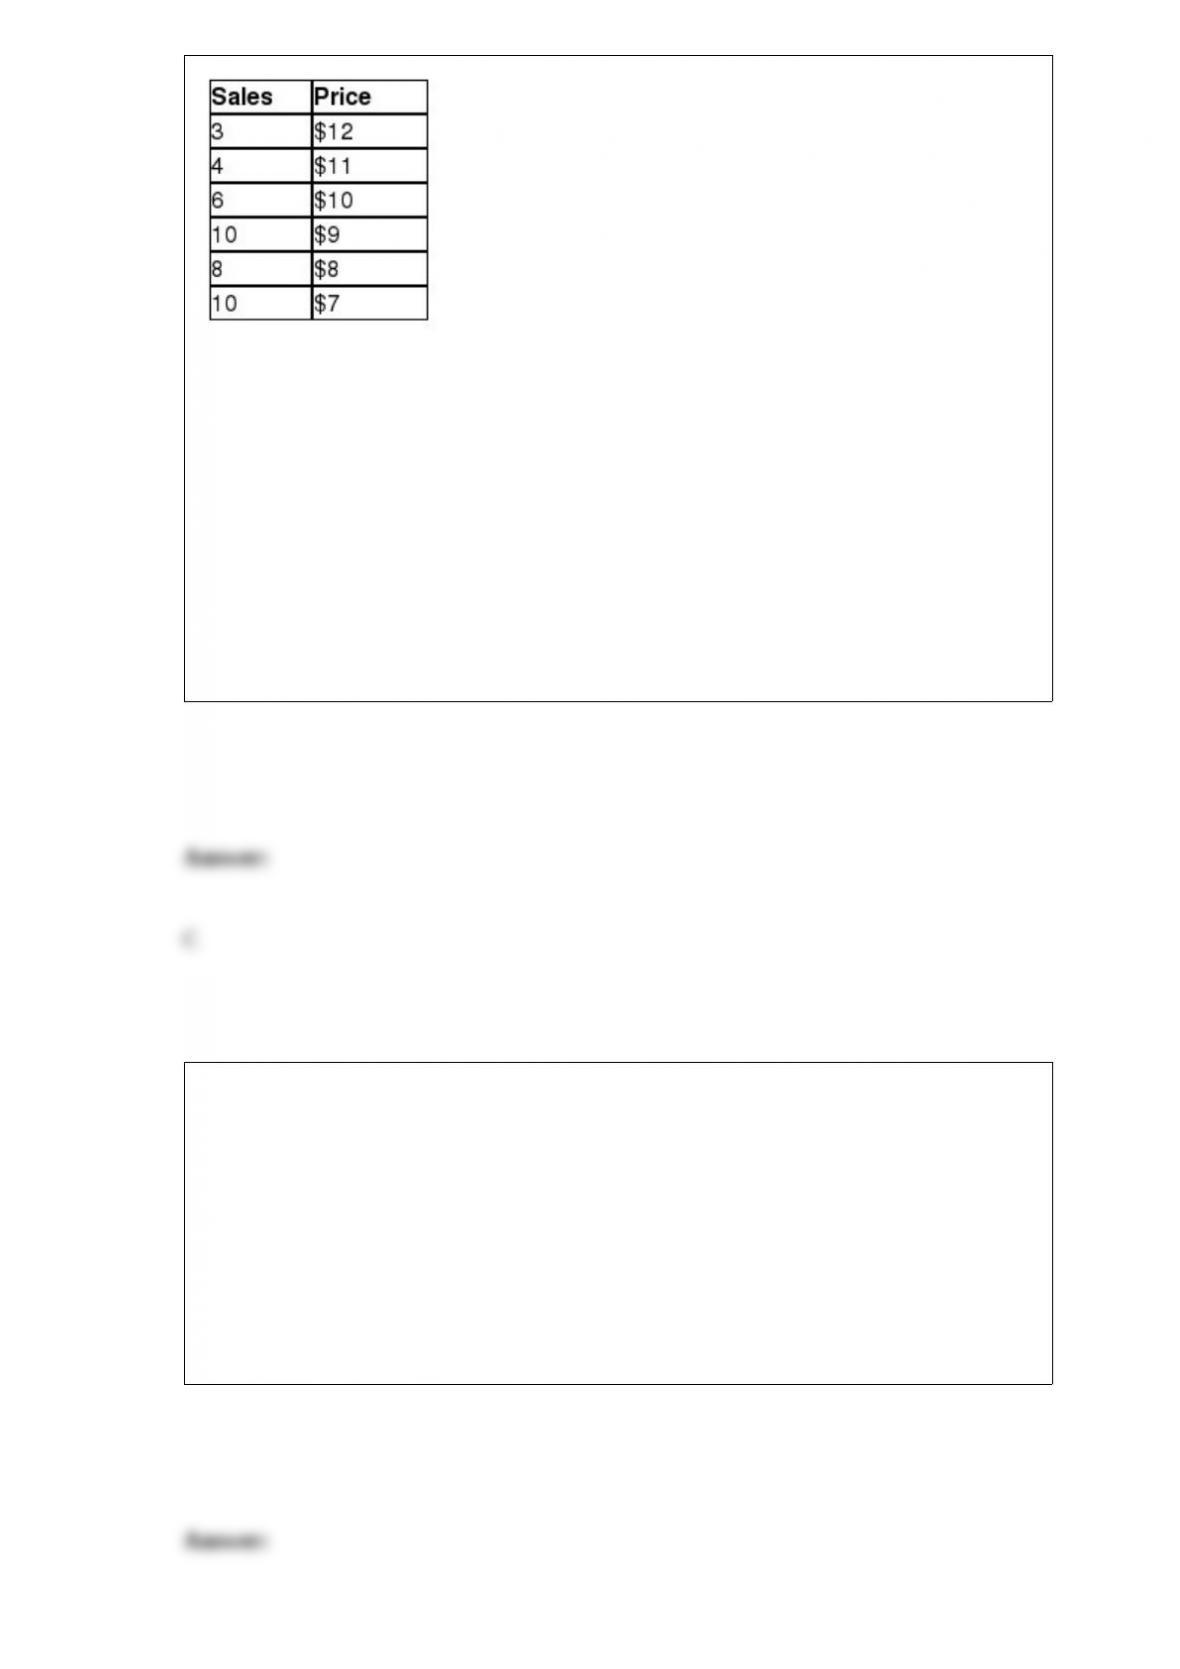
Management would like to use simple regression analysis to estimate weekly demand
for this novel using the price of the novel. The total sum of squares for this sample is
________.
A) 20.75
B) 35.60
C) 44.83
D) 53.51
The ________ measures the variation in the dependent variable that is explained by the
independent variable in simple regression analysis.
A) sum of squares within
B) sum of squares error
C) sum of squares regression
D) total sum of squares
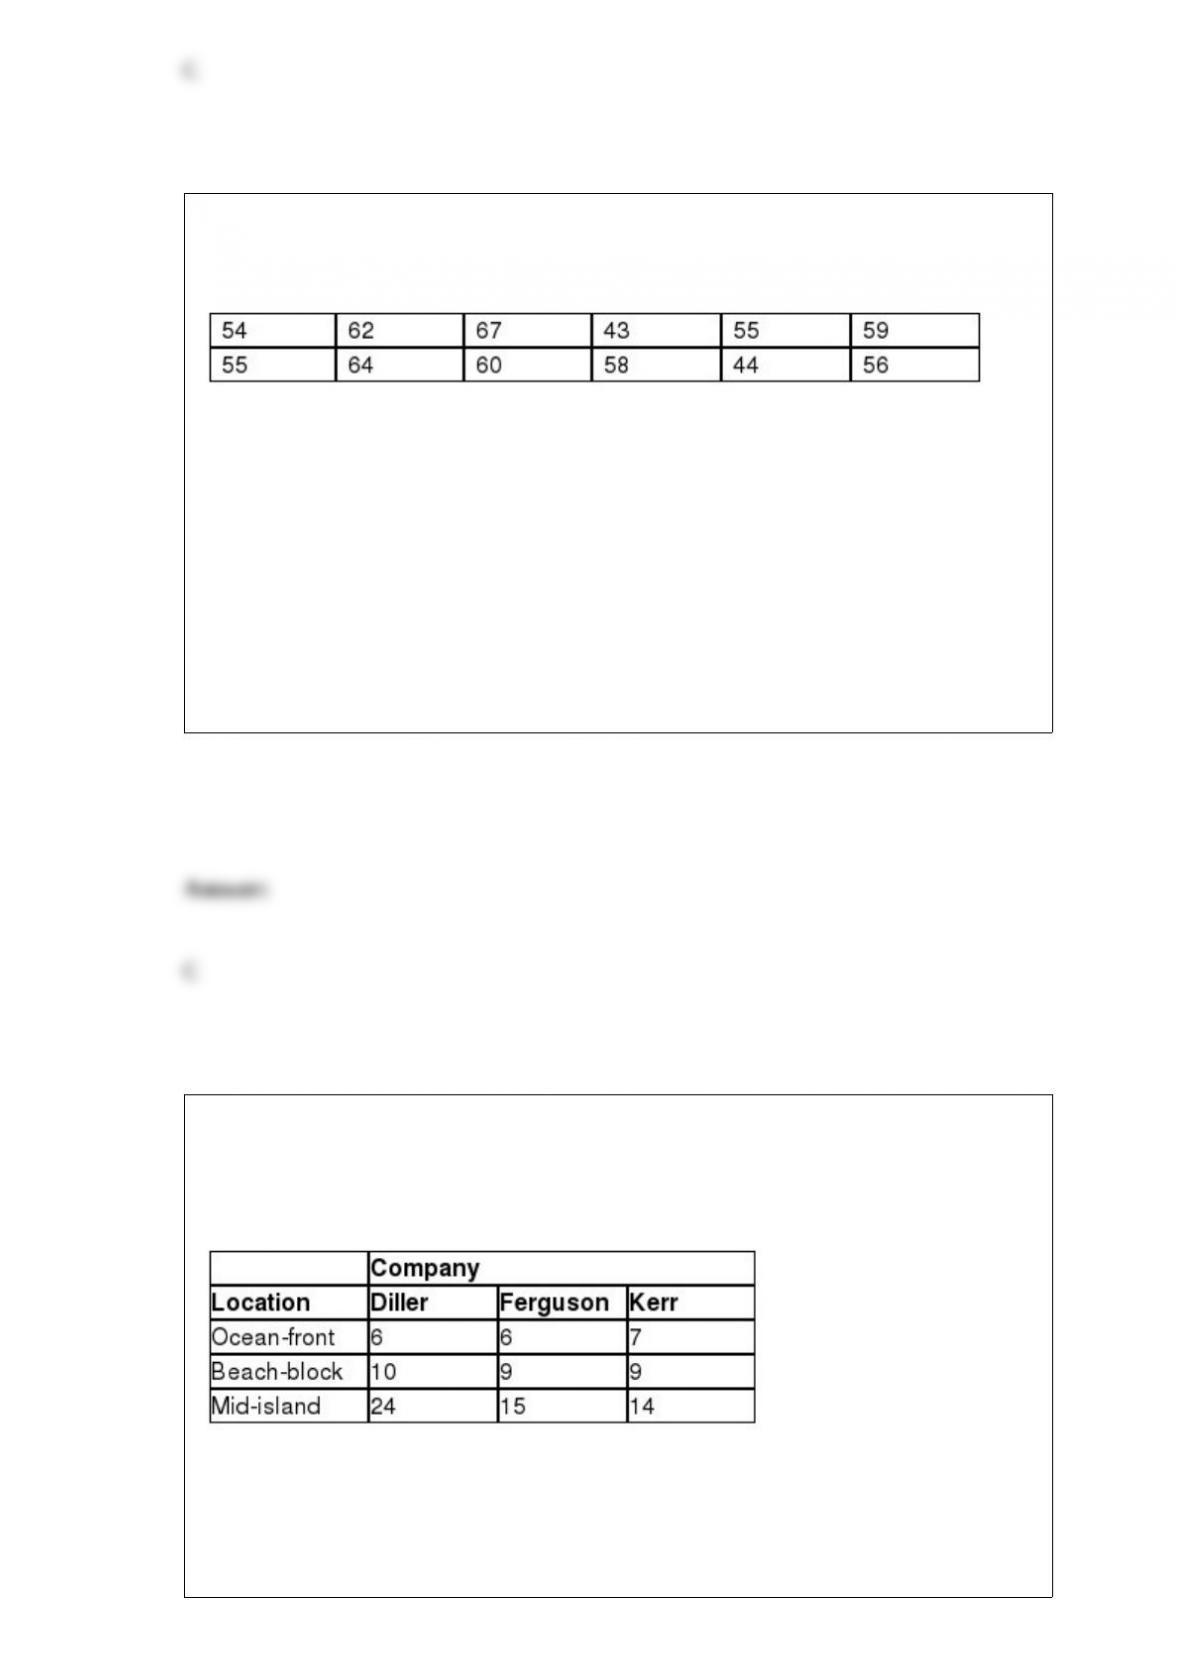
A professor would like to test the hypothesis that the median number of minutes that a
student needs to complete a statistics exam is equal to 50 minutes. The following
random sample of exam times from 12 students was collected to test this hypothesis.
The appropriate nonparametric procedure for this analysis is the _________________
test.
A) Kruskal-Wallis
B) Wilcoxon rank-sum
C) sign
D) Wilcoxon signed-rank
A beach community on a barrier island has three real estate companies that list rental
properties by location which are classified as ocean-front, beach-block, or mid-island.
The following contingency table shows the number of properties listed by each
company along with their location.
Using α = 0.10, the conclusion for this hypothesis test would be that because the test
statistic is
______________________________________________________________________.

A) more than the critical value, we reject the null hypothesis and cannot conclude that
the real estate company and the location of the rental properties are independent of one
another
B) more than the critical value, we cannot reject the null hypothesis and can conclude
that the real estate company and the location of the rental properties are independent of
one another
C) less than the critical value, we can reject the null hypothesis and conclude that the
real estate company and the location of the rental properties are independent of one
another
D) less than the critical value, we cannot reject the null hypothesis and cannot conclude
that the real estate company and the location of the rental properties are not independent
of one another
Two real estate companies, Century 21 and RE/MAX, compete with one another in a
local market. The manager of the Century 21 office would like to advertise that homes
listed with RE/MAX average more than 10 days on the market when compared to
homes listed with his company. The following data shows the sample size and average
number of days on the market for the two companies along with the population standard
deviations.
If Population 1 is defined as RE/MAX and Population 2 is defined as Century 21, the
80% confidence interval for the difference in population means is ________.
A) (17.8, 26.2)
B) (11.5, 32.7)
C) (5.4, 38.6)
D) (“3.0, 47.0)
Use the following information to answer the question(s) below.
The National Football League has developed a regression model to predict the number
of wins during a season for a team using the following independent variables:
•Average points per game during the season (PPG)
•Average number of penalties committed per game during the season (PEN)
•Turnover differential during the season (TO)
Turnover differential is defined as the number of times the team took the ball away from
their opponent with a turnover minus the number of times the team gave the ball away to
their opponent with a turnover. For example, if TO = +5, the team had five more
takeaways than giveaways. If TO = “7, the team had seven more giveaways than
takeaways during the season.
The following Excel output shows the partially completed regression output from a
random season.
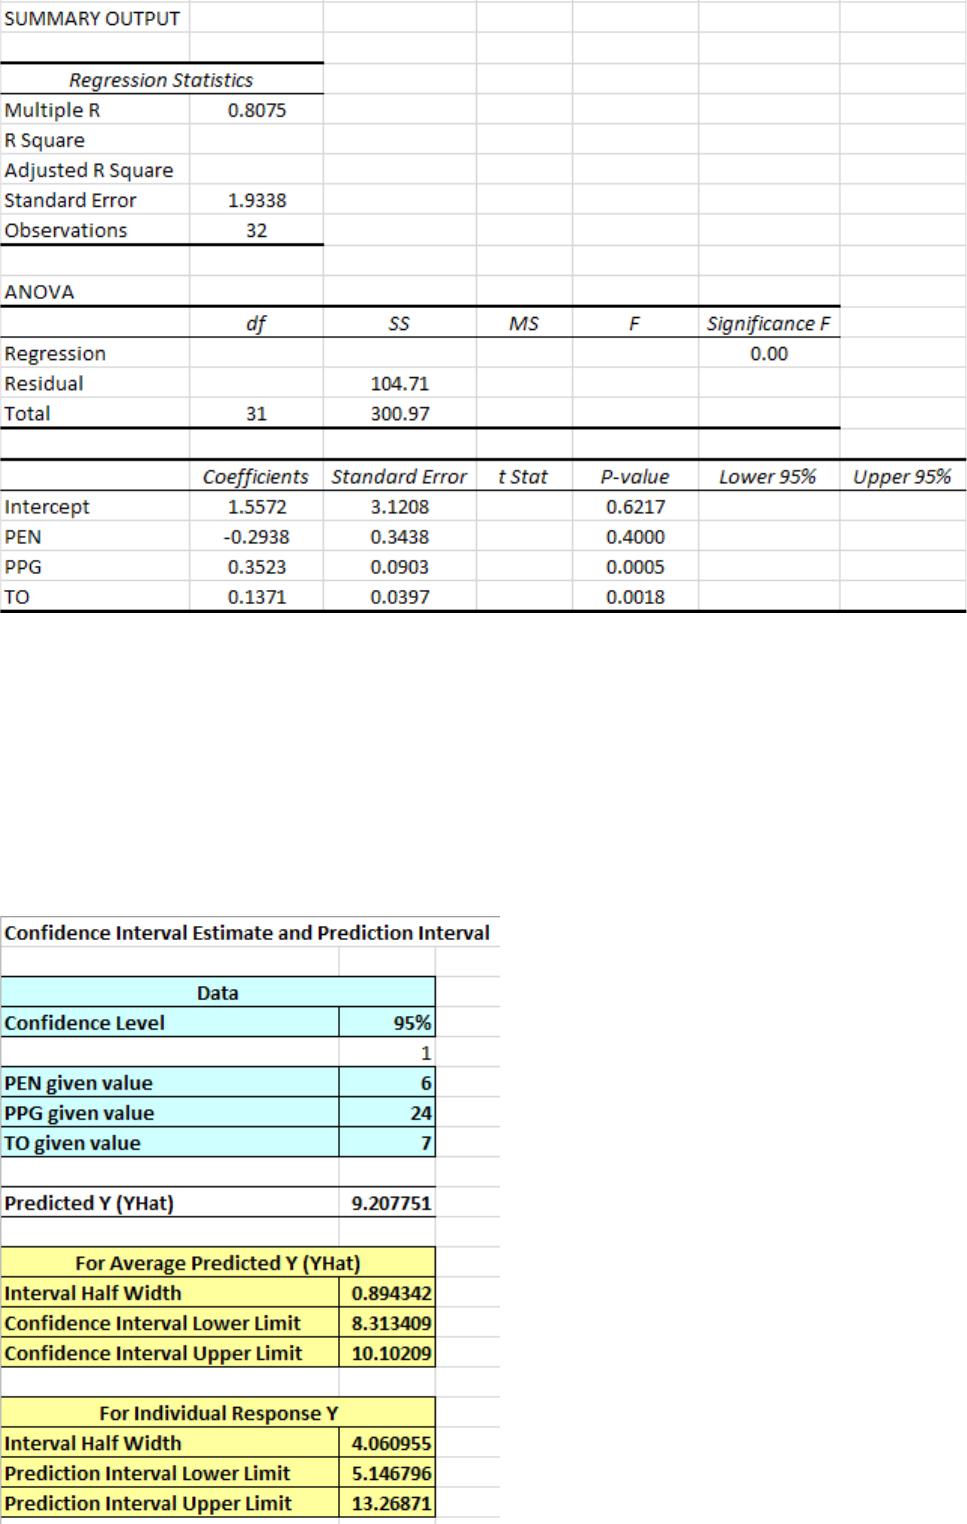

The F-test statistic for the overall regression model is ________.
A) 196.26
B) 65.42
C) 17.49
D) 3.74
The National Center for Education would like to estimate the proportion of students
who defaulted on their student loans for the state of Arizona. The total sample size
needed to construct a 95% confidence interval for the proportion of student loans in
default with a margin of error equal to 4% is ________.
A) 336
B) 416
C) 455
D) 601
The federal government would like to test the hypothesis that the standard deviation for
the age of men filing for Social Security is higher than the standard deviation for the
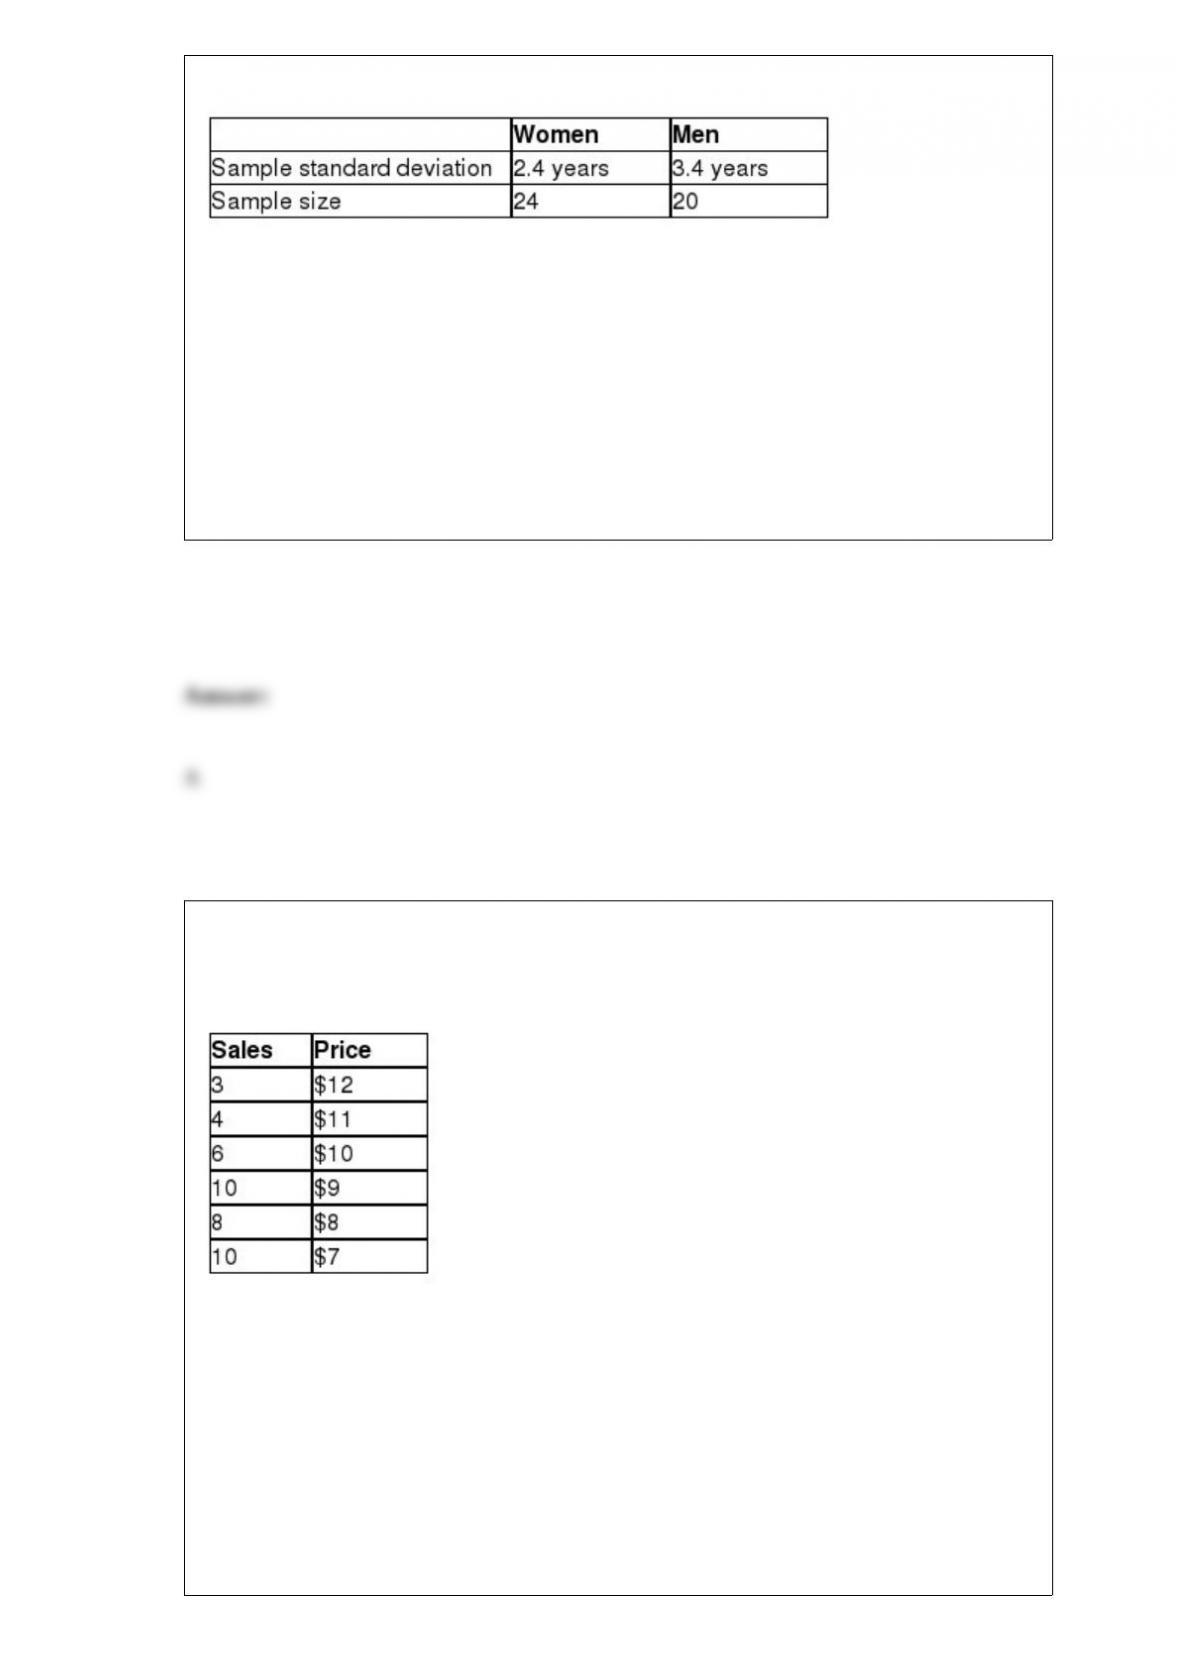
age of women. The following table summarizes sample statistics from each population.
The degrees of freedom for the critical value for Population 1 would be ________.
A) 19
B) 20
C) 23
D) 24
Costco sells paperback books in their retail stores and wanted to examine the
relationship between price and demand. The price of a particular novel was adjusted
each week and the weekly sales were recorded in the table below.
Management would like to use simple regression analysis to estimate weekly demand
for this novel using the price of the novel. The y-intercept for the regression equation is
________.
A) 20.676
B) 25.155
C) 29.601

D) 32.772
Using the _____________ criterion you choose the alternative with the highest average
payoff in the decision table.
A) maximin
B) equally likely
C) minimax regret
D) maximax
The technique of ________ enables us to describe a straight line that best fits a series of
ordered pairs (x,y).
A) analysis of variance
B) correlation analysis
C) simple regression analysis
D) hypothesis testing
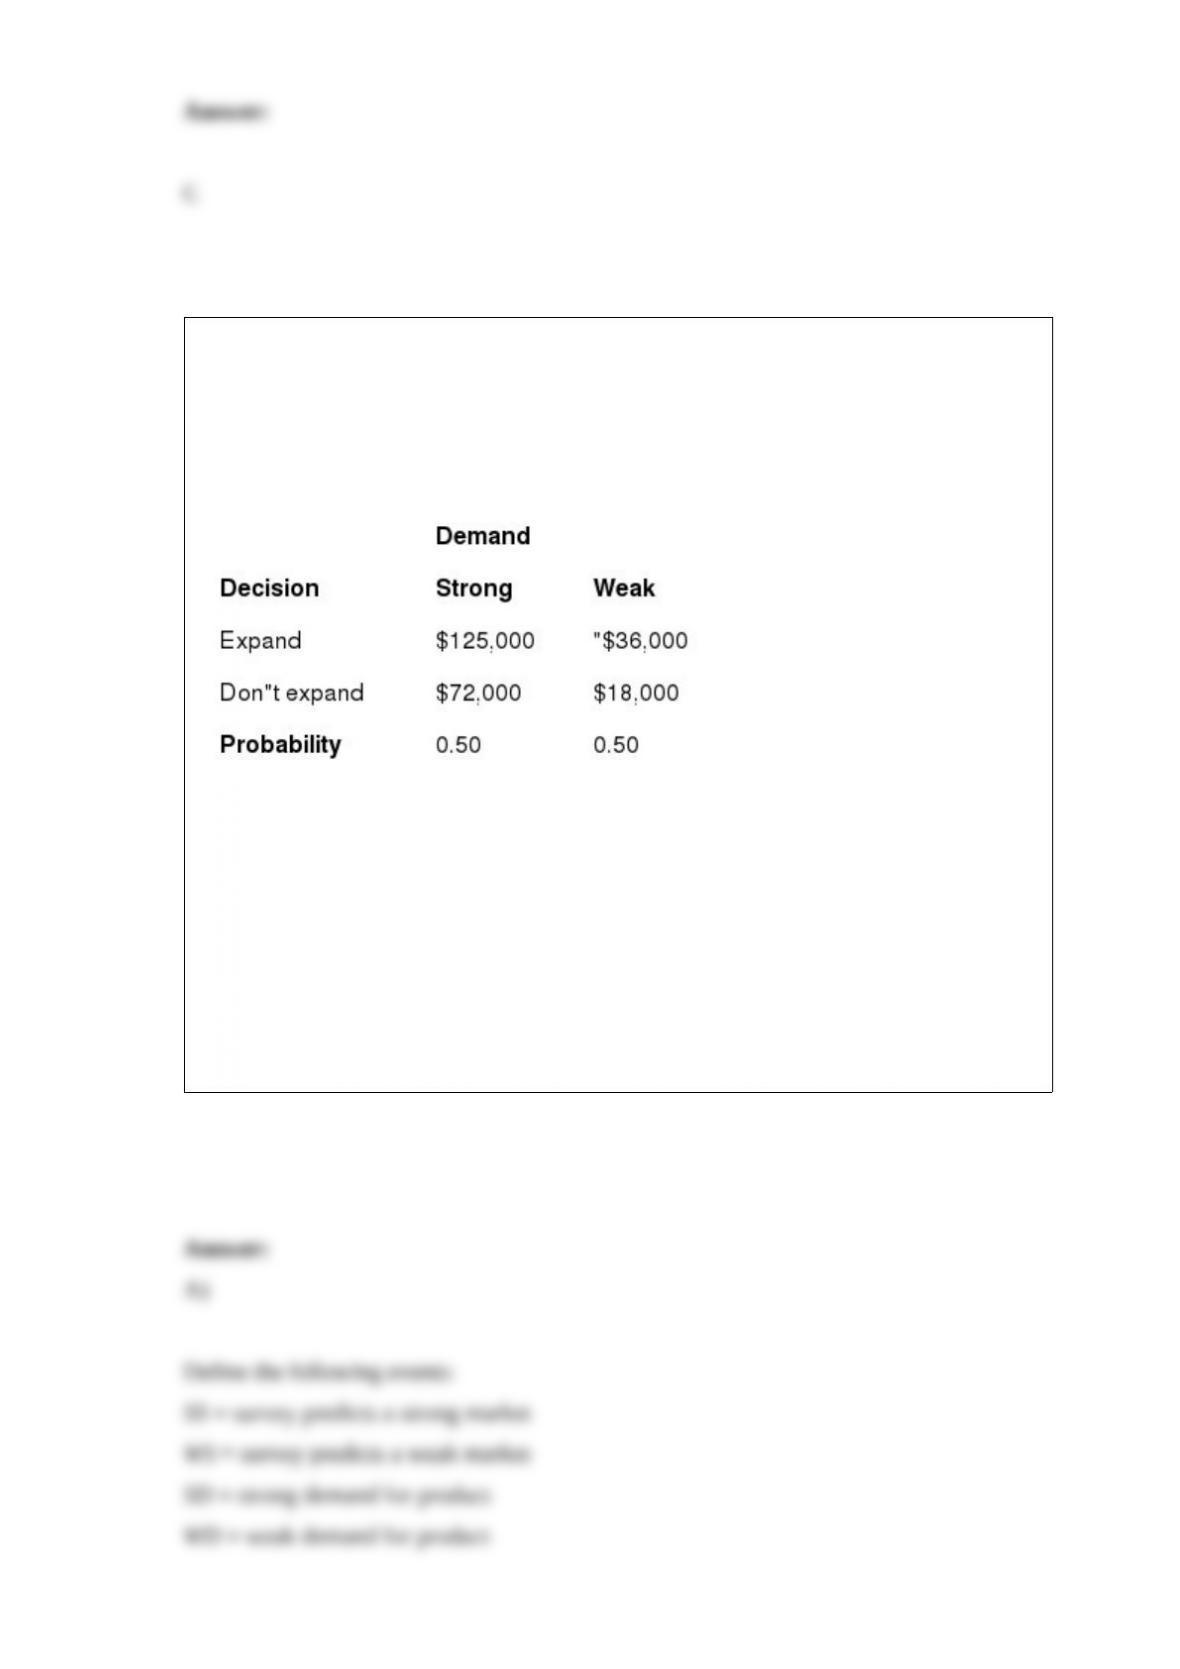
Note: This problem requires the calculation of posterior probabilities. Dawson’s is a
fruit and vegetable stand in southern New Jersey that is considering an expansion of the
facility to take advantage of increased future demand. The future demand for the
business will be strong or weak with a 50/50 chance of each. The following decision
table summarizes Dawson’s options and the associated payoffs.
Dawson’s has the option to hire a market research firm to conduct a survey to better
ascertain the demand for their business. The cost of the survey is $5,000. If the market
has strong demand for the business, the probability that the survey will predict a strong
demand is 76%. If the market has a weak demand for the product, the probability that
the survey will predict a strong demand is 32%.
A) Construct a decision tree to determine Dawson’s course of action.
B) What is the most that Dawson’s should pay for the survey?

The following data represent the number of sweatshirts sold for each of the past six
days for Hoys Department Store at the beach in Avalon, New Jersey.
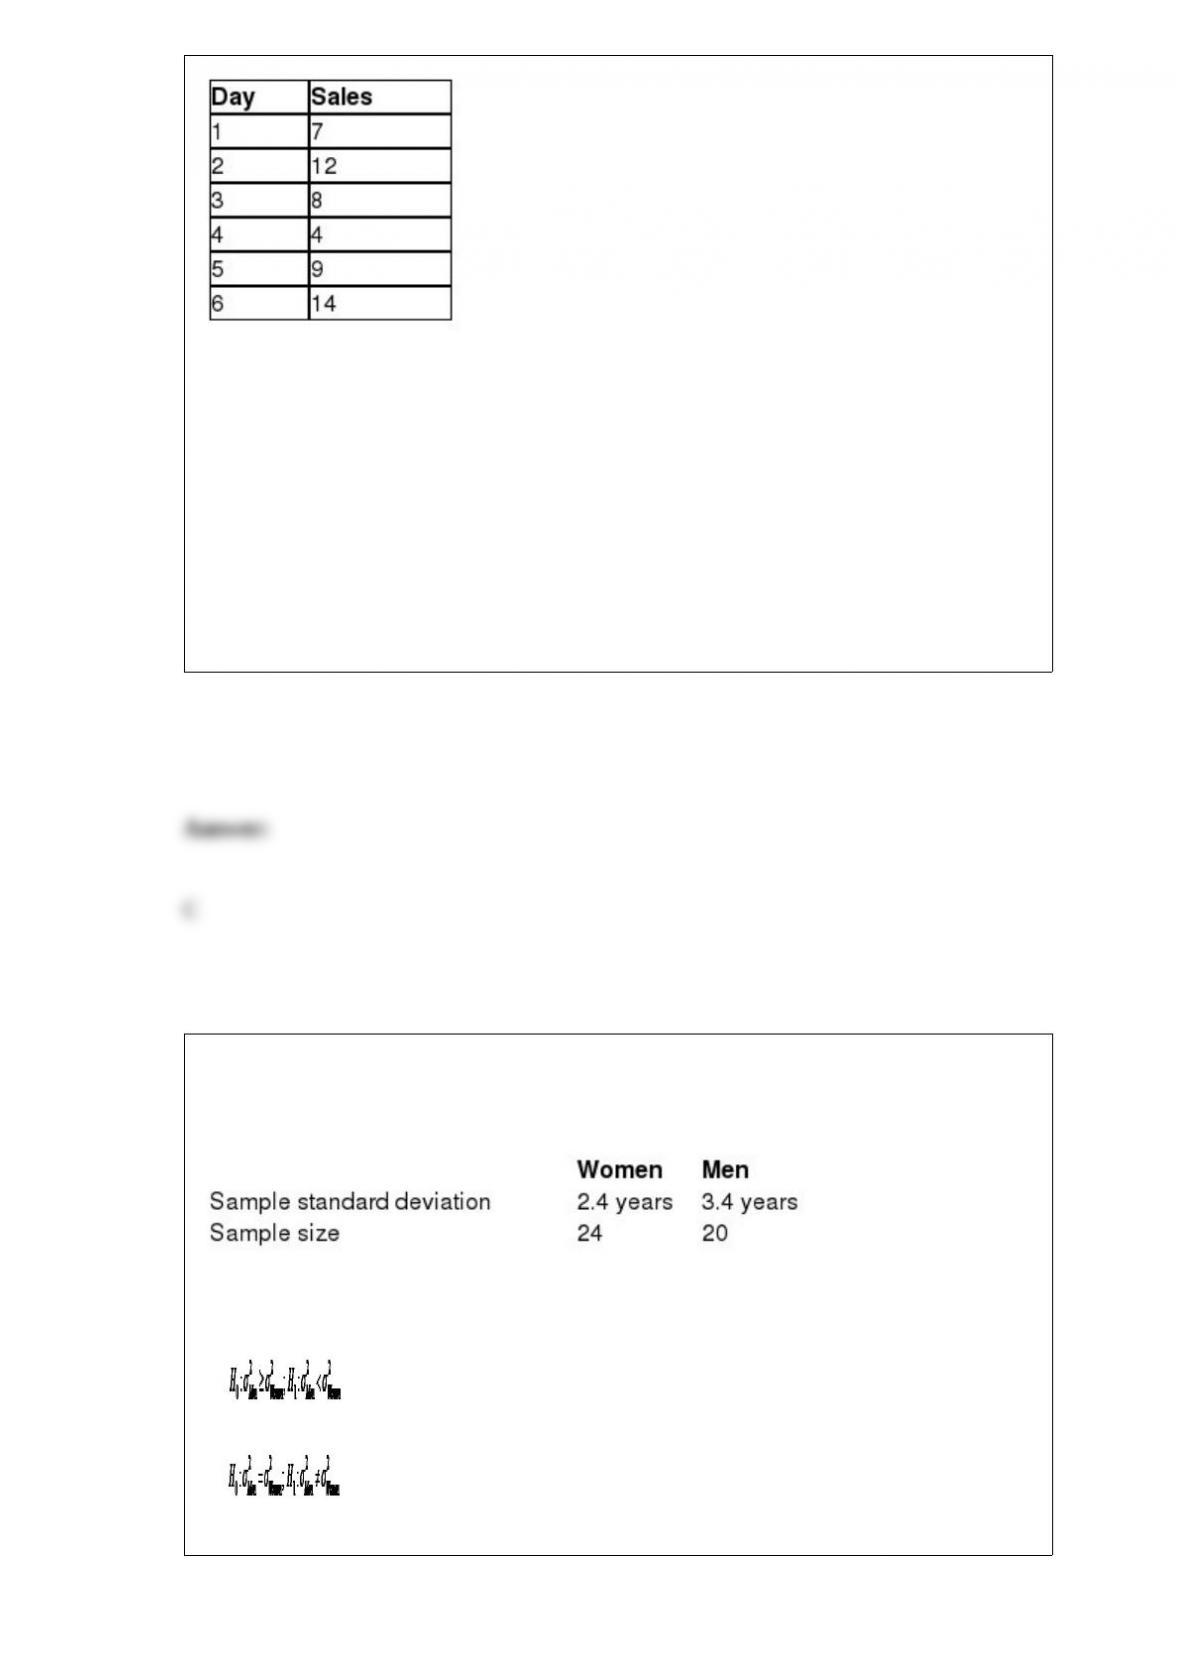
Using an exponential smoothing with trend adjustment technique with alpha equal to
0.3 and beta equal to 0.6, the sales forecast for Day 7 is ________.
A) 9.1
B) 9.6
C) 10.8
D) 11.5
The federal government would like to test the hypothesis that the standard deviation for
the age of men filing for Social Security is higher than the standard deviation for the
age of women. The following table summarizes sample statistics from each population.
The correct hypothesis statement would be _______________.
A)
B)

C)
D)
The Department of Transportation would like to test the hypothesis that the average age
of cars on the road is less than 12 years. A random sample of 45 cars had an average age
of 10.6 years. It is believed that the population standard deviation for the age of cars is
4.1 years. The Department of Transportation would like to set α = 0.05. The conclusion
for this hypothesis test would be that because the test statistic is
______________________________________.
A) more than the critical value, we can conclude that the average age of cars on the
road is less than 12 years
B) more than the critical value, we cannot conclude that the average age of cars on the
road is less than 12 years
C) less than the critical value, we can conclude that the average age of cars on the road
is less than 12 years
D) less than the critical value, we cannot conclude that the average age of cars on the
road is less than 12 years
The number of pages in your business statistics textbook is an example of quantitative
data.
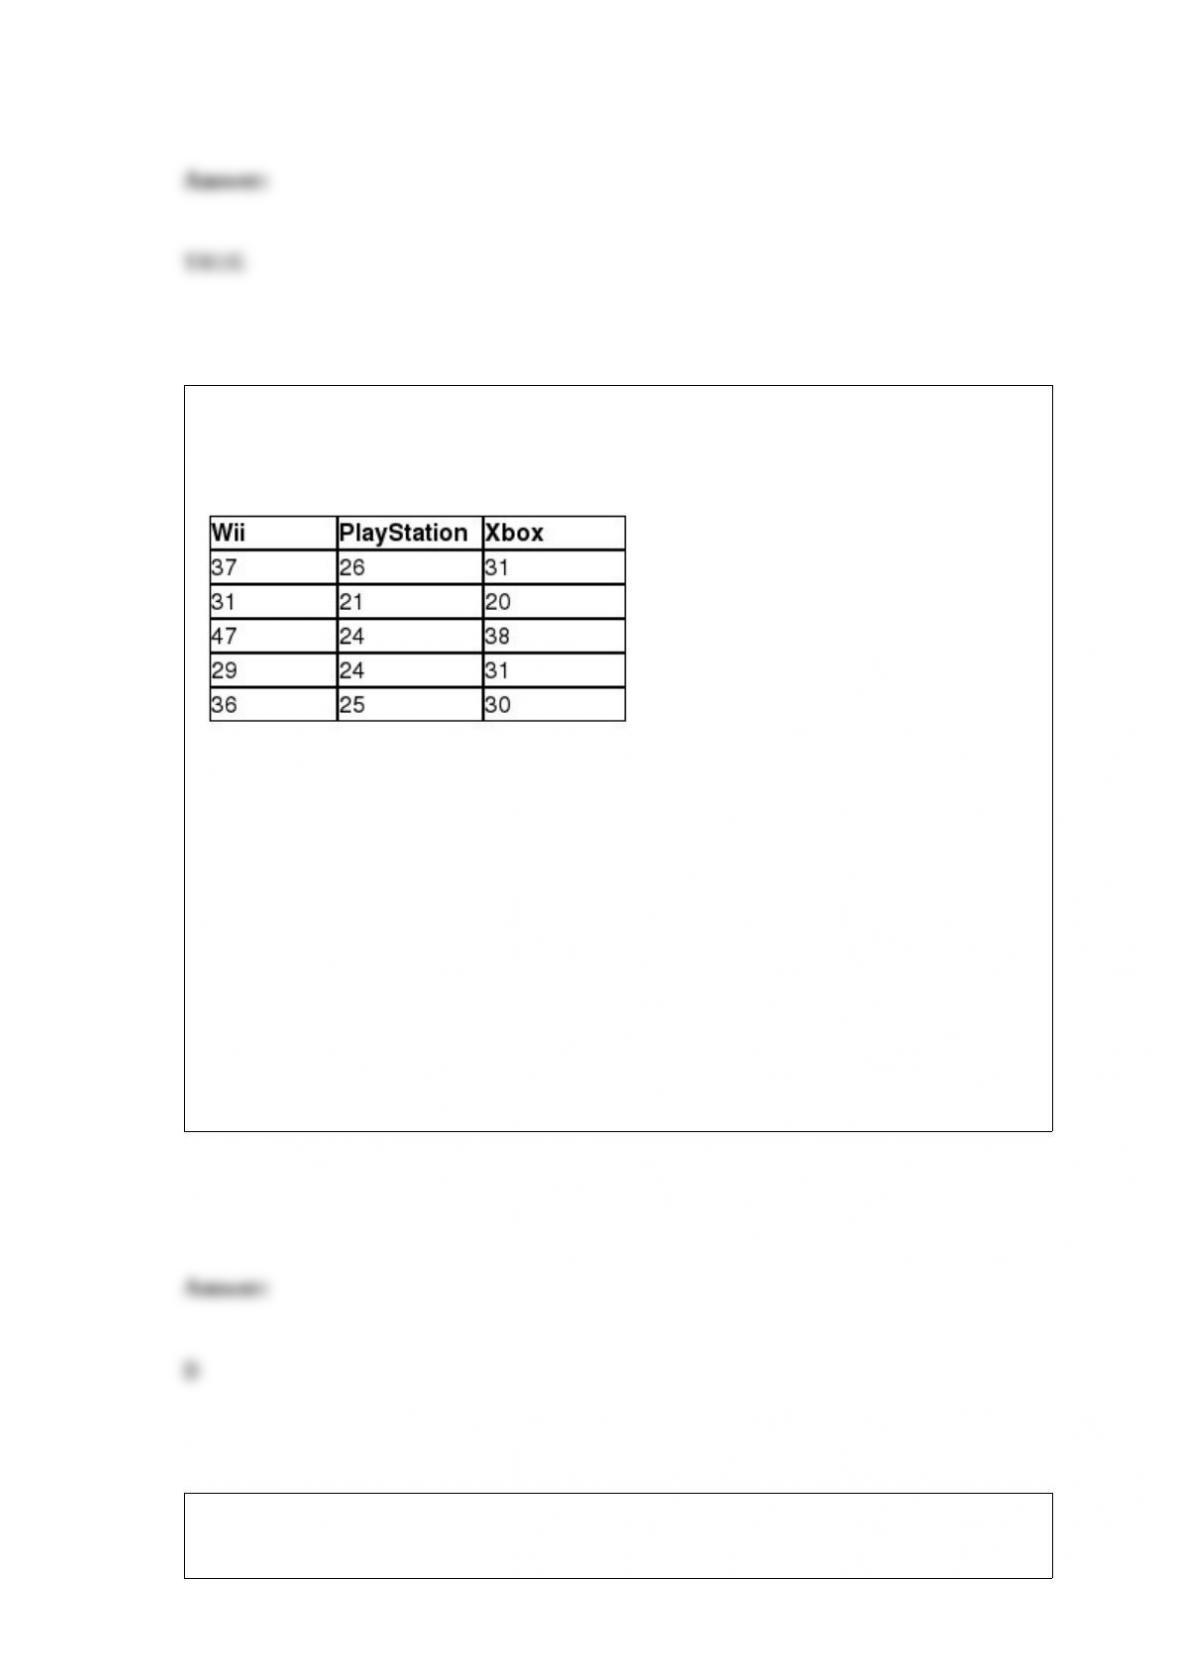
Nintendo Sony would like to test the hypothesis that a difference exists in the average
age of users of a Wii, a PlayStation, or an Xbox console game. The following data
represent the age of a random sample of Wii, PlayStation, and Xbox users.
The conclusion for the Tukey-Kramer multiple comparisons test using α = 0.05 is that
_____________________________________________________________________.
A) the average age of Wii users is different from the average age of Xbox users
B) the average age of Wii users is different from the average age of PlayStation users
C) the average age of PlayStation users is different from the average age of Xbox users
D) there is no difference in the average age of users of a Wii, a PlayStation, or an Xbox
console game
A novel on the Amazon.com web site has the following ratings, in number of stars,
from reviewers:
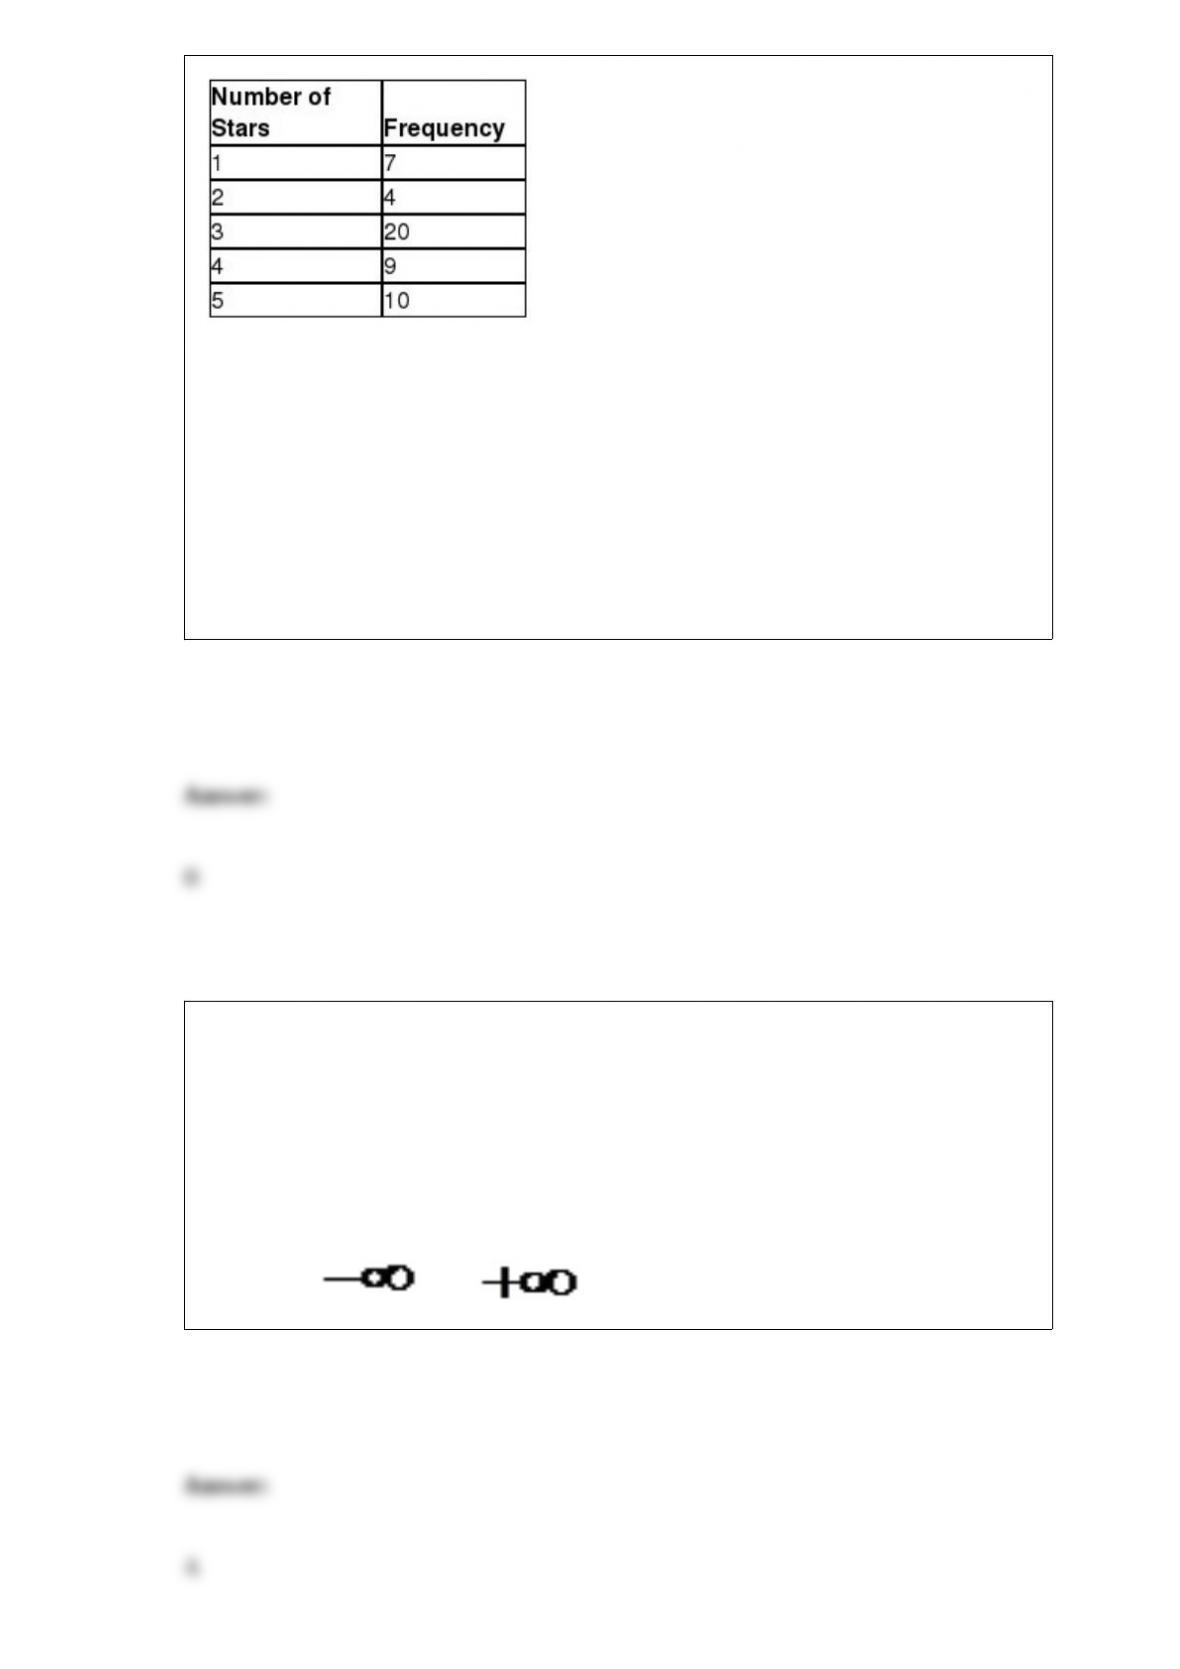
What is the mean of this distribution?
A) 2.57
B) 3.22
C) 3.76
D) 3.85
The sample correlation coefficient can be equal to any value __________
A) between “1.0 and +1.0.
B) greater than or equal to zero.
C) other than zero.
D) between and .
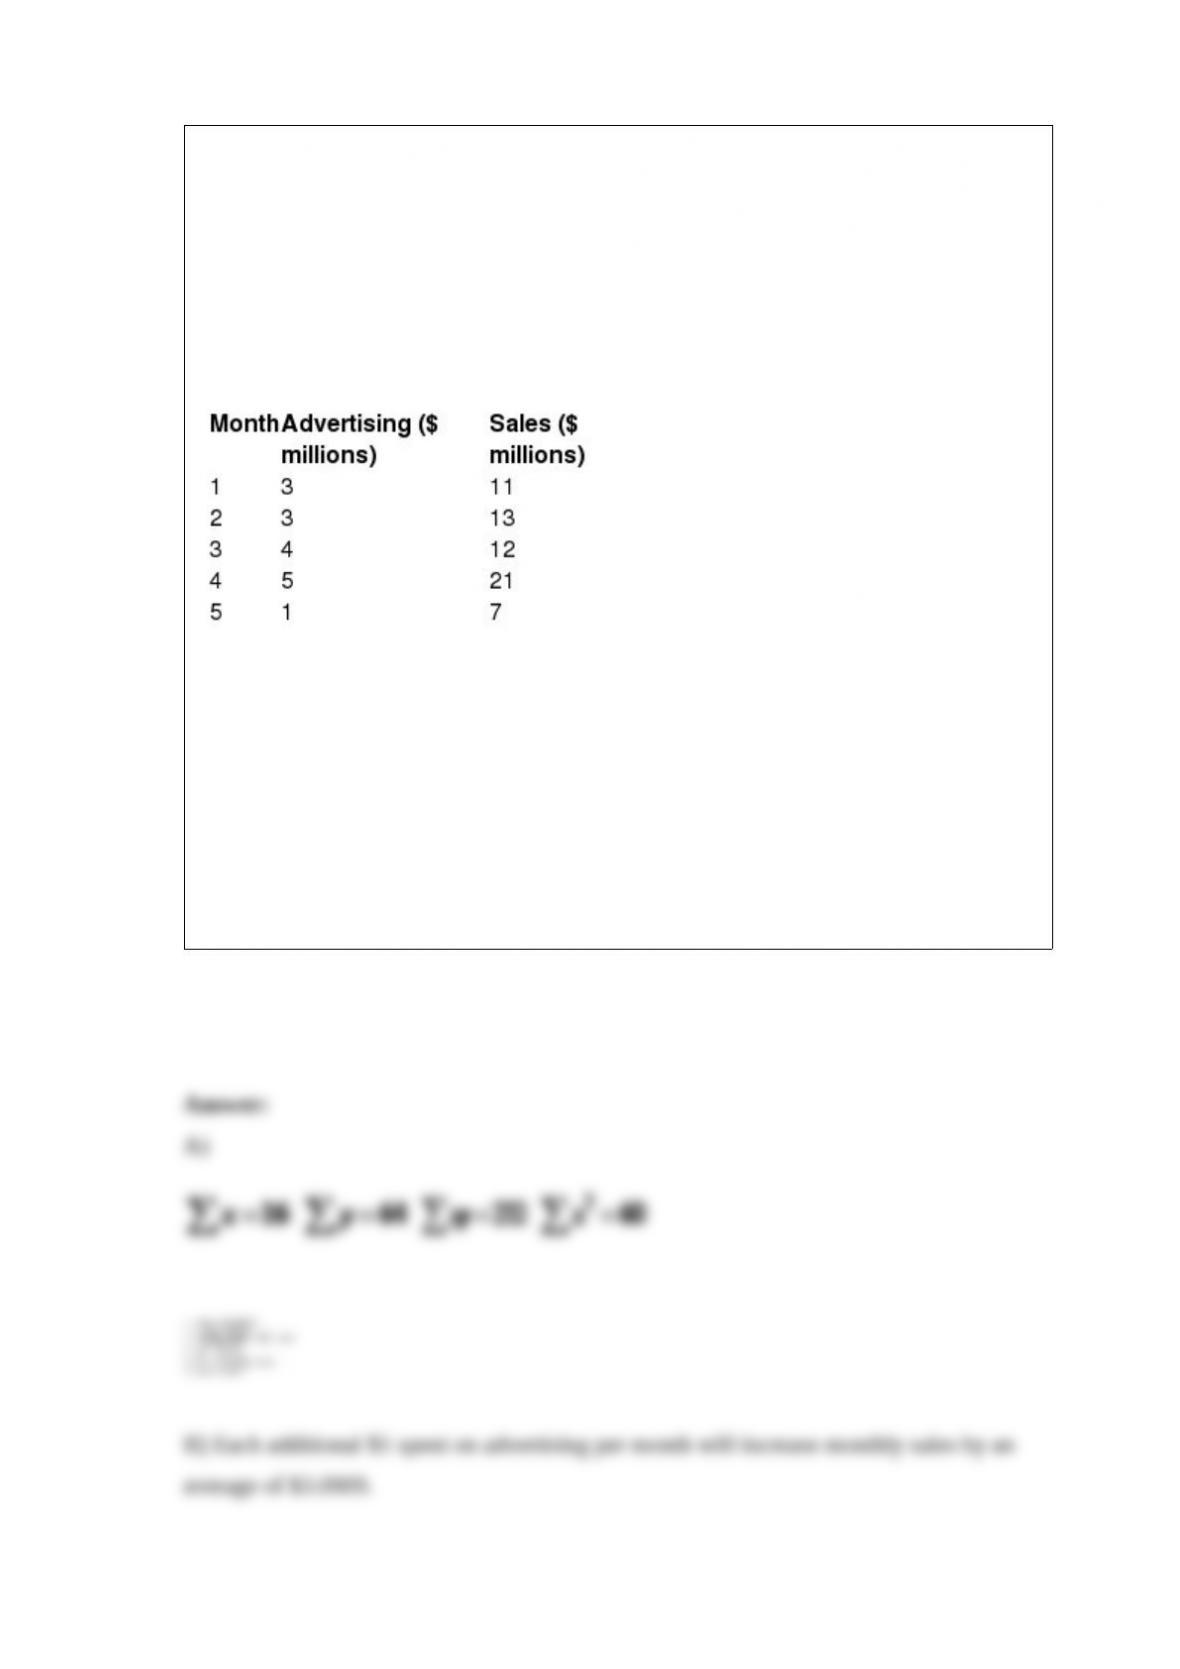
Use the information below to answer the following question(s).
Steve Taylor is the owner of Home Plus, which is a chain of home improvement stores.
He would like to investigate the relationship between month advertising and monthly
sales. The table below shows the amount spent on advertising, in millions of dollars,
over several months along with the corresponding sales, also in millions of dollars.
Use the Home Plus data to:
A) Describe the regression line that will predict monthly sales based on the monthly
advertising.
B) Interpret the slope of the regression equation.
C) Predict the average number of sales for a month with $2 million spent on
advertising.
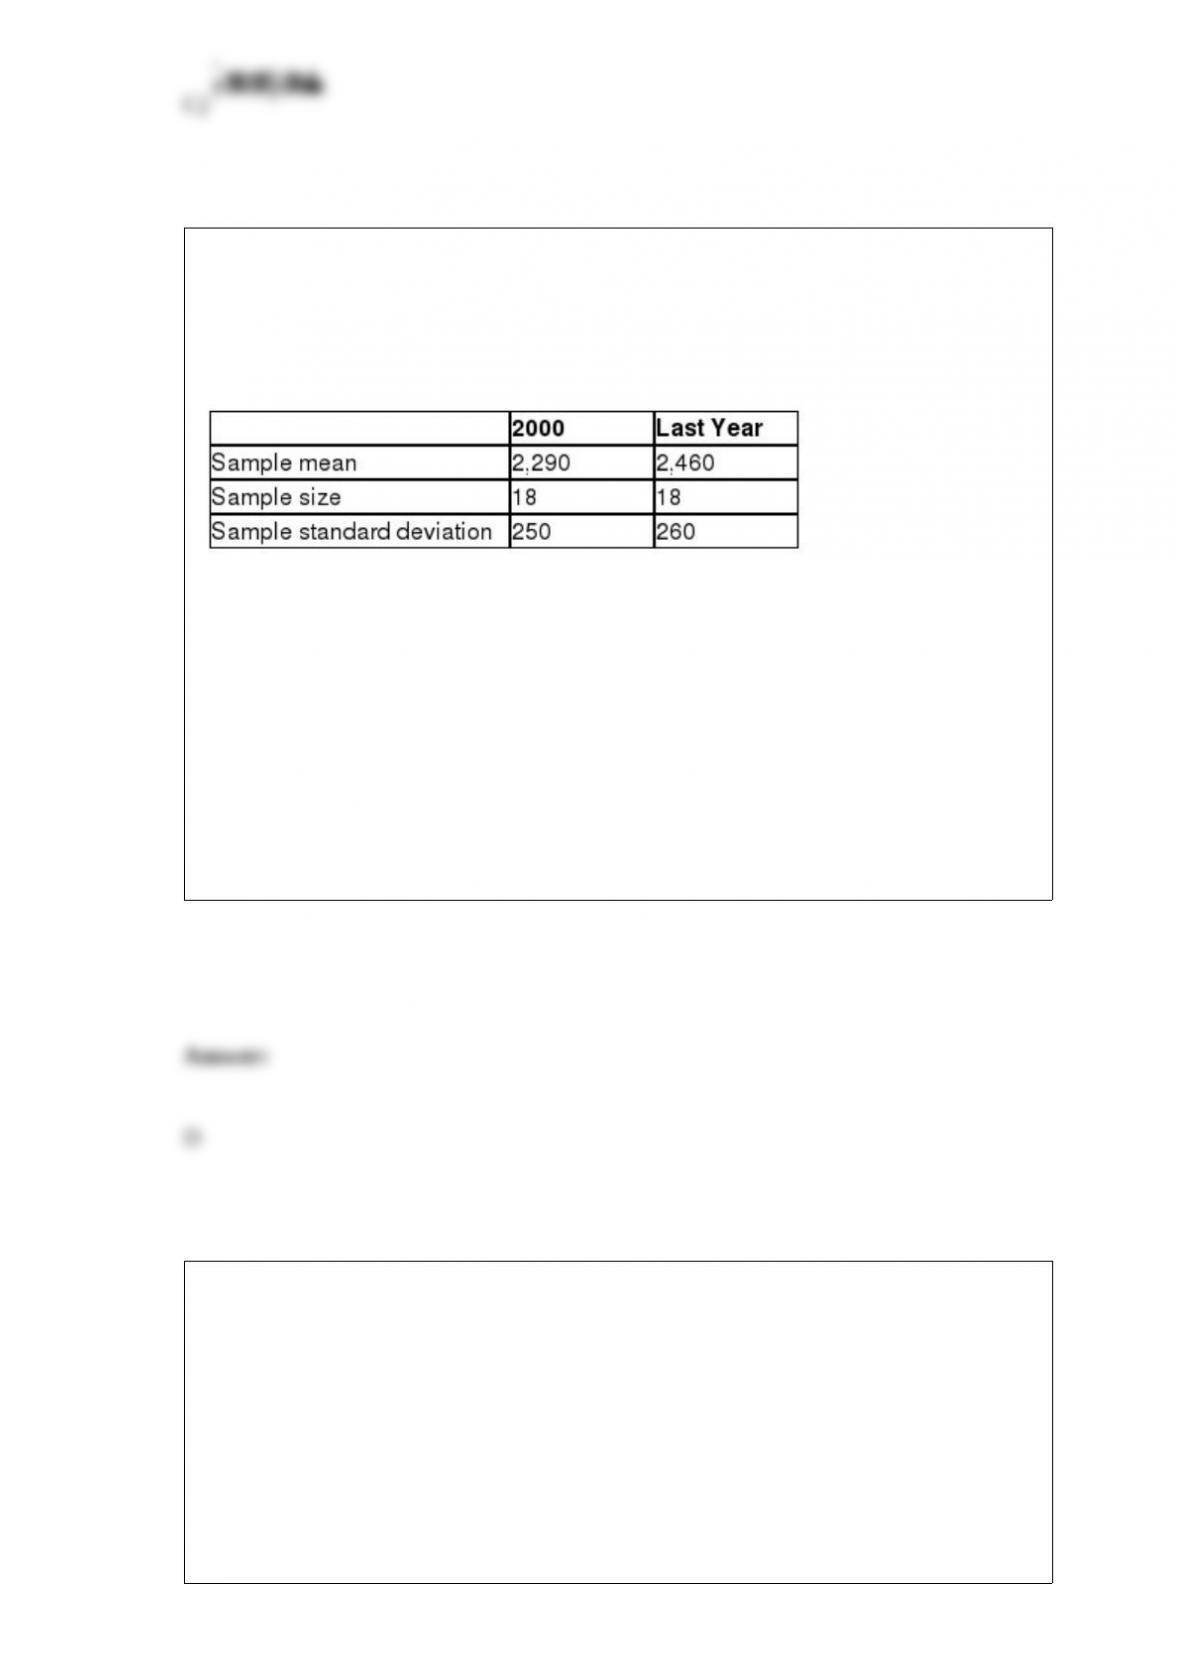
The Department of Housing and Urban Development (HUD) would like to test the
hypothesis that the average size of a newly constructed house last year is different from
the average size of a newly constructed house in 2000. The following data summarizes
the sample statistics for house sizes, in square feet, for both years. Assume that the
population variances are equal.
If Population 1 is defined as homes built in 2000 and Population 2 is defined as homes
built last year, the p-value for this hypothesis test would be between ________.
A) 0.005 and 0.01
B) 0.01 and 0.025
C) 0.025 and 0.05
D) 0.05 and 0.10
A random sample of 60 business students required an average of 50.7 minutes to
complete a statistics exam. Assume that the population standard deviation to complete
the exam was 10.4 minutes. The standard error of the mean for this sample is ________.
A) 0.63
B) 1.07
C) 1.34

D) 2.30
Bob’s golf score at his local course follows the normal distribution with a mean of 92.1
and a standard deviation of 3.8. The interval around the mean that contains 68% of
Bob’s golf scores is ________.
A) 90.2, 94.0
B) 88.3, 95.9
C) 84.5, 99.7
D) 80.7, 103.5
Medicare would like to test the hypothesis that the average monthly rate for
one-bedroom assisted-living facility is equal to $3,300. A random sample of 12
assisted-living facilities had an average rate of $3,690 per month. The standard
deviation for this sample was $530. Medicare would like to set α = 0.05. The critical
value for this hypothesis test would be ________.
A) 2.201
B) 1.645
C) 2.761
D) 1.985

A survey asked business travelers if they worked harder on a business trip. Fifty percent
of the respondents were younger than 45 years and 50% where 45 years or older.
Sixty-four percent of the younger respondents indicated they did work harder on
business trips while 30% of the older respondents indicated they worked harder on
business trips. Given that the respondent indicated he/she worked harder on business
trips, use Bayes’ Theorem to determine the probability that the person is younger than
45 years old.
Use the following information to answer the question(s) below.
The following data provides the monthly Comcast cable bill for a random sample of 20
households along with the number of televisions in the household (TV), the number of
people living in the household (People), and the number of years that household has
been a Comcast customer (Years).
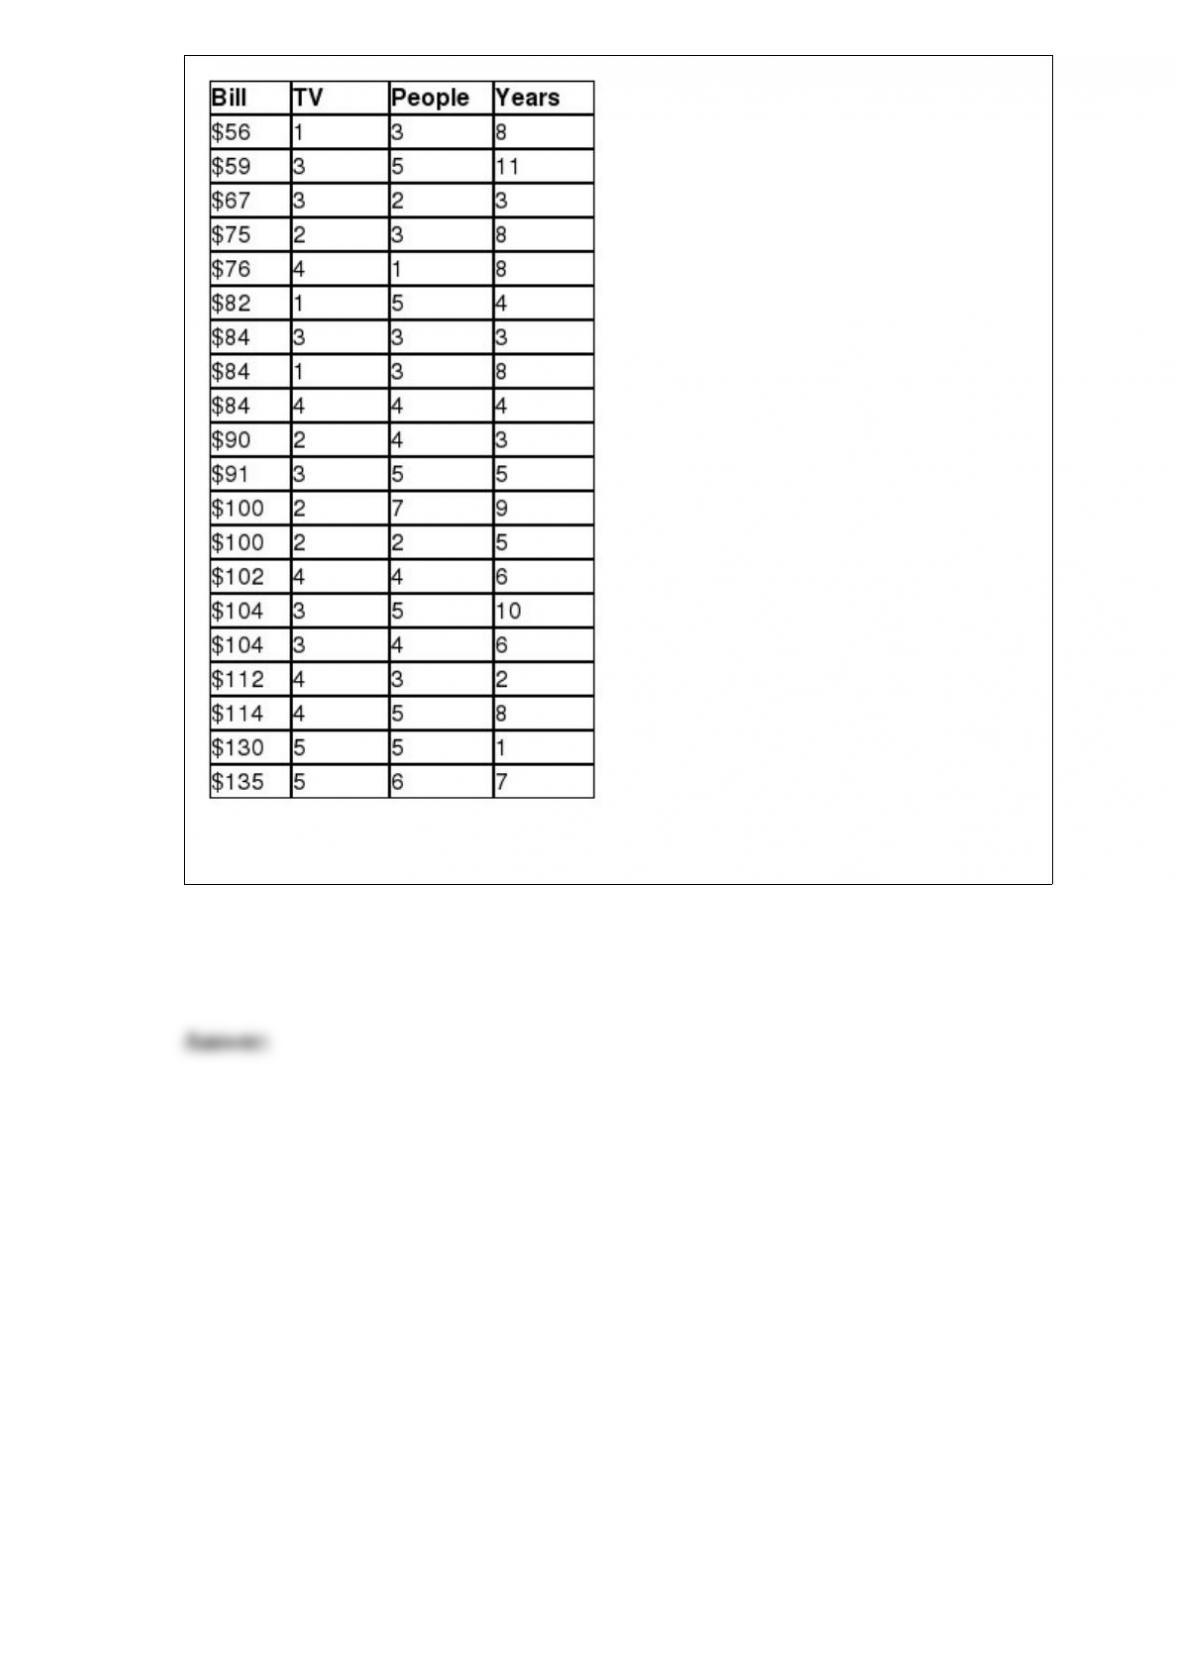
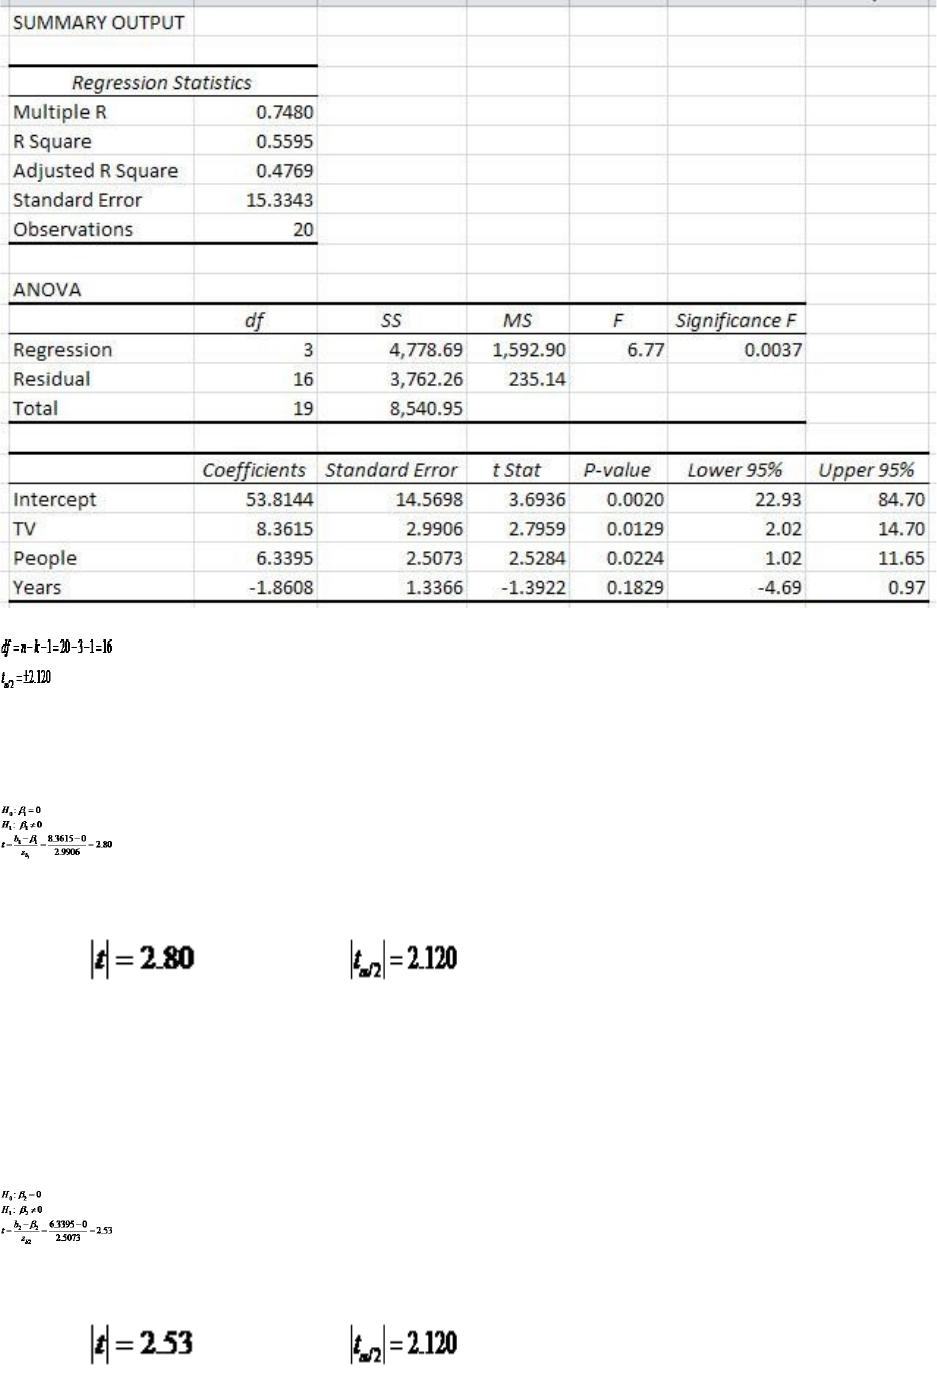
Interpret the p-value for each regression coefficient for the Comcast cable bill model.
John is considering investing in a Subway Sandwich franchise and would like to test the
hypothesis that the average weekly sales exceeds $7,000. A random sample of 26
Subway stores had average weekly sales of $7,640 with a sample standard deviation of
$2,410. Use the p-value approach to test this hypothesis using α = 0.05.

Frito-Lay fills bags of tortilla chips that are labeled with a net weight of 288.5 grams. A
random sample of 24 bags is selected and found to have an average net weight of 289.7
grams and a sample standard deviation of 5.6 grams. Use a 95% confidence interval to
investigate whether the filling process is working properly.
Use the following information to answer the question(s) below.
The following data provides the monthly Comcast cable bill for a random sample of 20
households along with the number of televisions in the household (TV), the number of
people living in the household (People), and the number of years that household has
been a Comcast customer (Years).
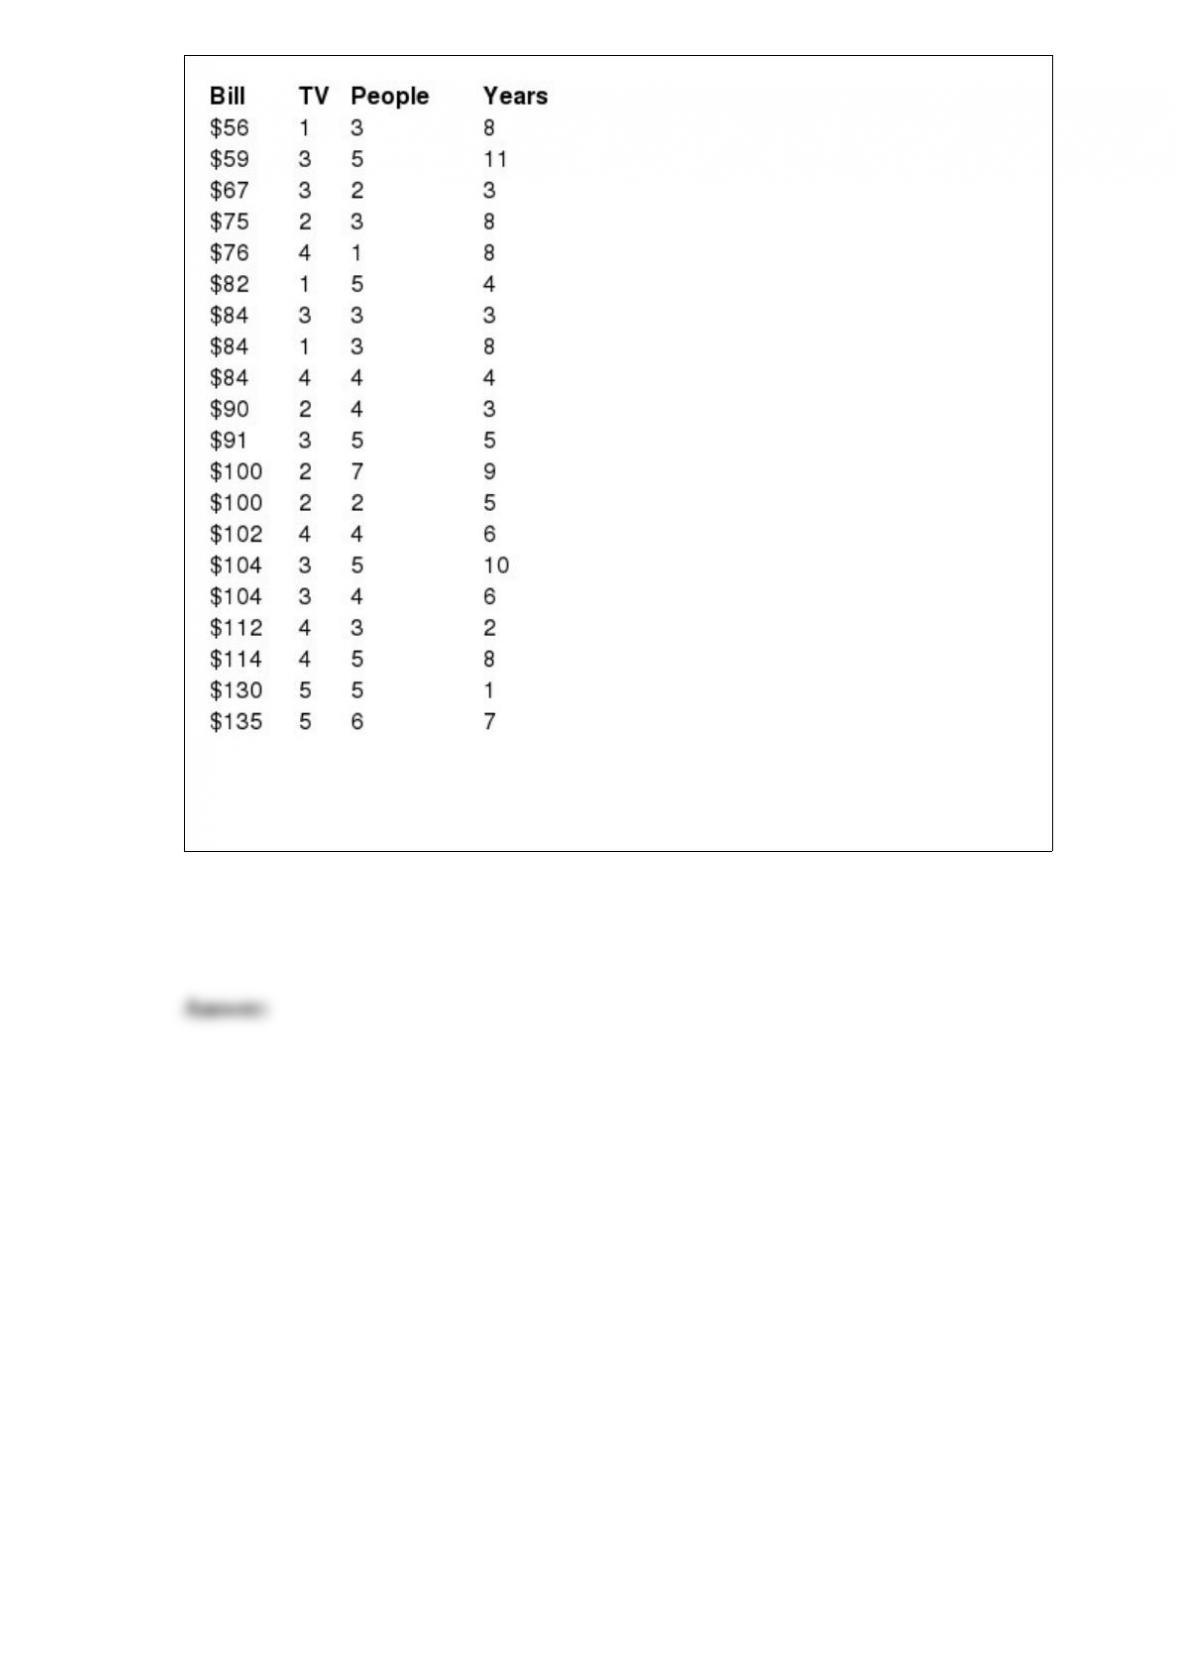
Calculate the test statistic for each regression coefficient for the Comcast cable bill
model using α = 0.05 and interpret the results.
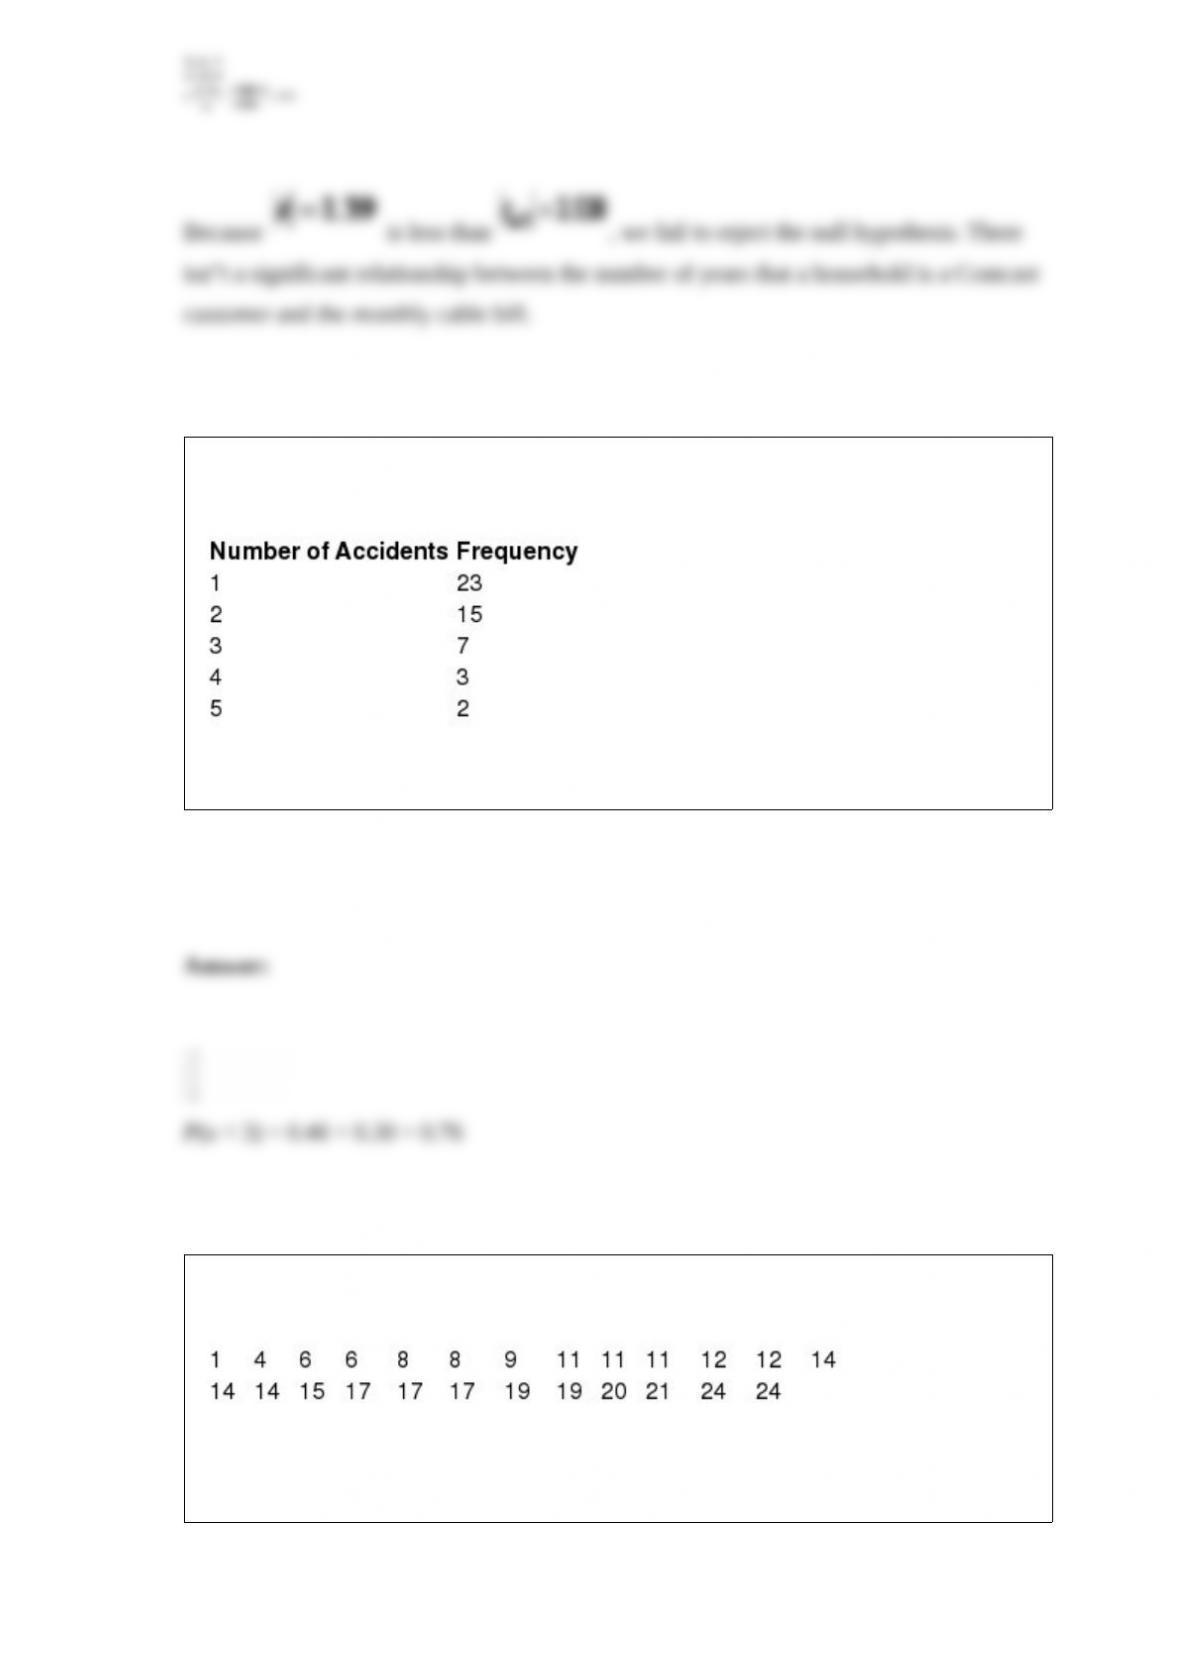
The following table shows the number of car accidents reported each day in a particular
city over the last 50 days.
What is the probability of fewer than three accidents of per day?
The following data show the number of pairs of men’s New Balance sneakers that were
sold over the last 25 weeks at a discount shoe store.
Construct a cumulative relative frequency distribution for this data and determine the
probability that 15 or fewer pairs of New Balance shoes will be sold next week.