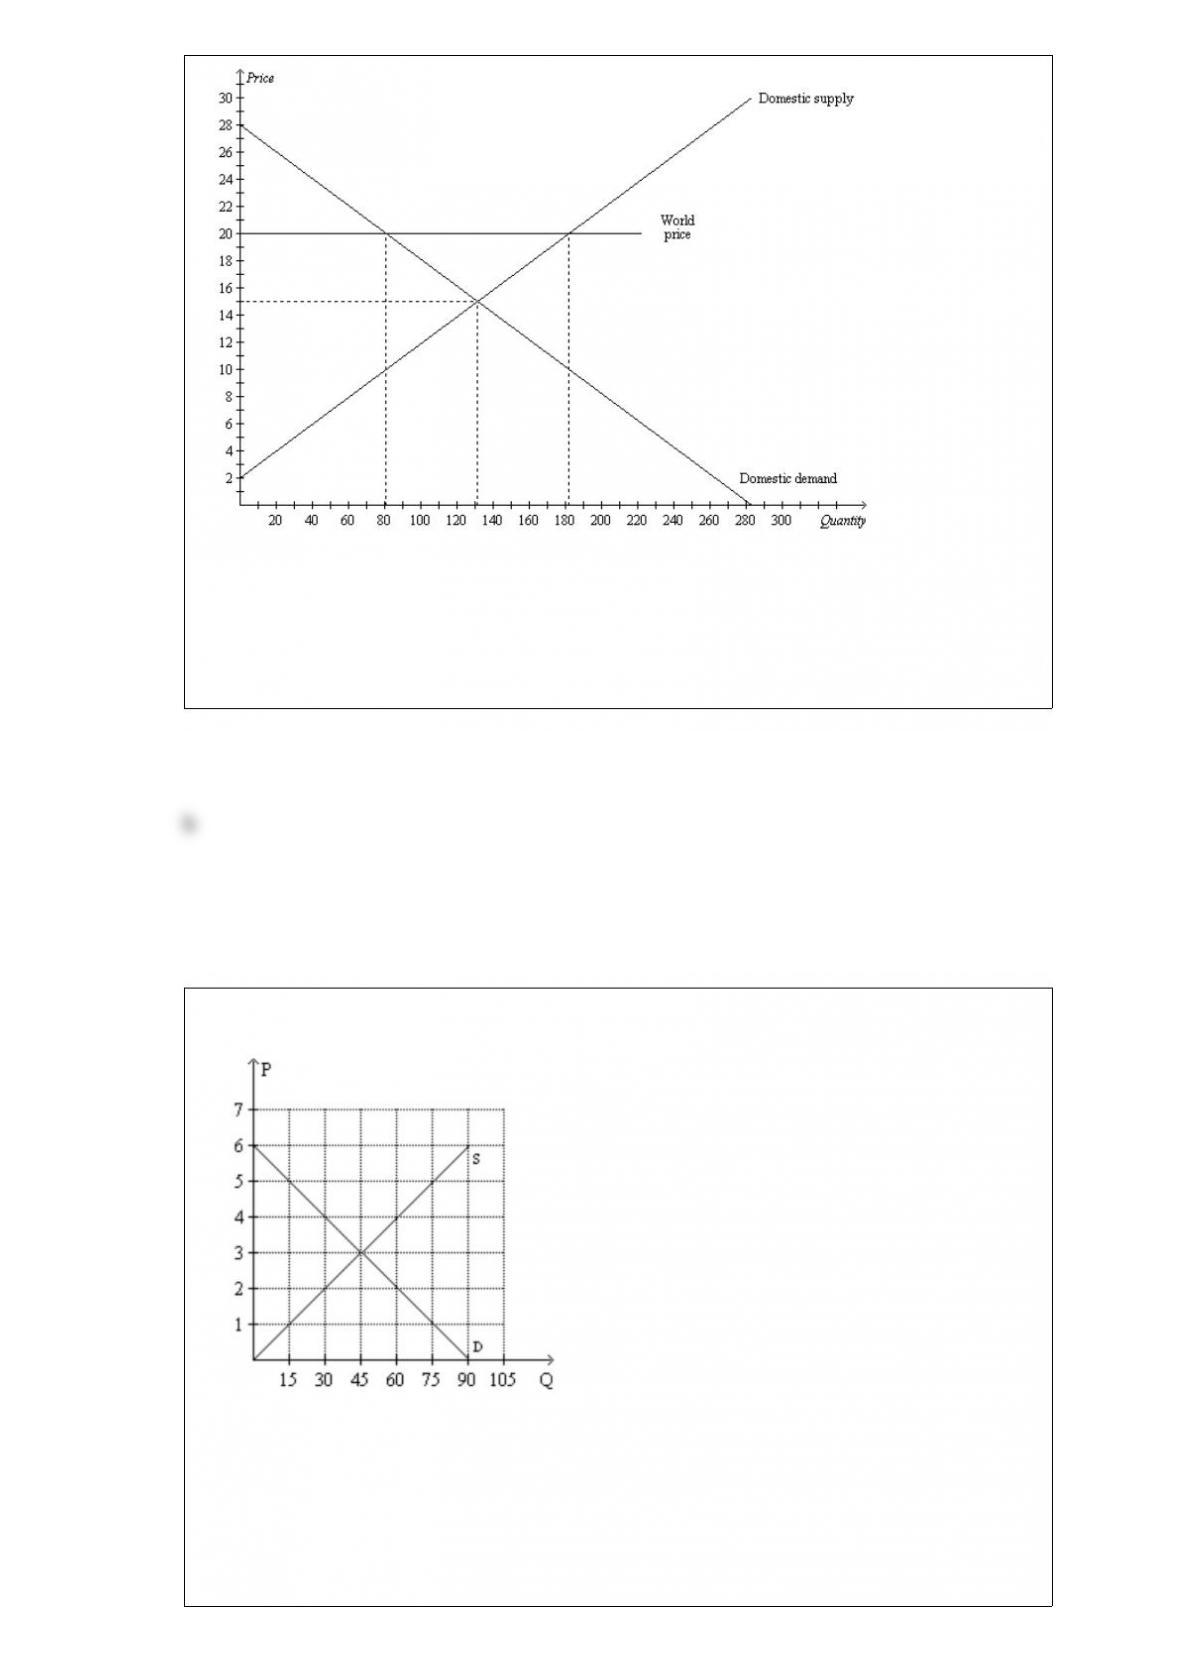
Figure 924
The following diagram shows the domestic demand and supply in a market. Assume
that the world price in this market is $20 per unit.
Refer to Figure 924. With free trade, consumer surplus is
a. $400 and producer surplus is $100.
b. $400 and producer surplus is $400.
c. $900 and producer surplus is $100.
d. $900 and producer surplus is $400.
Figure 47

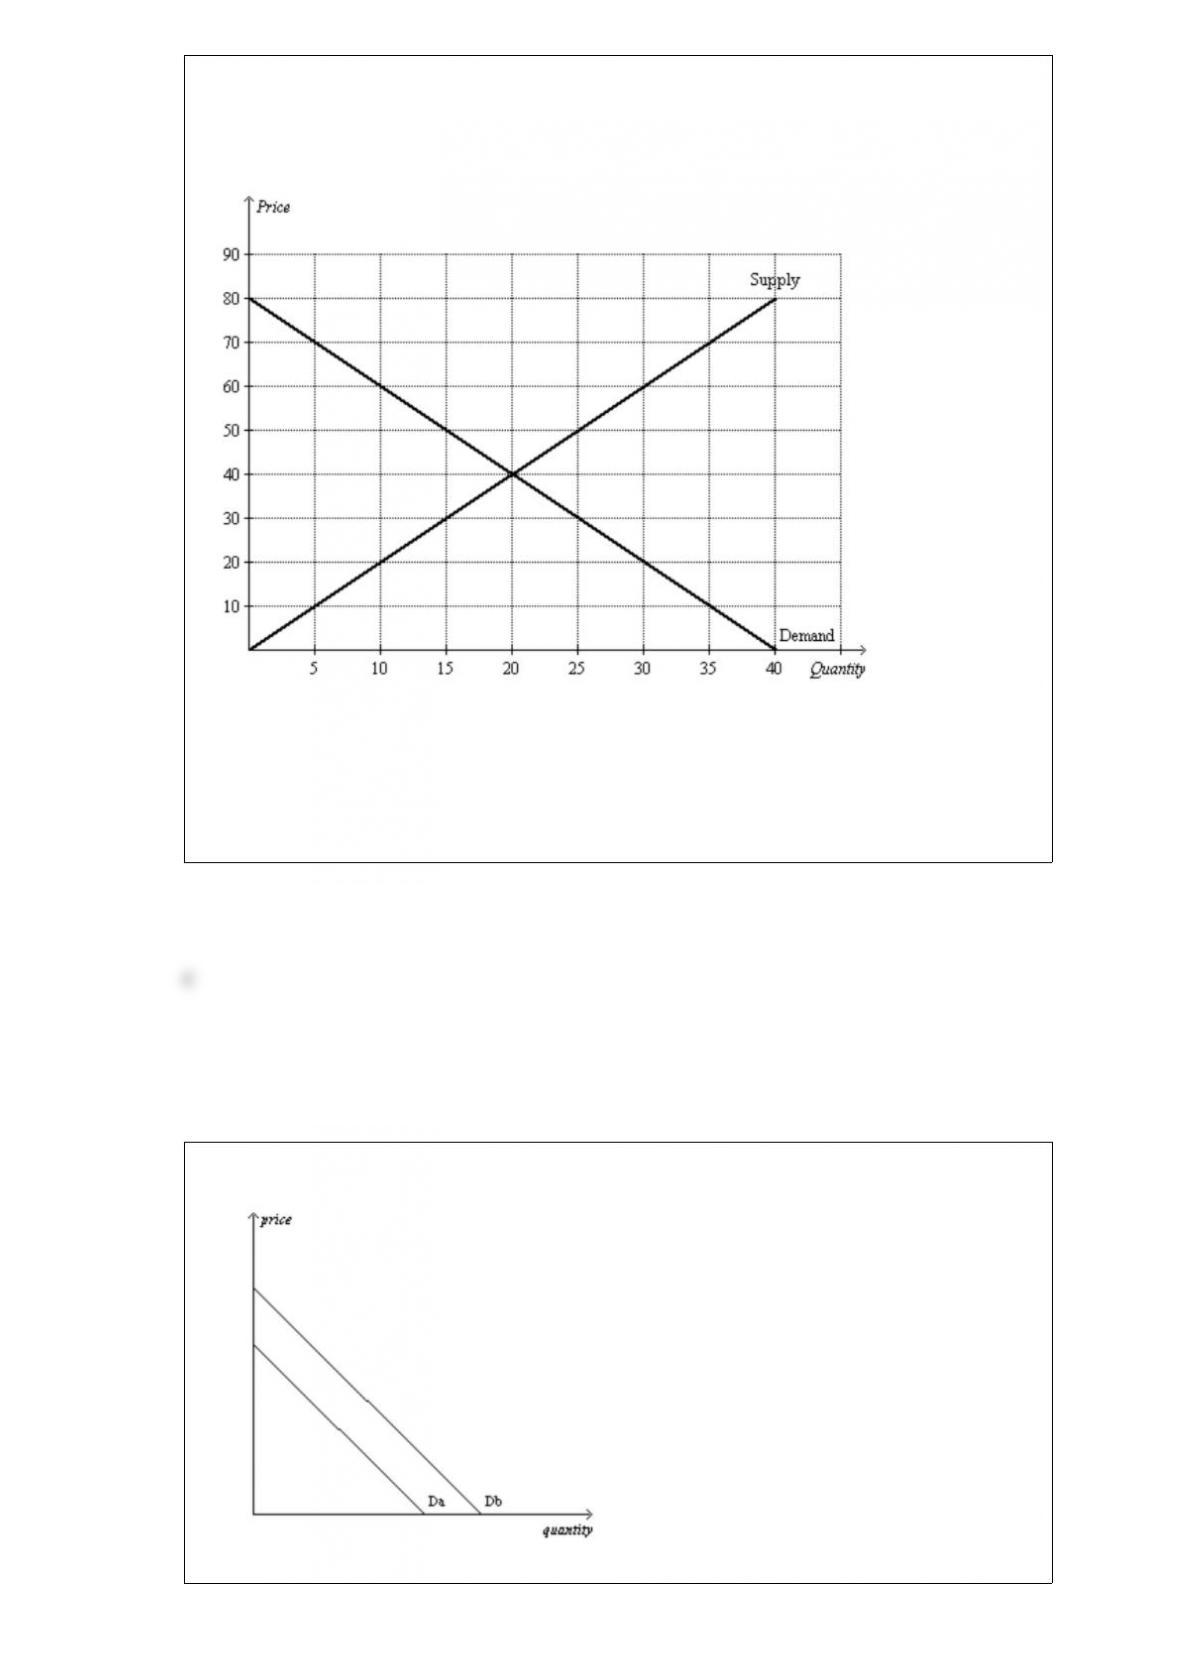
Refer to Figure 47. The shift from Db to Da is called
a. an increase in demand.
b. a decrease in demand.
c. a decrease in quantity demanded.
d. an increase in quantity demanded.
Scenario 91
The beforetrade domestic price of peaches in the United States is $40 per bushel. The
world price of peaches is $52 per bushel. The U.S. is a pricetaker in the market for
peaches.
Refer to Scenario 91. If trade in peaches is allowed, the United States
a. will become an importer of peaches.
b. will become an exporter of peaches.
c. may become either an importer or an exporter of peaches, but this cannot be
determined.
d. will experience increases in both consumer surplus and producer surplus.
John is an athlete. He has $120 to spend and wants to buy either a heart rate monitor or
new running shoes. Both the heart rate monitor and running shoes cost $120, so he can
only buy one. This illustrates the principle that
a. trade can make everyone better off.
b. people face tradeoffs.
c. rational people think at the margin.
d. people respond to incentives.

What would happen to the equilibrium price and quantity of latts if the cost to produce
steamed milk, which is used to make latts, increased, and scientists discovered that latts
cause heart attacks?
a. Both the equilibrium price and quantity would increase.
b. Both the equilibrium price and quantity would decrease.
c. The equilibrium price would decrease, and the effect on equilibrium quantity would
be ambiguous.
d. The equilibrium quantity would decrease, and the effect on equilibrium price would
be ambiguous.
The market demand curve
a. is the sum of all individual demand curves.
b. is the demand curve for every product in an industry.
c. shows the average quantity demanded by individual demanders at each price.
d. is always flatter than an individual demand curve.
If the tax on gasoline increases from $2 to $4 per gallon, the deadweight loss from the
tax increases by a factor of
a. onehalf.
b. two.
c. four.
d. six.

The minimum wage was instituted to ensure workers
a. a middleclass standard of living.
b. employment.
c. a minimally adequate standard of living.
d. unemployment compensation.
Suppose that a worker in Cornland can grow either 40 bushels of corn or 10 bushels of
oats per year, and a worker in Oatland can grow either 20 bushels of corn or 5 bushels
of oats per year. There are 20 workers in Cornland and 20 workers in Oatland. Which of
the following statements is true?
a. Both countries could gain from trade with each other.
b. Neither country could gain from trade with each other because Cornland has an
absolute advantage in both goods.
c. Neither country could gain from trade with each other because neither one has a
comparative advantage.
d. Oatland could gain from trade between the two countries, but Cornland definitively
would lose.
Table 331
Labor Hours Needed to Make 1 Pound of:
Amount Produced in 40 hours
Meat PotatoesMeatPotatoes
Farmer8 hours/pound5 hours/pound5 pounds8 pounds
Rancher4 hours/pound10 hours/pound10 pounds4 pounds
Refer to Table 331. For the farmer, the opportunity cost of 1 pound of potatoes is
a. 0.625 pound of meat.
b. 1.0 pounds of meat.
c. 1.6 pounds of meat.
d. 3.2 pounds of meat.
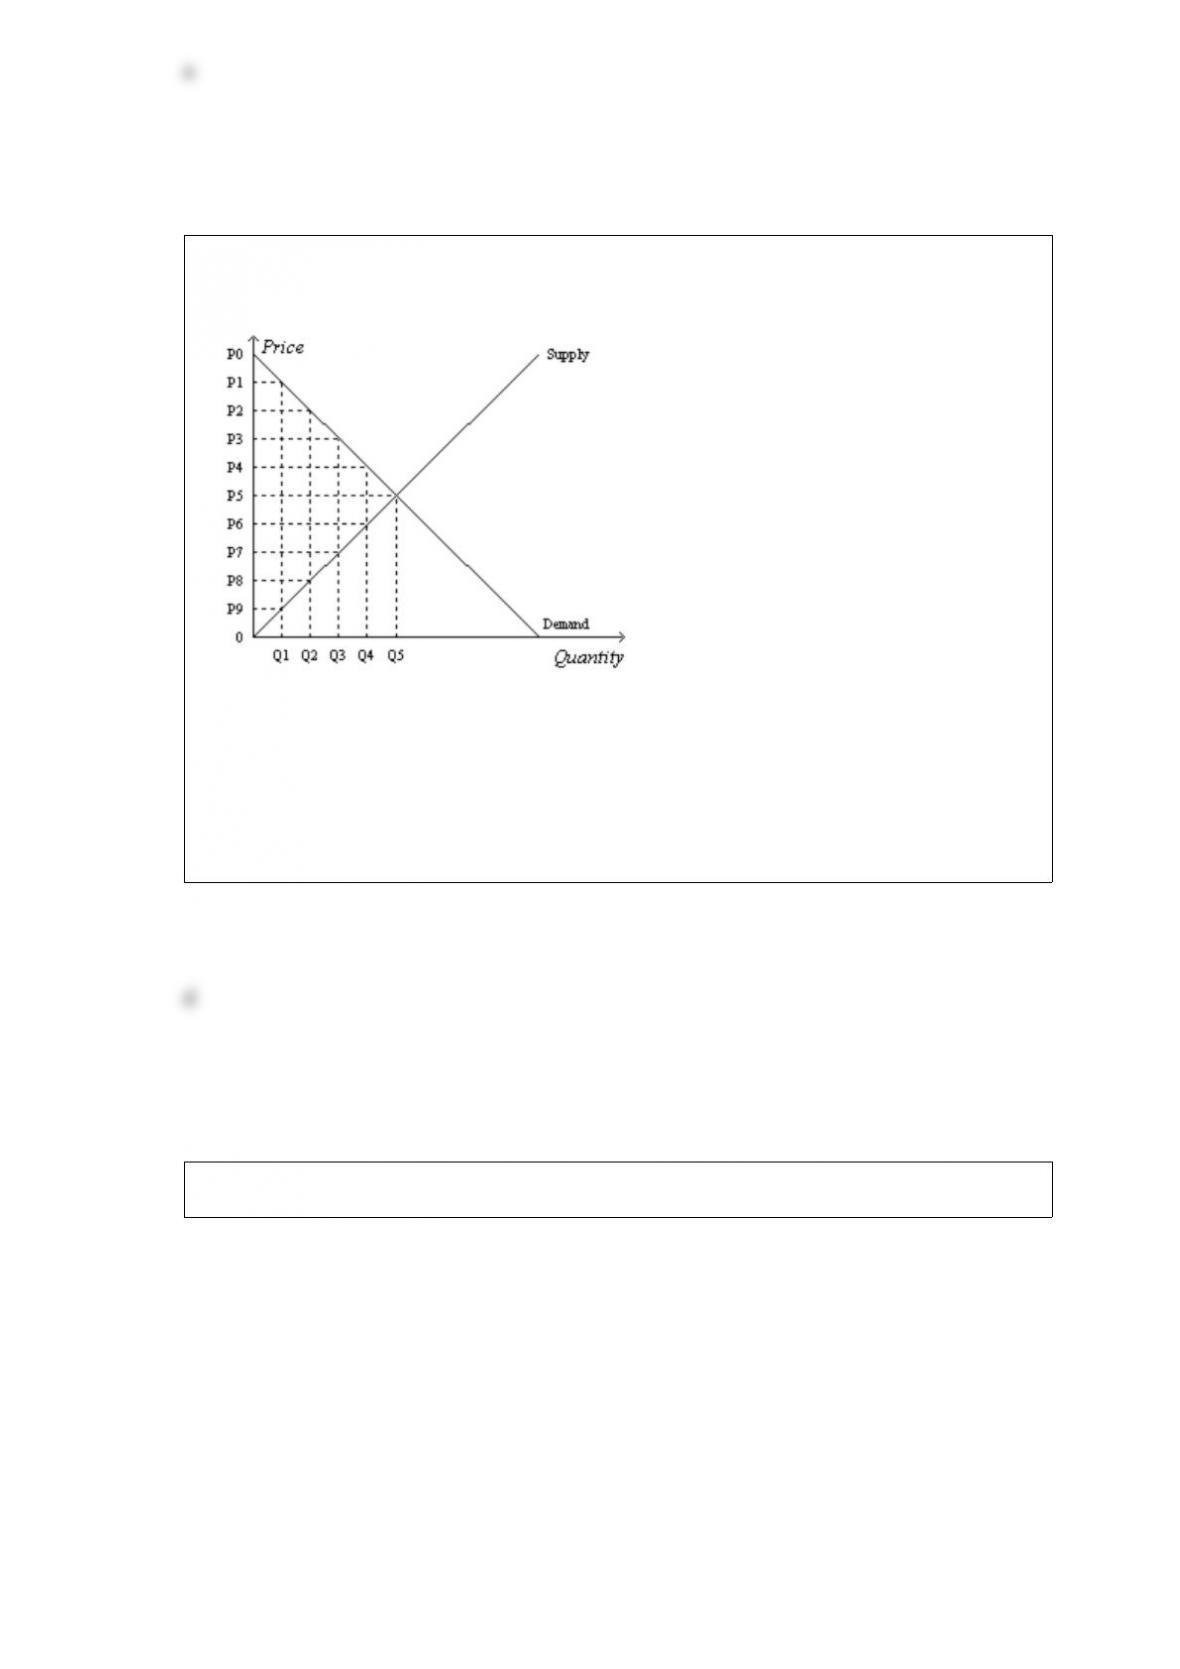
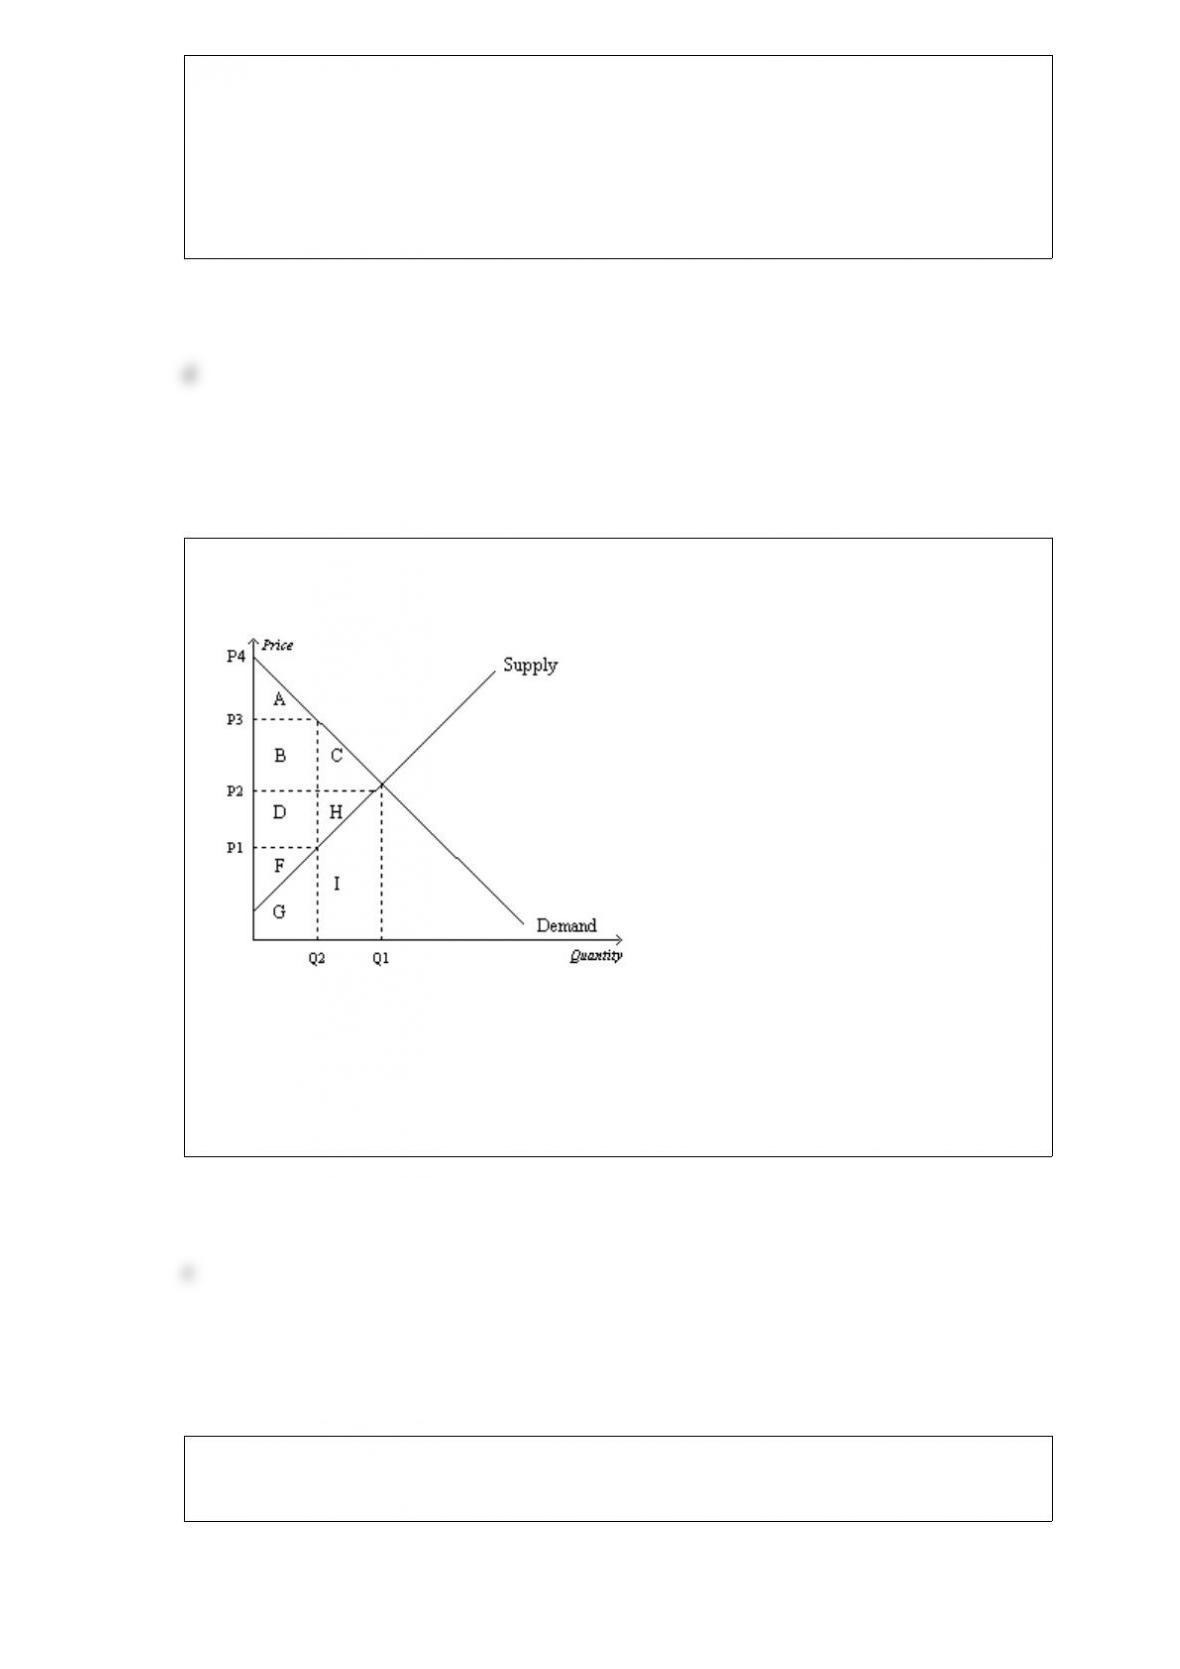
Figure 810
Refer to Figure 810. Suppose the government imposes a tax that reduces the quantity
sold in the market after the tax to Q2. Without the tax, the consumer surplus is
a. (P0P2) x Q2.
b. 1/2 x (P0P2) x Q2.
c. (P0P5) x Q5.
d. 1/2 x (P0P5) x Q5.
Figure 915
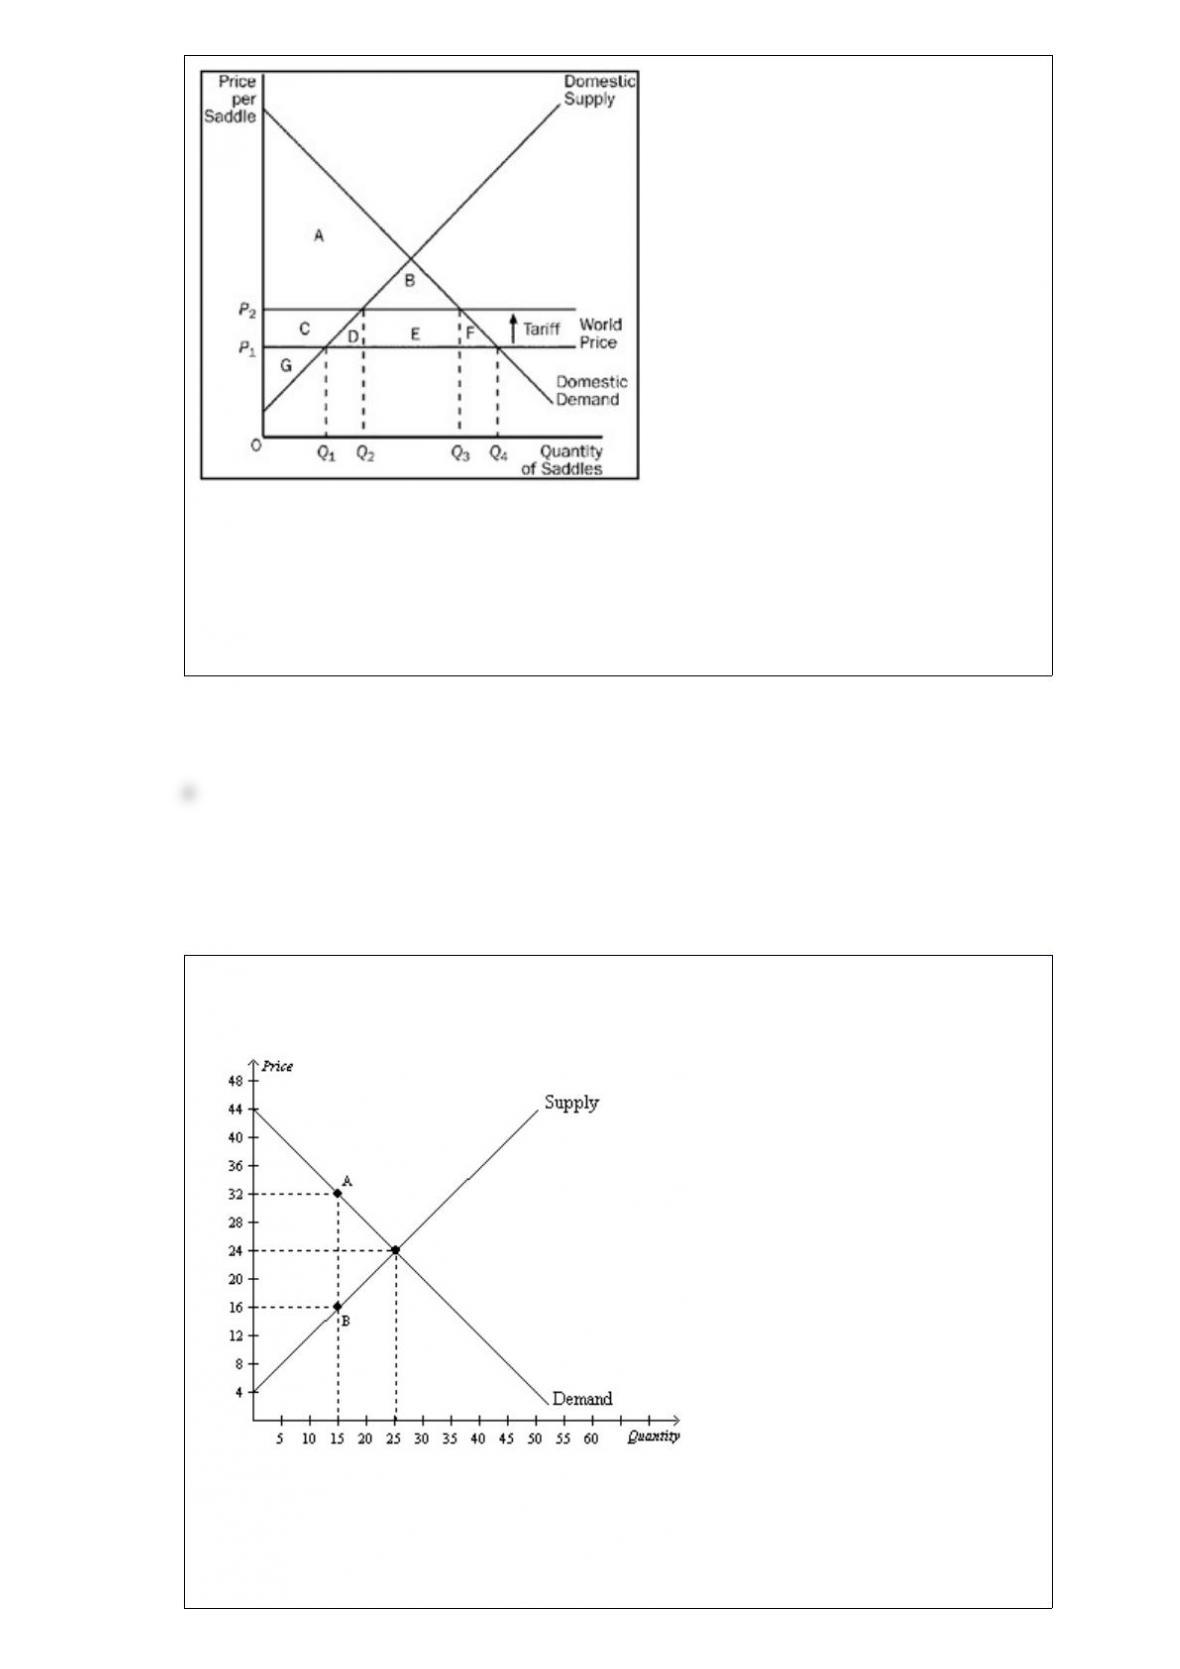
Refer to Figure 915. For the saddle market, area E represents
a. government’s revenue from the tariff.
b. producer surplus after the tariff becomes effective.
c. the decrease in consumer surplus, relative to the freetrade situation, as a result of the
tariff.
d. the decrease in total surplus, relative to the freetrade situation, as a result of the tariff.
Figure 87
The vertical distance between points A and B represents a tax in the market.
Refer to Figure 87. Which of the following statements is correct?
a. The loss of producer surplus that is associated with some sellers dropping out of the
market as a result of the tax is $60.
b. The loss of consumer surplus for those buyers of the good who continue to buy it
after the tax is imposed is $120.
c. The loss of consumer surplus caused by this tax exceeds the loss of producer surplus
caused by this tax.
d. This tax produces $320 in tax revenue for the government.
Figure 716
Refer to Figure 716. If the price of the good is $600, then
a. consumer surplus is $800.
b. consumer surplus is $900.
c. producer surplus is $900.
d. producer surplus is $1,000.
Table 54
The following table shows the demand schedule for a particular good.
PriceQuantity
$200
$163
$126
$89
$412
$015
Refer to Table 54. Using the midpoint method, what is the price elasticity of demand
when price rises from $12 to $16?
a. 0.43
b. 0.67
c. 2.33
d. 4
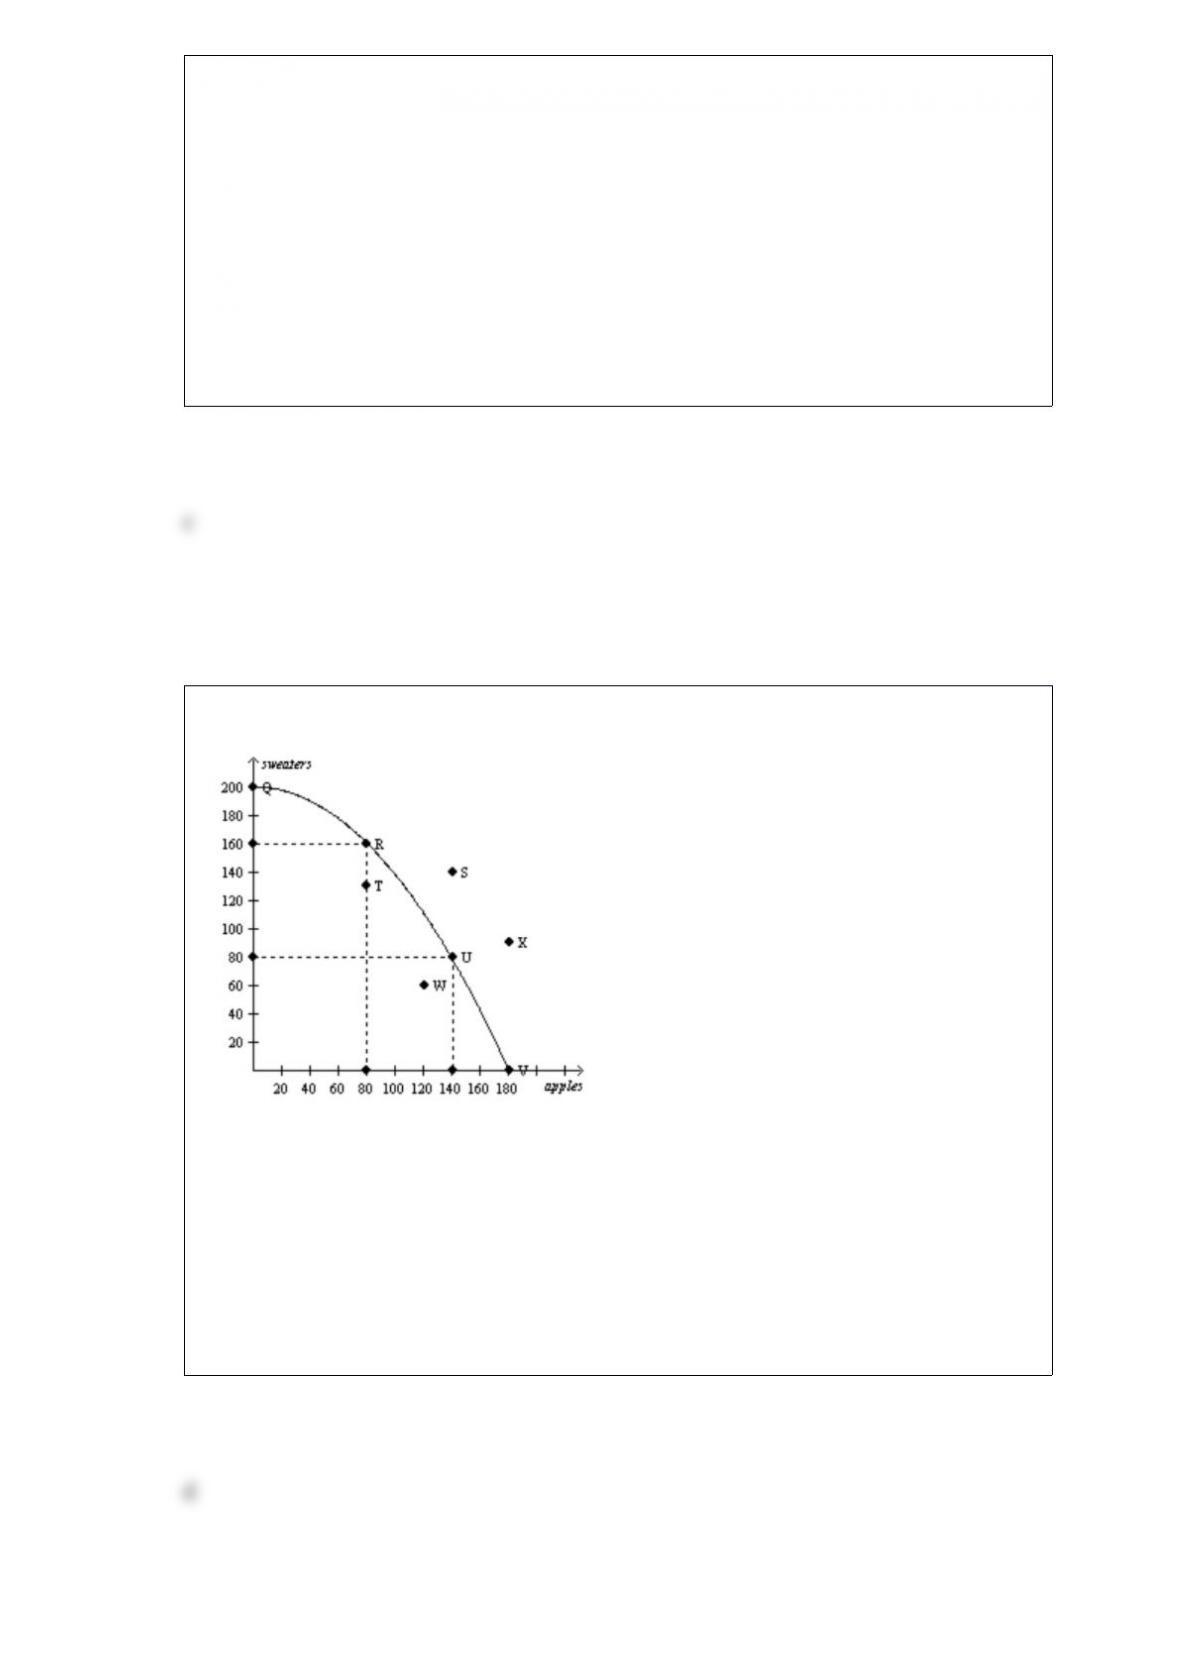
Figure 214
Consider the production possibilities curve for a country that can produce sweaters,
apples (in bushels), or a combination of the two
Refer to Figure 214. If this economy devotes all of its available resources to producing
apples, then it will produce
a. 0 bushels of apples and 200 sweaters.
b. 80 bushels of apples and 160 sweaters
c. 180 bushels of apples and 200 sweaters.
d. 180 bushels of apples and 0 sweaters.

Scenario 81
Erin would be willing to pay as much as $100 per week to have her house cleaned.
Ernesto’s opportunity cost of cleaning Erin’s house is $70 per week.
Refer to Scenario 81. Assume Erin is required to pay a tax of $40 when she hires
someone to clean her house for a week. Which of the following is correct?
a. Erin will now clean her own house.
b. Ernesto will continue to clean Erin’s house, but his producer surplus will decline.
c. Total economic welfare (consumer surplus plus producer surplus plus tax revenue)
will increase.
d. Erin will continue to hire Ernesto to clean her house, but her consumer surplus will
decline.
Table 325
Assume that Maya and Miguel can switch between producing mixers and producing
toasters at a constant rate.
Hours Needed to Make 1Amount Produced in 40 Hours
mixertoastermixerstoasters
Maya8558
Miguel201024
Refer to Table 325. Maya should specialize in the production of
a. mixers and Miguel should specialize in the production of toasters.
b. toasters and Miguel should specialize in the production of mixers.
c. both goods and Miguel should specialize in the production of neither good.
d. neither good and Miguel should specialize in the production of both goods.
Caroline sharpens knives in her spare time for extra income. Buyers of her service are
willing to pay $2.95 per knife for as many knives as Caroline is willing to sharpen. On a
particular day, she is willing to sharpen the first knife for $2.00, the second knife for
$2.25, the third knife for $2.75, and the fourth knife for $3.50. Assume Caroline is
rational in deciding how many knives to sharpen. Her producer surplus is
a. $0.95.
b. $1.15.
c. $1.30.
d. $1.85.
Figure 85
Suppose that the government imposes a tax of P3 P1.
Refer to Figure 85. The price that buyers effectively pay after the tax is imposed is
a. P1.
b. P2.
c. P3.
d. P4.
Figure 92
The figure illustrates the market for calculators in a country.
Refer to Figure 92. Without trade, consumer surplus is
a. $423.
b. $845.
c. $1,690.
d. $3,380.
Figure 615
Refer to Figure 615. Suppose a price floor of $4 is imposed on this market. As a result,
a. buyers’ total expenditure on the good decreases by $15.
b. the supply curve shifts to the left so as to now pass through the point (quantity = 30,
price = $4).
c. the quantity demanded of the good decreases by 30 units.
d. the number of units sold in the market will increase by 15 units.
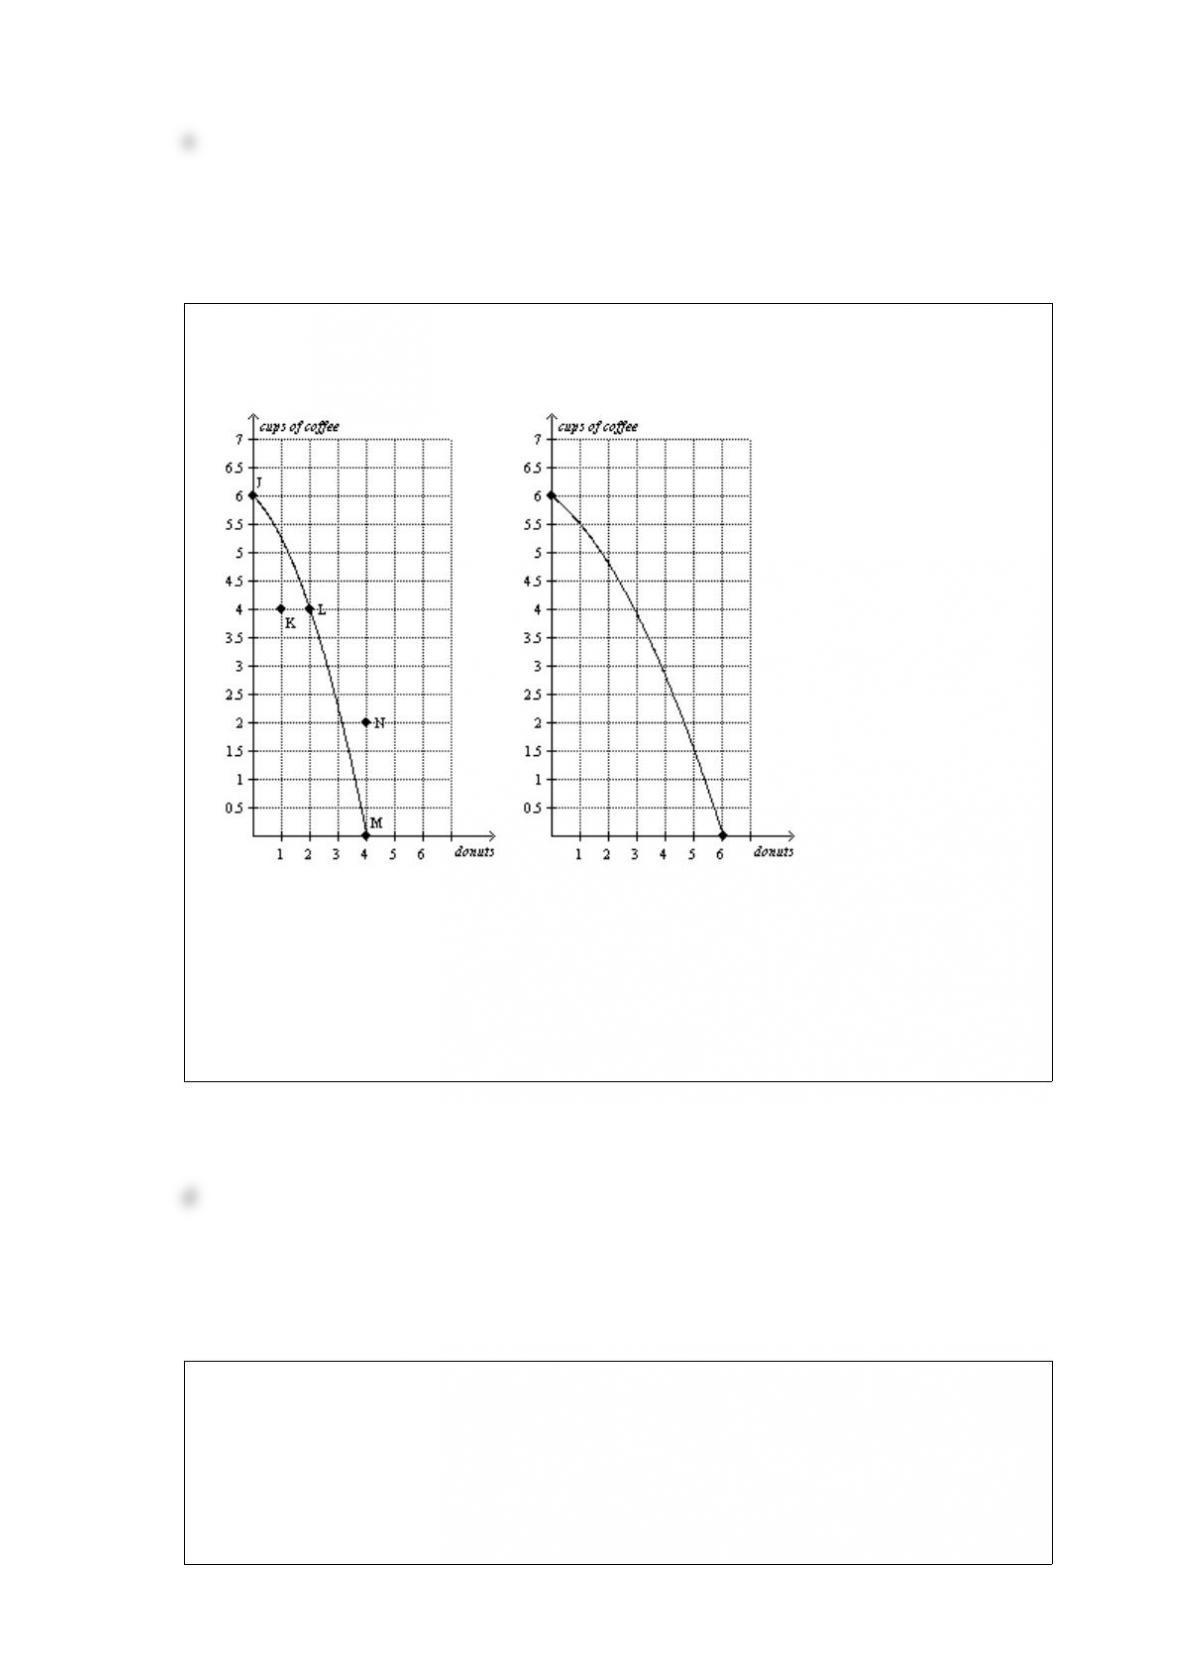
Figure 29
Panel (a) Panel (b)
Refer to Figure 29, Panel (a). The opportunity cost of one cup of coffee is highest
when the economy produces
a. 0 cups of coffee.
b. 2 cups of coffee.
c. 4 cups of coffee.
d. 6 cups of coffee.
Which of the following statements is not correct?
a. A seller would be eager to sell her product at a price higher than her cost.
b. A seller would refuse to sell her product at a price lower than her cost.
c. A seller would be indifferent about selling her product at a price equal to her cost.
d. Since sellers cannot set the price for their product, they must be willing to sell their
product at any price.

Suppose that Jane enjoys Diet Coke so much that she consumes one can every day.
Although she enjoys gourmet cheese, she consumes it sporadically. If the price of Diet
Coke rises, Jane decreases her consumption by only a very small amount. But if the
price of gourmet cheese rises, Jane decreases her consumption by a lot. These examples
illustrate the importance of
a. the availability of close substitutes in determining the price elasticity of demand.
b. a necessity versus a luxury in determining the price elasticity of demand.
c. the definition of a market in determining the price elasticity of demand.
d. the time horizon in determining the price elasticity of demand.
Suppose roses are currently selling for $20 per dozen, but the equilibrium price of roses
is $30 per dozen. We would expect a
a. shortage to exist and the market price of roses to increase.
b. shortage to exist and the market price of roses to decrease.
c. surplus to exist and the market price of roses to increase.
d. surplus to exist and the market price of roses to decrease.
The quantity sold in a market will decrease if the government
a. decreases a binding price floor in that market.
b. increases a binding price ceiling in that market.
c. increases a tax on the good sold in that market.
d. All of the above are correct.

The production possibilities frontier is a graph that shows the various combinations of
output that an economy
a. should produce.
b. wants to produce.
c. can produce.
d. demands.
You have been asked by your economics professor to graph the market for lumber and
then to analyze the change that would occur in equilibrium price as a result of recent
forest fires in the west. Your first step would be to
a. decide which direction to shift the curve.
b. decide whether the fires affected demand or supply.
c. graph the shift to see the effect on equilibrium.
d. None of the above is correct.
Michael values a stainless steel refrigerator for his new house at $3,500, but he
succeeds in buying one for $3,000. Michael’s willingness to pay is
a. $500.
b. $3,000.
c. $3,500.
d. $6,500.

The General Agreement on Tariffs and Trade (GATT) was initiated in response to
a. in increase in exports of lowpriced goods from developing countries to developed
countries.
b. the replacement of manufacturing jobs with service jobs in developed countries.
c. economic dislocations caused by the North American Free Trade Agreement
(NAFTA) in the 1990s.
d. high tariffs imposed during the Great Depression of the 1930s.
Prices direct economic activity in a market economy by
a. influencing the actions of buyers and sellers.
b. reducing scarcity of the goods and services produced.
c. reducing opportunity cost of goods and services produced.
d. allocating goods and services in the most equitable way.
OPEC successfully raised the world price of oil in the 1970s and early 1980s, primarily
due to
a. an inelastic demand for oil and a reduction in the amount of oil supplied.
b. a reduction in the amount of oil supplied and a worldwide oil embargo.
c. a worldwide oil embargo and an elastic demand for oil.
d. a reduction in the amount of oil supplied and an elastic demand for oil.
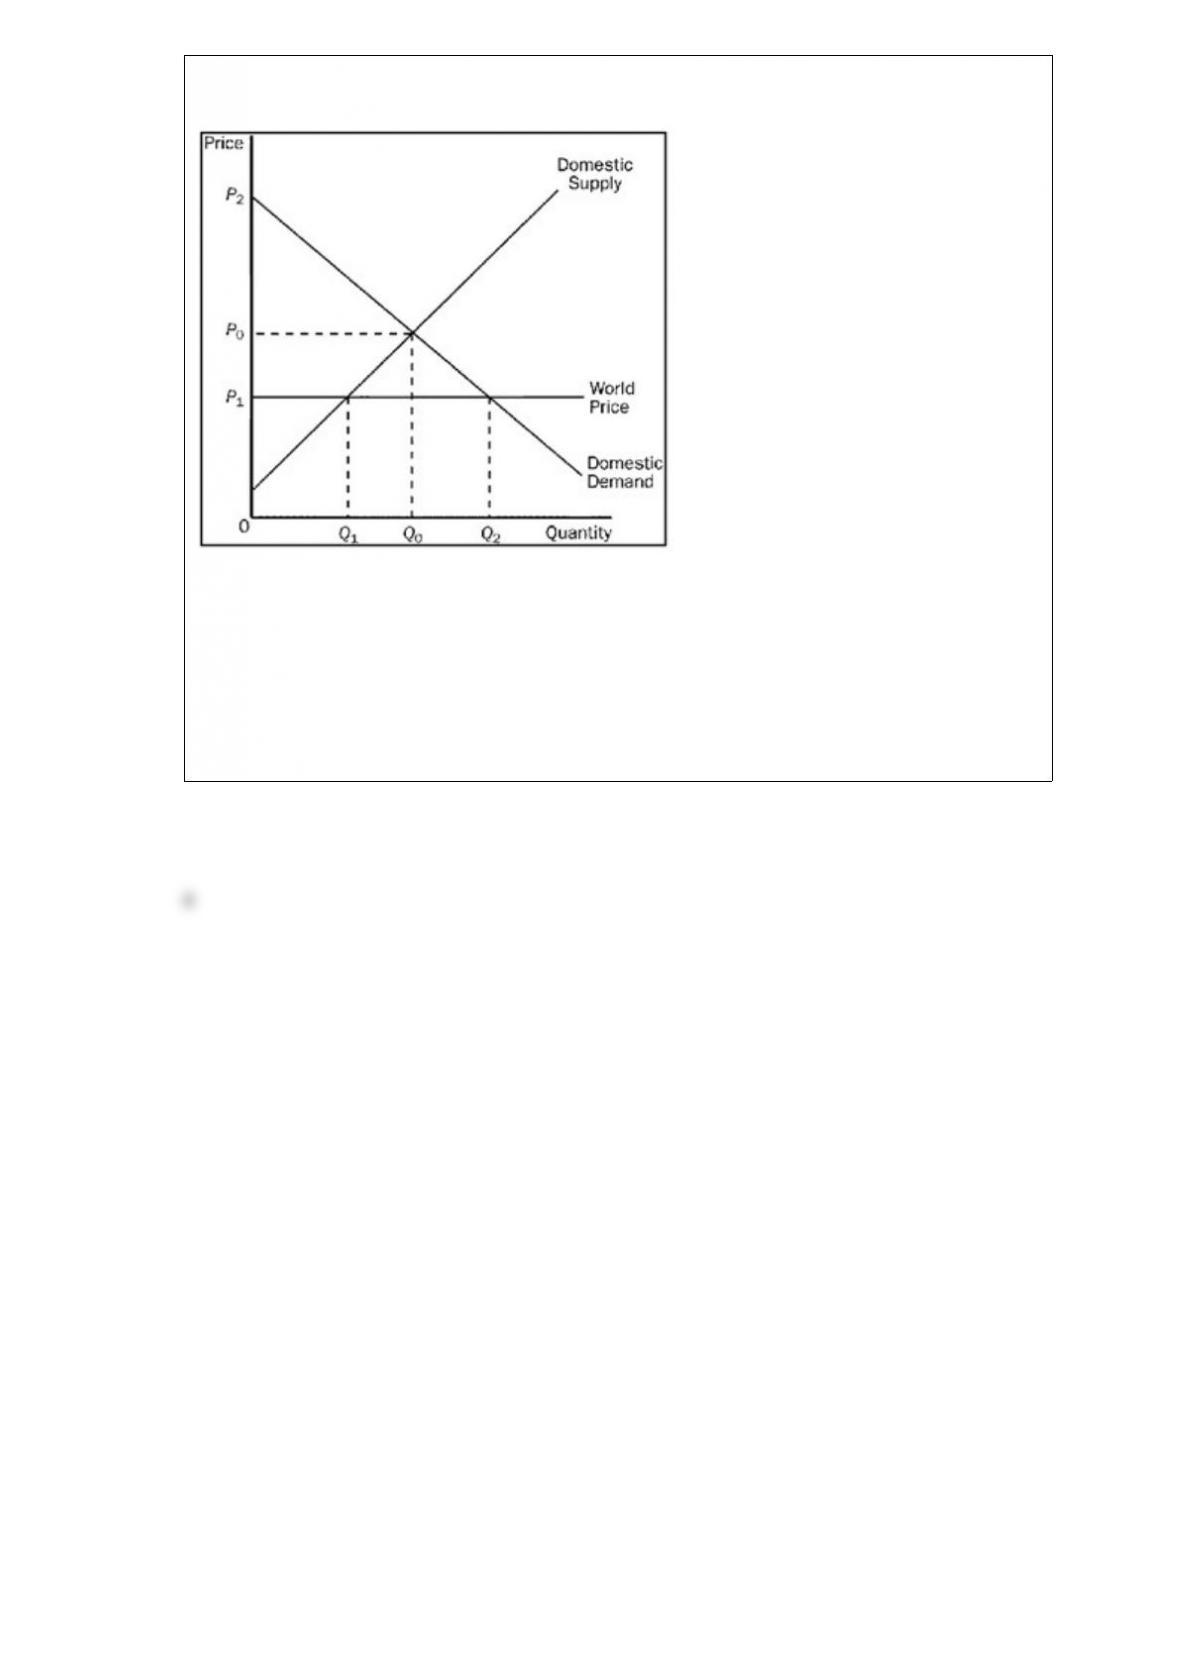
Figure 910. The figure applies to Mexico and the good is rifles.
Refer to Figure 910. The area bounded by the points (Q0, P0), (Q2, P1), and (Q1, P1)
represents
a. Mexico’s gains from trade.
b. the amount by which Mexico’s gain in producer surplus exceeds its loss in consumer
surplus due to trade.
c. Mexico’s loss in total surplus due to trade.
d. All of the above are correct.