
Two common unweighted indexes are the Paasche Index and the Laspeyres Index.
The basic logic of the Wilcoxon signed rank test is that if about half the data values fall
above the hypothesized median, and about half fall below, the null hypothesis should
not be rejected.
Six managers at a company all enjoy golf. Each Saturday, four of the six get together
for 18 holes of golf. They have decided to set up a schedule so that the same foursome
does not play twice before all possible foursomes have played. The number of
weekends that will pass before the same group would play twice is 15.
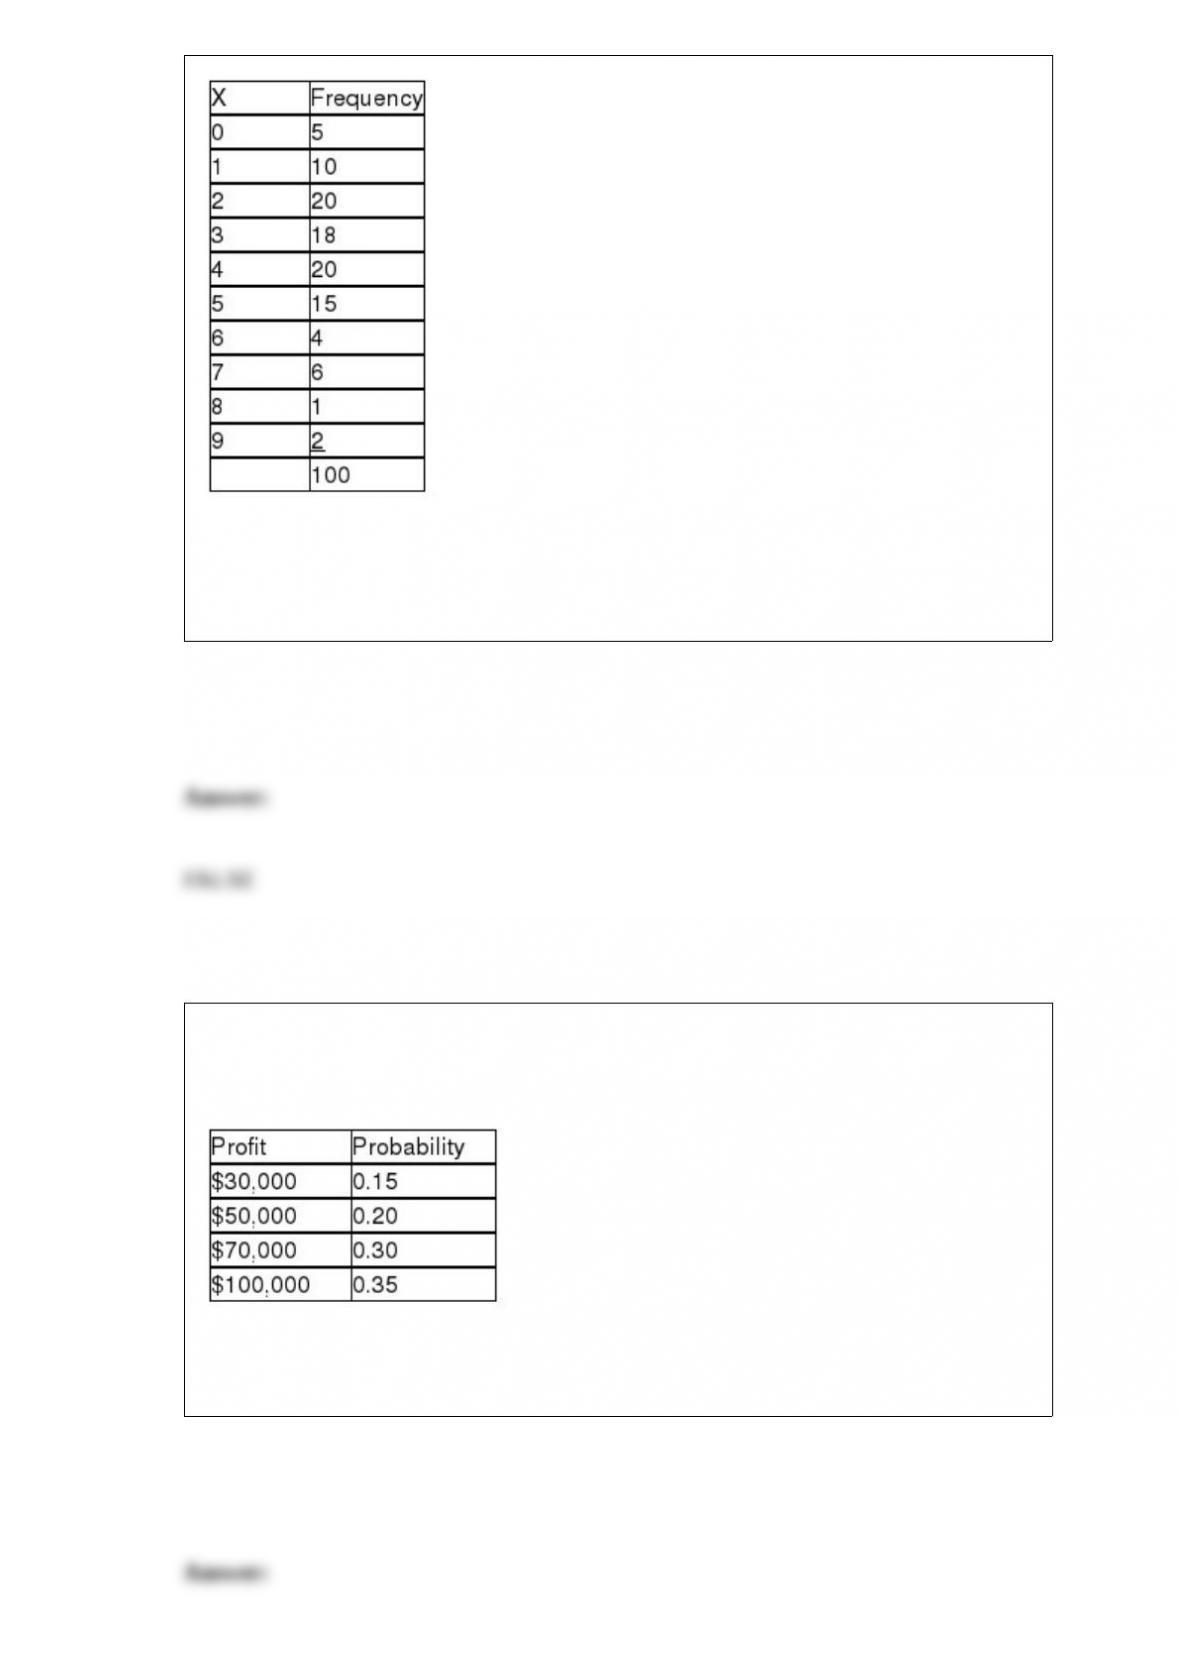
Suppose a study of houses that have sold recently in your community showed the
following frequency distribution for the number of bedrooms:

Based on this information the mean number of bedrooms in houses that sold is
approximately 3.26.
The standard normal distribution table provides probabilities for the area between the
z-value and the population mean.
If the mean, median and mode are all equal for a continuous random variable, then the
random variable is normally distributed.
A variable, i.e., the length of time it takes for an employee to complete an assembly
procedure at an automotive plant, is a ratio level variable.
If a smoothing model is applied with a smoothing constant exceeding 0.50, the
forecasting bias will tend to be positive in most cases.
Given the following regression equation, the predicted value for y when x = 0.5 is about
4.57

For a continuous distribution the total area under the curve is equal to 100.
A parameter is the boundary on the population of interest.
If you are interested in estimating the difference between the means of two samples that
have been paired, the point estimate for this difference is the mean value of the paired
differences.

To construct a 99 percent confidence interval where σ is known, the correct critical
value is 1.96.
When a patient arrives at a clinic complaining of several specific symptoms, the doctor
who makes the diagnosis says that he is 80 percent certain that the patient has a
particular problem. It is likely that he is basing this assessment on relative frequency of
occurrence.
A stable process is one that has had all its variation removed through quality
improvement efforts on the part of the organization.
When deciding the null and alternative hypotheses, the rule of thumb is that if the claim
contains the equality (e.g., at least, at most, no different from, etc.), the claim becomes
the null hypothesis. If the claim does not contain the equality (e.g., less than, more than,
different from), the claim is the alternative hypothesis.
Suppose the standard deviation for a given sample is known to be 20. If the data in the
sample are doubled, the standard deviation will be 40.
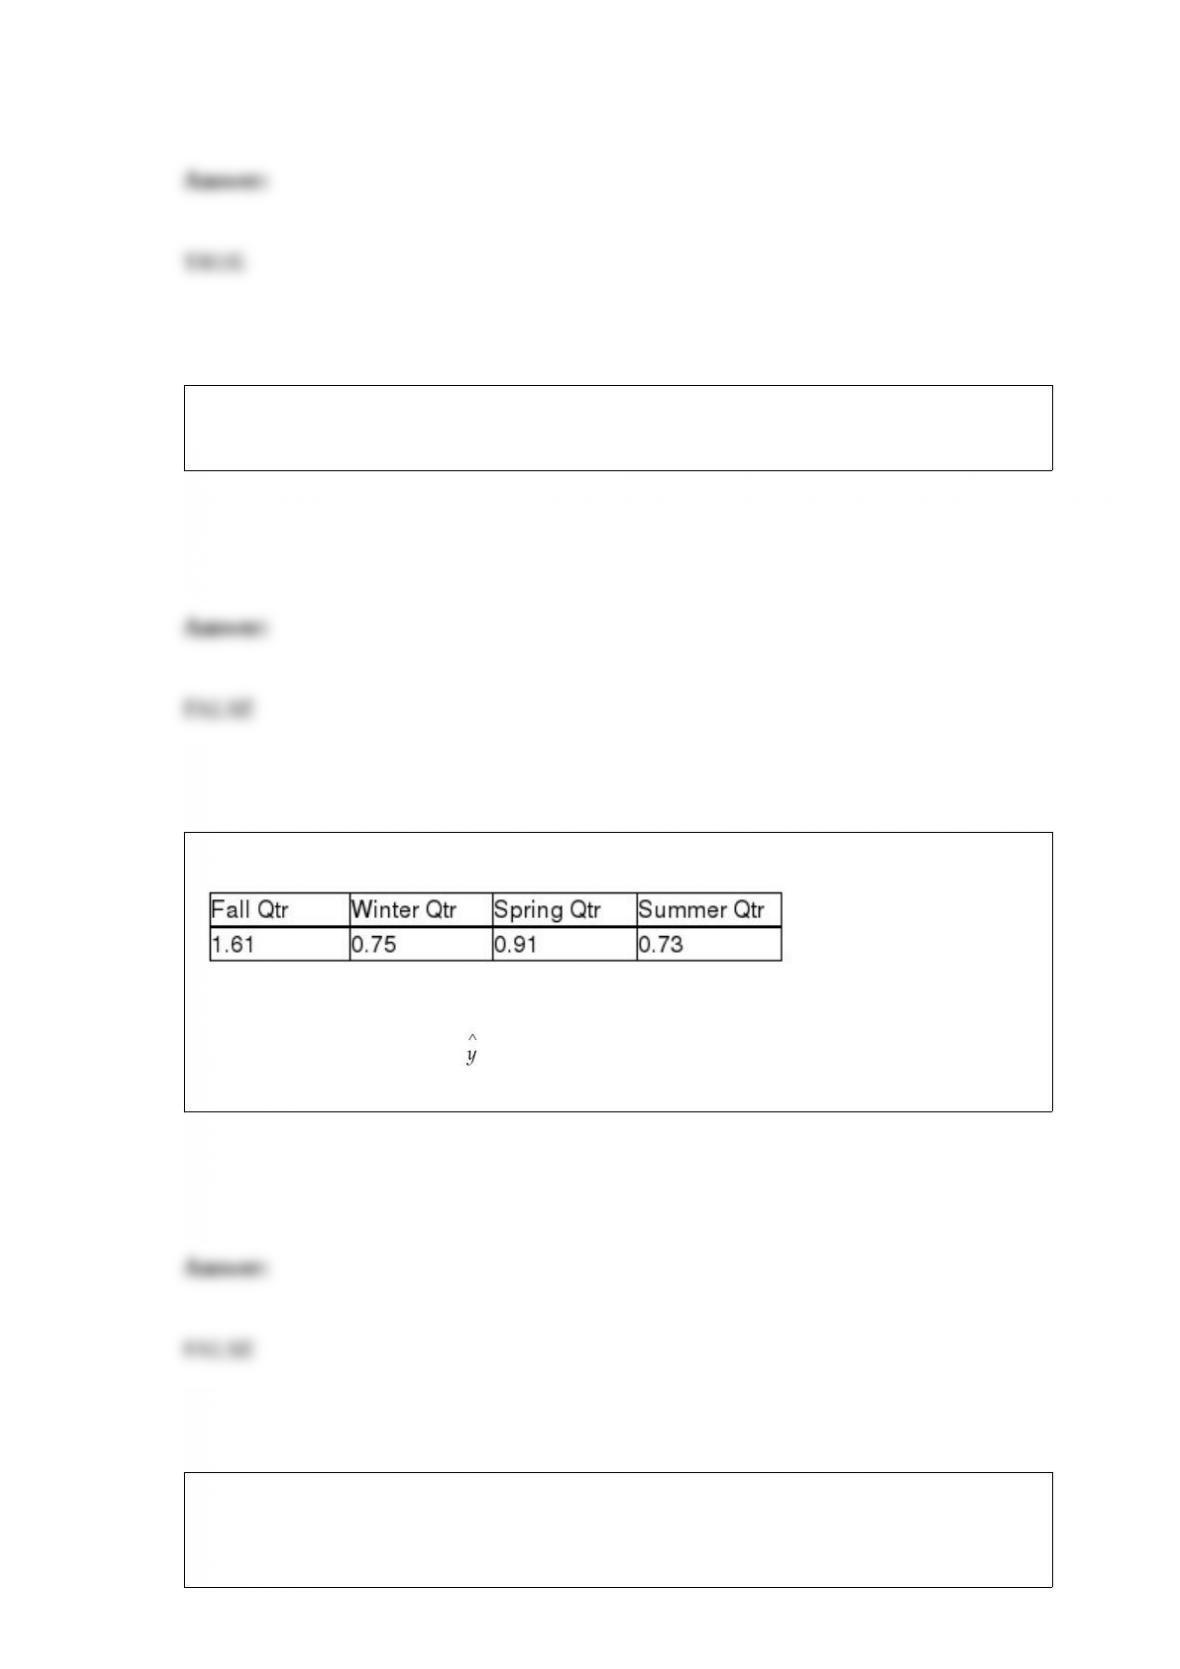
Recently, a manager for a major retailer computed the following seasonal indexes:
The manager then developed the following least squares trend model based on the past
five years of quarterly data: = 200 + 11.5t. Based on this, the seasonally adjusted
forecast for quarter 25, which is the winter quarter, is 489.11
A major car magazine has recently collected data on 30 leading cars in the U.S. market.
It is interested in building a multiple regression model to explain the variation in
highway miles. The following correlation matrix has been computed from the data
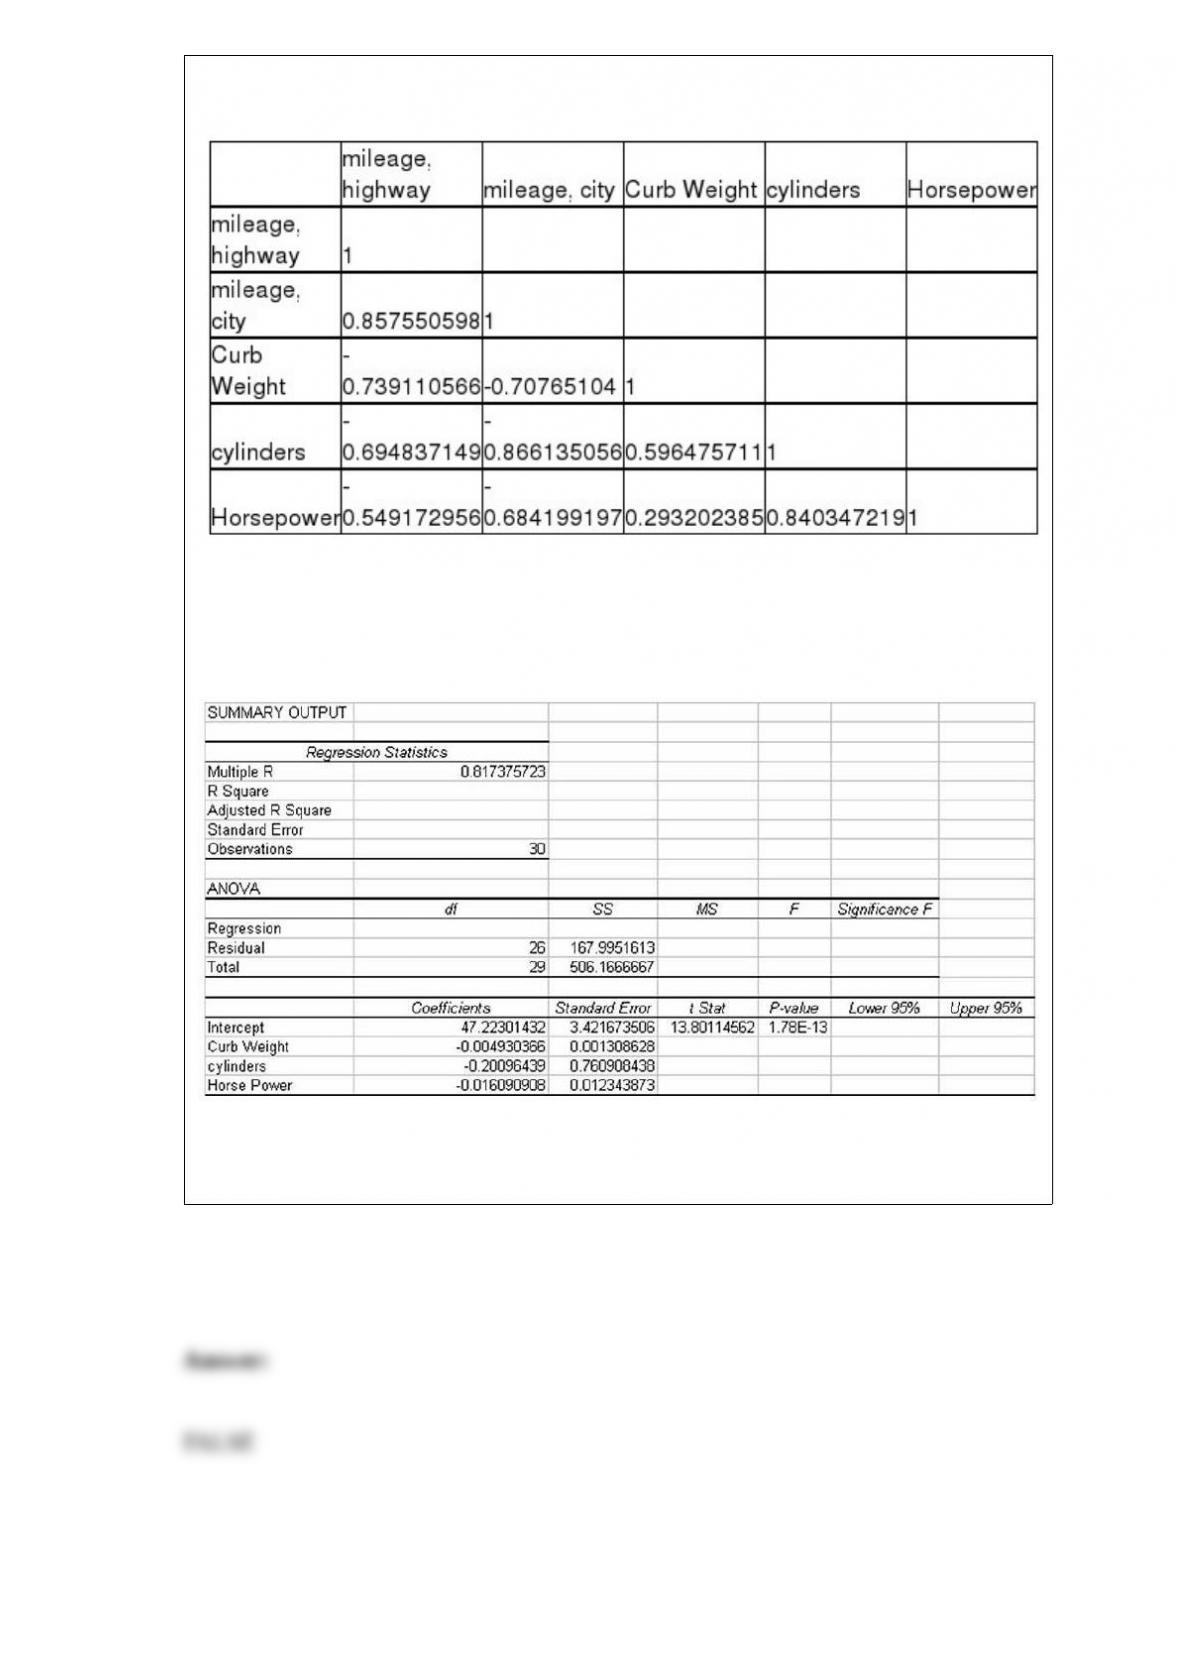
collected:
The analysts also produced the following multiple regression output using curb weight,
cylinders, and horsepower as the three independent variables. Note, a number of the
output fields are missing, but can be determined from the information provided.
Based on this information, the standard error of the estimate for the regression model is
approximately 6.46 miles per gallon.

Another term for the arithmetic average is the mean.
A process control chart can be used to determine whether the process average has
shifted up or down, but is not useful for determining whether the process is just drifting
in an upward or downward direction.
The manager of the local county fair believes that no more than 30 percent of the adults
in the county would object to a fee increase to attend the fair if it meant that better
entertainment could be secured. To estimate the true proportion, he has selected a
random sample of 200 adults. The manager will use a 90 percent confidence level.
Assuming his assumption about the 30 percent holds, the margin of error for the
estimate will be approximately .169.
In Excel a joint frequency distribution table can be created using a tool called
PivotTable.

Population parameters are descriptive numerical measures, such as an average, that
describe the entire population.
Confidence intervals constructed with small samples tend to have greater margins of
error than those constructed from larger samples, all else being constant.
If a population is very large, it may be better to select a sample from the population than
to try to obtain a census in an effort to reduce measurement error.
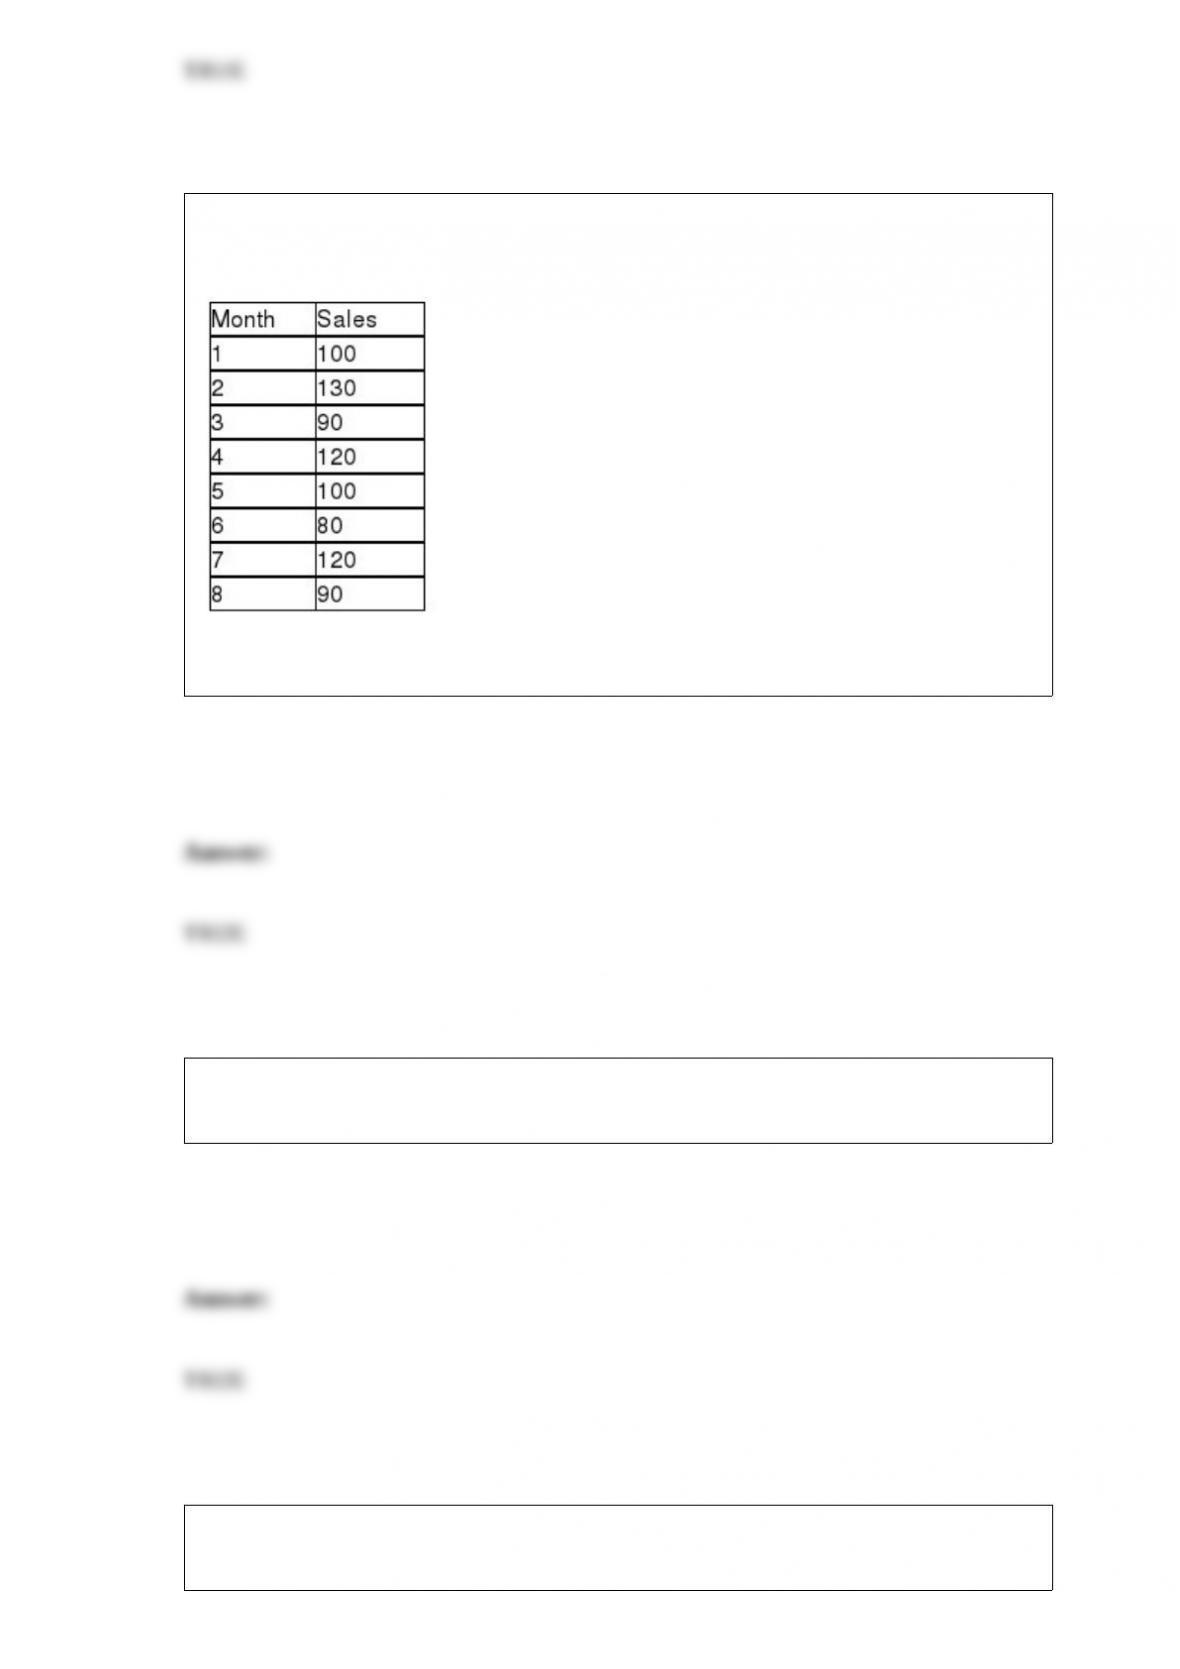
The owners of Hal’s Cookie Company have collected sales data for the past 8 months.
These data are shown as follows:
Using a smoothing constant of 0.4, the forecast value for period 3 is 112.
When the expected cell frequencies are smaller than 5, the cells should be combined in
a meaningful way such that the expected cell frequencies do exceed 5.
A sampling distribution for a sample mean shows the distribution of the possible values
for the sample mean for a given sample size from a population.

Because variations are unavoidable in a system, the output of the system is always
unpredictable.
One of the advantages of data check sheets is that as the data are being recorded, they
are also being displayed in a useful format.
A warehouse contains 5 parts made by the Stafford Company and 8 parts made by the
Wilson Company. If an employee selects 3 of the parts from the warehouse at random,
the probability that all 3 parts are from the Wilson Company is approximately .1958.
If the R-square for a multiple regression model with two independent variables is .64,
the correlation between the two independent variables will be .80
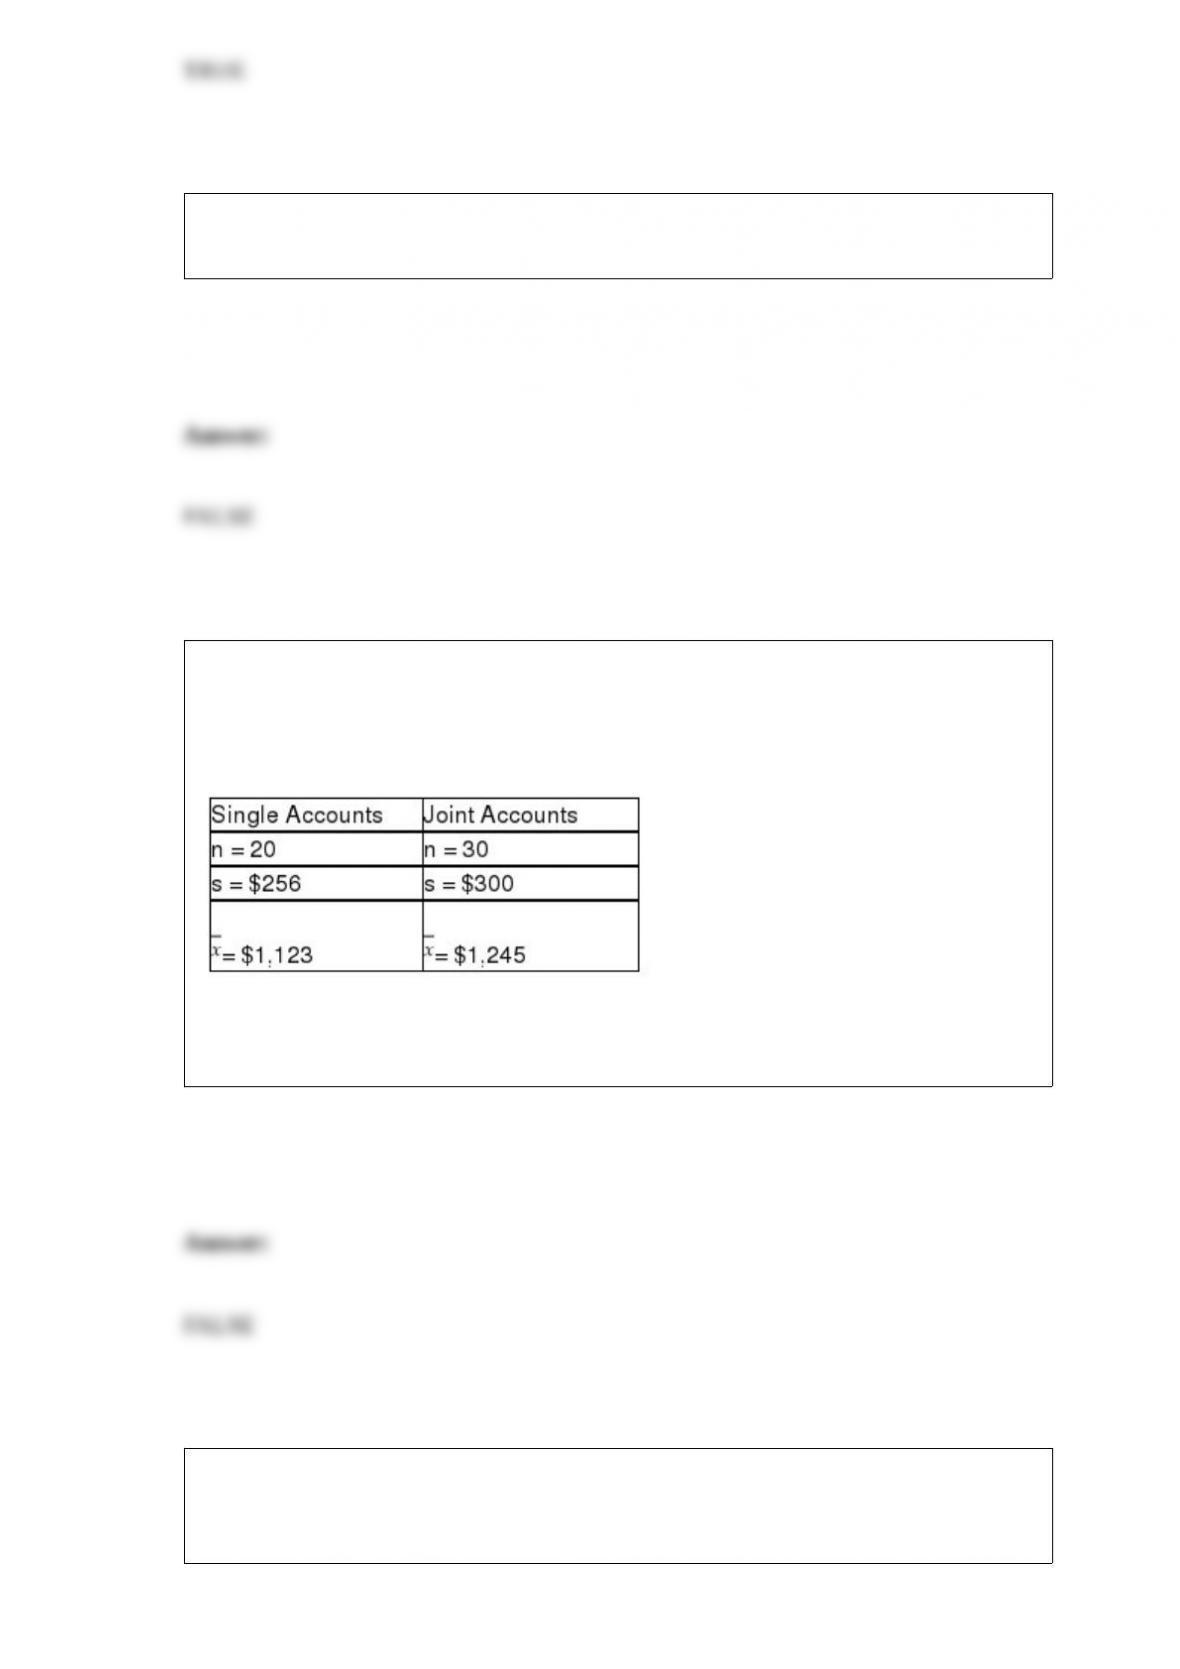
There is interest at the American Savings and Loan as to whether there is a difference
between average daily balances in checking accounts that are joint accounts (two or
more members per account) versus single accounts (one member per account). To test
this, a random sample of checking accounts was selected with the following results:
Based upon these data, if tested using a significance level equal to 0.10, the assumption
of equal population variances should be rejected.
It is believed that the number of drivers who are ticketed for speeding on a particular
stretch of highway is a Poisson distribution with a mean of 3.5 per hour. A random
sample of 100 hours is selected with the following results:
Given this information, and without regard to whether there is a need to combine cells
due to expected cell frequencies, the critical value for testing whether the distribution is
Poisson with a mean of 3.5 per hour at an alpha level of .05 is x2 = 15.5073.
The Cromwell Construction Company has the opportunity to enter into a contract to
build a mountain road. The following table shows the probability distribution for the
profit that could occur if it takes the contract:
Based on this information, the profit standard deviation for the company if it takes the
contract is $11,235.

If it is known that a simple linear regression model explains 56 percent of the variation
in the dependent variable and that the slope on the regression equation is negative, then
we also know that the correlation between x and y is approximately -0.75.
A study was recently conducted to see whether the mean starting salaries for graduates
of engineering, business, healthcare, and computer information systems majors differ. A
random sample of 8 graduates was selected from each major. Based upon this
information, the appropriate null hypothesis to be tested is H0 : μ1 – μ2 – μ3 – μ4 = 0
One factor that plays an important part in determining what the needed sample size is
when developing a confidence interval estimate is the level of confidence that you wish
to use.

Consider the following data, which represent the number of miles that employees
commute from home to work each day. There are two samples: one for males and one
for females.
Males:
Females:
The coefficient of variation of commute miles for the males is:
A) approximately 76 percent.
B) about 7.8.
C) approximately 61.5.
D) about 67 percent.
Most companies that make golf balls and golf clubs use a one-armed robot named “Iron
Byron” to test their balls for length and accuracy, but because of swing variations by
real golfers, these test robots don’t always indicate how the clubs will perform in actual
use. One company in the golfing industry is interested in testing its new driver to see if
it has greater length off the tee than the best-selling driver. To do this, it has selected a
group of golfers of differing abilities and ages. Its plan is to have each player use each
of the two clubs and hit five balls. It will record the average length of the drives with
each club for each player. The resulting data for a sample of 10 players are:

What is an appropriate null hypothesis to be tested?
A) H0 : μ1 = μ2
B) H0 : μ1 ≥ μ2
C) H0 : μd ≤ 0
D) H0 : μD = 0
In the annual report, a major food chain stated that the distribution of daily sales at its
Detroit stores is known to be bell-shaped, and that 95 percent of all daily sales fell
between $19,200 and $36,400. Based on this information, what were the mean sales?
A) Around $20,000
B) Close to $30,000
C) Approximately $27,800
D) Can’t be determined without more information.

An industry study was recently conducted in which the sample correlation between
units sold and marketing expenses was 0.57. The sample size for the study included 15
companies. Based on the sample results, test to determine whether there is a significant
positive correlation between these two variables. Use an alpha = 0.05
A) Because t = 2.50 > 1.7709, do not reject the null hypothesis. There is not sufficient
evidence to conclude there is a positive linear relationship between sales units and
marketing expense for companies in this industry.
B) Because t = 2.50 > 1.7709, reject the null hypothesis. There is sufficient evidence to
conclude there is a positive linear relationship between sales units and marketing
expense for companies in this industry.
C) Because t = 3.13 > 1.7709, do not reject the null hypothesis. There is not sufficient
evidence to conclude there is a positive linear relationship between sales units and
marketing expense for companies in this industry.
D) Because t = 3.13 > 1.7709, reject the null hypothesis. There is sufficient evidence to
conclude there is a positive linear relationship between sales units and marketing
expense for companies in this industry.
A popular restaurant takes a random sample n = 25 customers and records how long
each occupied a table. They found a sample mean of 1.2 hours and a sample standard
deviation of 0.3 hour. Find the 95 percent confidence interval for the mean.
A) 1.2 .118
B) 1.2 .124
C) 1.2 .588
D) 1.2 .609
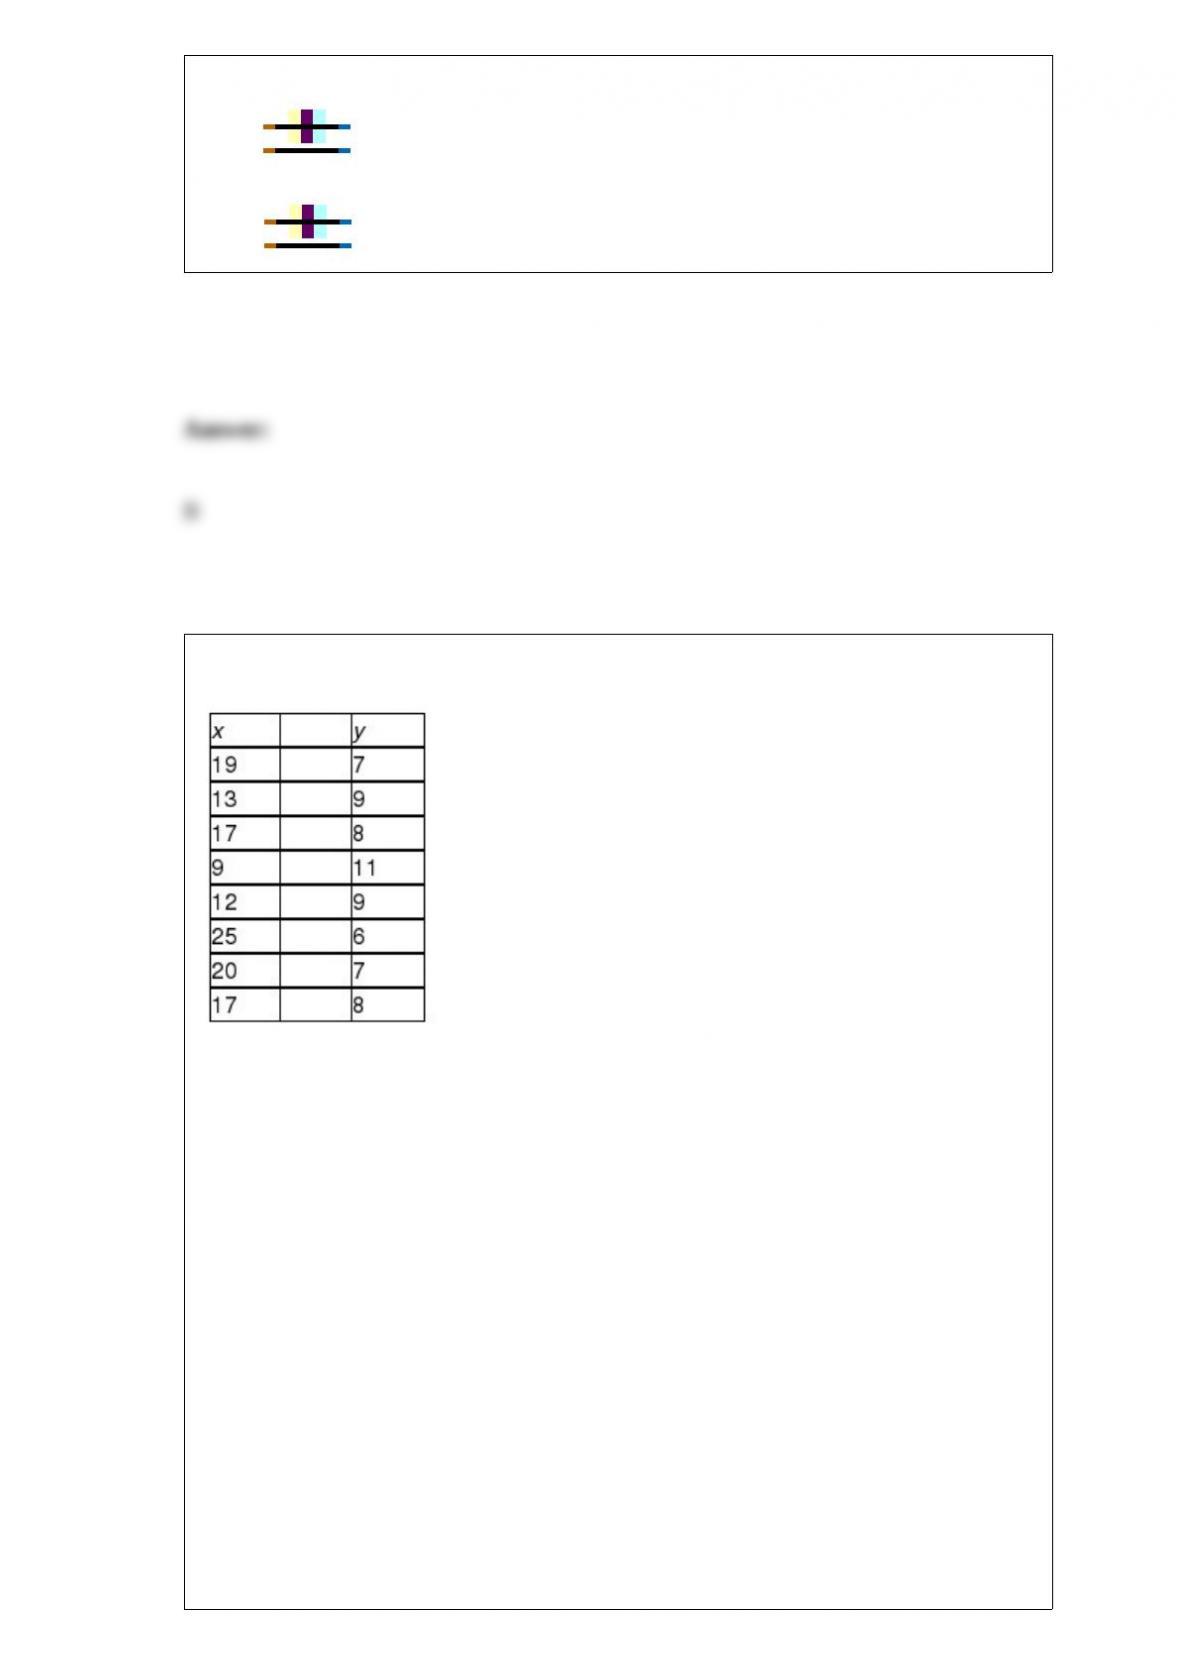
A random sample of two variables, x and y, produced the following observations:
Test to determine whether the population correlation coefficient is negative. Use a
significance level of 0.05 for the hypothesis test.
A) Because t = -4.152 < -1.9432, reject the null hypothesis. Because the null hypothesis
is rejected, the sample data does support the hypothesis that there is a negative linear
relationship between x and y.
B) Because t = -4.152 < -1.9432, do not reject the null hypothesis. Because the null
hypothesis is not rejected, the sample data support the hypothesis that there is a
negative linear relationship between x and y.
C) Because t = -9.895 < -1.9432, reject the null hypothesis. Because the null hypothesis
is rejected, the sample data does support the hypothesis that there is a negative linear
relationship between x and y.
D) Because t = -9.895 < -1.9432, do not reject the null hypothesis. Because the null
hypothesis is not rejected, the sample data support the hypothesis that there is a
negative linear relationship between x and y.

A major fast-food chain has installed a device that measures the temperature of the
hamburgers on the grill. These data are stored in a computer file. If you were to analyze
these data, you would be working with ordinal level data.
One characteristic of a bar chart is:
A) the bars can be displayed either vertically or horizontally.
B) there can be no gaps between the bars.
C) it is used to display the distribution of a continuous variable.
D) it shows cumulative frequency.
A major cell phone service provider has determined that the number of minutes that its
customers use their phone per month is normally distributed with a mean equal to 445.5

minutes with a standard deviation equal to 177.8 minutes. As a promotion, the company
plans to hold a drawing to give away one free vacation to Hawaii for a customer who
uses between 400 and 402 minutes during a particular month. Based on the information
provided, what proportion of the company’s customers would be eligible for the
drawing?
A) Approximately 0.1026
B) About 0.004
C) Approximately 0.2013
D) About 0.02
If the standard deviation for a Poisson distribution is known to be 3, the expected value
of that Poison distribution is:
A) 3
B) about 1.73
C) 9
D) Can’t be determined without more information.
Assume that a Kruskal-Wallis test is being conducted to determine whether or not the
medians of three populations are equal. The sum of rankings and the sample size for

each group are below.
What is the value of the test statistic?
A) 7.8147
B) 2.16
C) 48.68
D) 12.59
A test is conducted to compare three different income tax software packages to
determine whether there is any difference in the average time it takes to prepare income
tax returns using the three different software packages. Ten different person’s income
tax returns are done by each of the three software packages and the time is recorded for
each. Which of the following is true?
A) The total degrees of freedom is 30.
B) The between blocks degrees of freedom is 2.
C) The between samples degrees of freedom is 2.
D) The three software packages are the blocks.
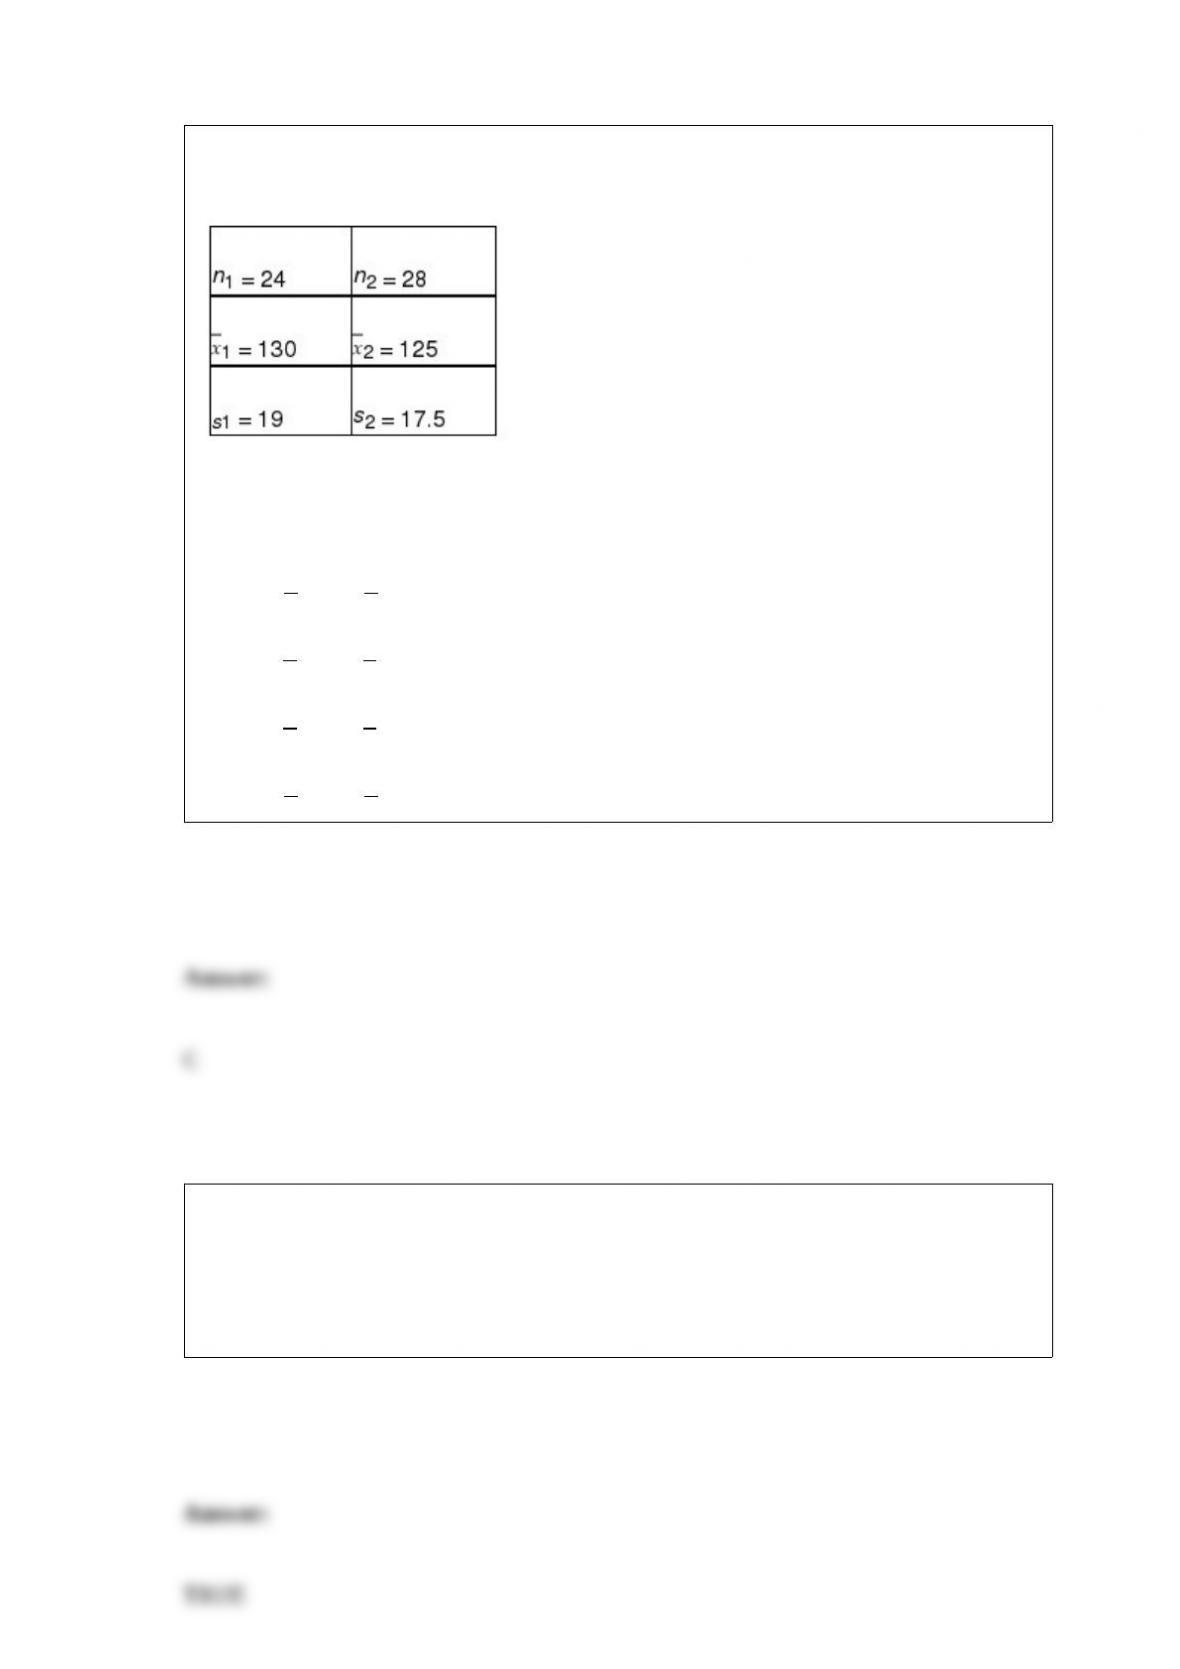
The following information is based on independent random samples taken from two
normally distributed populations having equal variances:
Based on the sample information, determine the 95% confidence interval estimate for
the difference between the two population means.
A) -6.23 < (1 – 2) < 14.23
B) -4.81 < (1 – 2) < 16.81
C) -5.17 < (1 – 2) < 15.17
D) -3.25 < (1 – 2) < 17.25
A study was recently conducted in which makers of toothpaste tracked sales for the
month at different stores in a market area. The variable of interest was the number of
units sold. The numbers ranged from 1,200 to 22,700. In this case, the stems in a stem
and leaf diagram might be values such as 1 and 22 while the leaves would be 200 and
700.

A stem and leaf diagram is an alternative to using:
A) a pie chart.
B) a bar chart.
C) a histogram.
D) an ogive.
It is believed that the SAT scores for students entering two state universities may have
different standard deviations. Specifically, it is believed that the standard deviation at
University A is greater than the standard deviation at University B. If a statistical test is
to be conducted, which of the following would be the proper way to formulate the null
hypothesis?
A) H0 : – = 0
B) H0 : ≤
C) H0 : σA ≤ σB
D) H0 : >

Consider the situation in which a human resources manager wishes to determine
whether the median number of days of sick leave per year is greater for female
employees than for male employees. The following data represent random samples of
males and females:
If the manager is unwilling to assume that the populations are normally distributed,
which of the following is the correct conclusion to reach if the test is conducted using
a .05 level of significance?
A) Reject the null hypothesis
B) Conclude that females do have a higher median than males
C) Do not reject the null hypothesis
D) Conclude that males have a higher median than females
The term that is given when two variables are correlated but there is no apparent
connection between them is:
A) spontaneous correlation.

B) random correlation.
C) spurious correlation.
D) linear correlation.
The R.D. Wilson Company makes a soft drink dispensing machine that allows
customers to get soft drinks from the machine in a cup with ice. When the machine is
running properly, the average number of fluid ounces in the cup should be 14.
Periodically the machines need to be tested to make sure that they have not gone out of
adjustment. To do this, six cups are filled by the machine and a technician carefully
measures the volume in each cup. In one such test, the following data were observed:
Which of the following would be the correct null hypothesis if the company wishes to
test the machine?
A) H0 : = 14 ounces
B) H0: μ = 14 ounces
C) H0 : μ ≠ 14 ounces
D) H0 : ≠ 14 ounces
When conducting a one-tailed hypothesis test of a population variance using a sample
size of n = 24 and a 0.10 level of significance, the critical value is:
A) 32.0069
B) 35.1725
C) 33.1962
D) 36.4150
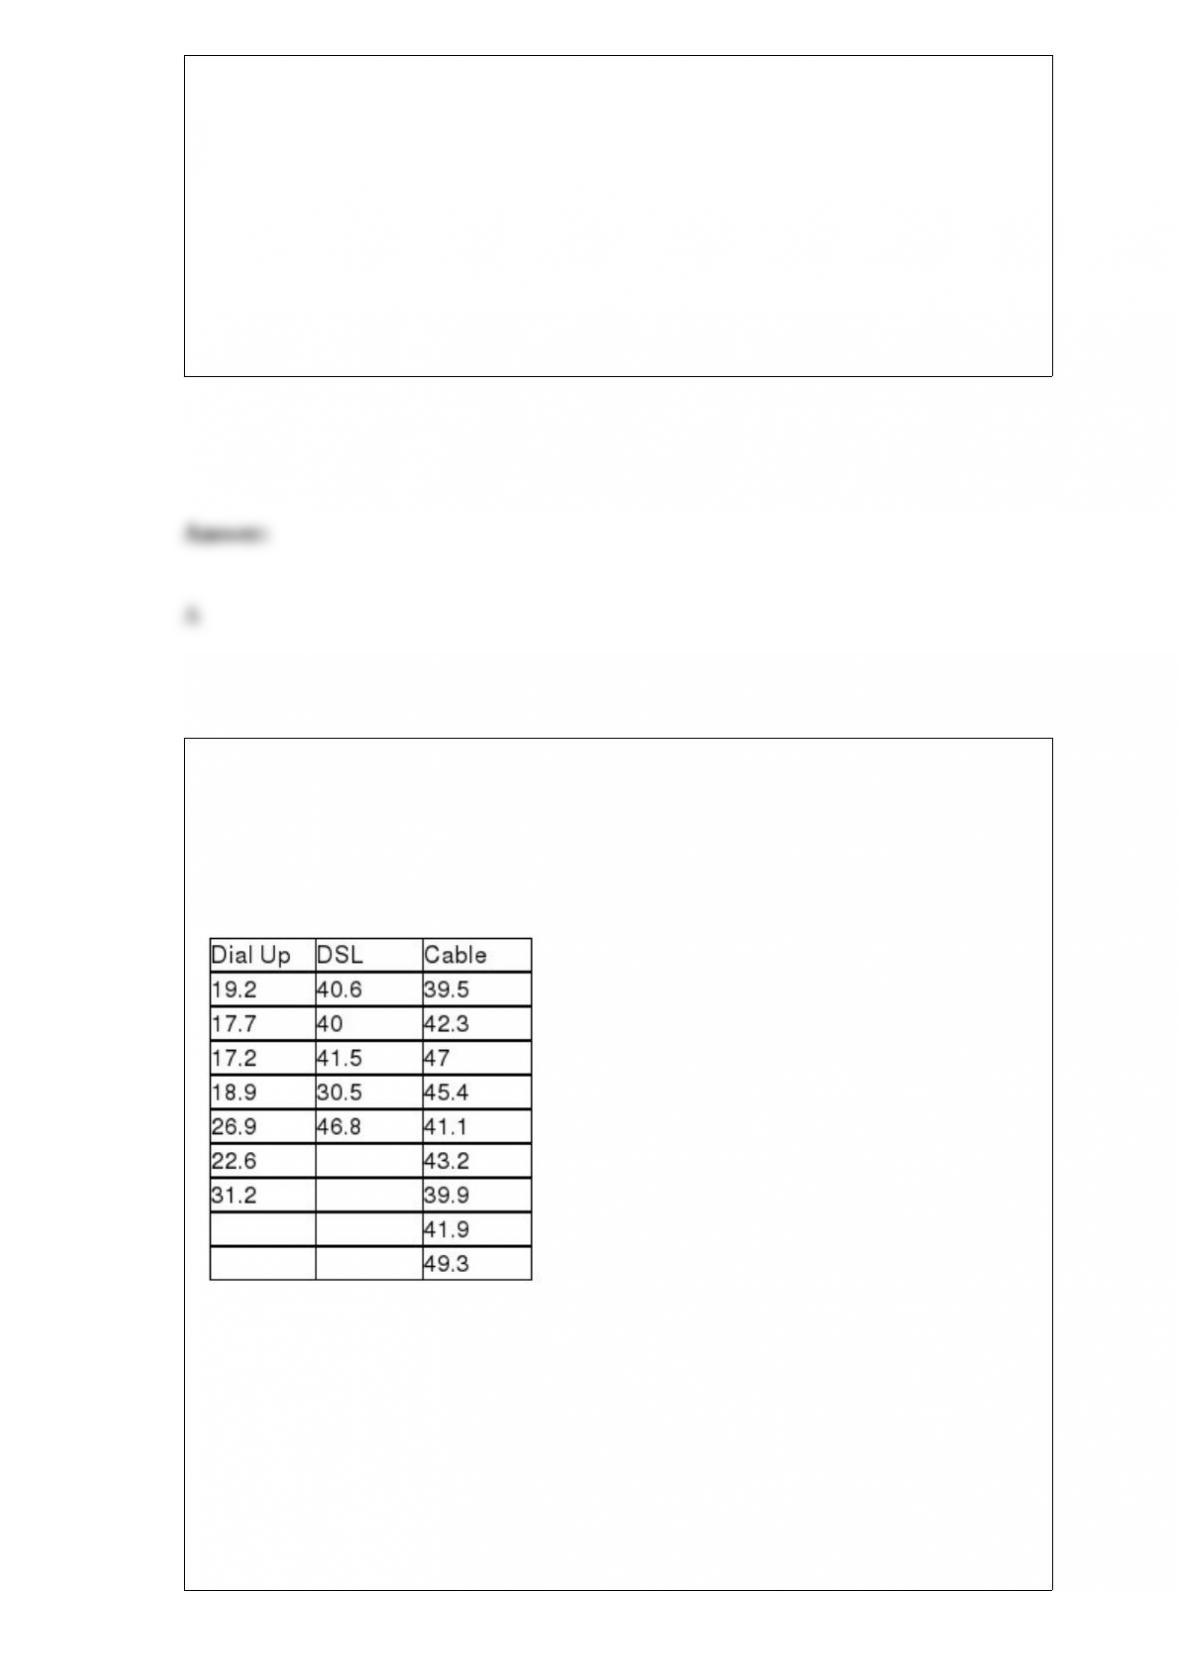
An Internet service provider is interested in testing to see if there is a difference in the
mean weekly connect time for users who come into the service through a dial-up line,
DSL, or cable Internet. To test this, the ISP has selected random samples from each
category of user and recorded the connect time during a week period. The following
data were collected:
Which of the following would be the correct alternative hypotheses for the test to be
conducted?
A) H0 : μ1 = μ2 = μ3
B) H0 : μ1 ≠ μ2 ≠μ3
C) Not all population means are equal.
D) σ1 = σ2 = σ3 = σ4
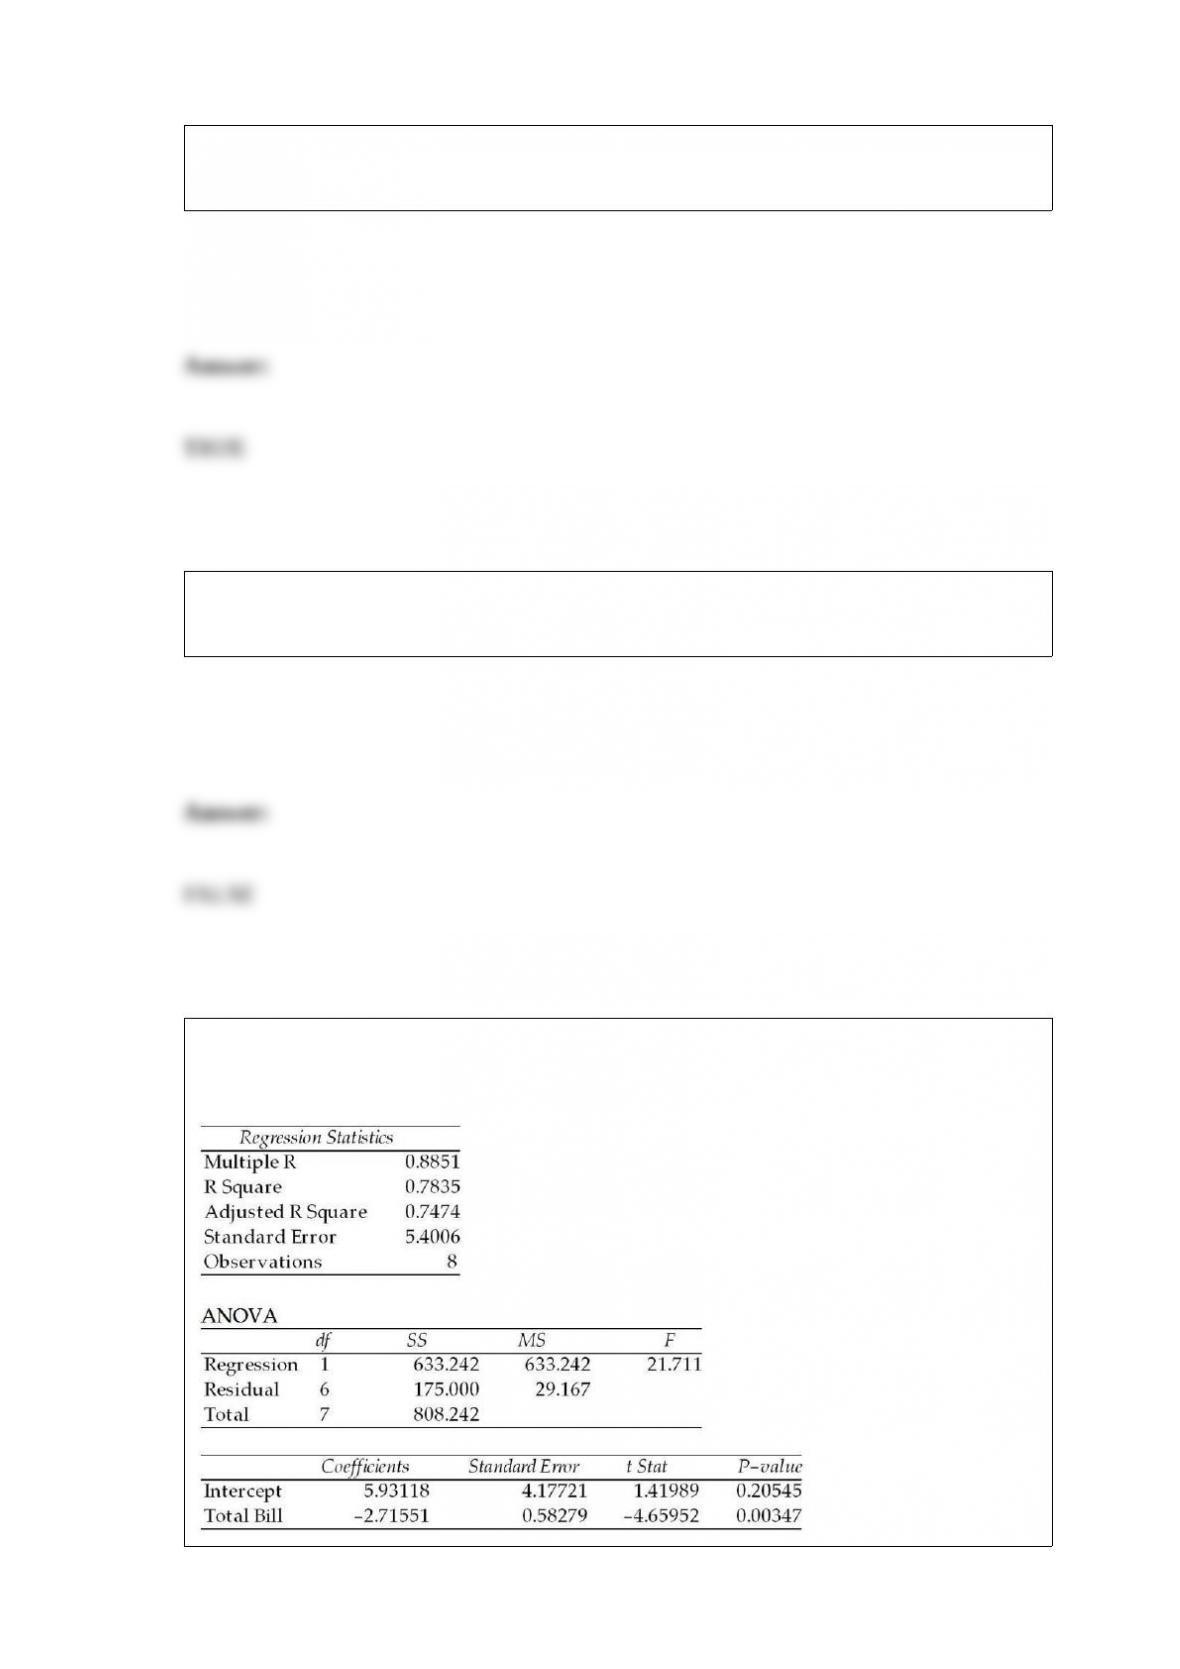
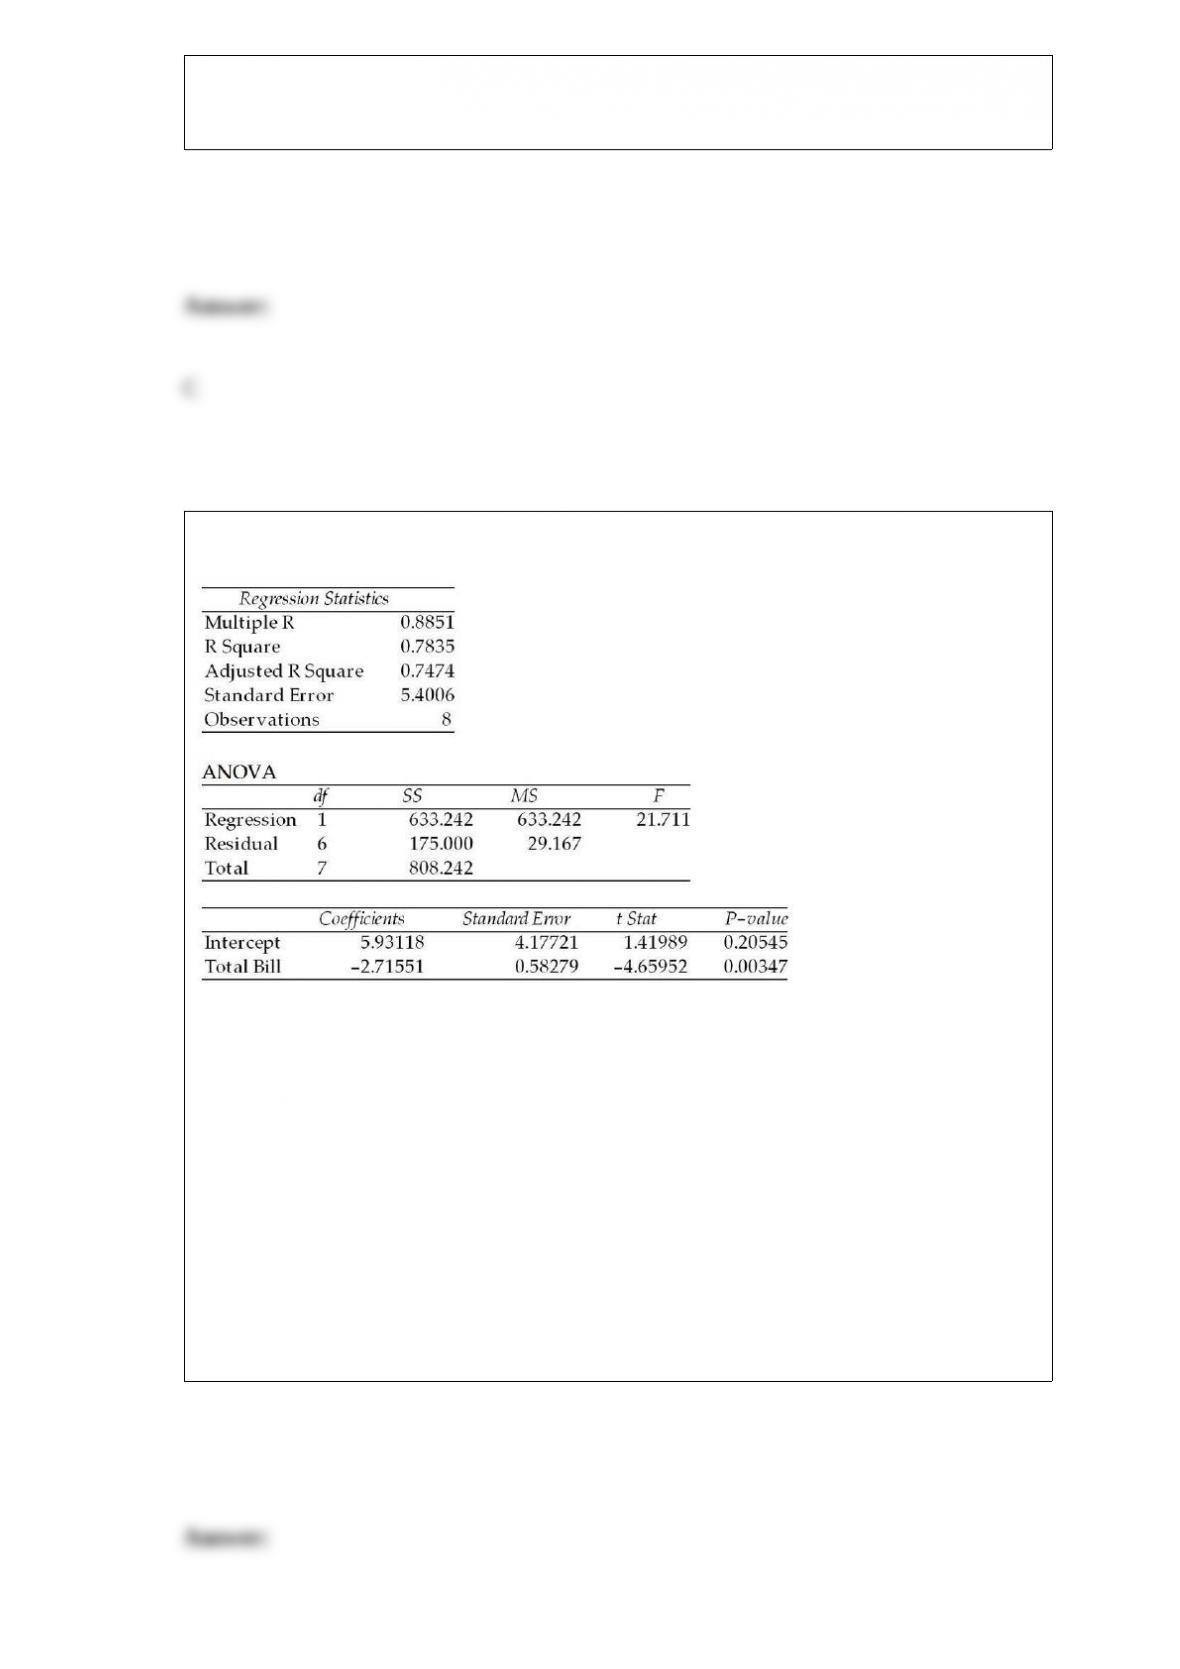
Use the following regression results to answer the question below.
In conducting a hypothesis test of the slope using a 0.05 level of significance, which of
the following is correct?
A) The slope differs significantly from 0 because p-value = 0.205 is greater than 0.05
B) The slope does not differ significantly from 0 because p-value = 0.205 is greater than
0.05
C) The slope differs significantly from 0 because p-value = 0.003 is less than 0.05
D) The slope does not differ significantly from 0 because p-value = 0.003 is less than
0.05

The URS construction company has submitted two bids, one to build a large hotel in
London and the other to build a commercial office building in New York City. The
company believes it has a 40% chance of winning the hotel bid and a 25% chance of
winning the office building bid. The company also believes that winning the hotel bid is
independent of winning the office building bid.
What is the probability the company will lose both contracts?
A) 0.55
B) 0.45
C) 0.10
D) 0.75
A large retail company gives an employment screening test to all prospective
employees. Franklin Gilman recently took the test and it was reported back to him that
his score placed him at the 80th percentile. Therefore:
A) 80 people who took the test scored below Franklin.
B) Franklin scored as high or higher than 80 percent of the people who took the test.
C) Franklin was in the bottom 20 percent of those that have taken the test.
D) Franklin’s score has a z-score of 80.

Waiters at Finegold’s Restaurant and Lounge earn most of their income from tips. Each
waiter is required to “tip-out” a portion of tips to the table bussers and hostesses. The
manager has based the “tip-out” rate on the assumption that the mean tip is at least 15%
of the customer bill. To make sure that this is the correct assumption, he has decided to
conduct a test by randomly sampling 60 bills and recording the actual tips.
Calculate the probability of a Type II error if the true mean is 14%. Assume that the
population standard deviation is known to be 2% and that a significance level equal to
0.01 will be used to conduct the hypothesis test.
A) 0.0041
B) 0.1251
C) 0.0606
D) 0.4123
Which of the following statements is true?
A) The interval estimate for predicting a particular value of y given a specific x will be
narrower than the interval estimate for the average value of y given a particular x.
B) The higher the r-square value, the wider will be the prediction interval based on a
simple linear regression model.
C) The prediction interval generated from a simple linear regression model will be
narrowest when the value of x used to generate the predicted y value is close to the
mean value of x.
D) The prediction interval generated from a simple linear regression model will be
widest when the value of x used to generate the predicted y value is close to the mean
value of x.

Suppose that it is believed that investor returns on equity investments at a particular
brokerage house are normally distributed with a mean of 9 percent and a standard
deviation equal to 3.2 percent. What percent of investors at this brokerage house earned
at least 5 percent?
A) 89.44 percent
B) 10.56 percent
C) 39.44 percent
D) 100 percent
The Mann-Whitney U test assumes that the 2 samples are:
A) equal in size.
B) independent and random.
C) matched or paired.
D) normally distributed.

In conducting a personal interview, what problem can result if the interviewer is
allowed to arbitrarily decide who should be interviewed?
A) Nonresponses
B) Missing data
C) Bias
D) Poor response rate
Consider a random variable, z, that has a standardized normal distribution. Determine
P(z > 1.645).
A) 0.05
B) 0.01
C) 0.03
D) 0.45
Many companies use well-known celebrities as spokespeople in their TV
advertisements. A study was conducted to determine whether brand awareness of
female TV viewers and the gender of the spokesperson are independent. Each in a
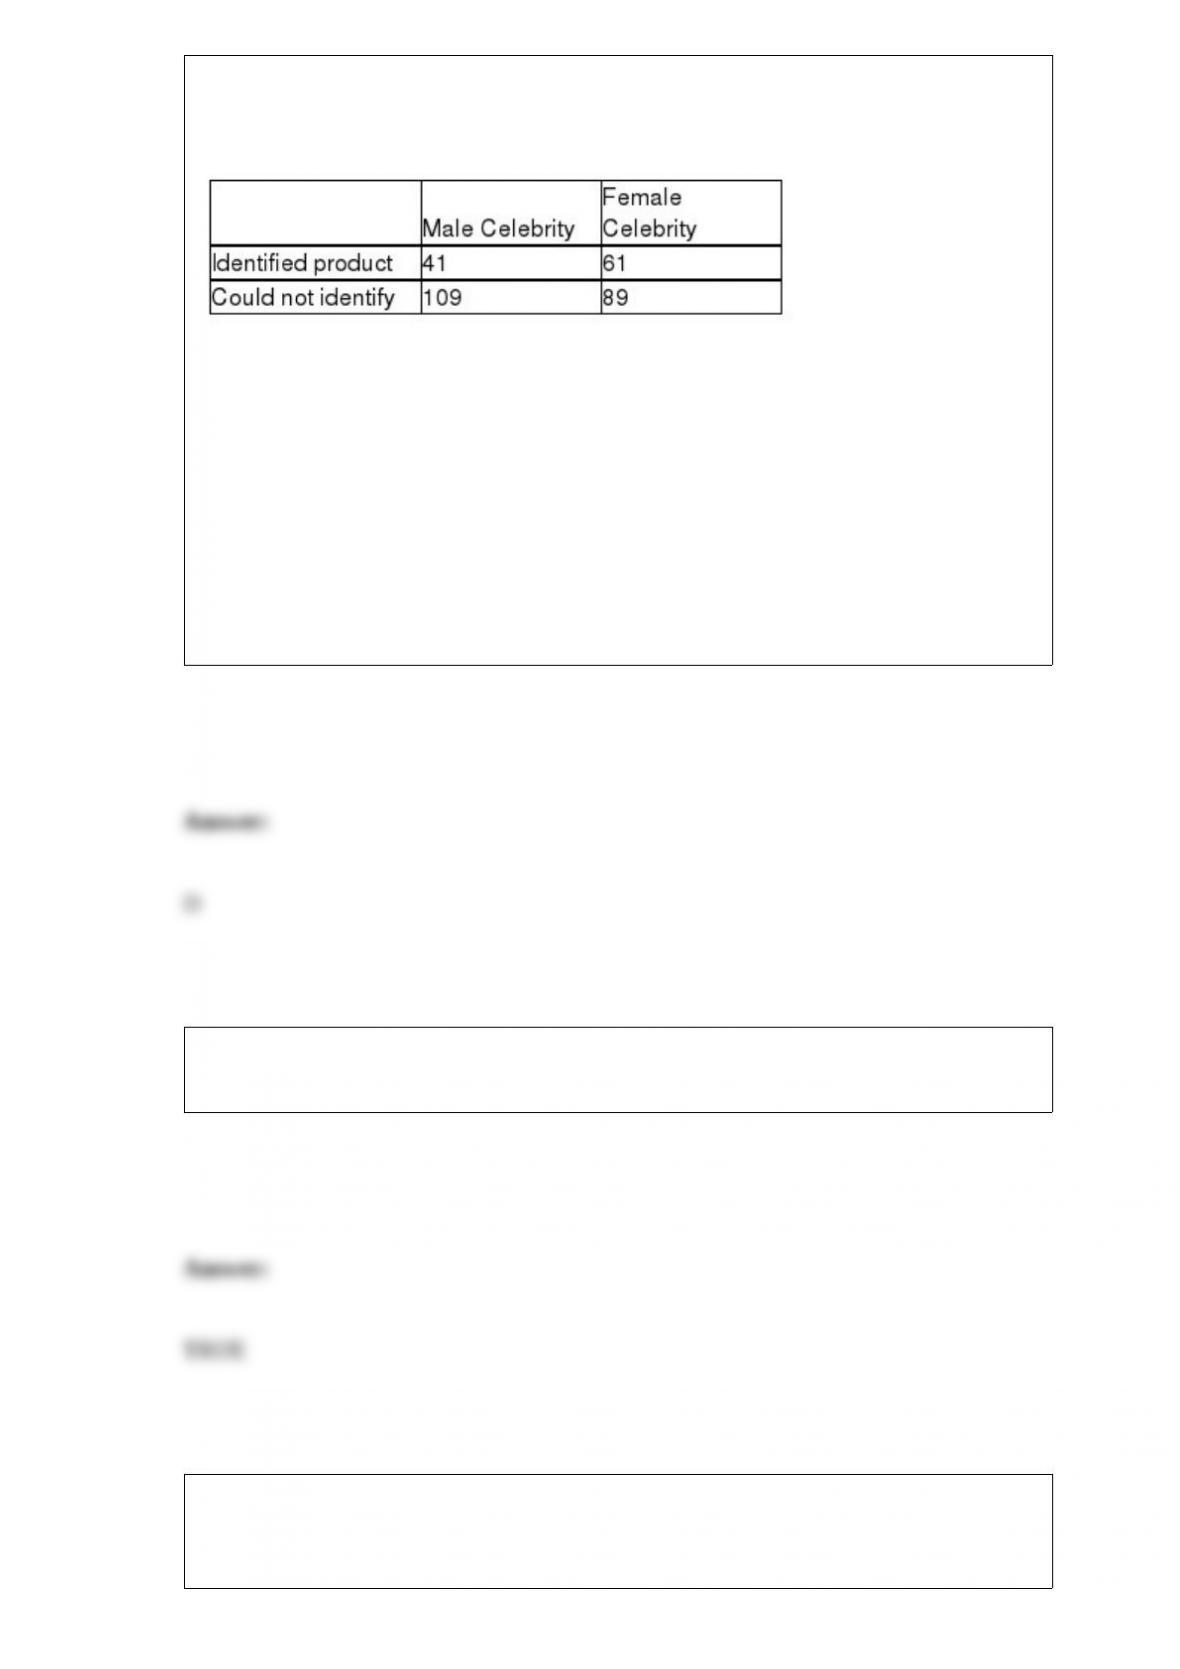
sample of 300 female TV viewers was asked to identify a product advertised by a
celebrity spokesperson. The gender of the spokesperson and whether or not the viewer
could identify the product was recorded. The numbers in each category are given below.
Referring to these sample data, which of the following values is the correct value of the
test statistic?
A) Approximately 9.48
B) Nearly 23.0
C) About 3.84
D) Approximately 5.94
Both p-charts and c-charts are designed for use when the data we are working with are
referred to as attribute data.
Beacon Hill Trees & Shrubs currently has an inventory of 10 fruit trees, 8 pine trees,
and 14 maple trees. It plans to give 4 trees away at next Saturday’s lawn and garden
show in the city park. The 4 winners can select which type of tree they want. Assume

they select randomly.
What is the probability that 3 winners will select pine trees and the other tree will be a
maple?
A) 0.0058
B) 0.0218
C) 0.0355
D) 0.0709