
In systematic sampling, the first element is randomly selected from the first (N/n)
elements.
The population mean is the average of the population measurements.
We are testing H0: μ ≤ .95; versus HA: μ > .95. When = .99, s = .12, and n = 24, at
alpha = .05, we reject H0. (Assume a normally distributed population.)

When determining the sample size (n) for a confidence interval for ρ, if you are using a
previous sample, use the reasonable value of ρ that is closest to 0.25.
The Wilcoxon rank sum test and the Kruskal-Wallis test both require that we take
independent random samples.
The stem-and-leaf display is advantageous because it allows us to actually see the
measurements in the data set.

A runs plot is a form of scatter plot.
A stem-and-leaf display is a graphical portrayal of a data set that shows the data set’s
overall pattern of variation.
A continuous random variable may assume only integer values in a given interval.

Time series data are data collected at the same time period.
Using a χ2 test statistic to test the null hypothesis that the variance of a new process is
equal to the variance of the current process and when applying the p-value rule, we are
rejecting at a p-value less than α, we can conclude that the new process is more
consistent than the current process.
Parametric tests, such as F and t tests, are more powerful than their nonparametric
counterparts if the assumptions needed to perform the parametric test are not violated.

The slope of the simple linear regression equation represents the average change in the
value of the dependent variable per unit change in the independent variable (X).
The ANOVA procedure for a two-factor factorial experiment partitions the total sum of
squares into three components, SS first factor, SS second factor, and SSE.
A studentized residual for an observation that is greater than 2 in absolute value is
evidence that the observation is an outlier.

The relative frequency is the frequency of a class divided by the total number of
measurements.
Box-Jenkins methodology is a more sophisticated approach to forecasting a time series
with components that might be changing over time.
After testing H0: p = .33; versus HA: p < .33; at α = .05, with = .20 and n = 100, we
do not reject H0.

The exponential probability distribution is based on a continuous random variable.
In testing the difference between two population variances, it is a common practice to
compute the F statistic so that its value is always greater than or equal to one.
Dummy variable regression would be an appropriate method to use to forecast a time
series that exhibits a linear trend with no seasonal or cyclical patterns.

Data drill down is a form of data discovery.
When applying either the critical value rule or the p-value rule about a single mean,
other relevant factors held constant, increasing the level of significance, α, from .05 to .
10 will reduce the probability of a Type II error.
If a particular multiple regression model has a small value of the C statistic and C for
this model is less than k+1, where k is the number of independent variables in the
model, then the model should be considered biased and therefore undesirable.

The chi-square distribution is a continuous probability distribution that is skewed to the
left.
The normal probability distribution is a discrete probability distribution.
If events A and B are independent, then P(A|B) is always equal to zero.

The reason sample variance has a divisor of n − 1 rather than n is that it makes the
variance an unbiased estimate of the population variance.
The sample cumulative distribution function is nondecreasing.
When deseasonalizing a time series observation, the actual time series observation is
divided by its seasonal factor.

A multinomial probability distribution describes data that are classified into two or
more categories when a multinomial experiment is carried out.
The population variance is the average of the squared deviations of the individual
population measurements from the population mean.
A tolerance interval is meant to contain a specified percentage of the individual
population measurements.

A positive autocorrelation implies that negative error terms will be followed by
negative error terms.
The Wilcoxon signed ranks test is the nonparametric counterpart of the
A. large sample test about a single population mean.
B. two independent samples t test.
C. one-way ANOVA F test.
D. paired difference t test.
E. F test for equality of population variances.
A measurement located outside the upper limits of a box-and-whiskers display is
___________.
A. always in the first quartile
B. an outlier
C. always the largest value in the data set
D. within the lower limits

In which of the following are the two events A and B always independent?
A. A and B are mutually exclusive.
B. The probability of event A is not influenced by the probability of event B.
C. The intersection of A and B is zero.
D. P(A|B) = P(A).
E. The probability of event A is not influenced by the probability of event B, or P(A|B)
= P(A).
A study was conducted to investigate the effect of coaching on IQ tests. Nine randomly
selected students were tested.
Before After
100 106
111 112
93 95
92 90
99 107
85 100
117 126
110 105
98 110
What is the rejection point T0 for α = .05?
A. 8
B. 6
C. 4
D. 6.5
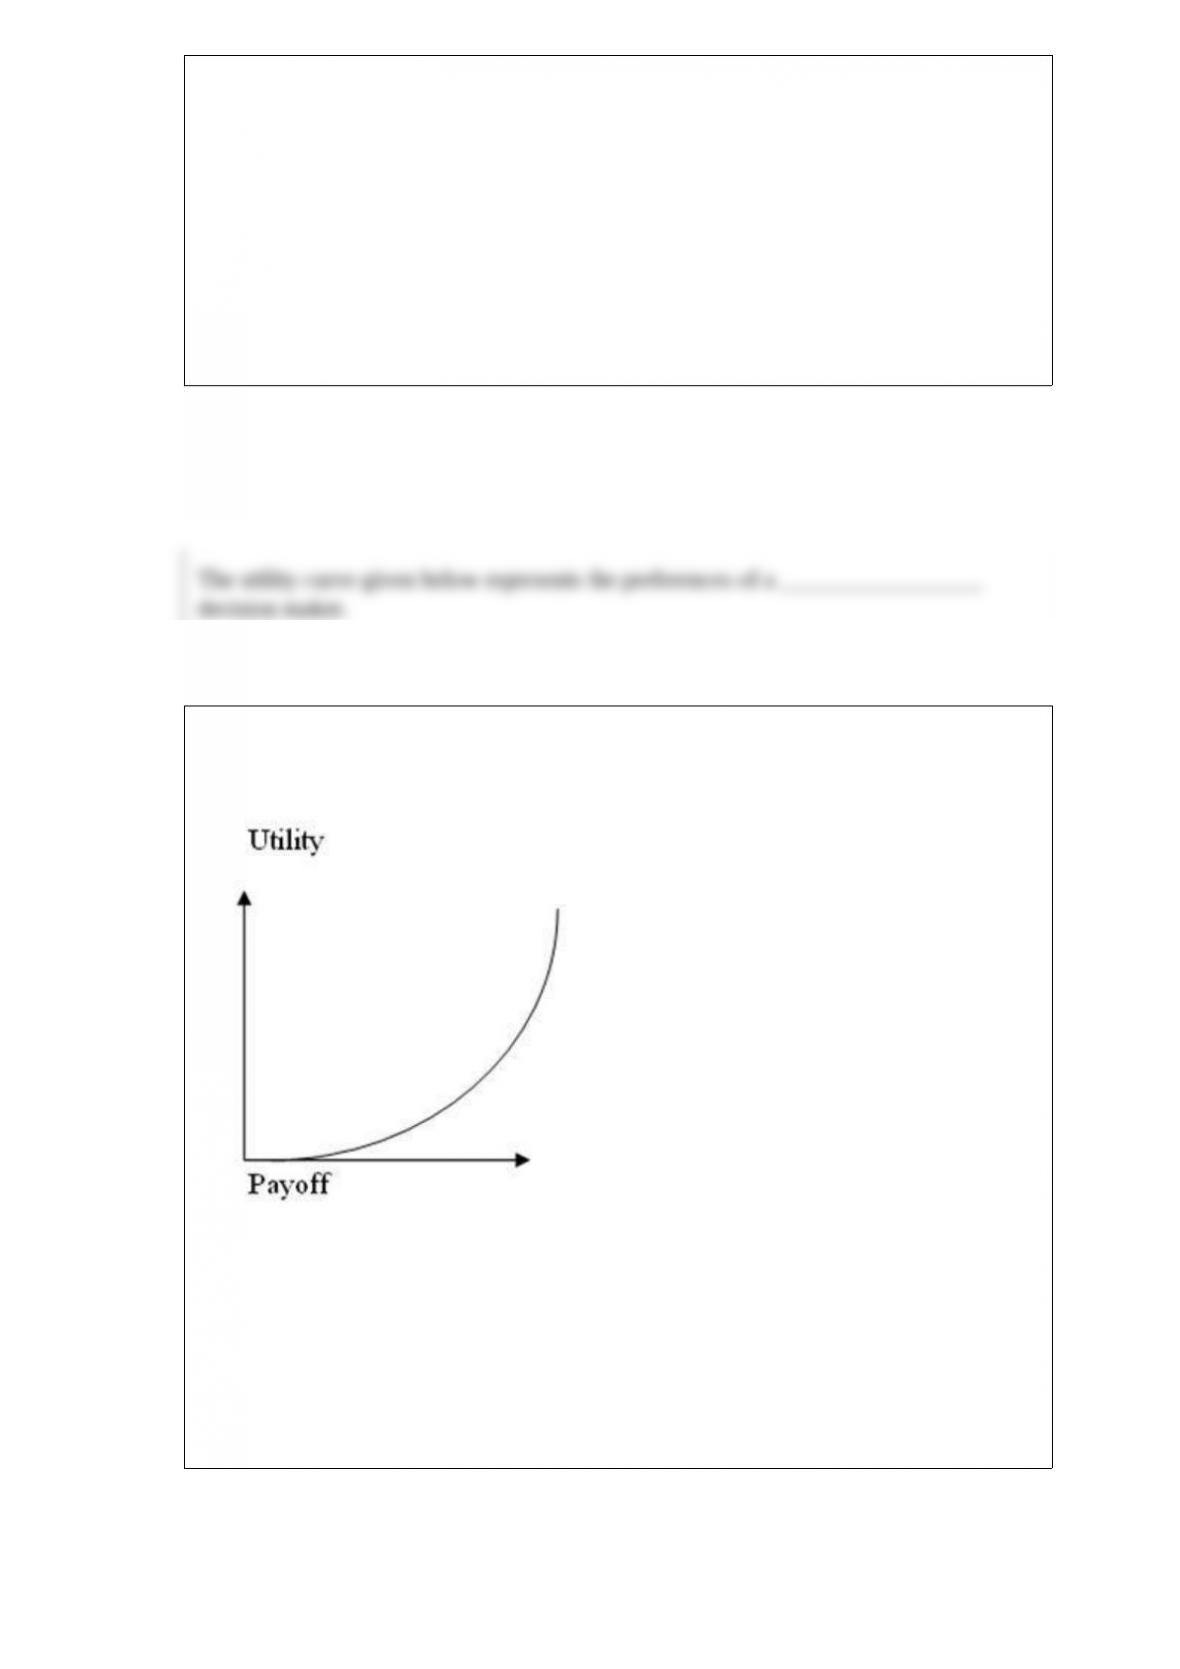
The utility curve given below represents the preferences of a _________________
decision maker.
A. risk-averse
B. risk-neutral
C. risk-seeking
D. None of the other choices is correct.

For large samples, the sampling distribution of is approximately normal with a mean
of _____.
A. μ
B. μ/√n
C.
D. z
Which of the following is not an example of unethical statistical practices?
A. inappropriate interpretation of statistical results
B. using graphs to make statistical inferences
C. improper sampling
D. descriptive measures that mislead the user
E. None of the other answers is correct.
The company financial officer was interested in the average cost of PCs that had been
purchased in the past six months. She took a random sample of the price of 10
computers, with the following results.
$3,250, $1,127, $2,995, $3,250, $3,445, $3,449, $1,482, $6,120, $3,009, $4,000
What is the third quartile?
A. $1,446.50
B. $2,617.00
C. $3,415.75
D. $3,449.00
E. $4,212.00
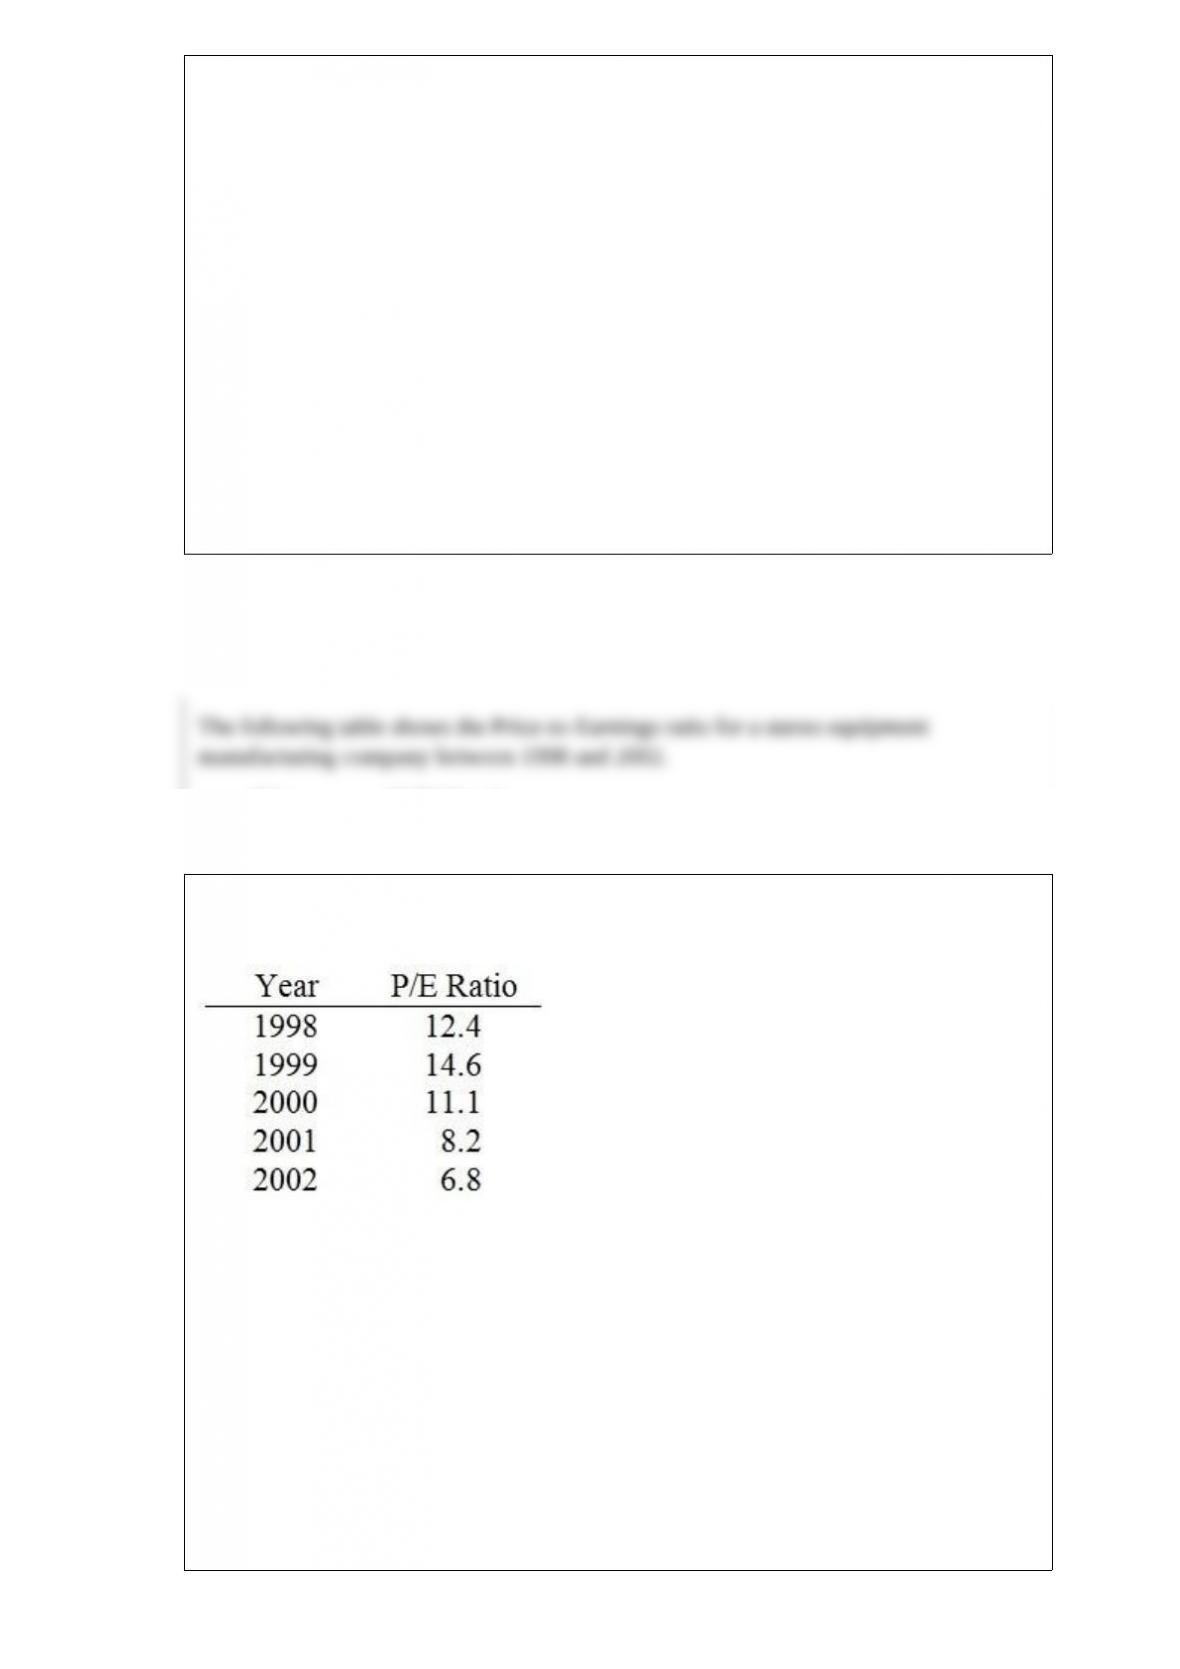
The following table shows the Price-to-Earnings ratio for a stereo equipment
manufacturing company between 1998 and 2002.
Determine the percentage change in the P/E ratios from 1998 to 1999.
A. 15.07%
B. 17.74%
C. 20.72%
D. −17.74%
E. −15.07%

Using either the critical value rule or the p-value rule, if a one-sided null hypothesis for
a single mean cannot be rejected at a given significance level, then the corresponding
two-sided null hypothesis (i.e., the same sample size, the same standard deviation, and
the same mean) will ______________ be rejected at the same significance level.
A. always
B. sometimes
C. never
A random sample of size 30 from a normal population yields = 32.8 with a
population standard deviation of 4.51. Construct a 95 percent confidence interval for μ.
A. [23.96, 41.64]
B. [32.04, 33.56]
C. [31.45, 34.15]
D. [31.19, 34.41]

A process of observation that has an uncertain outcome is referred to as a(n)
_____________.
A. probability
B. frequency
C. conditional probability
D. experiment
The J.O. Supplies Company buys calculators from a non-US supplier. The probability
of a defective calculator is 10 percent. If 100 calculators are selected at random, what is
the standard deviation of the number of defectives?
A. 9.00
B. 3.17
C. 9.49
D. 3.00
The life of a light bulb is exponentially distributed with a mean of 1,000 hours. What is
the probability that the bulb will last less than 800 hours?
A. .6321
B. .5507

C. .7135
D. .4493
In using a regression model, if a new independent variable is added, the value of (the
coefficient of multiple determination) will ___________ decrease.
A. always
B. sometimes
C. never
An ad agency is developing a campaign to promote a business opening in a new mall
development. To develop an appropriate mailing list, they decide to purchase lists of
credit card holders from MasterCard and American Express. Combining the lists, they
find the following: 40 percent of the people on the list have only a MasterCard and 10
percent have only an American Express card. Another 20 percent hold both MasterCard
and American Express. Finally, 30 percent of those on the list have neither card.
Suppose a person on the list is known to have a MasterCard. What is the probability
that person also has an American Express card?
A. .20
B. .33
C. .18
D. .70
E. .90
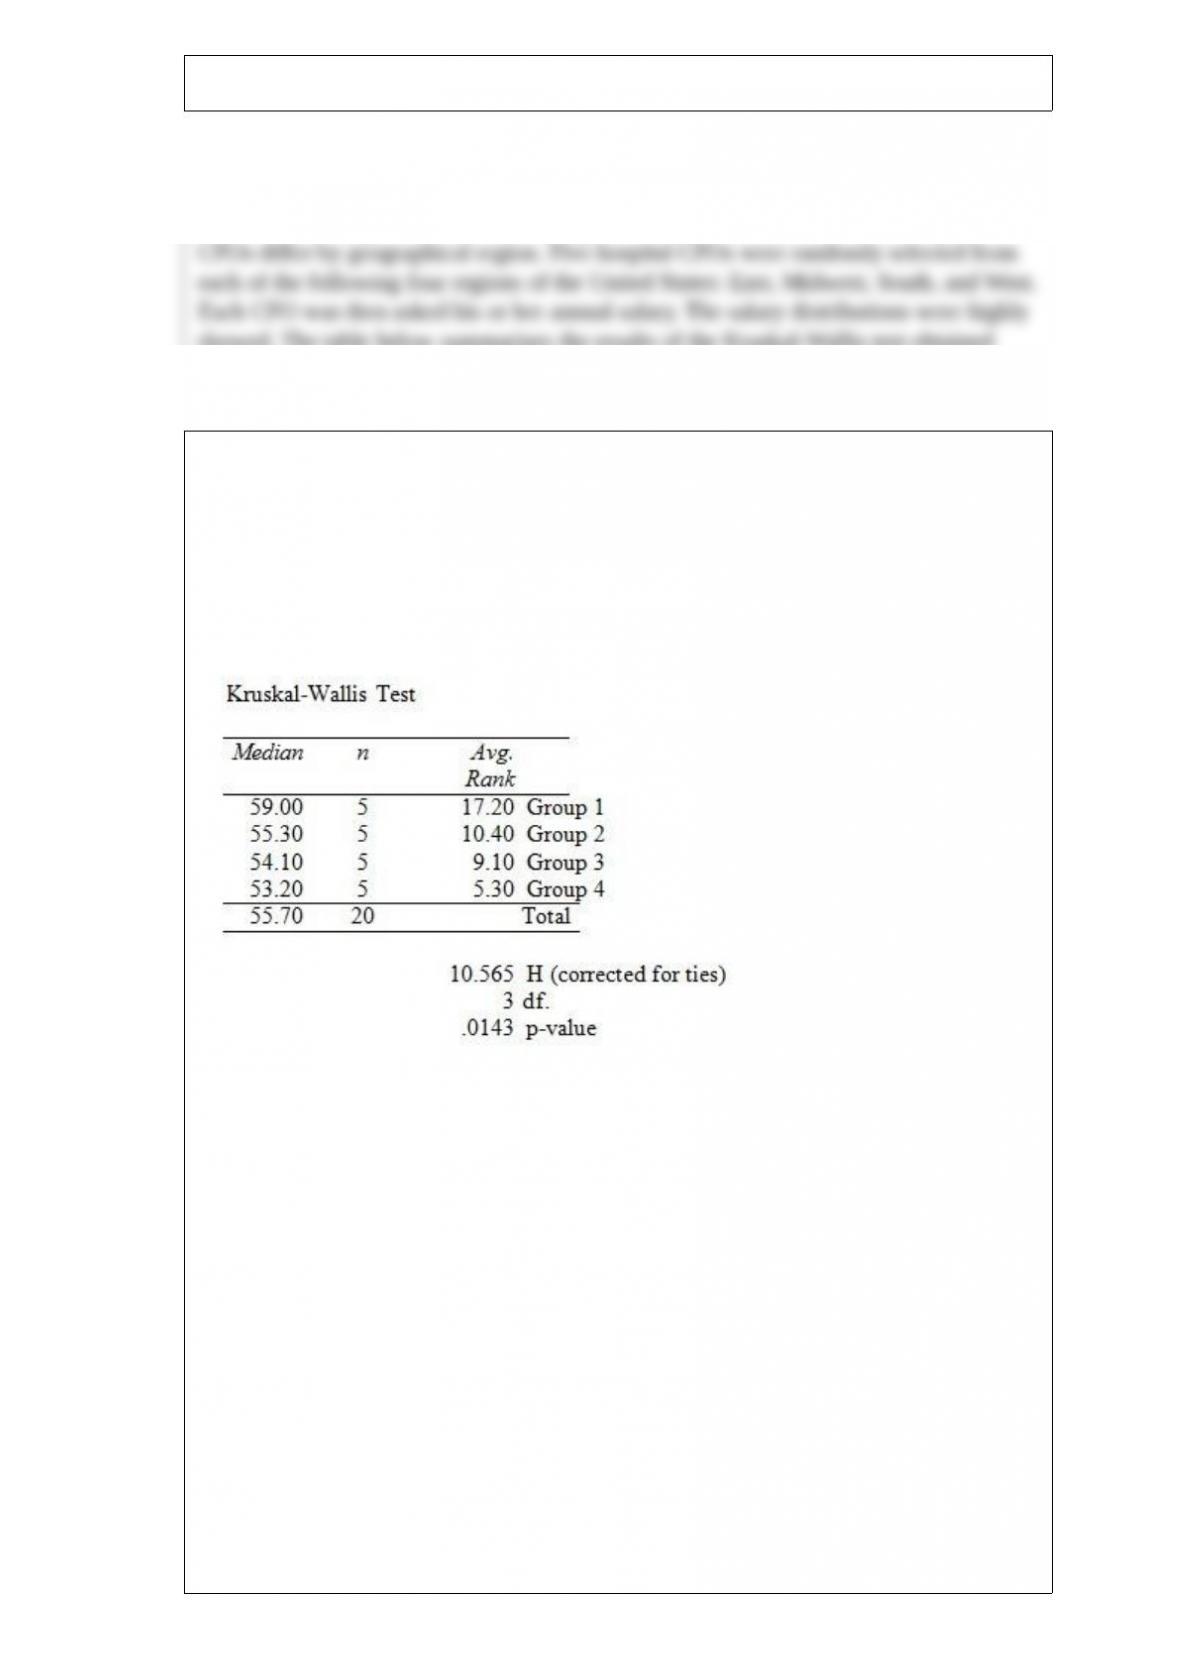
A professional organization is attempting to determine whether salaries of hospital
CFOs differ by geographical region. Five hospital CFOs were randomly selected from
each of the following four regions of the United States: East, Midwest, South, and West.
Each CFO was then asked his or her annual salary. The salary distributions were highly
skewed. The table below summarizes the results of the Kruskal-Wallis test obtained
from MegaStat/Excel.
At a significance level of .05, which one of the following statements is correct
regarding the following null hypothesis?
H0: The four populations under consideration have identical salaries.
A. We reject H0 and conclude that there is very strong evidence that the median hospital
CFO salaries differ among all four regions in the United States.
B. We failed to reject H0 and conclude that there is not sufficient evidence that the
median hospital CFO salaries differ among any of the four regions of the United States.
C. We do not reject H0 and conclude that there is only adequate evidence that the
median hospital CFO salaries differ between at least two of the four regions in the
United States.
D. We reject H0 and conclude that there is strong evidence that the median hospital

CFO salaries differ between at least two of the four regions in the United States.
E. We do not reject H0 and conclude that all 4 populations under consideration are
identical in their locations.
Container 1 has 8 items, 3 of which are defective. Container 2 has 5 items, 2 of which
are defective. If one item is drawn from each container, what is the probability that only
one of the items is defective?
A. 0.2250
B. 0.3000
C. 0.0250
D. 0.4000
E. 0.1500
Non-overlapping groups in random sampling of a population are called
A. clusters.
B. frames.
C. strata.
D. stages.

Any characteristic of a population unit is a(n)
A. measurement.
B. sample.
C. observation.
D. variable.
For the same set of observations on a specified dependent variable, two different
independent variables were used to develop two separate simple linear regression
models. A portion of the results is presented below.
Based on the results given above, we can conclude that
A. a prediction based on Model 1 is better than a prediction based on Model 2.
B. a prediction based on Model 2 is better than a prediction based on Model 1.
C. there is no difference in the predictive ability between Model 1 and Model 2.
D. there is not sufficient information to determine which of the two models is superior
for prediction purposes.

A simple index is obtained by dividing the current value of a time series by the value of
a time series in the _____________ time period and by multiplying this ratio by 100.
A. base
B. final
C. current
D. shortest
The local amusement park was interested in the average wait time at their most popular
roller coaster at the peak park time (2 p.m.). They selected 13 patrons and had them get
in line between 2 and 3 p.m. Each was given a stopwatch to record the time they spent
in line. The times recorded were as follows (in minutes): 118, 124, 108, 116, 99, 120,
148, 118, 119, 121, 45, 130, 118.
What is the mean?
A. 114.15
B. 118
C. 148
D. 45
E. 115.5

A(n) ______________ is a collection of sample space outcomes.
A. experiment
B. event
C. set
D. probability
From 20 samples of size 100, a total of 80 units are defective. What is the centerline for
the p chart?
A. .04
B. .4
C. .8
D. .08
When the population is normally distributed, population standard deviation σ is
unknown, and the sample size is n = 15, the confidence interval for the population mean
μ is based on

A. the z (normal) distribution.
B. the t distribution.
C. the binomial distribution.
D. the Poisson distribution.
E. None of the other choices is correct.
Consider a normal population with a mean of 10 and a variance of 4. Find P(X < 6).
A. .0228
B. .1587
C. .8413
D. .9772
The ________ component of a time series measures the fluctuations in a time series due
to economic conditions of prosperity and recession with a duration of approximately 2
years or longer.
A. trend
B. seasonal
C. cyclical

D. irregular
A multiple regression analysis with 20 observations on each of three independent
variables and the dependent variable would yield ______ and _______ degrees of
freedom, respectively, for regression (explaineD) and error.
A. 3, 17
B. 3, 16
C. 4, 16
D. 3, 19
E. 3, 20
Which of the following is not evidence of an assignable cause?
A. There are 8 consecutive points above the mean.
B. There are 9 consecutively decreasing points.
C. There is a point below the lower control limit.
D. There are 2 out of 3 consecutive points in Zone A.
E. There are 4 out of 5 consecutive points in Zone C.

The _____________ of an event is a number that measures the likelihood that an event
will occur when an experiment is carried out.
A. outcome
B. probability
C. intersection
D. observation
The number of items rejected daily by a manufacturer because of defects for the last 30
days are:
20, 21, 8, 17, 22, 19, 18, 19, 14, 17, 11, 6, 21, 25, 4, 19, 9, 12, 16, 16, 10, 28, 24, 6, 21,
20, 25, 5, 17, 8
Construct a stem-and-leaf plot.

In 1930, the average size of a public restroom was 172 square feet. By 1990, due to
federal disability laws, the average size had increased to 471 square feet. Suppose that a
design team believes that this standard has increased from the 1990 level. They
randomly sample 23 public restrooms in a major midwestern city and obtain a mean
square footage of 498.78 with a standard deviation of 46.94. Test the hypotheses at α = .
001 using the critical value rule.

Suppose you randomly select 3 DVDs from a production run of 10. Of the 10 DVDs, 9
are expected to last a minimum of 3 years. What values of x are within two standard
deviations of the mean?
Consider the following partial analysis of variance table from a randomized block
design with 10 blocks and 6 treatments.
Source SS
Treatments 2,477.53
Blocks 3,180.48
Error 11,661.38
Total
What is the calculated F statistic for treatment?
Consider a two-way analysis of variance experiment with treatment factors A and B,

with factor A having four levels and factor B having three levels.The results are
summarized below.
Source of Variation df SS
Factor A 71
Factor B 63
Interaction 50
Error 280
Total 71 446
If there are an equal number of observations in each cell, what is the number of
observations in each cell? (number of cells = level of factor A level of factor B)
A company is interested in estimating μ, the mean number of days of sick leave taken
by its employees. Their statistician randomly selects 100 personnel files and notes the
number of sick days taken by each employee. The sample mean is 12.2 days, and the
sample standard deviation is 10 days. Calculate a 95 percent confidence interval for μ.
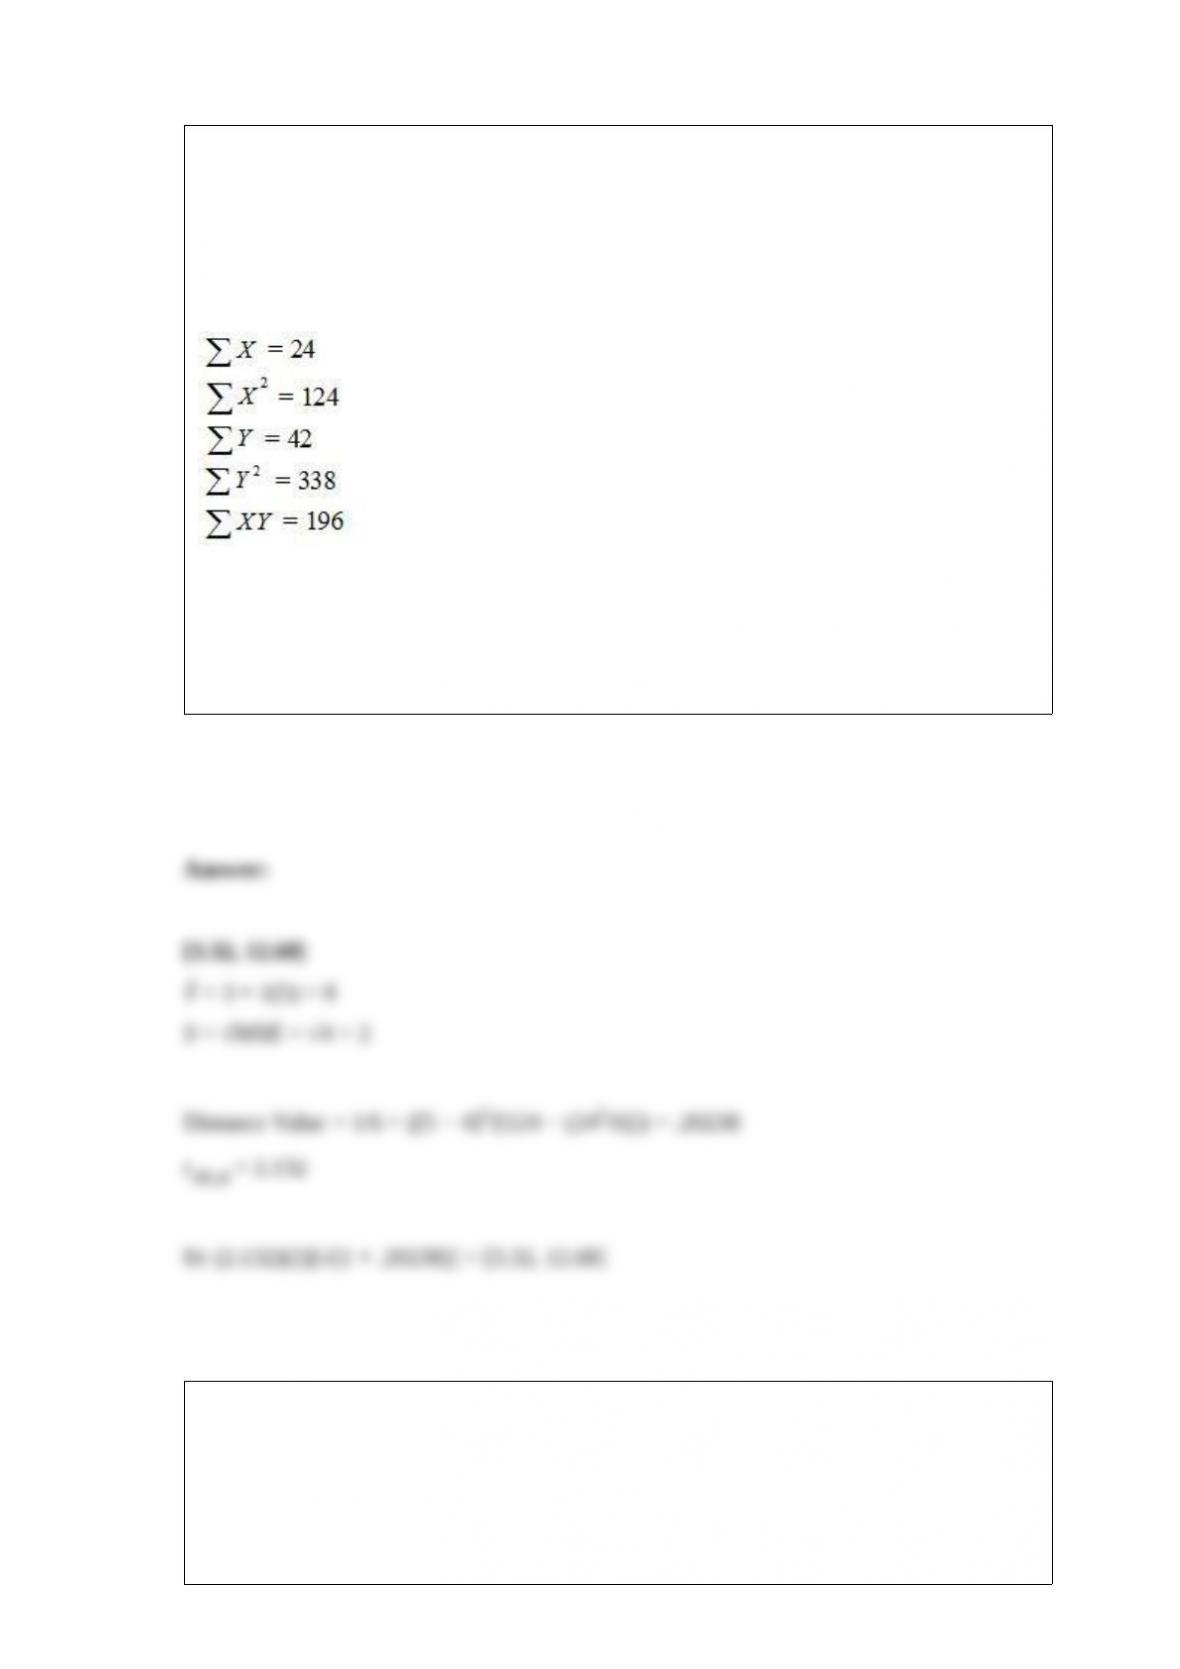
A local tire dealer wants to predict the number of tires sold each month. He believes
that the number of tires sold is a linear function of the amount of money invested in
advertising. He randomly selects 6 months of data consisting of tire sales (in thousands
of tires) and advertising expenditures (in thousands of dollars). Based on the data set
with 6 observations, the simple linear regression equation of the least squares line is ŷ =
3 + 1x.
MSE = 4
Using the sums of the squares given above, determine the 90 percent prediction interval
for tire sales in a month when the advertising expenditure is $5,000.
Consider the following partial analysis of variance table from a randomized block
design with 6 blocks and 4 treatments.
Source Sum of Squares
Treatments 15.93

Blocks 42.09
Error 23.84
Total 81.86
Consider an engine parts supplier, and suppose the supplier has determined that the
mean and variance of the population of all cylindrical engine part outside diameters
produced by the current machine are, respectively, 2.5 inches and .00075. To reduce this
variance, a new machine is designed. A random sample of 20 outside diameters
produced by this new machine has a sample mean of 2.5 inches and a variance of s2 = .
0002 (normal distribution). In order for a cylindrical engine part to give an engine long
life, the outside diameter must be between 2.43 and 2.57 inches. Using the upper end of
the 95 percent confidence interval for σ and assuming that μ = 2.5, determine whether
99.73 percent of the outside diameters produced by the new machine are within the
specification limits.
Find a 95 percent confidence interval for μ1 − μ2, where n1 = 15, n2 = 10, = 1.94,
= 1.04, s12 = .2025, and s22 = .0676. (Assume equal population variances.)
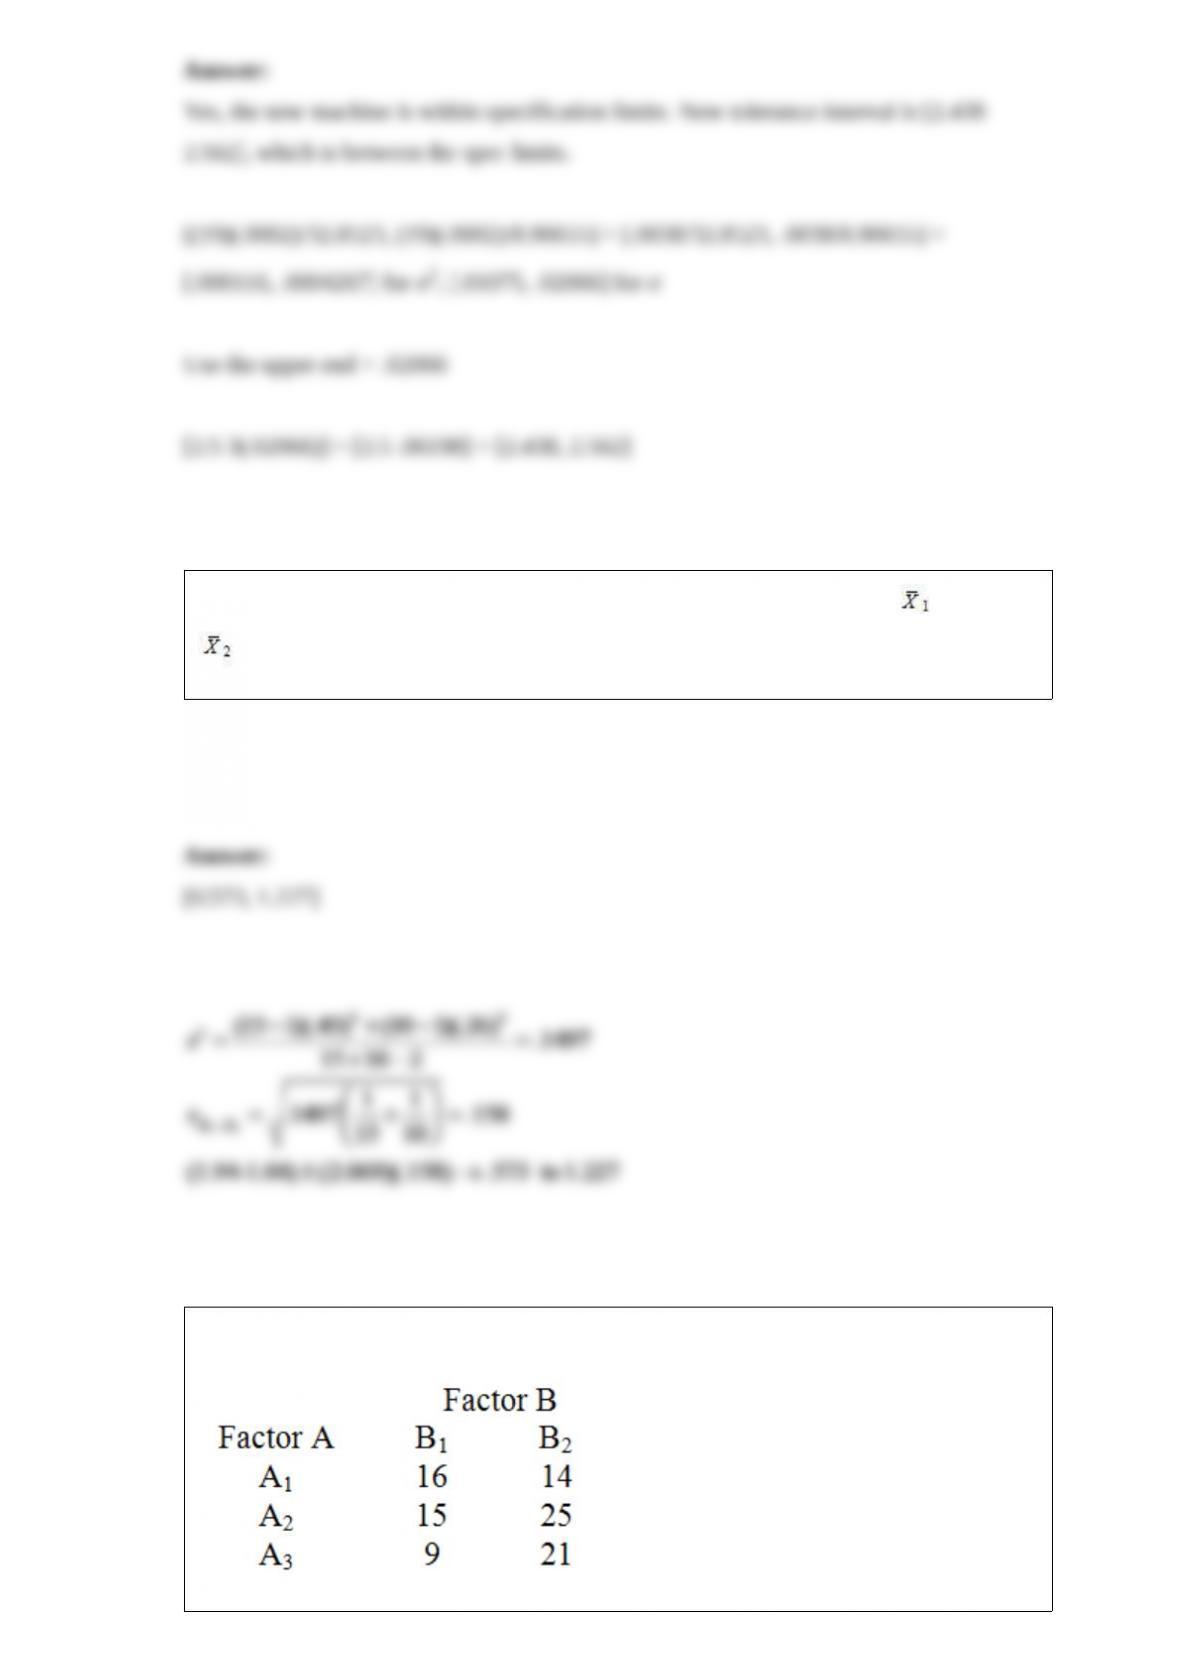
Consider the 3 x 2 contingency table below.

How many degrees of freedom are associated with the chi-square test?
Based on 30 time-ordered observations from a simple regression, we have determined
the Durbin-Watson statistic, d = 2.71. At α = .05, test to determine if there is any
evidence of negative autocorrelation. State your conclusions.
Failure to meet payments on student loans guaranteed by the US government has been a
major problem for both banks and the government. Approximately 50 percent of all
student loans guaranteed by the government are in default. A random sample of 350
loans to college students in one region of the United States indicates that 147 are in
default. Calculate the p-value associated with the test statistic, and , using the p-value
rule, test the hypothesis that the default rate for the selected region is lower than the
national percentage at α = .01.

Consider the 3 x 2 contingency table below.
Compute the expected frequencies in row 1.
Given the following data, compute the total error (sum of the error terms).
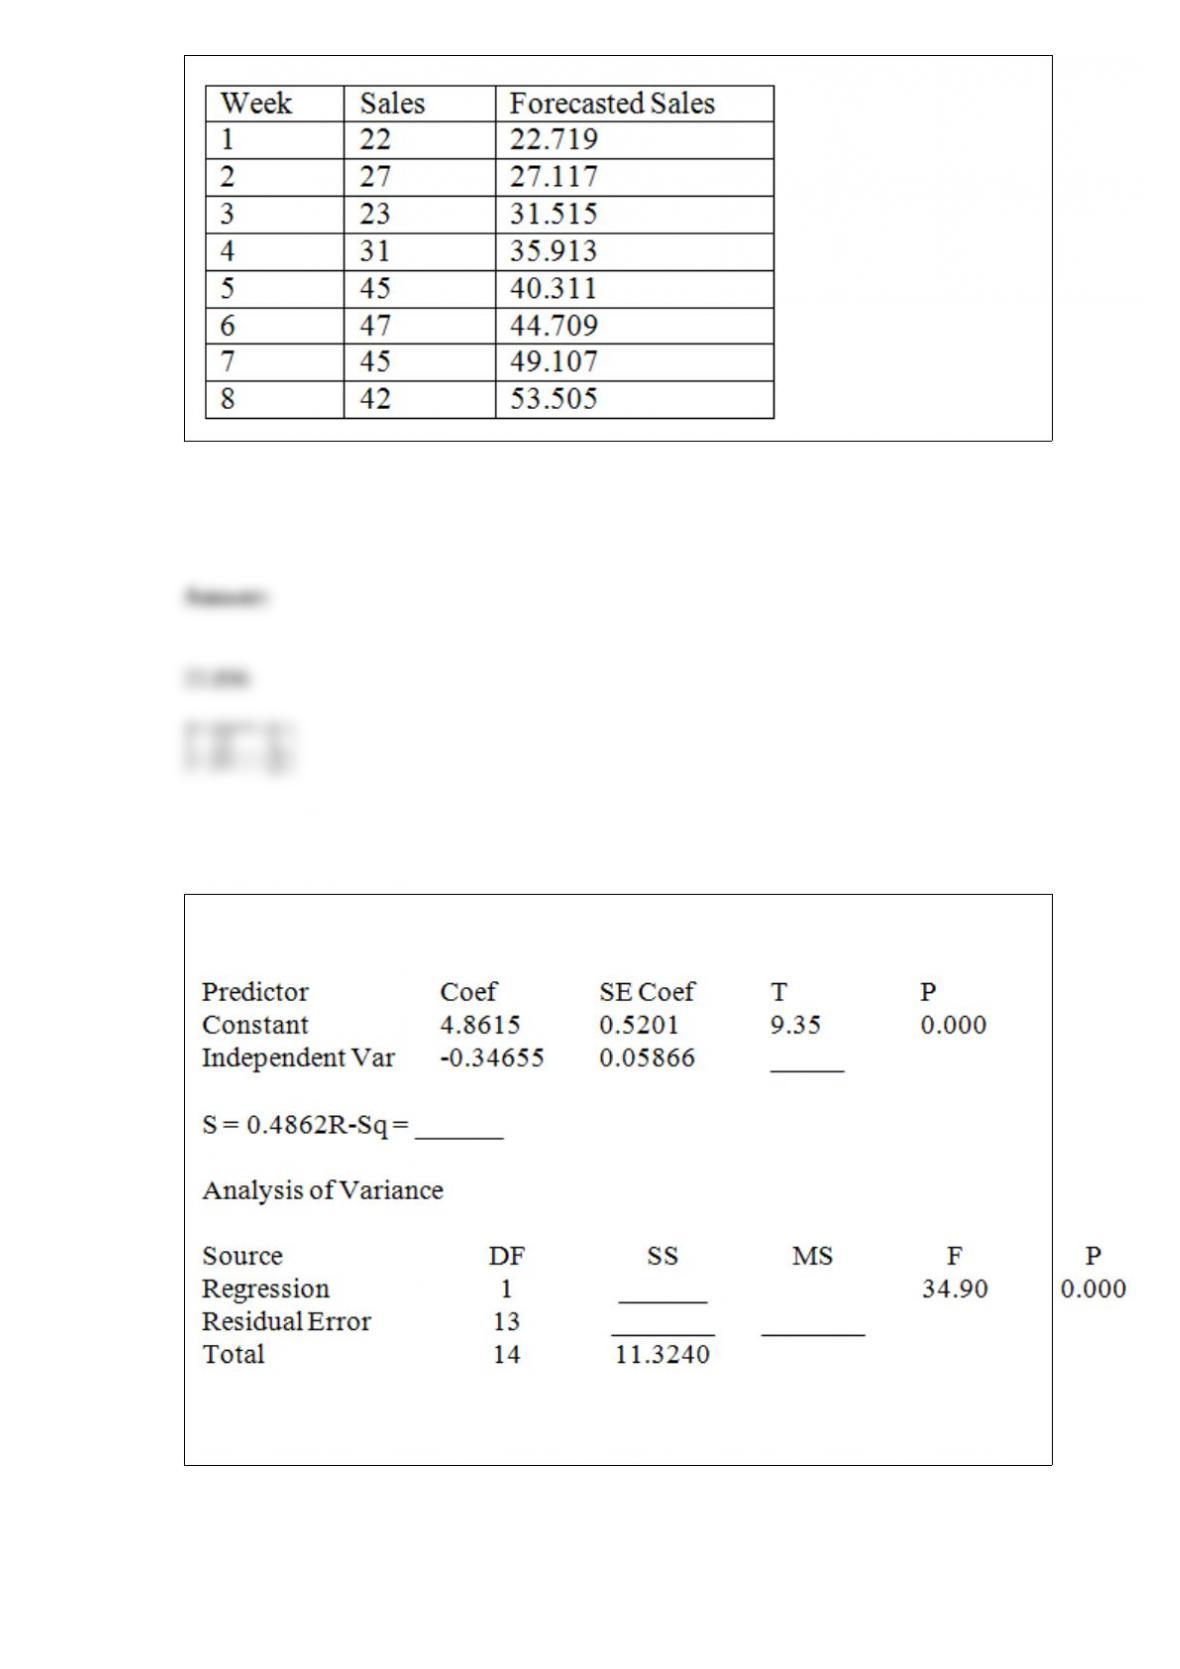
Consider the following partial computer output from a simple linear regression analysis.
What is the correlation coefficient?