
If a population is skewed, the point estimate will be pushed to the right or left of the
middle of the confidence interval estimate.
The Nationwide Motel Company has determined that 70 percent of all calls for motel
reservations request nonsmoking rooms. Recently, the customer service manager for the
company randomly selected 25 calls. Assuming that the distribution of calls requesting
nonsmoking rooms is described by a binomial distribution, the probability that fewer
than 5 customers will request smoking rooms is approximately 0.09.
A warehouse contains 5 parts made by the Stafford Company and 8 parts made by the
Wilson Company. If an employee selects 3 of the parts from the warehouse at random,
the probability that none of the 3 parts is from the Wilson Company is approximately .
03496.
If the point estimate in a paired difference estimation example does not fall in the
resulting confidence interval, the decision maker can conclude that the two populations
likely have different means.
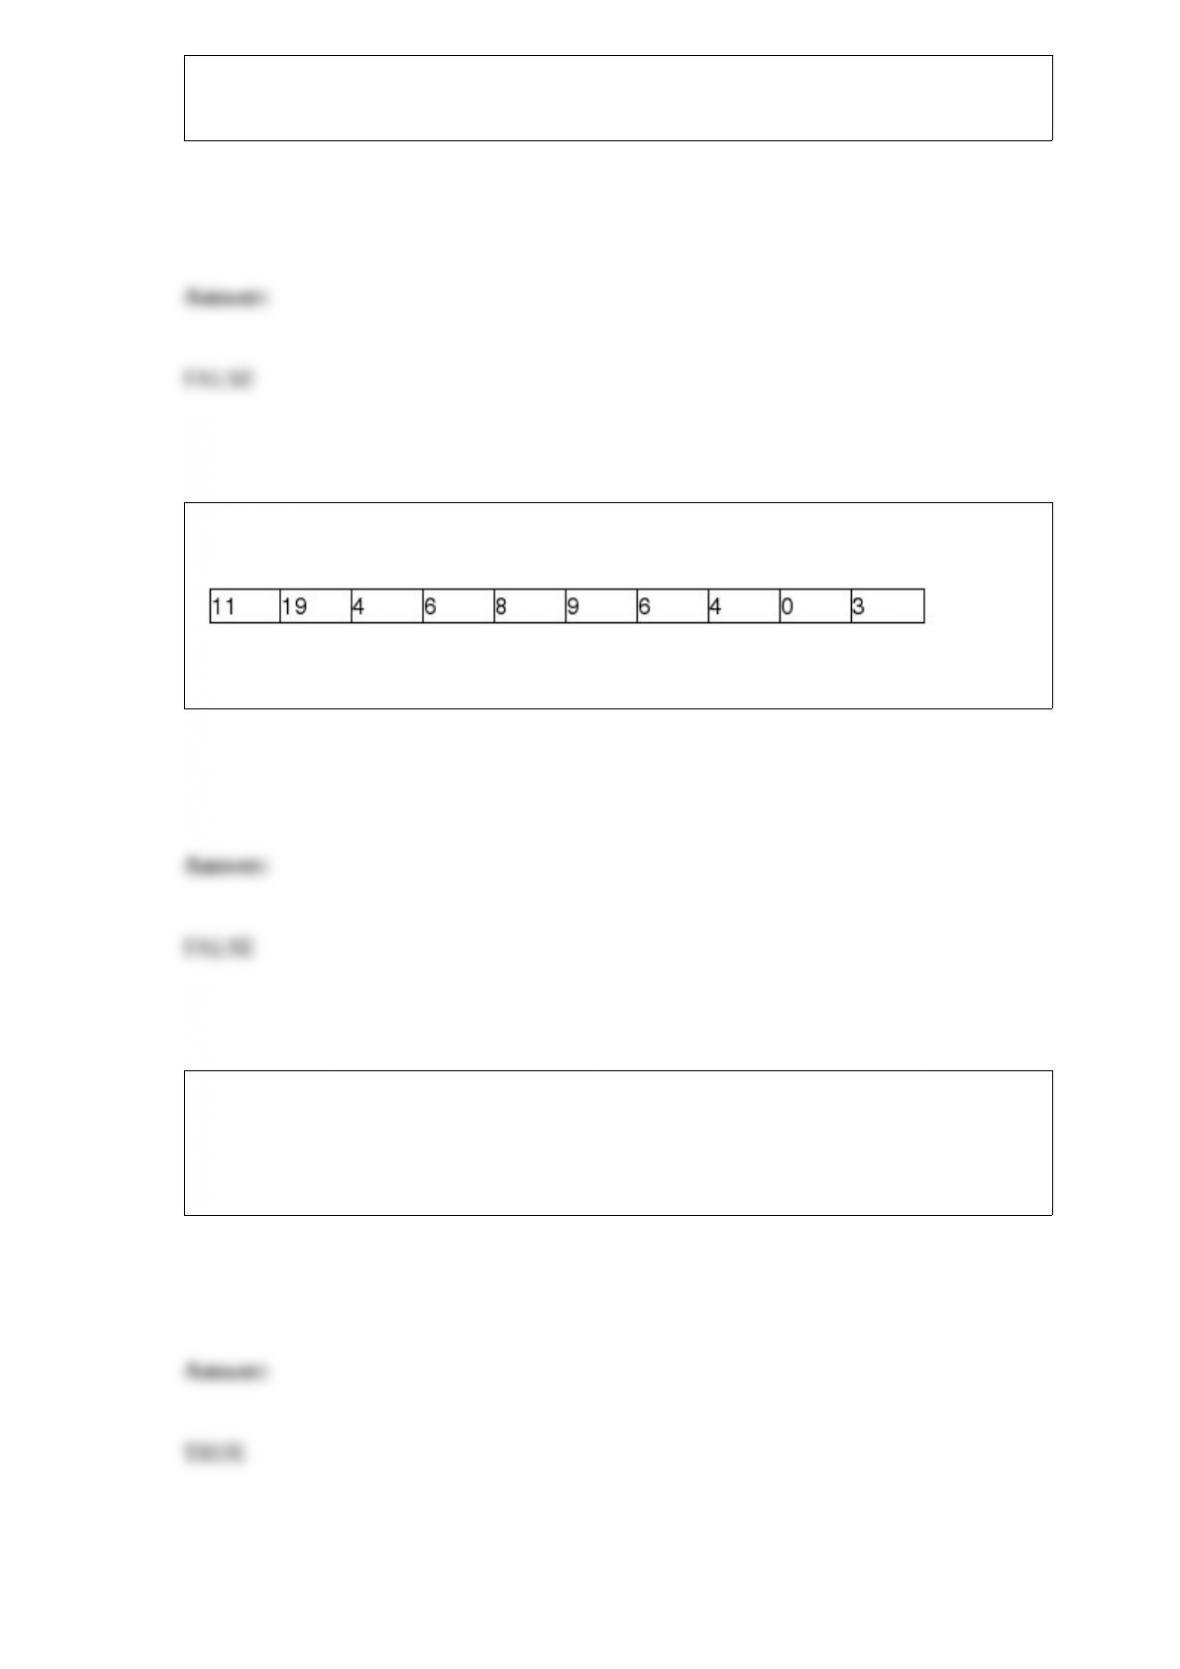
A store manager tracks the number of customer complaints each week. The following
data reflect a random sample of ten weeks.
The range for these data is 8.
The amount of drying time for the paint applied to a plastic component part is thought
to be uniformly distributed between 30 and 60 minutes. Currently, the automated
process selects the part from the drying bin after the part has been there for 50 minutes.
Based on this, the probability that a part selected will not be dry is approximately 0.33.
A light bulb manufacturer wants to advertise the average life of its light bulbs so it tests
a subset of light bulbs. This is an example of inferential statistics.
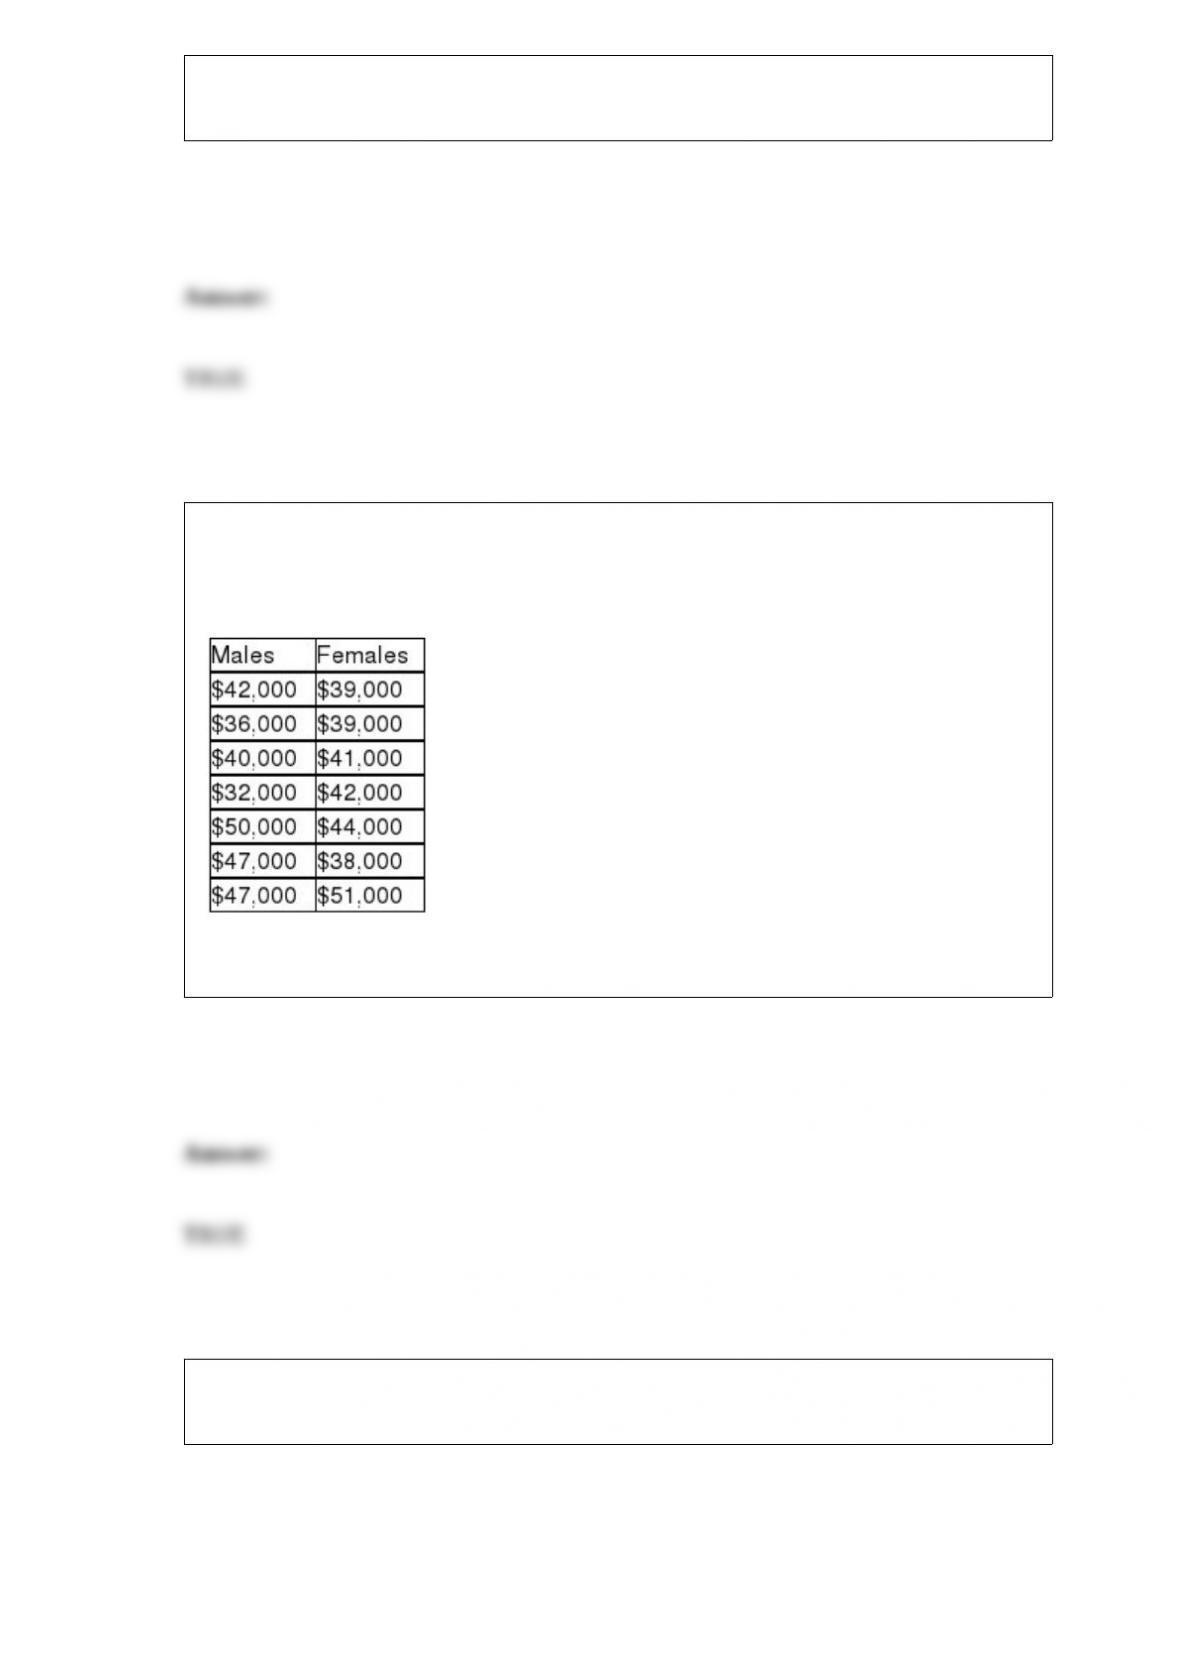
A claim was recently made that stated that the median income for male and female
graduates is the same for those graduating with a degree in operations management. The
following sample data were collected:
In employing the Mann-Whitney U test, the U test statistic is 25.5
A cell phone company wants to determine if the use of text messaging is independent of
age. The following data has been collected from a random sample of customers.
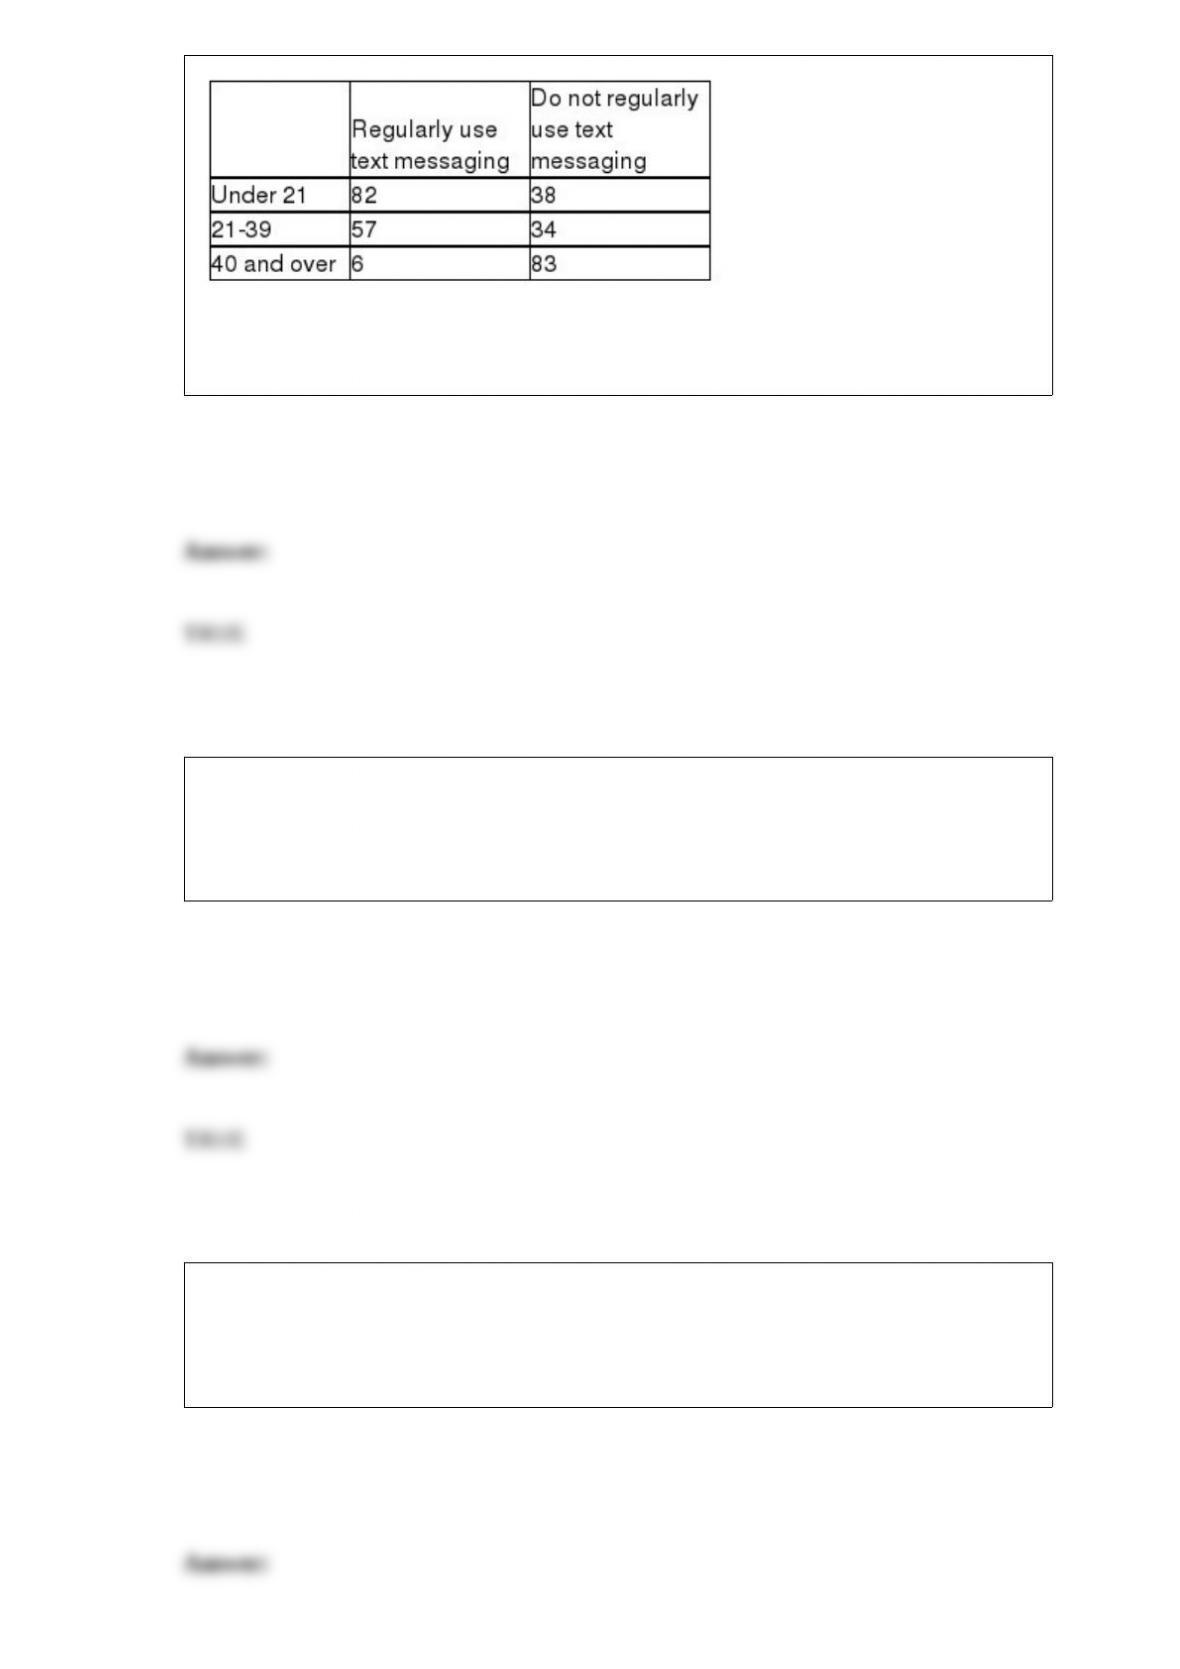
To conduct a test of independence, the difference expected value for the “40 and over
and regularly use text messaging” cell is just over 43 people.
In a forward selection stepwise regression process, the first variable to be selected will
be the variable that can, by itself, do the most to explain the variation in the dependent
variable. This will be the variable that provided the highest possible R-square value by
itself.
A chain of fast food restaurants wants to compare the average service times at three
different restaurants. It wants to conduct a hypothesis test to determine if all three
means are the same or not, at the 0.05 level of significance. If n = 7 observations are
taken at each of the three restaurants, the critical value is F = 3.555.
A company that is interested in determining which of three prices to charge for its
products has test marketed the product in three cities, each time using a different price
for the product. The number of products sold in the first week is recorded. In this case,
the data are considered to have been collected using an experiment.
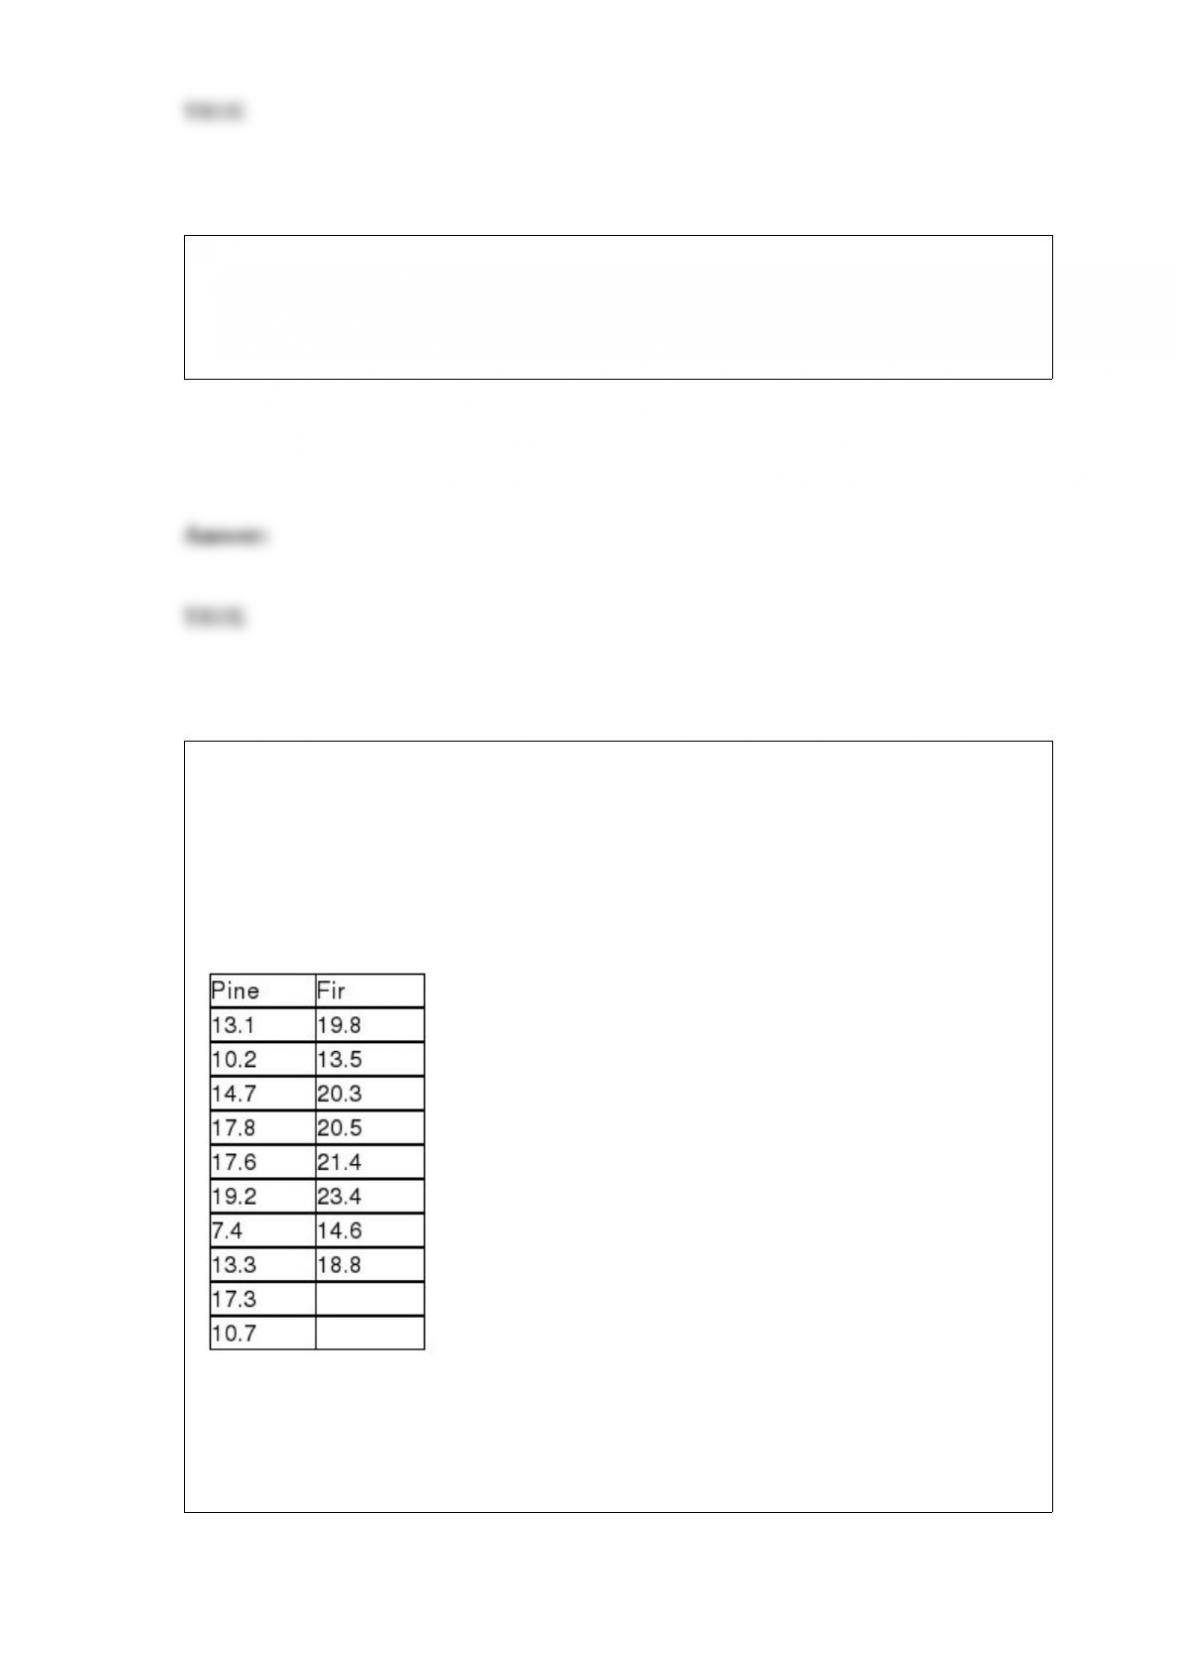
The Sergio Lumber Company manufactures plywood. One step in the process is the one
where the veneer is dried by passing through a huge dryer (similar to an oven) where
much of the moisture in the veneer is extracted. At the end of this step, samples of
veneer are tested for moisture content. It is believed that pine veneer will be less moist
on average than will fir veneer. The following data were reported recently where the
values represent the percent of moisture in the wood:
The null and alternative hypotheses to be tested are
H0 : μp ≥ μf
Ha : μp < μf
Consider the following regression equation: = 356 + 180x1 – 2.5x2. The x1 variable is
a quantitative variable and the x2 variable is a dummy with values 1 and 0. Given this,
we can interpret the slope coefficient on variable x2 as follows: Holding x1 constant, if
the value of x2 is changed from 0 to 1, the average value of y will decrease by 2.5 units.
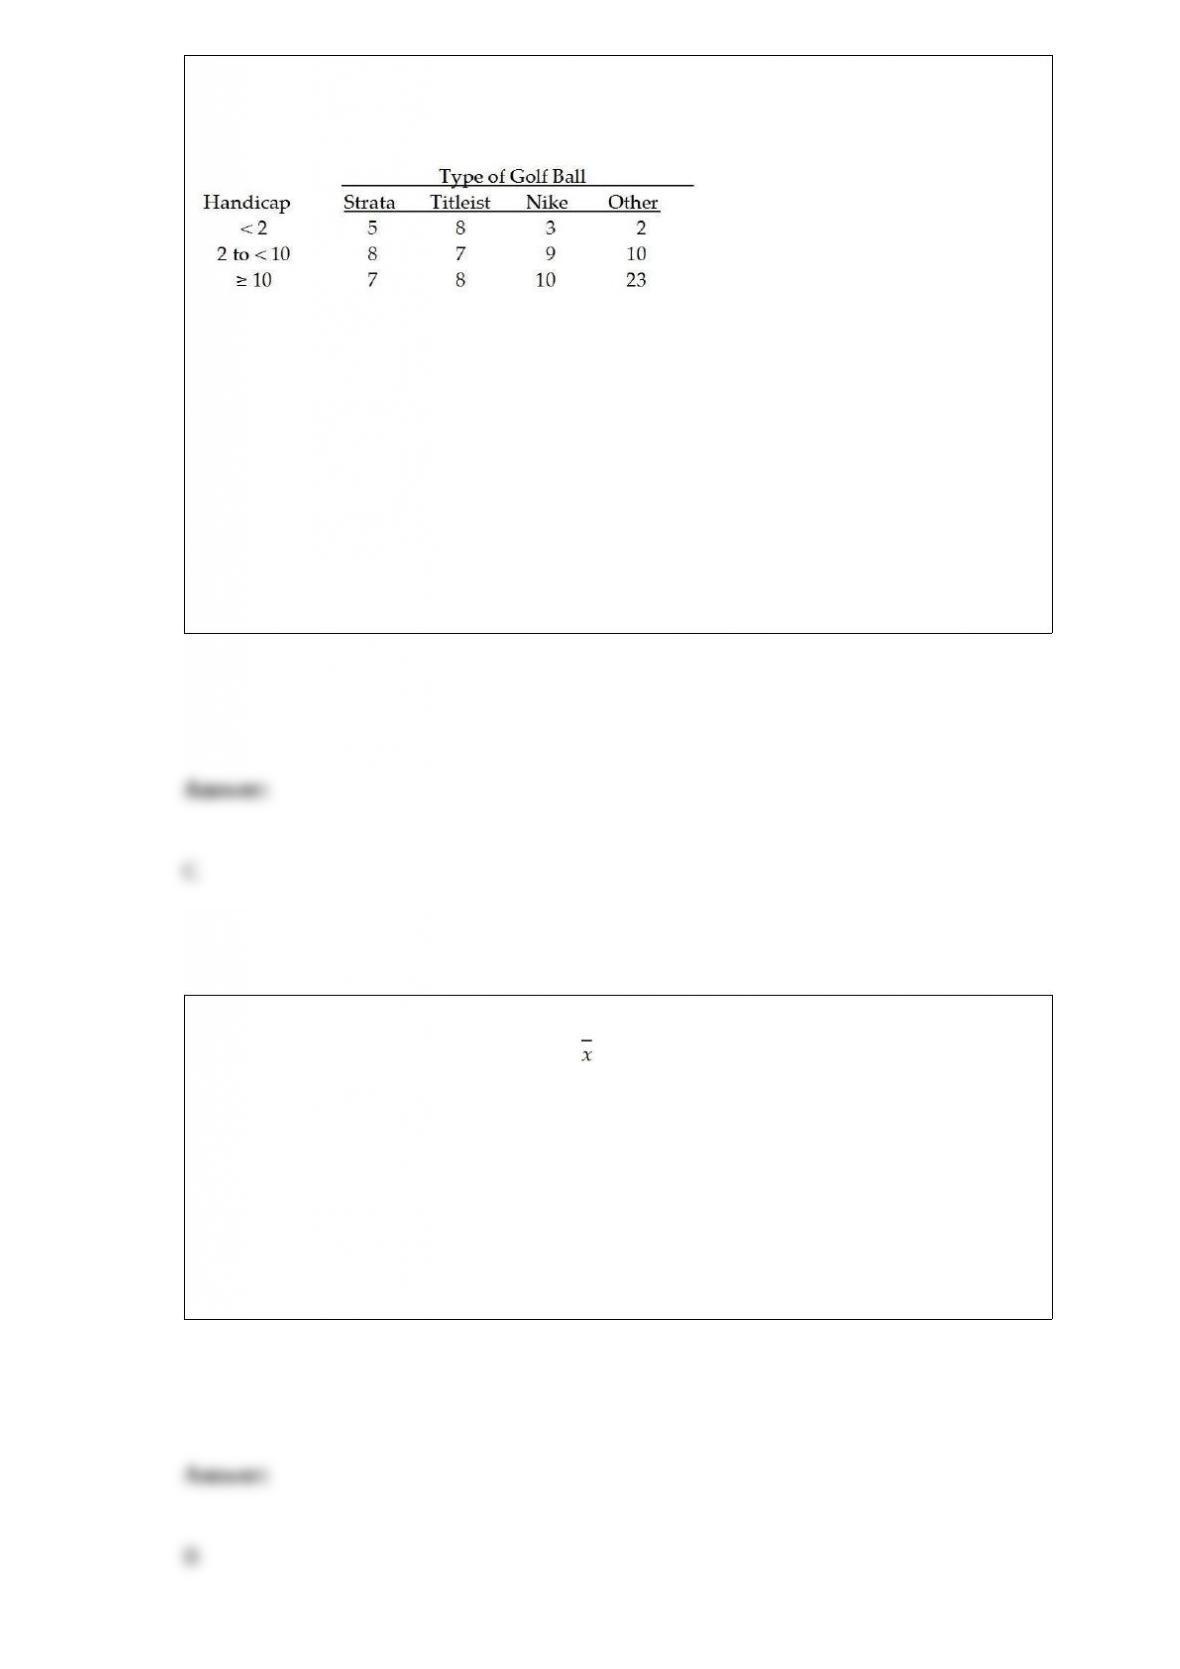
A major manufacturer of home electronics is interested in determining whether
customers have a preference between two new speaker designs for their home
entertainment centers. To test this, the design department manager has selected a
random sample of customers and shown them the first design. A second sample of
customers is shown design 2. The manager then asks each customer whether they prefer
the new design they were shown over the one they currently own. The following results
were observed:
Based on these data and a significance level equal to 0.05, the test statistic is
approximately -4.22 and thus the null hypothesis should be rejected.

If two variables are uncorrelated, the sample correlation coefficient will be r = 0.00.
The owner of a local gasoline station has kept track of the number of gallons of regular
unleaded sold at his station every day since he purchased the station. This morning, he
computed the mean number of gallons. This value would be considered a statistic.
A stem and leaf diagram is most similar to a bar chart.
One of the roles of managers who are overseeing the statistical process control analysis
is to set the control limits at the desired levels prior to collecting data from the process.

A process control chart can be used to determine whether the process average has
shifted up or down, but is not useful for determining whether the process is just drifting
in an upward or downward direction.
The Durbin-Watson test for autocorrelation can be reliably applied to any sample sizes.
The Hawkins Company randomly samples 10 items from every large batch before the
batch is packaged and shipped. According to the contract specifications, 5 percent of the
items shipped can be defective. If the inspectors find 1 or fewer defects in the sample of
10, they ship the batch without further inspection. If they find 2 or more, the entire
batch is inspected. Based on this sampling plan, the probability that a batch that meets
the contract requirements will be shipped without further inspection is approximately .
9139.

Suppose a professor collects survey data by passing out surveys in his/her classes,
where the population of interest is defined as all students enrolled at that university.
This is an example of nonstatistical sampling technique.
If two variables are graphed on the same line chart, two separate scales are always
required.
A manufacturing company makes three types of products. Each time it makes a product,
the item can be either good or defective and it can be either customized or standard. The
events consisting of customized and defective would be considered mutually exclusive
since they apply to different attributes of the product.

One way to reduce the margin of error in a confidence interval estimate is to lower the
level of confidence.
The Crystal Window Company makes windows at three locations: Reno, Las Vegas,
and Boise. Some windows made by the company contain a visible defect and must be
replaced. Each defect costs the company $45.00. The Reno plant makes 40 percent of
all windows while the Las Vegas and Boise plants split the remaining production
evenly. A recent quality study shows that 8 percent of the Reno windows contain a
defect, 11 percent of the Las Vegas windows contain a defect, while 4 percent of the
windows made in Boise have a defect. Once the windows are made, they are shipped to
a central warehouse where they are commingled and the location where they were made
is lost.
Based on this information, the percentage of the defective cost that should be allocated
to the Reno plant is approximately 42 percent.
A conclusion to “not reject” the null hypothesis is the same as the decision to “accept
the null hypothesis”.

The Good-Guys Car Dealership has tracked the number of used cars sold at its
downtown dealership. Consider the following data as representing the population of
cars sold in each of the 8 weeks that the dealership has been open.
The population variance is approximately 9.43.
The Cranston Hardware Company is interested in estimating the difference in the mean
purchase for men customers versus women customers. It wishes to estimate this
difference using a 95 percent confidence level. If the sample size is n = 10 from each
population, the samples are independent, and sample standard deviations are used, and
the variances are assumed equal, then the critical value will be t = 2.1009.
The roll of a pair of dice has the following probability distribution, where the random
variable is the sum of the values produced by each die:

Calculate the expected value of x.
A) 6
B) 7
C) 8
D) 9
Assume that a Kruskal-Wallis test is being conducted to determine whether or not the
medians of three populations are equal. The sum of rankings and the sample size for
each group are below.
What is the critical value for this test using a 0.10 level of significance?
A) 6.2514

B) 5.9915
C) 7.8147
D) 4.6052
Assume P(A) = 0.6, P(B) = 0.7, and P(A and B) = 0.42, which means that events A and
B are independent of each other.
Assume you are conducting a two-tailed Mann-Whitney U test for a small sample and
have found that U1 = 58 and U2 = 86. What is the value of the test statistic?
A) 58
B) 86
C) 72
D) 144

Assume that a medical research study found a correlation of -0.73 between
consumption of vitamin A and the cancer rate of a particular type of cancer. This could
be interpreted to mean:
A) the more vitamin A consumed, the lower a person’s chances are of getting this type
of cancer.
B) the less vitamin A consumed, the lower a person’s chances are of getting this type of
cancer.
C) the more vitamin A consumed, the higher a person’s chances are of getting this type
of cancer.
D) vitamin A causes this type of cancer.
For the normal distribution with parameters μ = 3, σ = 2; calculate P(0 < x < 8).
A) 0.3124
B) 0.9270
C) 0.8123
D) 0.6723

Respond to the following questions using this partially completed one-way ANOVA
table:
Based on the analysis of variance F-test, what conclusion should be reached regarding
the null hypothesis? Test using alpha = 0.05.
A) Since 11.1309 > 2.9467 accept H0 and conclude that all population means are the
same.
B) Since 2.9467 > 11.1309 accept H0 and conclude that all population means are the
same.
C) Since 11.1309 > 2.9467 reject H0 and conclude that at least two populations means
are different.
D) Since 2.9467 > 11.1309 reject H0 and conclude that at least two populations means
are different.
Dynamic random-access memory (DRAM) memory chips are made from silicon wafers
in manufacturing facilities through a very complex process called wafer fabs. The
wafers are routed through the fab machines in an order that is referred to as a recipe.
The wafers may go through the same machine several times as the chip is created. The
data file DRAM Chips contains a sample of processing times, measured in fractions of
hours, at a particular machine center for one chip recipe.
Determine what the mode processing time is.
A) 0.22
B) 0.24

C) 0.33
D) 0.34
The Jack In The Box franchise in Bangor, Maine, has determined that the chance a
customer will order a soft drink is 0.90. The probability that a customer will order a
hamburger is 0.60. The probability that a customer will order french fries is 0.50.
The restaurant has also determined that if a customer orders a hamburger, the
probability the customer will also order fries is 0.80. Determine the probability that the
order will include a hamburger and fries.
A) 0.45
B) 0.58
C) 0.68
D) 0.48
The following data reflect the number of customers who test drove new cars each day
for a sample of 20 days at the Redfield Ford Dealership.

Given these data, what is the interquartile range?
A) 3
B) 7
C) 4
D) 14
One of the key differences between a bar chart and histogram is:
A) the histogram contains gaps between the bars and the bar chart does not.
B) a bar chart is used to display a categorical variable and a histogram is used to display
the distribution of a quantitative variable.
C) the histogram shows relative frequency while the bar chart shows frequency.
D) the bar chart must be vertical while the histogram must be horizontal.
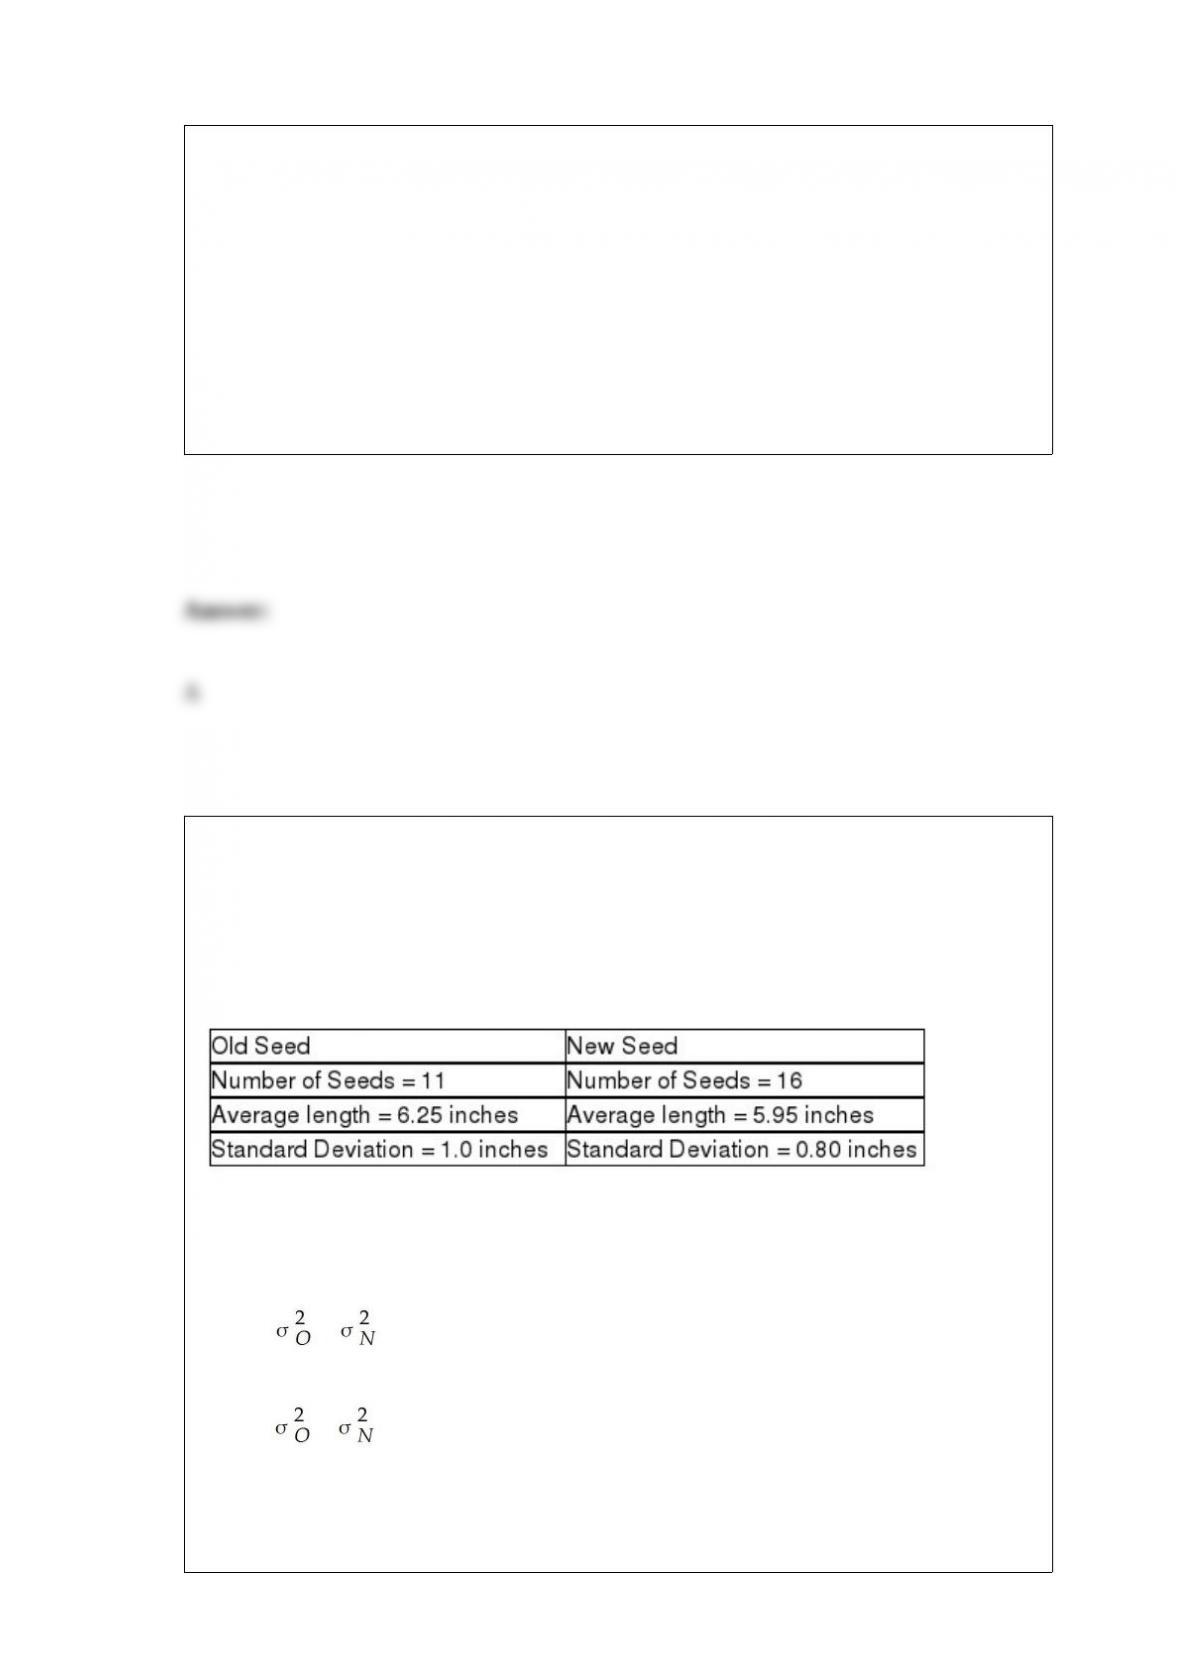
The managers of a local golf course have recently conducted a study of the types of golf
balls used by golfers based on handicap. A joint frequency table for the 100 golfers
covered in the survey is shown below:
If a player comes to the course using a Nike golf ball, the probability that he or she has
a handicap of at least 10 is:
A) 0.22
B) 0.48
C) slightly greater than 0.45
D) 0.10
Determine the 90% confidence interval estimate for the population mean of a normal
distribution given n = 100, σ = 121, and = 1,200.
A) (1186.31, 1213.69)
B) (1180.10, 1219.90)
C) (1182.56, 1217.44)
D) (1191.12, 1208.88)

For the following z-test statistic, compute the p-value assuming that the hypothesis test
is a one-tailed test: z = -1.55.
A) 0.0606
B) 0.1512
C) 0.0901
D) 0.0172
Assume that the year 2000 is used as the index base period and that sales were 12
million in the year 2000. If sales were 18 million in the year 2006, the simple index
number for the year 2006 is:
A) 1.5
B) 6 million
C) 150
D) 0.666
Madam Helga claims to be psychic. A national TV talk personality plans to test her in a
live TV broadcast. The process will entail asking Madam Helga a series of 20

independent questions with yes/no answers. The questions would be of the nature that
she could not have any way of knowing the answer from prior knowledge. She will be
considered psychic if she correctly answers more than a specified number (called the
cut-off) of the questions. The cut-off must be set so that the chance of guessing that
number or more is no greater than 5 percent. The cut-off value should be:
A) 12
B) 14
C) 10
D) Can’t be determined without more information.
The proportion of items in a population that possess a specific attribute is known to be
0.70. If a simple random sample of size n = 100 is selected and the proportion of items
in the sample that contain the attribute of interest is 0.65, what is the sampling error?
A) -0.03
B) -0.05
C) 0.08
D) 0.01
A study was recently conducted to estimate the mean cholesterol for adult males over

the age of 55 years. From a random sample of n = 10 men, the sample mean was found
to be 242.6 and the sample standard deviation was 73.33. To find the 95 percent
confidence interval estimate for the mean, the correct critical value to use is:
A) 1.96
B) 2.2281
C) 2.33
D) 2.2622
A lube and oil change business believes that the number of cars that arrive for service is
the same each day of the week. If the business is open six days a week (Monday –
Saturday) and a random sample of n = 200 customers is selected, the sum of the
expected frequencies over the six days cannot be determined without seeing the actual
sample data.
A college data base includes the number of people who are enrolled in each class the
college offers. This is an example of:
A) nominal data.
B) ordinal data.
C) interval data.

D) ratio data.
In testing a hypothesis, statements for the null and alternative hypotheses as well as the
selection of the level of significance should precede the collection and examination of
the data.
The managers at Harris Pizza in Boston have tracked the tips received by their drivers
along with the total bill to the customer. An appropriate graph for analyzing the
relationship between these two variables is:
A) a scatter diagram.
B) a line chart.
C) a histogram.
D) a pie chart.
For a standardized normal distribution, determine a value, say z0, so that P(z > z0) =
0.025.
A) 1.96
B) 1.65
C) 1.24
D) 2.14
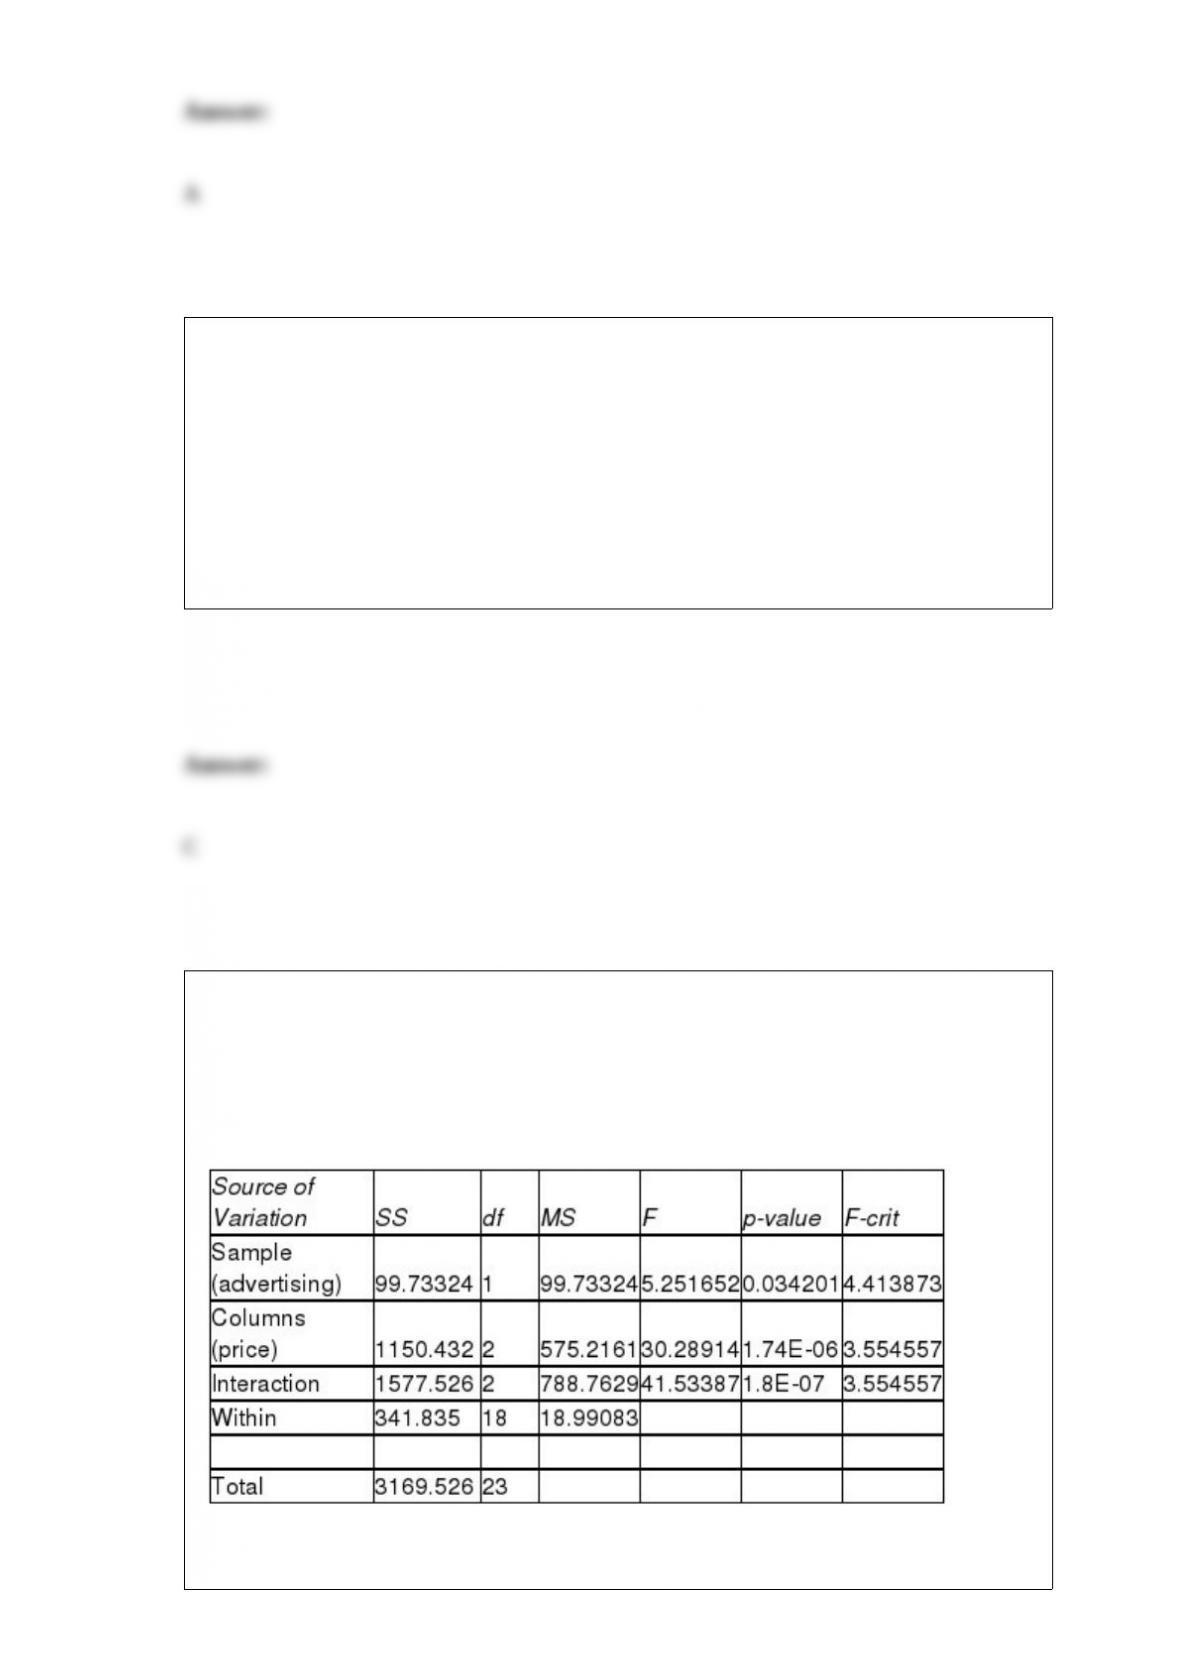
The Russet Potato Company has been working on the development of a new potato
seed that is hoped to be an improvement over the existing seed that is being used.
Specifically, the company hopes that the new seed will result in less variability in
individual potato length than the existing seed without reducing the mean length. To test
whether this is the case, a sample of each seed is used to grow potatoes to maturity. The
following information is given:
The correct null hypothesis for testing whether the variability of the new seed is less
than the old seed is:
A) H0 : ≤
B) H0 : ≥
C) H0 : σO ≥ σN

D) H0 : =
In a two-tailed hypothesis test for a population mean, an increase in the sample size
will:
A) have no effect on whether the null hypothesis is true or false.
B) have no effect on the significance level for the test.
C) result in a sampling distribution that has less variability.
D) All of the above are true.
Consider a random variable, z, that has a standardized normal distribution. Determine
P(z > -1).
A) 0.8413
B) 0.1251
C) 0.1512
D) 0.2124
Which of the following is an example of graphs used to describe data?
A) Histograms
B) Bar charts
C) Both A and B are correct.
D) None of the above.
A two-factor analysis of variance is conducted to test the effect that price and
advertising have on sales of a particular brand of bottled water. Each week a
combination of particular levels of price and advertising are used and the sales amount
is recorded. The computer results are shown below.
ANOVA
Based on the results above and a 0.05 level of significance, which of the following is

correct?
A) There is no interaction between price and advertising, so results for individual
factors may be misleading.
B) There is interaction between price and advertising, so the above results for individual
factors may be misleading.
C) There is no interaction between price and advertising, and both factors significantly
affect sales.
D) There is interaction between price and advertising, so the above results conclusively
show that both factors affect price.
Examine the following two-factor analysis of variance table:
Determine if the levels of factor A have equal means. Use a significance level of 0.05.
A) Fail to reject H0. Conclude that there is sufficient evidence to indicate that at least
two levels of Factor A have different mean responses.
B) Fail to reject H0. Conclude that there is not sufficient evidence to indicate that at
least two levels of Factor A have different mean responses.
C) Reject H0. Conclude that there is sufficient evidence to indicate that at least two
levels of Factor A have different mean responses.
D) Reject H0. Conclude that there is not sufficient evidence to indicate that at least two
levels of Factor A have different mean responses.

A researcher is using a chi-square test to determine whether there are any preferences
among 4 brands of orange juice. With alpha = 0.05 and n = 30, the critical region for the
hypothesis test would have a boundary of:
A) 7.81
B) 8.71
C) 8.17
D) 42.25