
When using best subsets regression, select the subset with the lowest adjusted
and lowest standard error.
Continuous data are values based on observations that can be counted and are typically
represented by whole numbers.
The sample covariance measures the strength of the linear relationship between two
variables.
Normalized seasonal factorsareseasonal factors that are adjusted so they add up to a
number very close to 1.0.

The point estimate may not equal the true population mean because of the presence of
sampling error.
The event “the first customer in the store today will be a female” is an example of a
simple event.
The mean is a convenient measurement for summarizing a data set with a single value.

The test statistic that is used to test the variance of a single population follows the
normal probability distribution.
In a two-way ANOVA procedure, the results of the hypothesis test for Factor A and
Factor B are only reliable when the hypothesis test for the interaction of Factors A and
B is statistically insignificant.
The mean square regression is found by dividing the sum of squares regression by the
number of independent variables minus one (k ” 1).
The expected value with sample information(EVwSI) represents the expected long-term
payoff of making decisions using sample information.

The average age of the MBA students in a particular statistics class is 30.7 years old.
The ages of five randomly selected students from this class are: 36, 25, 25, 29, and 30.
The sampling error for this sample is -1.7 years.
The power curve plots the power values of a hypothesis test over a range of
corresponding sample means.
The newsvendor problem is a dilemma about how much of a product should be
produced when the product has a long lifecycle and the demand for it is certain.

The margin of error can be reduced by reducing the size of the sample.
A correlation coefficient of -0.80 is an indication of a weak negative relationship
between two variables.
When the population standard deviation is unknown, we substitute the sample standard
deviation in its place to calculate confidence intervals.
The standard error of the proportion measures the average variation around the mean of
the sample proportions taken from the population.

The left and right ends of the normal probability distribution extend indefinitely, never
quite touching the horizontal axis.
The closer the residuals are to zero, the better the fit of the regression model.
The values of the coefficient of determination range between -1.0 and +1.0.

The hypothesis statement H: μ = 25 is an example of an alternative hypothesis.
The standard deviation of the continuous uniform distribution is equal to the mean of
this distribution.
The line that best fits the ordered pairs using the least squares method is called the
residual line.
The cumulative percentage polygon is a line graph that plots the cumulative relative
frequency distribution.
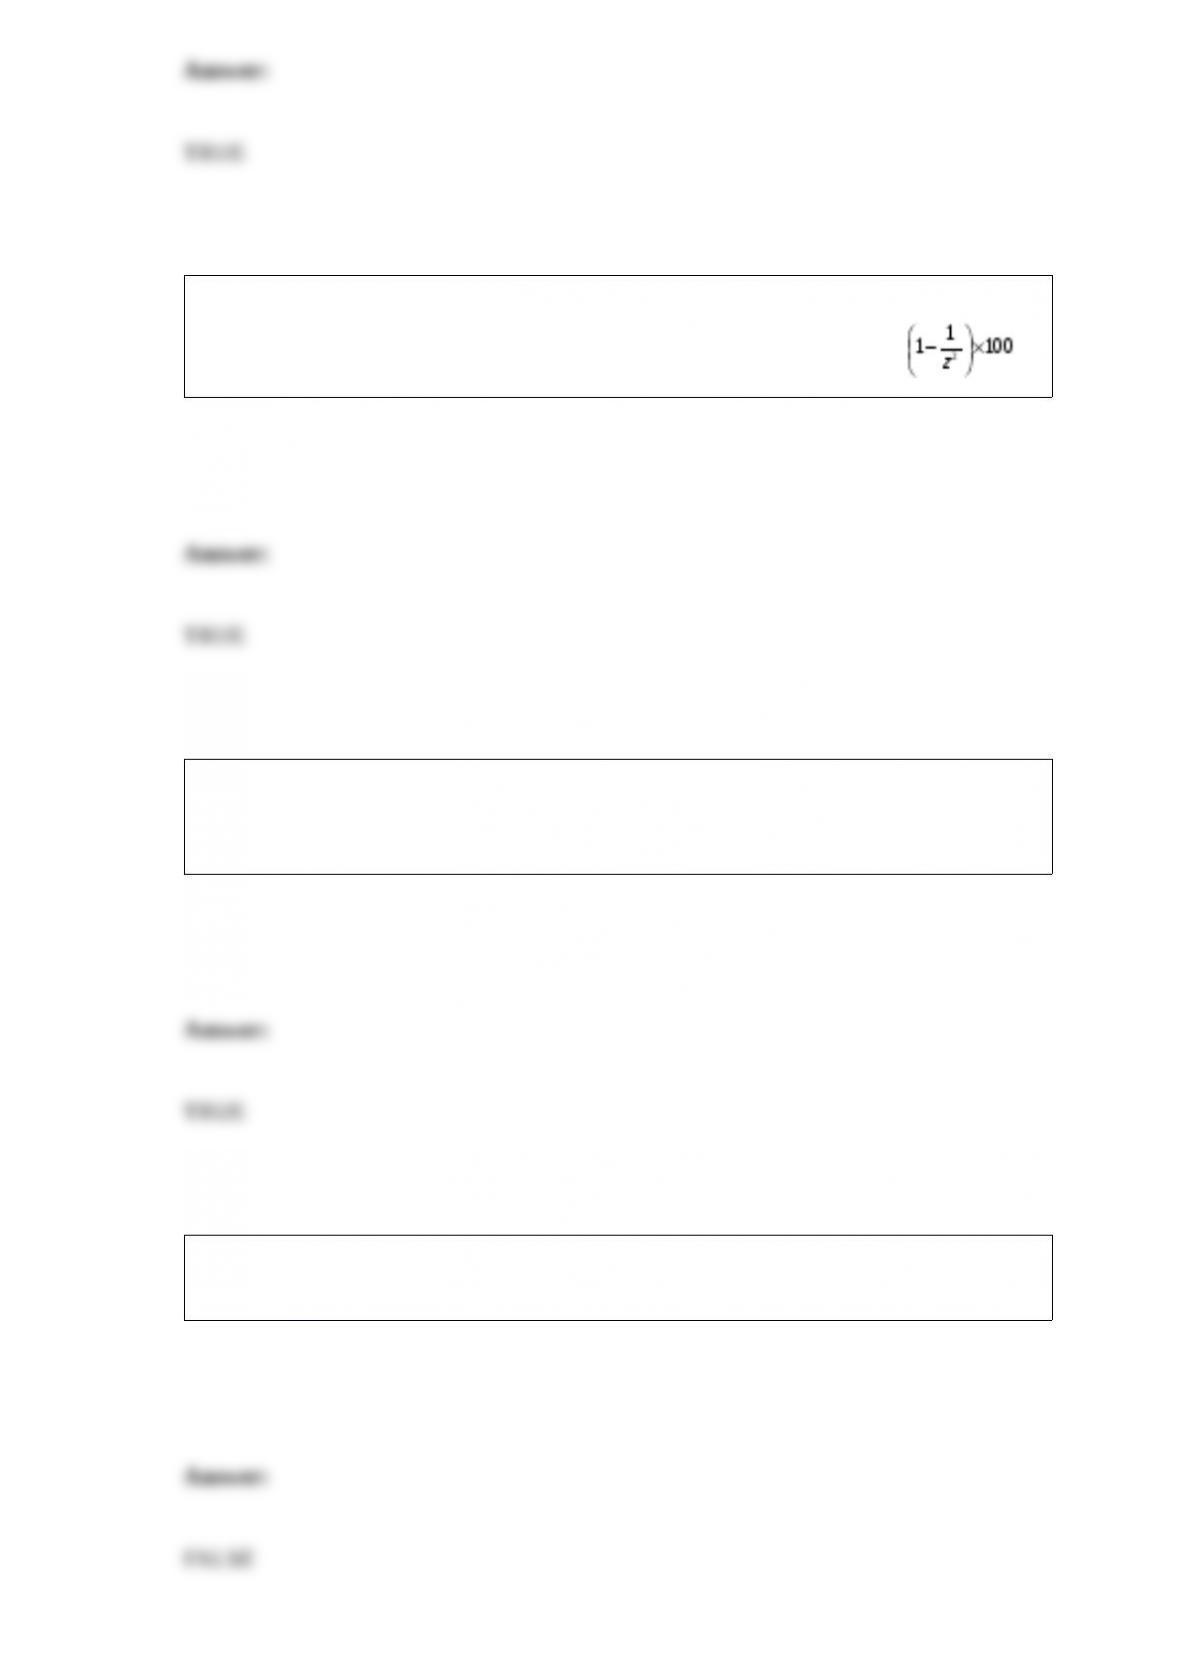
Chebyshev’s Theorem states that for any number z greater than 1, the percent of the
values that fall within z standard deviations from the mean will be at least .
If the null hypothesis for the Wilcoxon rank-sum test is not true, the distributions for the
two populations are different from one another which should result in the rank-sum of
one sample being relatively smaller than the other.
With qualitative forecasting, historical data and math are used to predict future
conditions.
To observe a seasonal component in a time series, data needs to be collected more
frequently than on an annual basis.
For two-way ANOVA, we partition the total sum of squares (SST) into the sum of
squares for Factor A (SSFA), the sum of squares for Factor B (SSFB), the sum of squares
interaction (SSAB), and the sum of squares error (SSE).
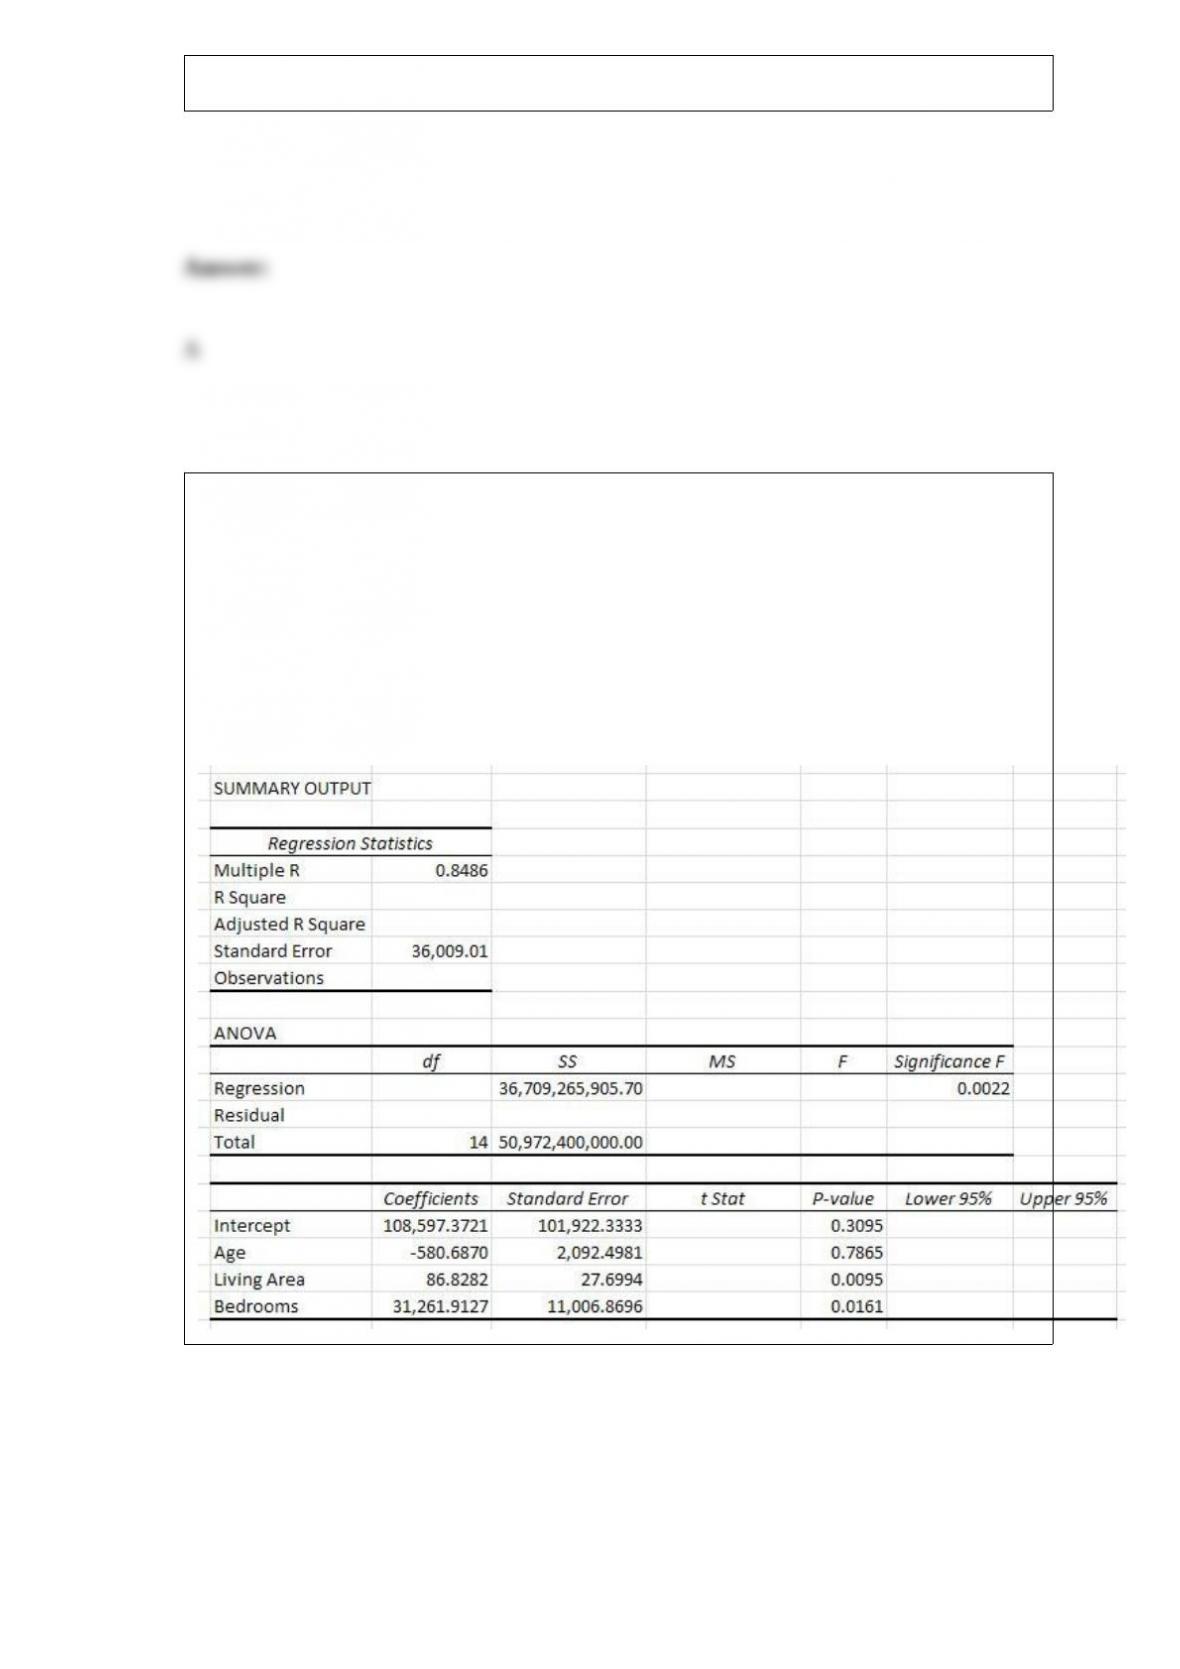
The Canadian government would like to test the hypothesis that the standard deviation
for the hourly wage for men is equal to the standard deviation for the hourly wage for
women. The following data summarizes the sample statistics for hourly wages for men
and women.
The degrees of freedom for the critical value for Population 1 would be ________.
A) 24
B) 25
C) 26
D) 27
Use the following information to answer the question(s) below.
A home appraisal company would like to develop a regression model that would predict
the selling price of a house based on the age of the house in years (Age), the living area
of the house in square feet (Living Area) and the number of bedrooms (Bedrooms). The
following Excel output shows the partially completed regression output from a random
sample of homes that have recently sold.
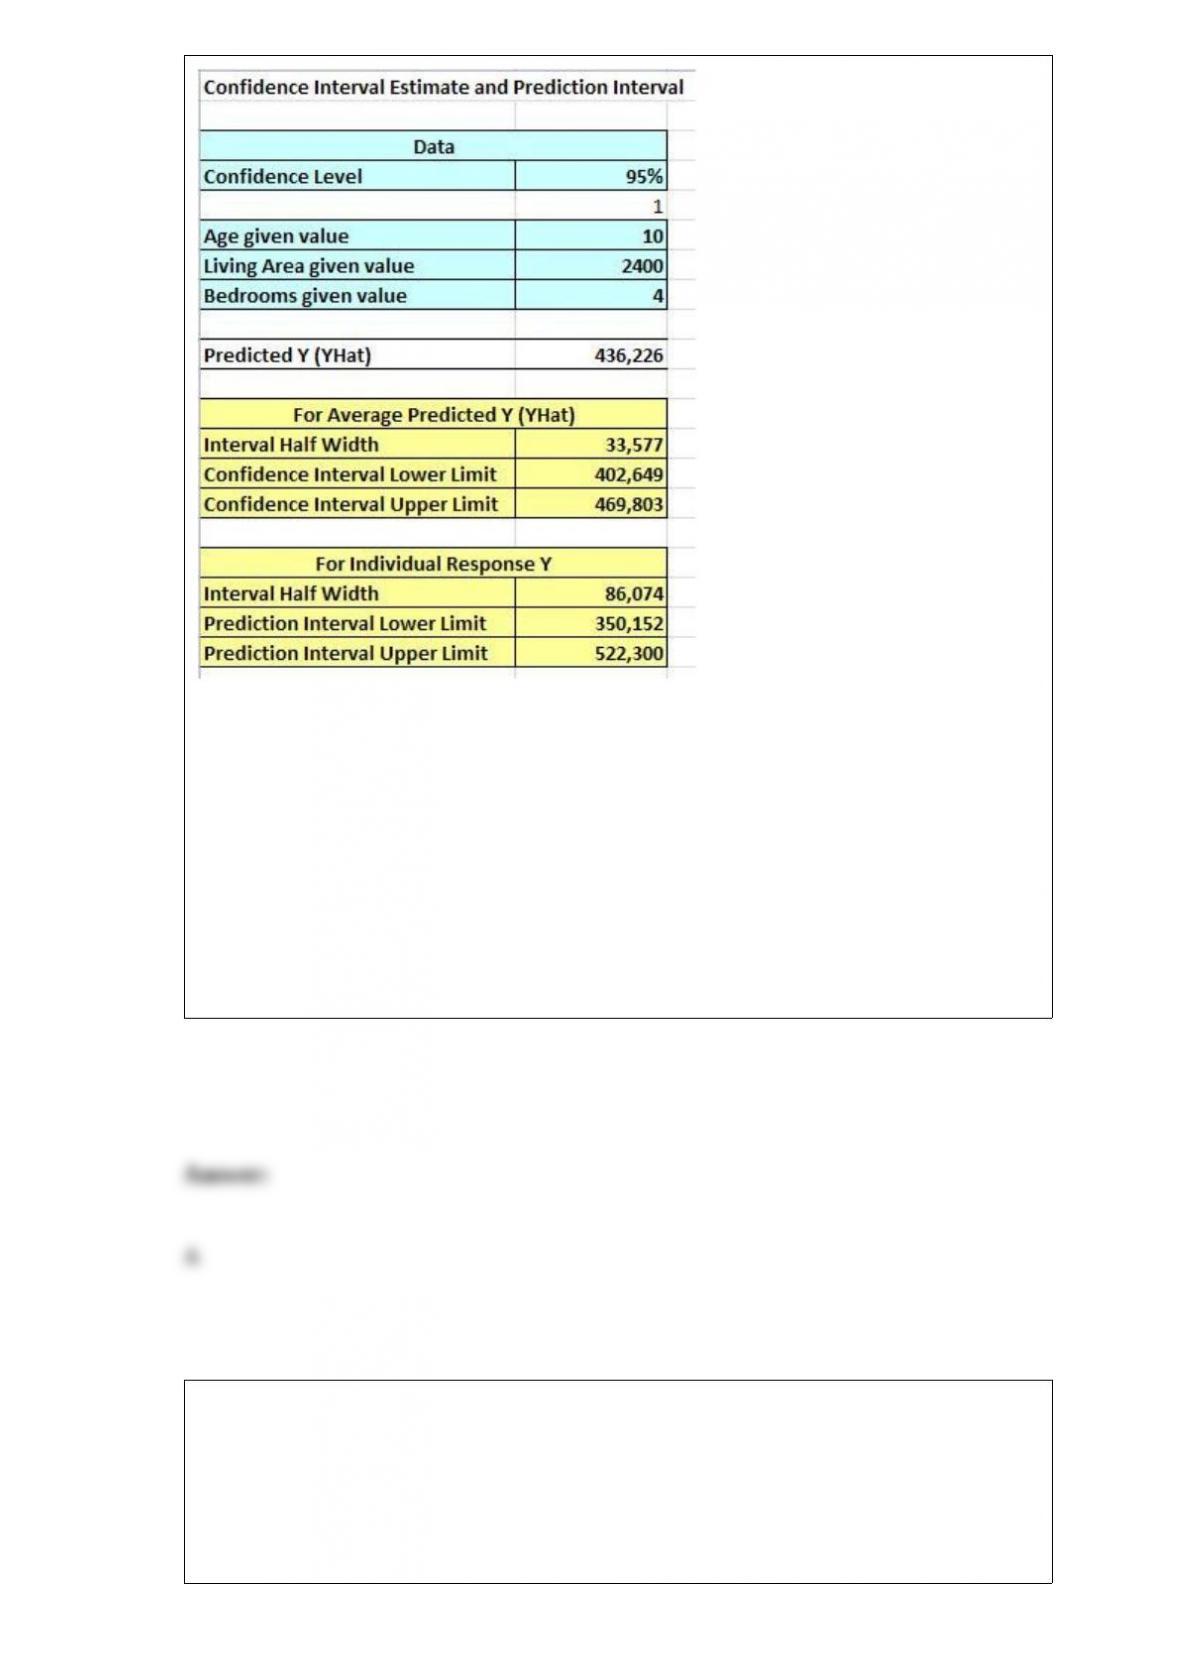
The critical value for the hypothesis test for the overall regression model using α = 0.05
is ________.
A) 3.587
B) 3.708
C) 3.982
D) 8.763
Which of the following is not a condition of a discrete probability distribution?
A) Each outcome in the distribution needs to be mutually exclusive with other
outcomes in the distribution.
B) The probability of a success must exceed the probability of a failure.
C) The probability of each outcome, P(x), must be between 0 and 1 (inclusive).
D) The sum of the probabilities for all the outcomes in the distribution needs to add up
to 1.
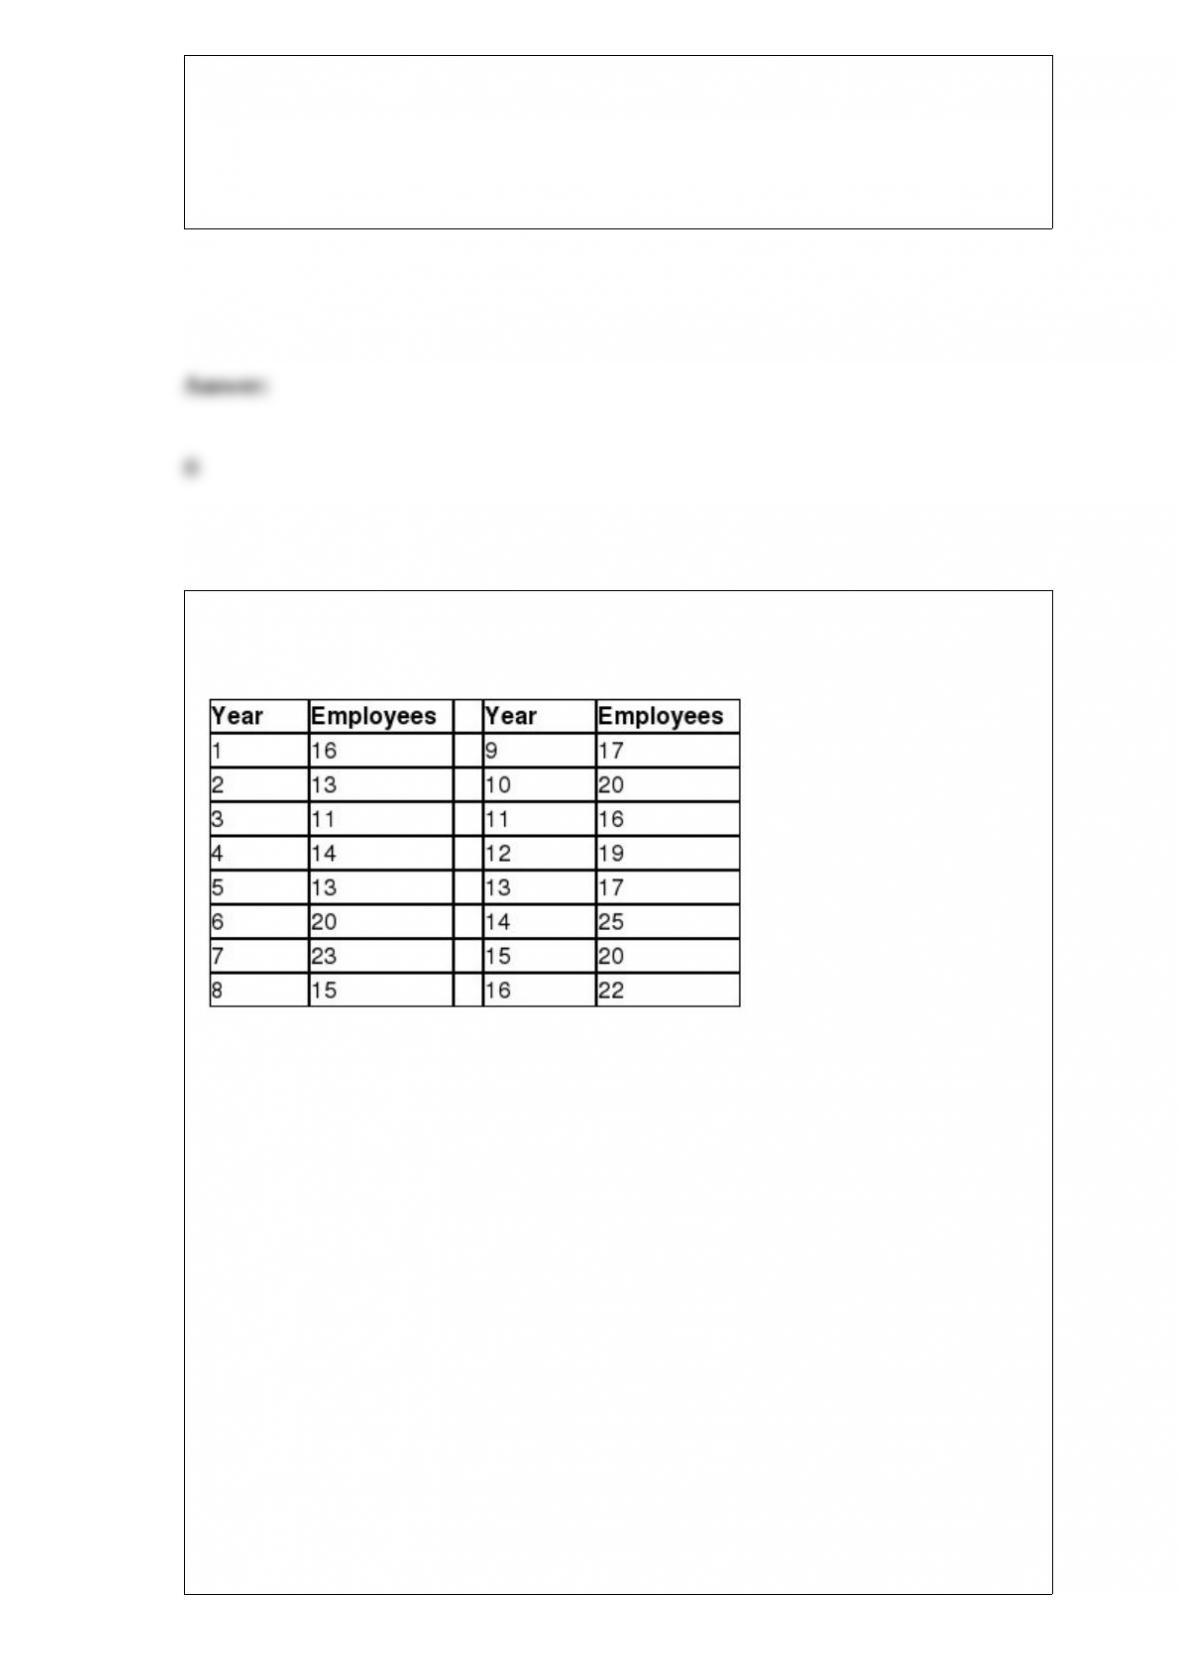
The following table shows the number of employees at Diamond Corporation over the
past 16 years.
Which one of the following statements is true for the hypothesis test for positive
autocorrelation using α = 0.05?
A) Because the Durbin-Watson statistic is less than the lower critical value, we fail to
reject the null hypothesis and conclude that positive autocorrelation is present in the
time series.
B) Because the Durbin-Watson statistic is less than the lower critical value, we reject
the null hypothesis and conclude that positive autocorrelation is not present in the time
series.
C) Because the Durbin-Watson statistic is greater than the upper critical value, we fail
to reject the null hypothesis and conclude that no positive autocorrelation is present in
the time series.
D) Because the Durbin-Watson statistic is greater than the lower critical value, we reject
the null hypothesis and conclude that positive autocorrelation is present in the time
series.
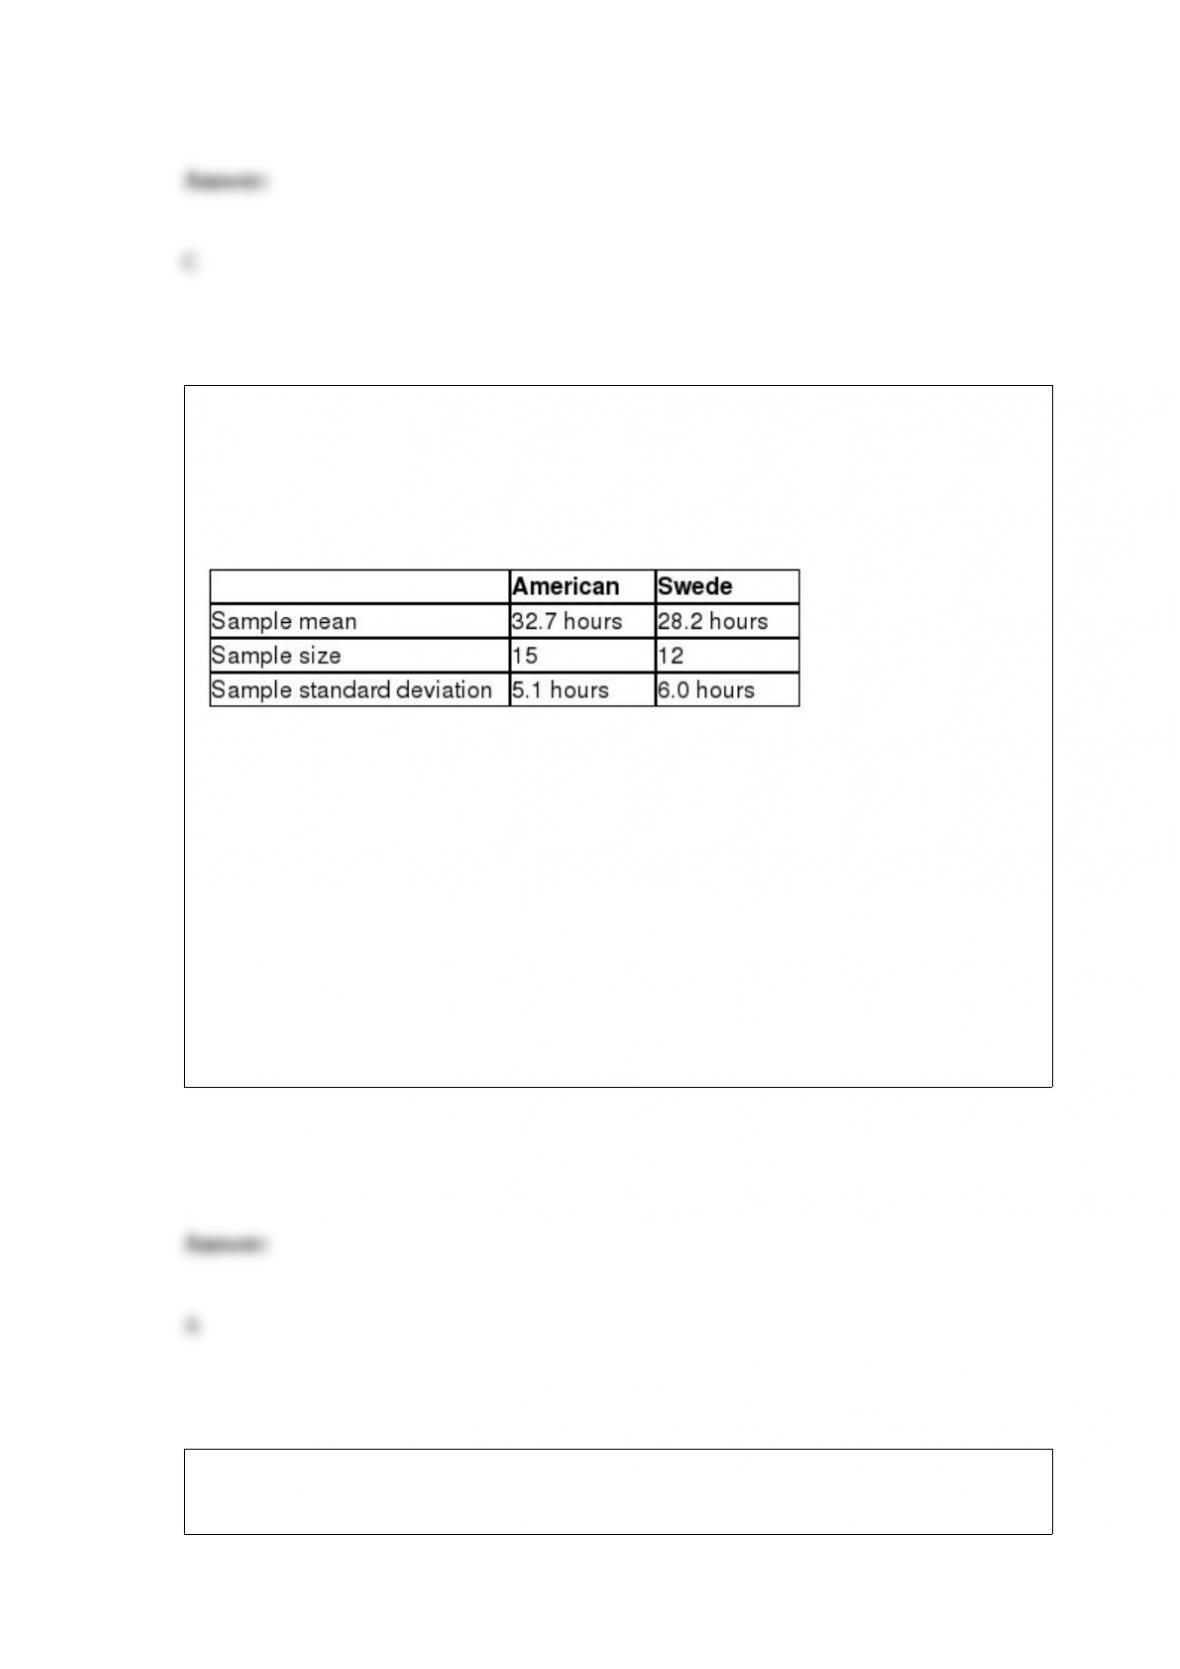
You have been assigned to test the hypothesis that the average number of hours per
week that an American works is higher than the average number of hours per week that
a Swede works. The following data summarizes the sample statistics for the number of
hours worked per week for workers in each country. Assume that the population
variances are unequal.
If Population 1 is defined as American workers and Population 2 is defined as Swedish
workers, and using α = 0.05, the critical value for this hypothesis test would be
________.
A) 1.721
B) 1.708
C) 1.699
D) 1.684
The results from a survey that collected annual household income is shown in the
following table.
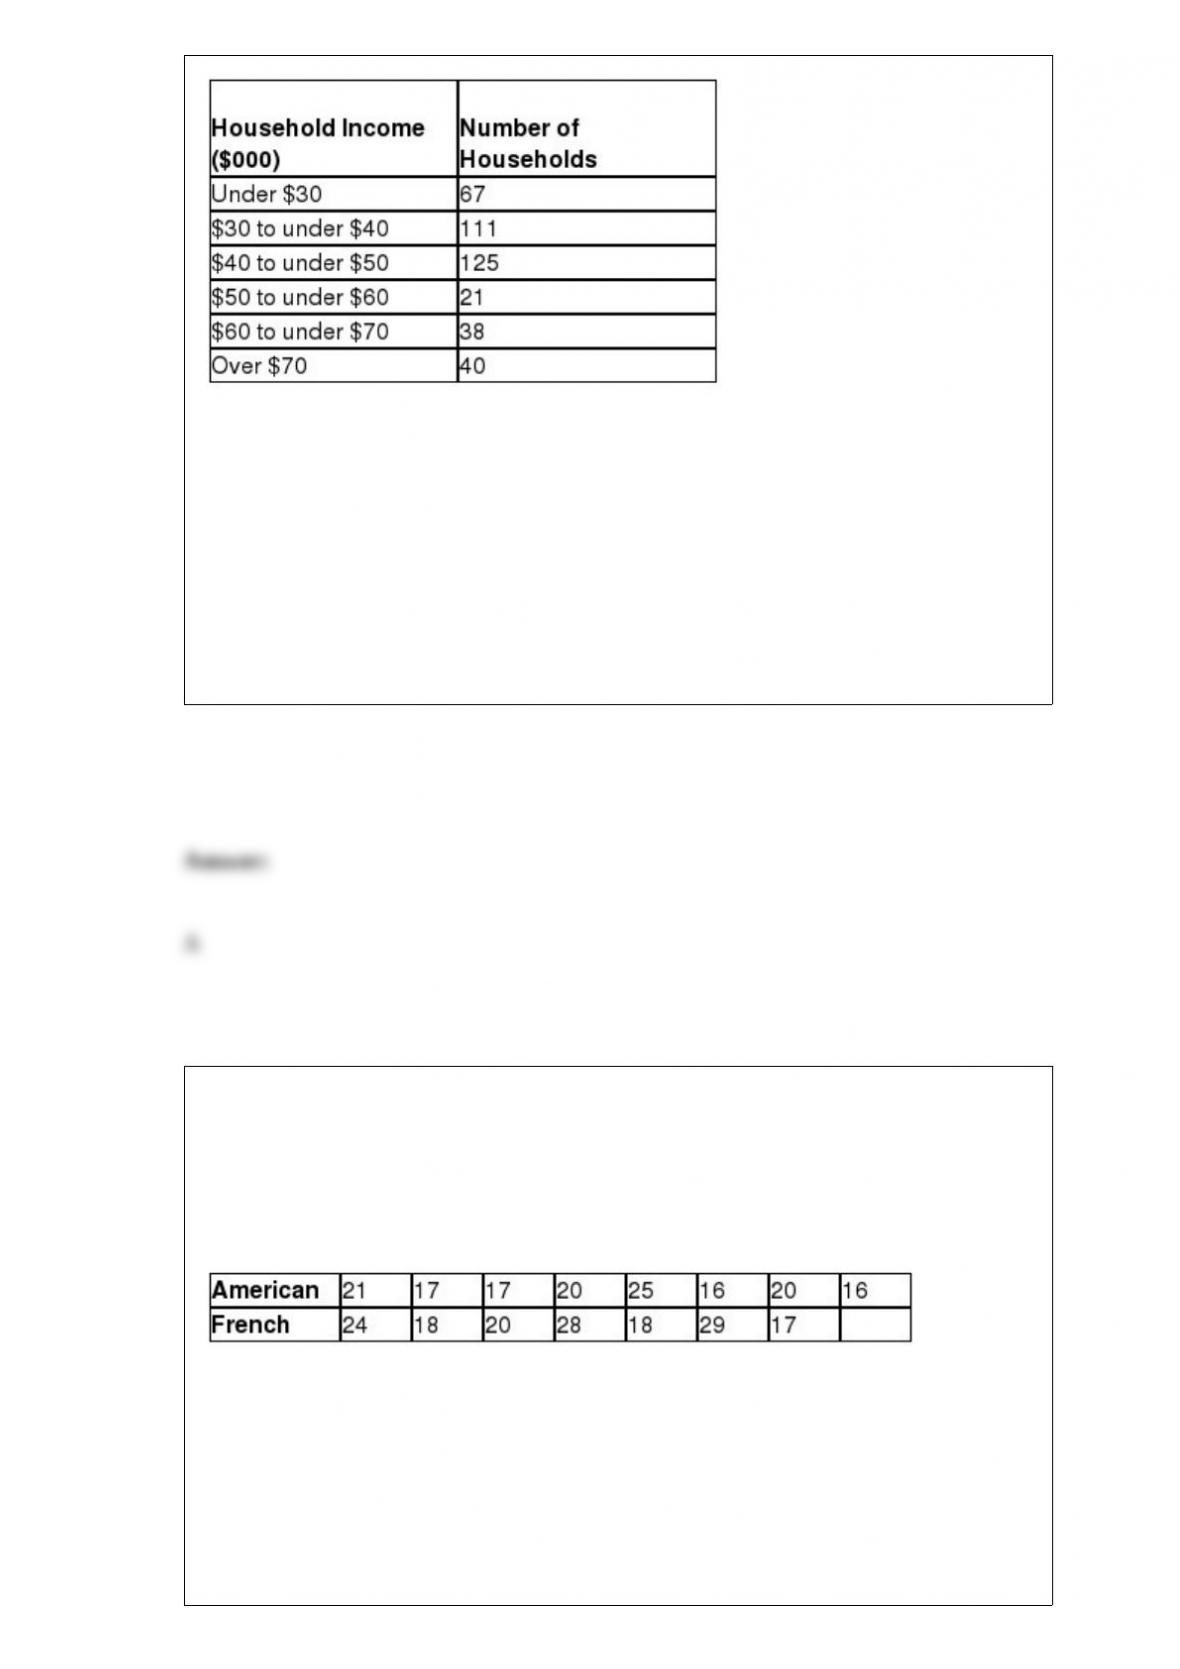
Which of the following data types best describe these values?
A) cross-sectional
B) nominal
C) time series
D) ordinal
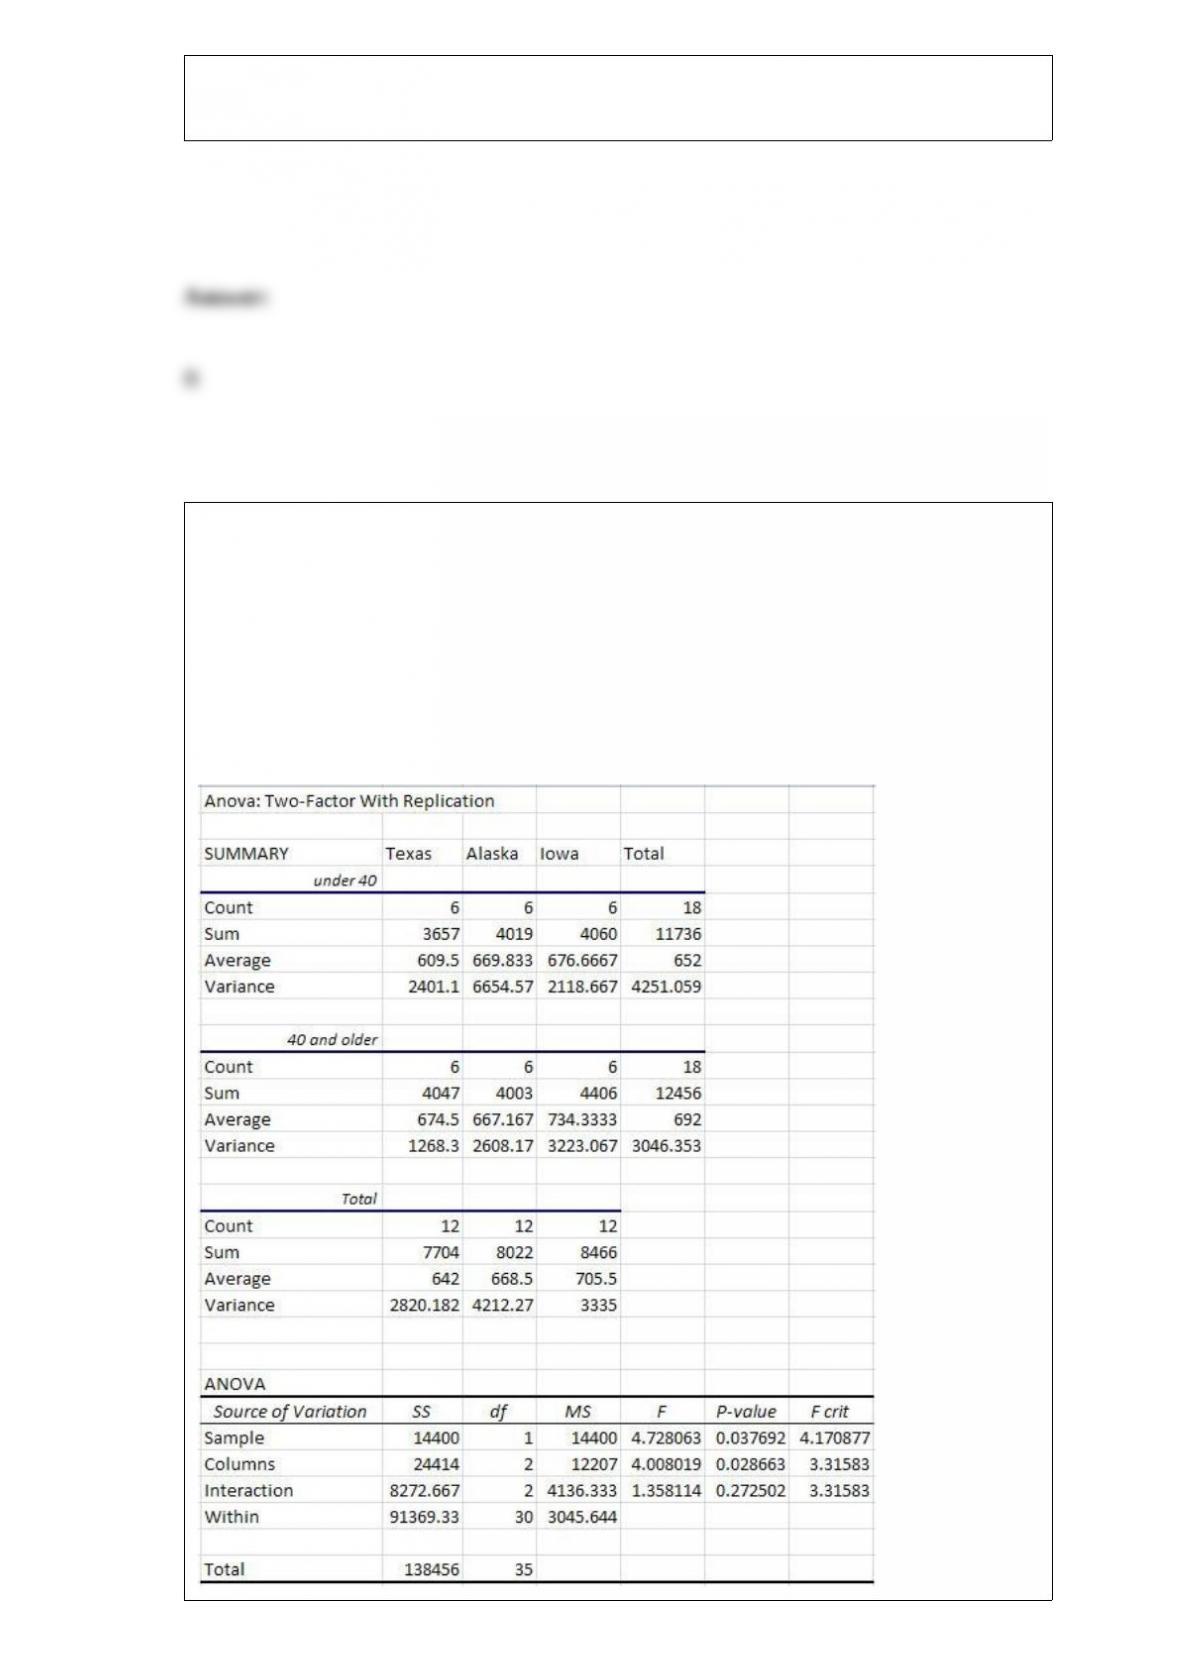
The Wall Street Journal reported that the average amount of time that a French person
spends eating lunch at a restaurant is 22 minutes. Perform a hypothesis test to determine
if a difference exists between the average time an American spends eating lunch when
compared to a person from France. The following data represents the time, in minutes,
that random French and American diners spent at lunch. Assume that the population
variances are equal.
Using α = 0.10, the critical value for this hypothesis test would be ________.
A) 1.753
B) 1.771
C) 2.160
D) 2.650
Wells Fargo Bank would like to determine if a difference exists in the average credit
score between residents of the states of Texas, Alaska, and Iowa and also investigate if
age plays a role in credit score. The credit scores from a random sample of residents
from each state was recorded and residents were categorized as being under 40 years
old or 40 years and older. A two-way ANOVA was conducted using α = 0.05 with
Factor A assigned the state residence and Factor B assigned the age group. The results
are shown below.
The Tukey-Kramer critical range for Factor A using α = 0.05 is ________.
A) 36.00
B) 41.30
C) 48.50
D) 55.60
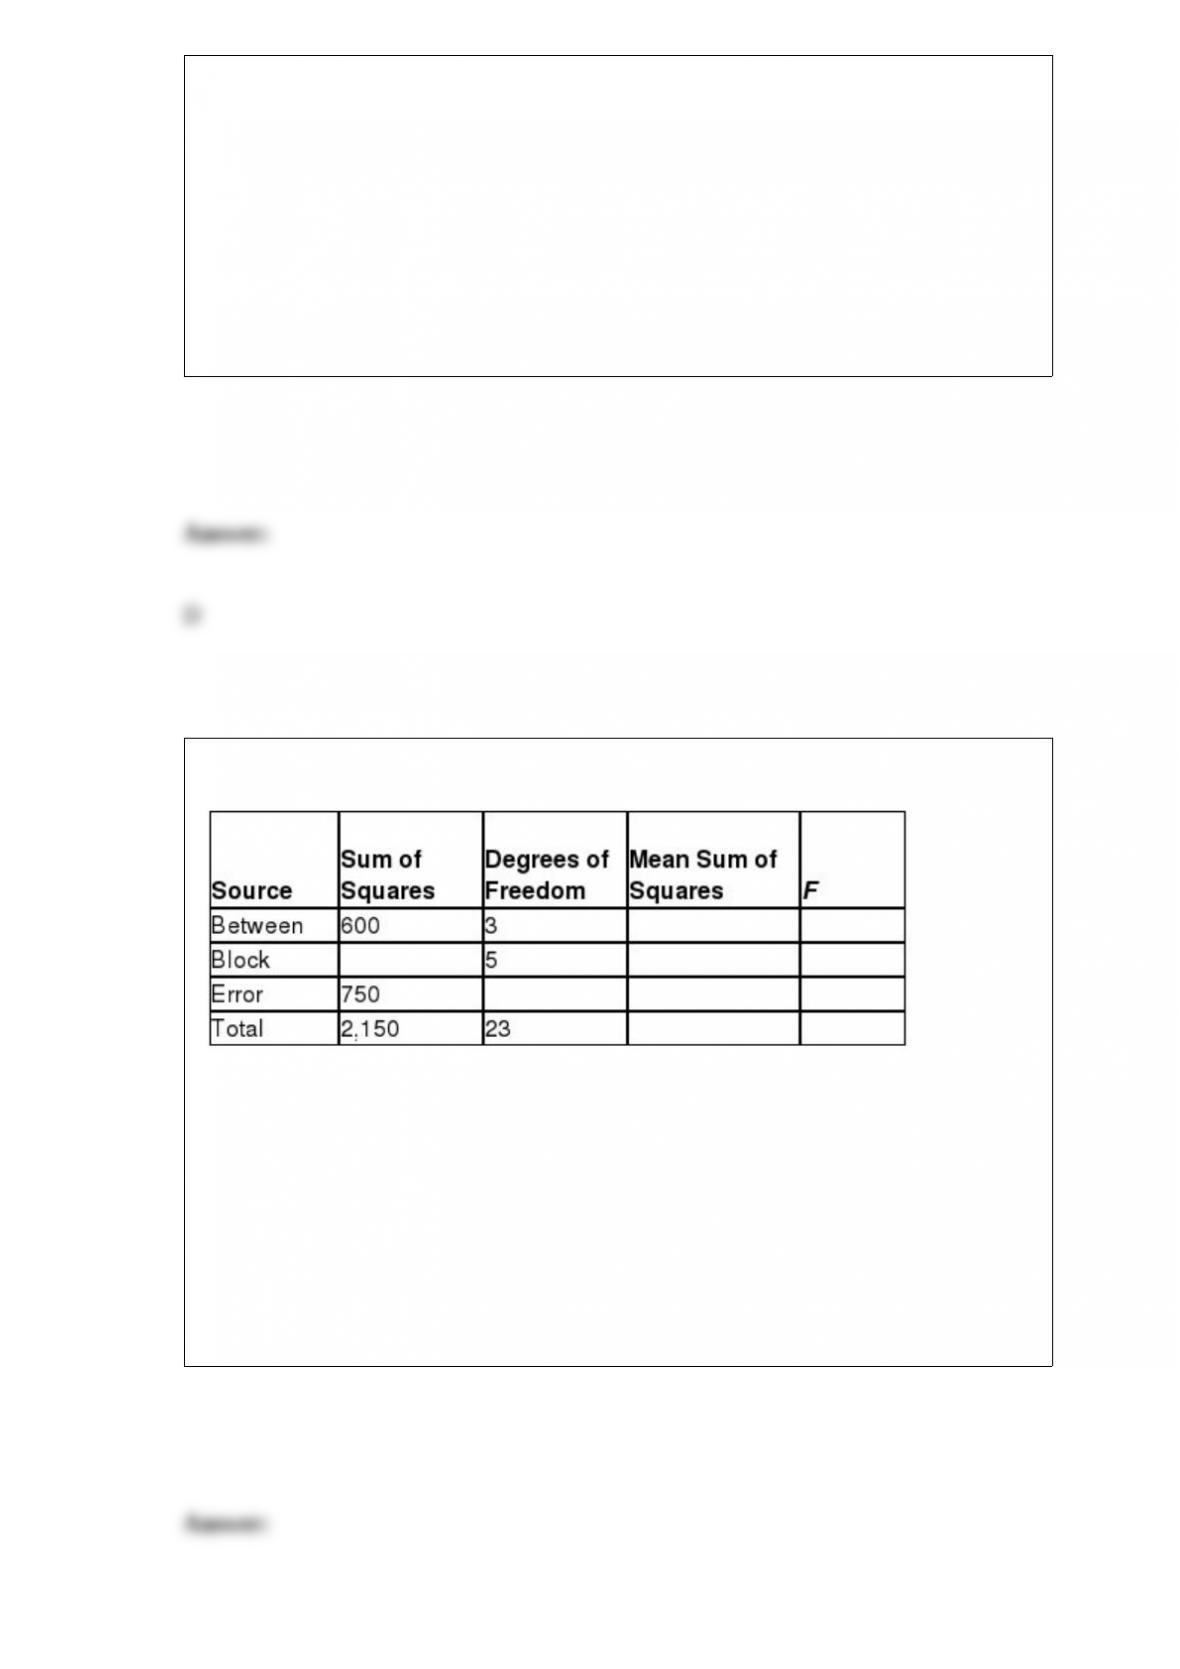
Consider the partially completed randomized block ANOVA summary table.
The mean square error for this ANOVA procedure is _______.
A) 50
B) 160
C) 200
D) 410
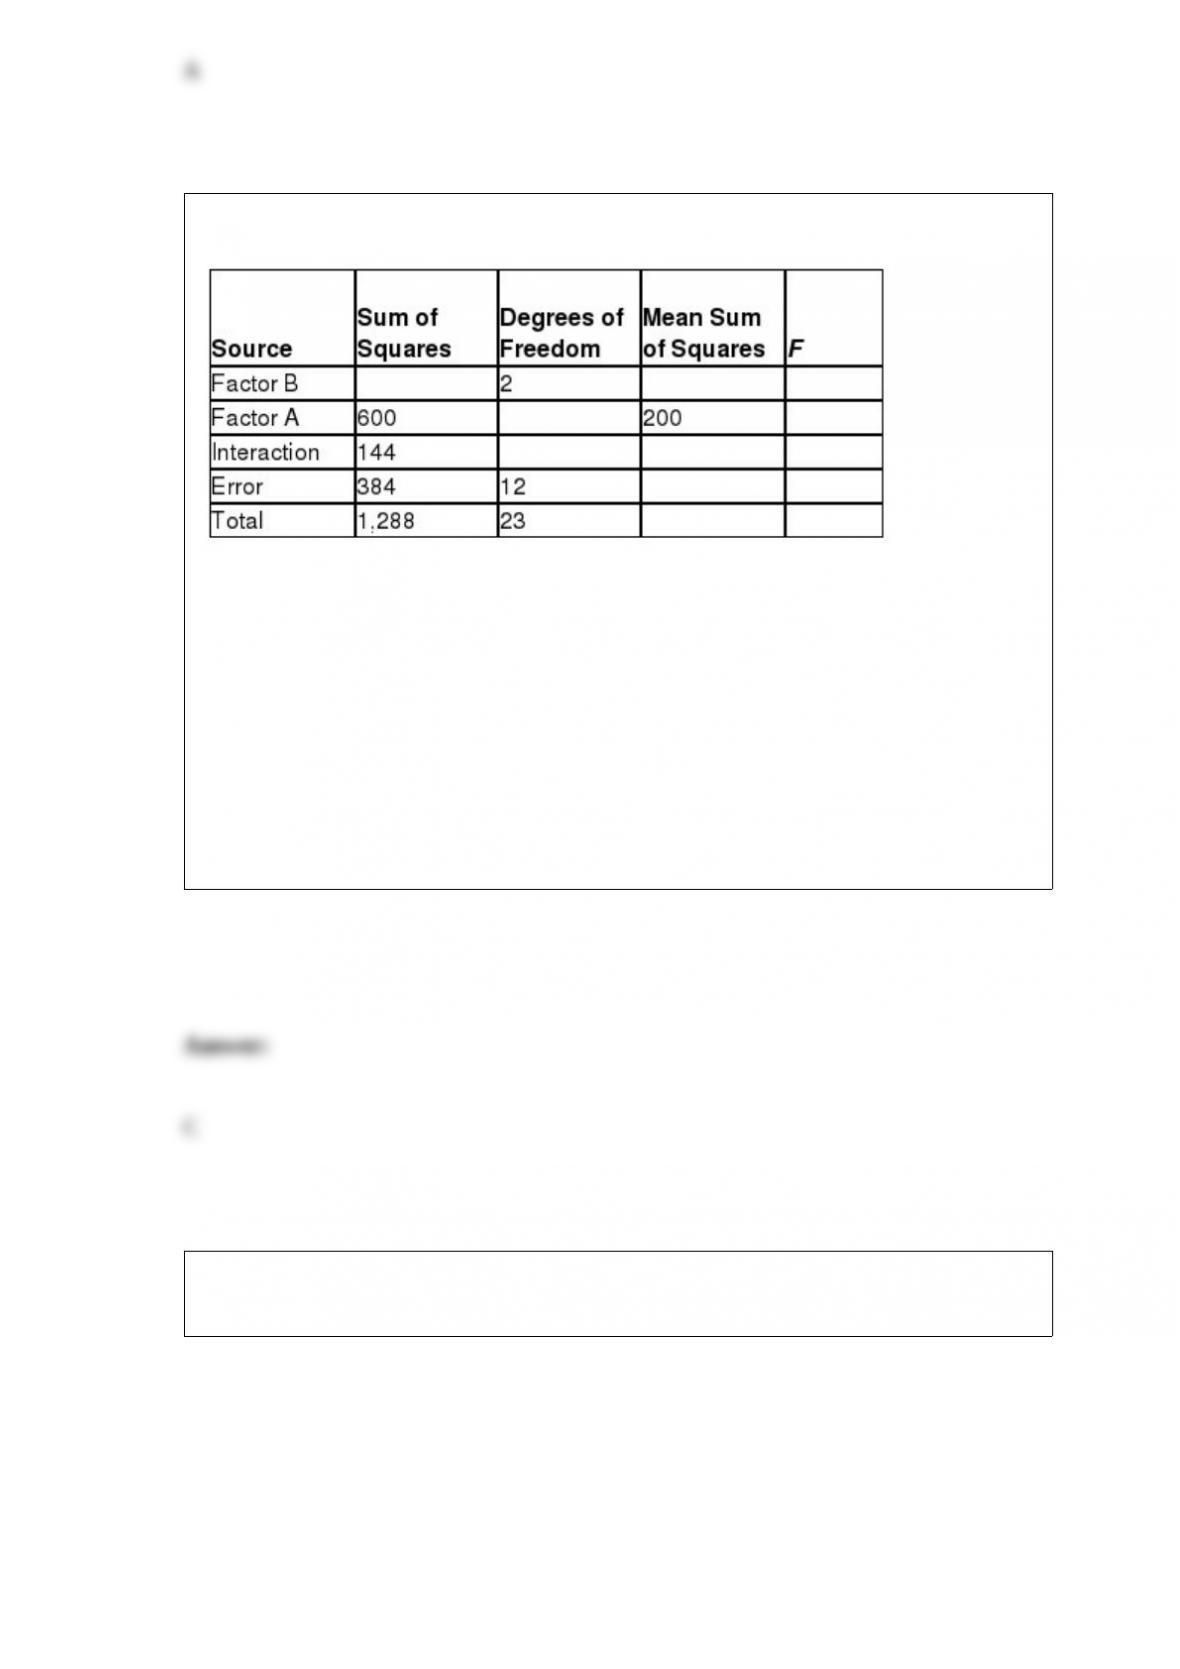
Consider the partially completed two-way ANOVA summary table.
The number of Factor A populations being compared for this ANOVA procedure is
_____.
A) 2
B) 3
C) 4
D) 5
The following distribution shows the frequency distribution of the number of shots a
particular NBA player blocked in one game for a random sample of 100 games.

You have been assigned the task to test if the distribution of blocked shots per game for
this player follows the Poisson distribution using α = 0.05. The conclusion for this
hypothesis test would be that because the test statistic is
__________________________________________.
A) more than the critical value, we can reject the null hypothesis and conclude that the
probability distribution does not follow the Poisson distribution
B) less than the critical value, we can reject the null hypothesis and conclude that the
probability distribution does not follow the Poisson distribution
C) more than the critical value, we cannot reject the null hypothesis and conclude that
the probability distribution follows the Poisson distribution
D) less than the critical value, we cannot reject the null hypothesis and cannot conclude
that the probability distribution does not follow the Poisson distribution
The _________________________ test determines if there is difference in the medians
of three or more populations.
A) Wilcoxon rank-sum
B) sign
C) Wilcoxon signed-rank
D) Kruskal-Wallis
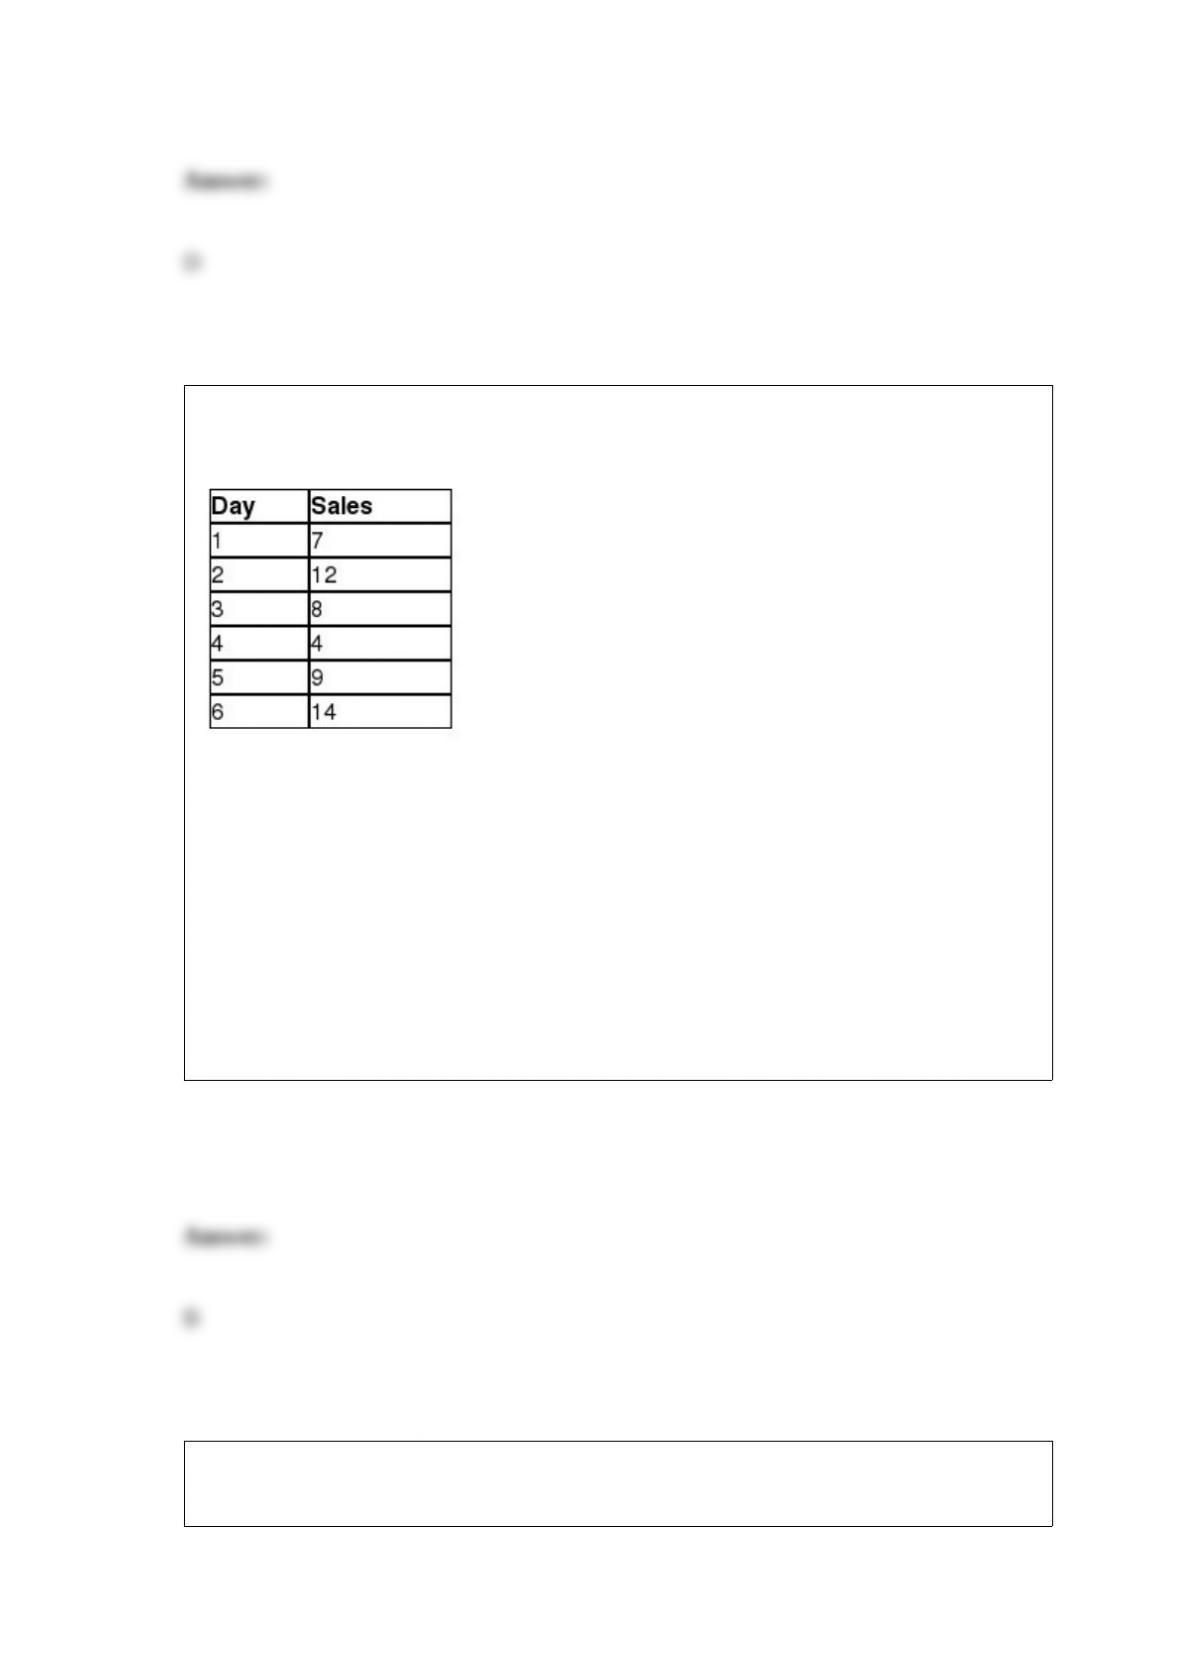
The following data represent the number of sweatshirts sold for each of the past six
days for Hoys Department Store at the beach in Avalon, New Jersey.
Using an exponential smoothing with trend adjustment technique with alpha equal to
0.3 and beta equal to 0.6, the forecasting error for Day 4 is ________.
A) 5.8
B) -5.7
C) -7.5
D) 8.3
The sum of squares interaction represents the variation due to the effect that Factor A
has on Factor B or the effect that Factor B has on Factor A.
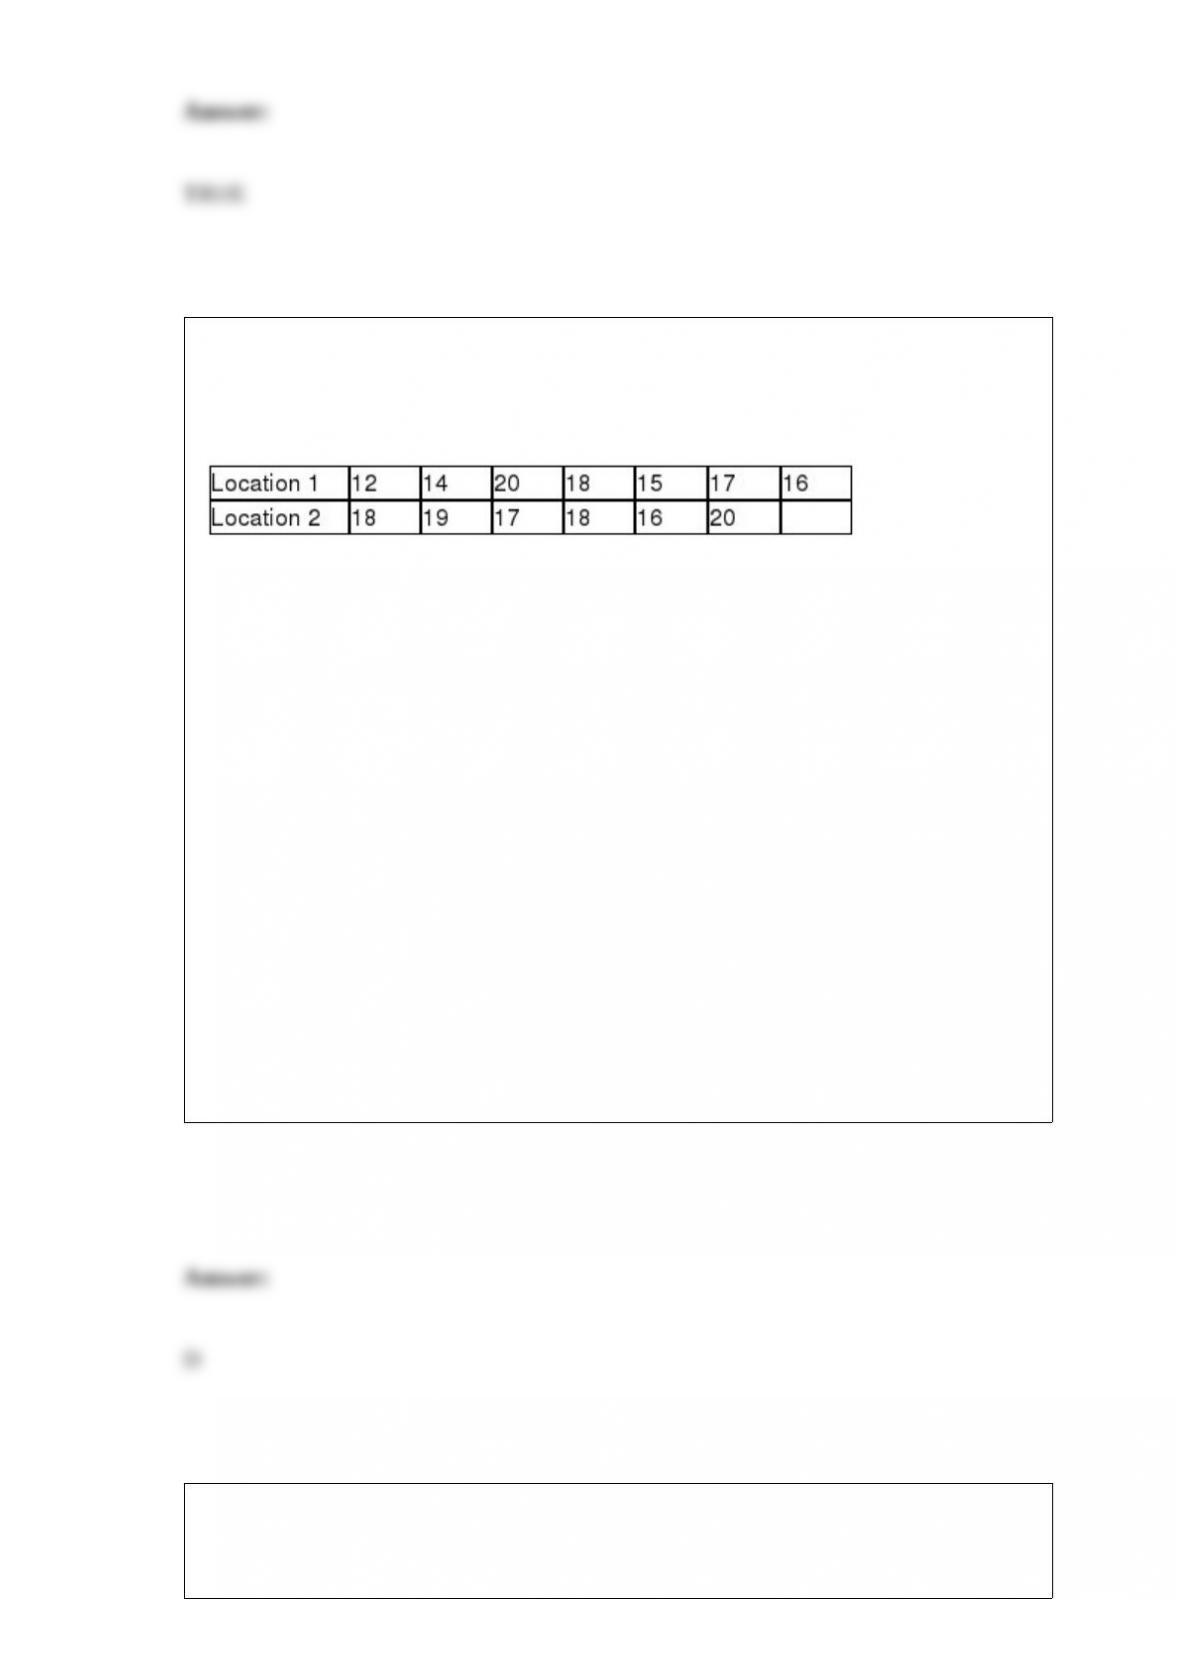
A retail chain would like to test if a difference exists between the variability of
customer satisfaction scores from two locations. The following data represents
satisfaction scores from a random sample of customers from these locations on a scale
of 1-20.
Using α = 0.10, the conclusion for this hypothesis test would be that because the test
statistic is ____________________________.
A) more than the critical value, we fail to reject the null hypothesis and conclude that a
difference exists between the variability of customer satisfaction scores from two
locations
B) more than the critical value, we reject the null hypothesis and cannot conclude that a
difference exists between the variability of customer satisfaction scores from two
locations
C) less than the critical value, we can reject the null hypothesis and conclude that a
difference exists between the variability of customer satisfaction scores from two
locations
D) less than the critical value, we fail to reject the null hypothesis and cannot conclude
that a difference exists between the variability of customer satisfaction scores from two
locations
The Department of Housing and Urban Development (HUD) would like to test the
hypothesis that the average size of a newly constructed house last year is different from
the average size of a newly constructed house in 2000. The following data summarizes
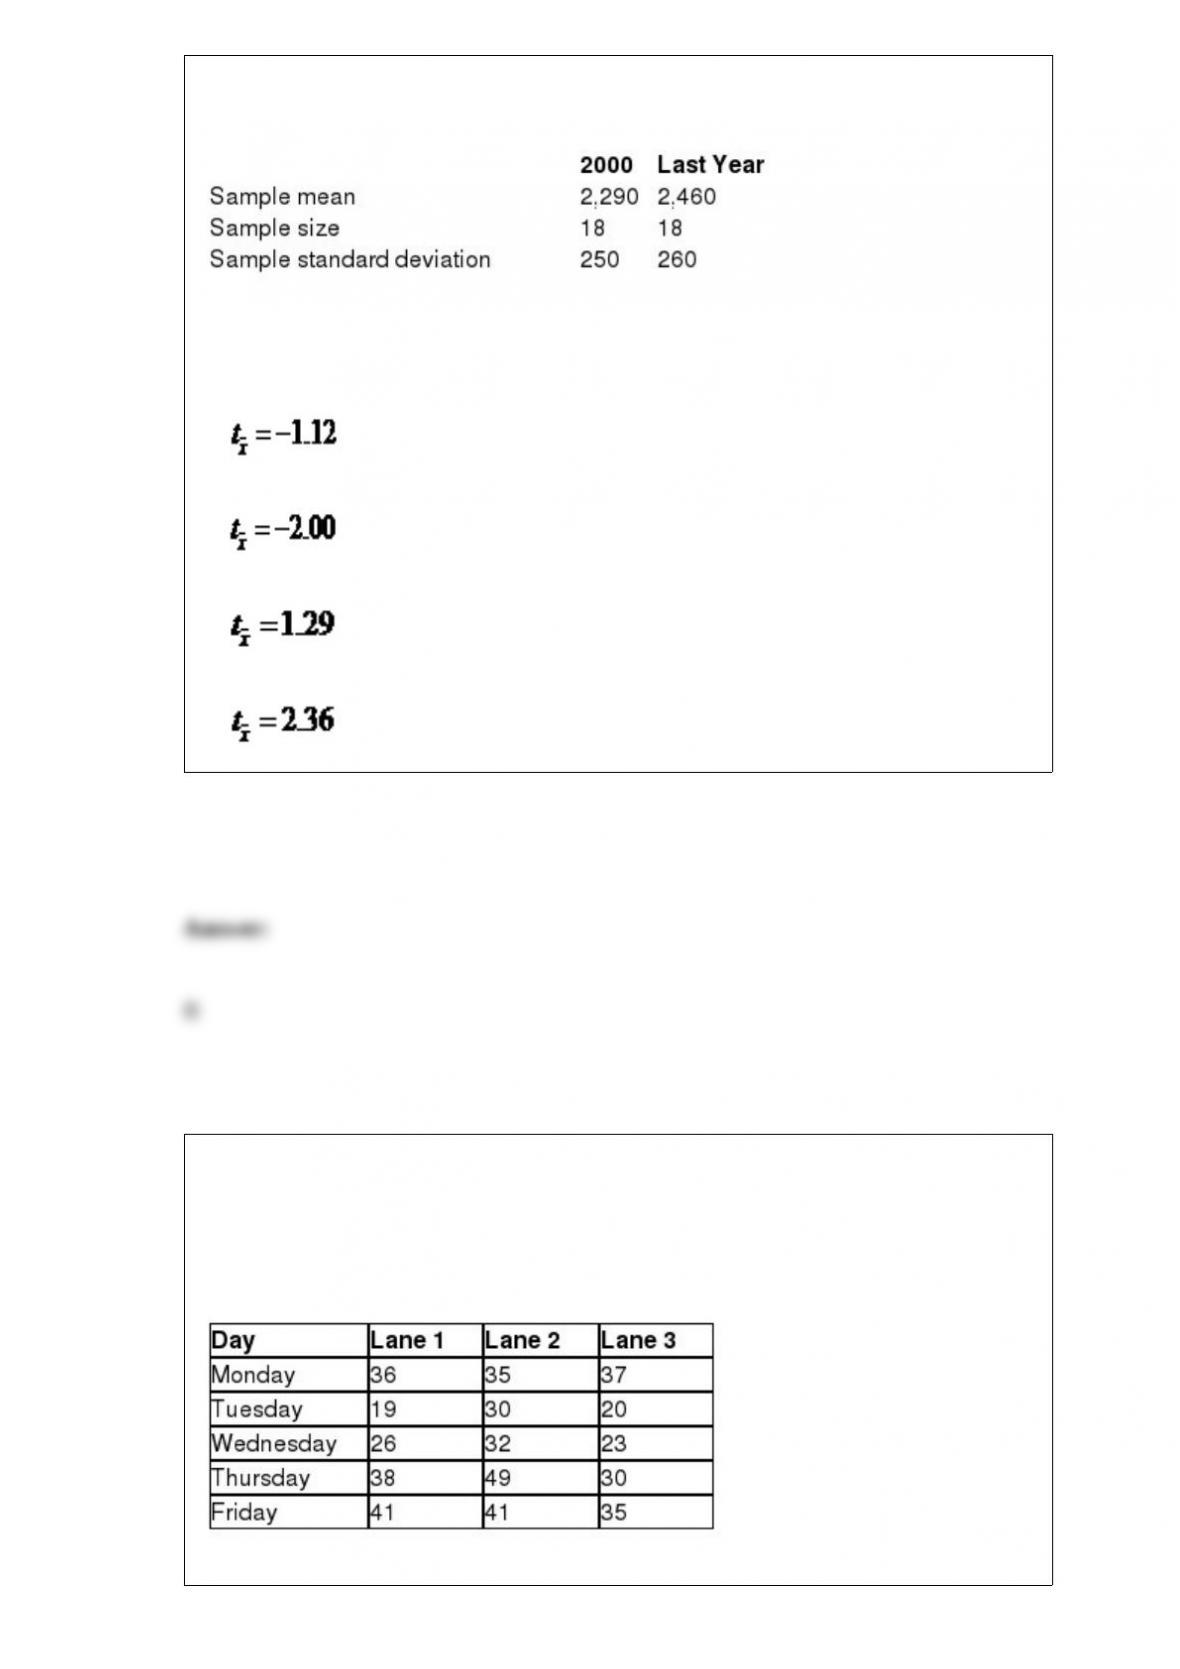
the sample statistics for house sizes, in square feet, for both years. Assume that the
population variances are equal.
If Population 1 is defined as homes built in 2000 and Population 2 is defined as homes
built last year, the test statistic for this hypothesis test would be ________.
A)
B)
C)
D)
In Delaware, cars are inspected each year using state-operated inspection centers. The
Wilmington center has three drive-through lanes where cars are inspected in a sequence
of steps. The following data show the number of minutes that a random sample of
drivers spent waiting and having their cars inspected in the three lanes each day of the
week.

The state of Delaware would like to perform a randomized block ANOVA to test for a
difference in the average times the drivers spend in the three lanes using the weekday as
a blocking factor with α = 0.05. The mean square error for these observations is
________.
A) 17.9
B) 19.0
C) 24.6
D) 33.3
Using quality control techniques to test the salt content of pretzels before they are
packaged for the consumer is an example of using statistics in the field of ________.
A) marketing research
B) advertising
C) operations
D) finance
A factor in an ANOVA test describes the cause of the variation in the data.
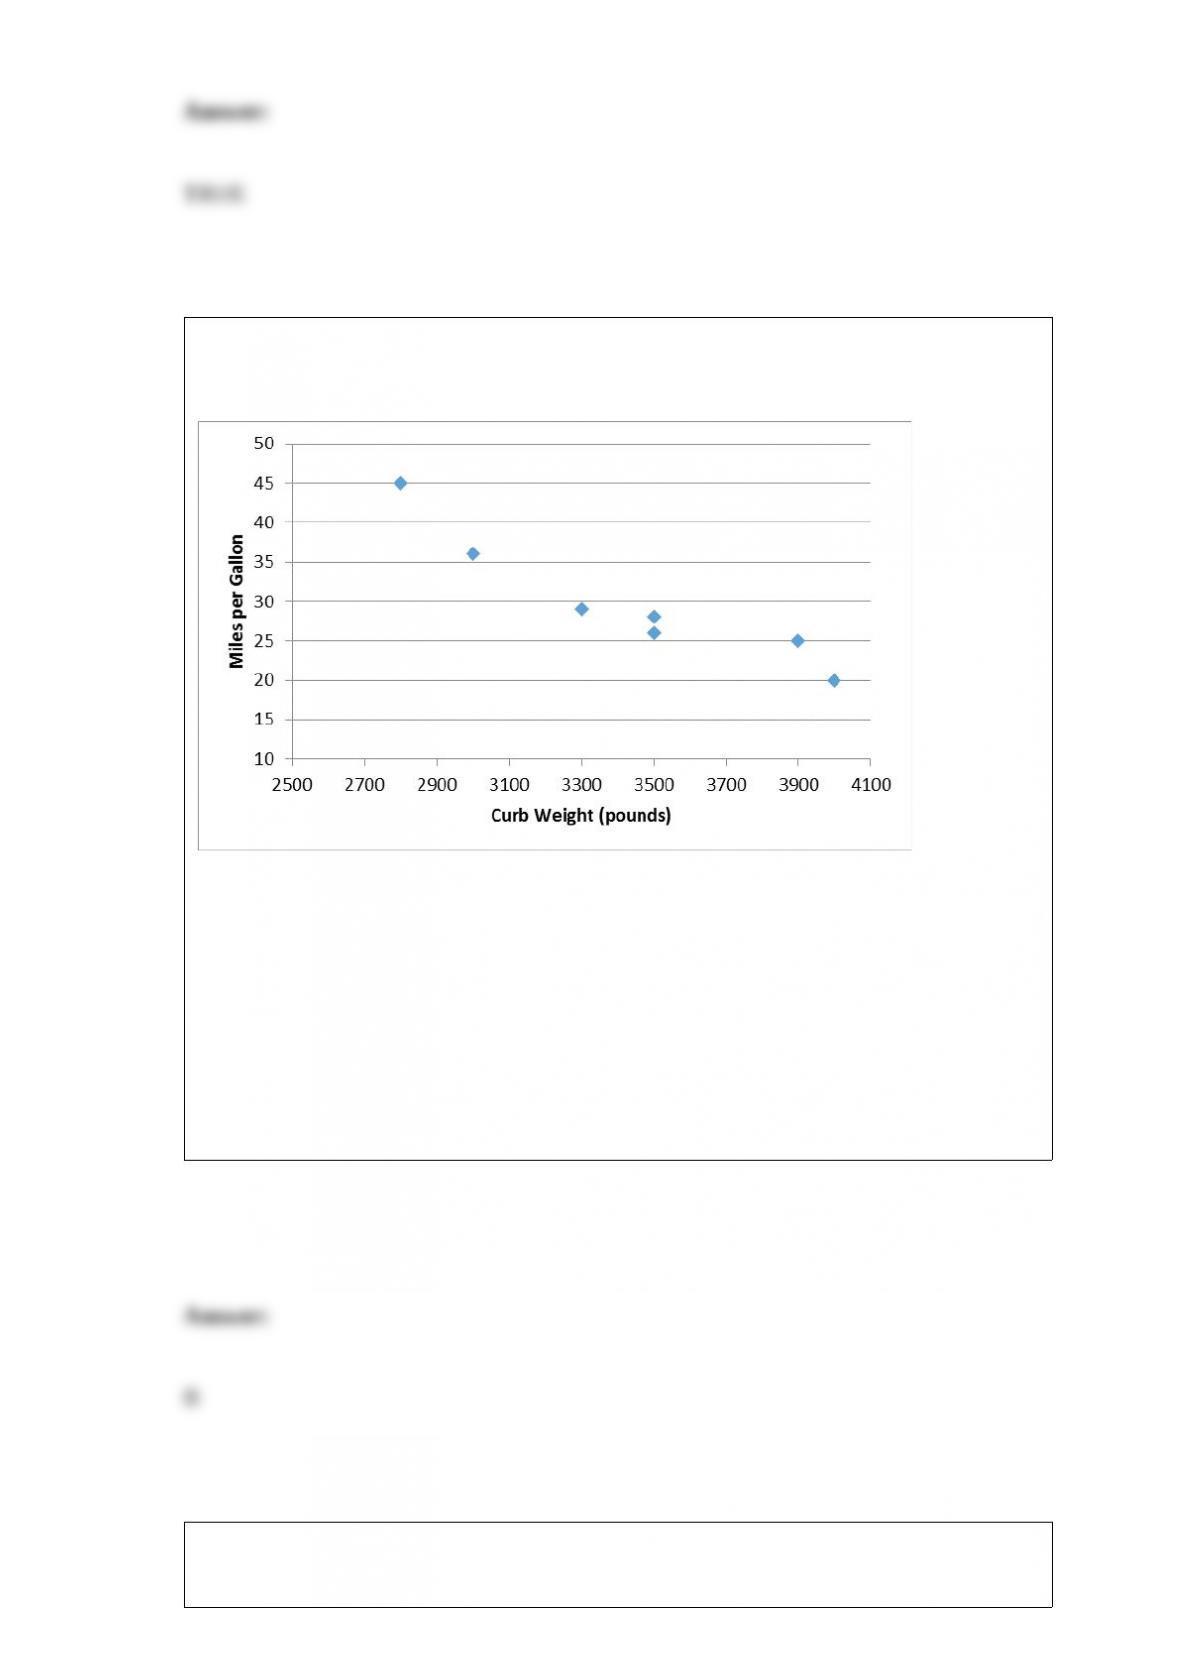
The following graph shows the curb weight of seven cars, in pounds, along with their
corresponding highway miles per gallon.
This graph is an example of a _________.
A) line chart
B) scatter plot
C) Pareto chart
D) histogram
Use the following information to answer the question(s) below.

The National Football League has developed a regression model to predict the number
of wins during a season for a team using the following independent variables:
•Average points per game during the season (PPG)
•Average number of penalties committed per game during the season (PEN)
•Turnover differential during the season (TO)
Turnover differential is defined as the number of times the team took the ball away from
their opponent with a turnover minus the number of times the team gave the ball away to
their opponent with a turnover. For example, if TO = +5, the team had five more
takeaways than giveaways. If TO = “7, the team had seven more giveaways than
takeaways during the season.
The following Excel output shows the partially completed regression output from a
random season.
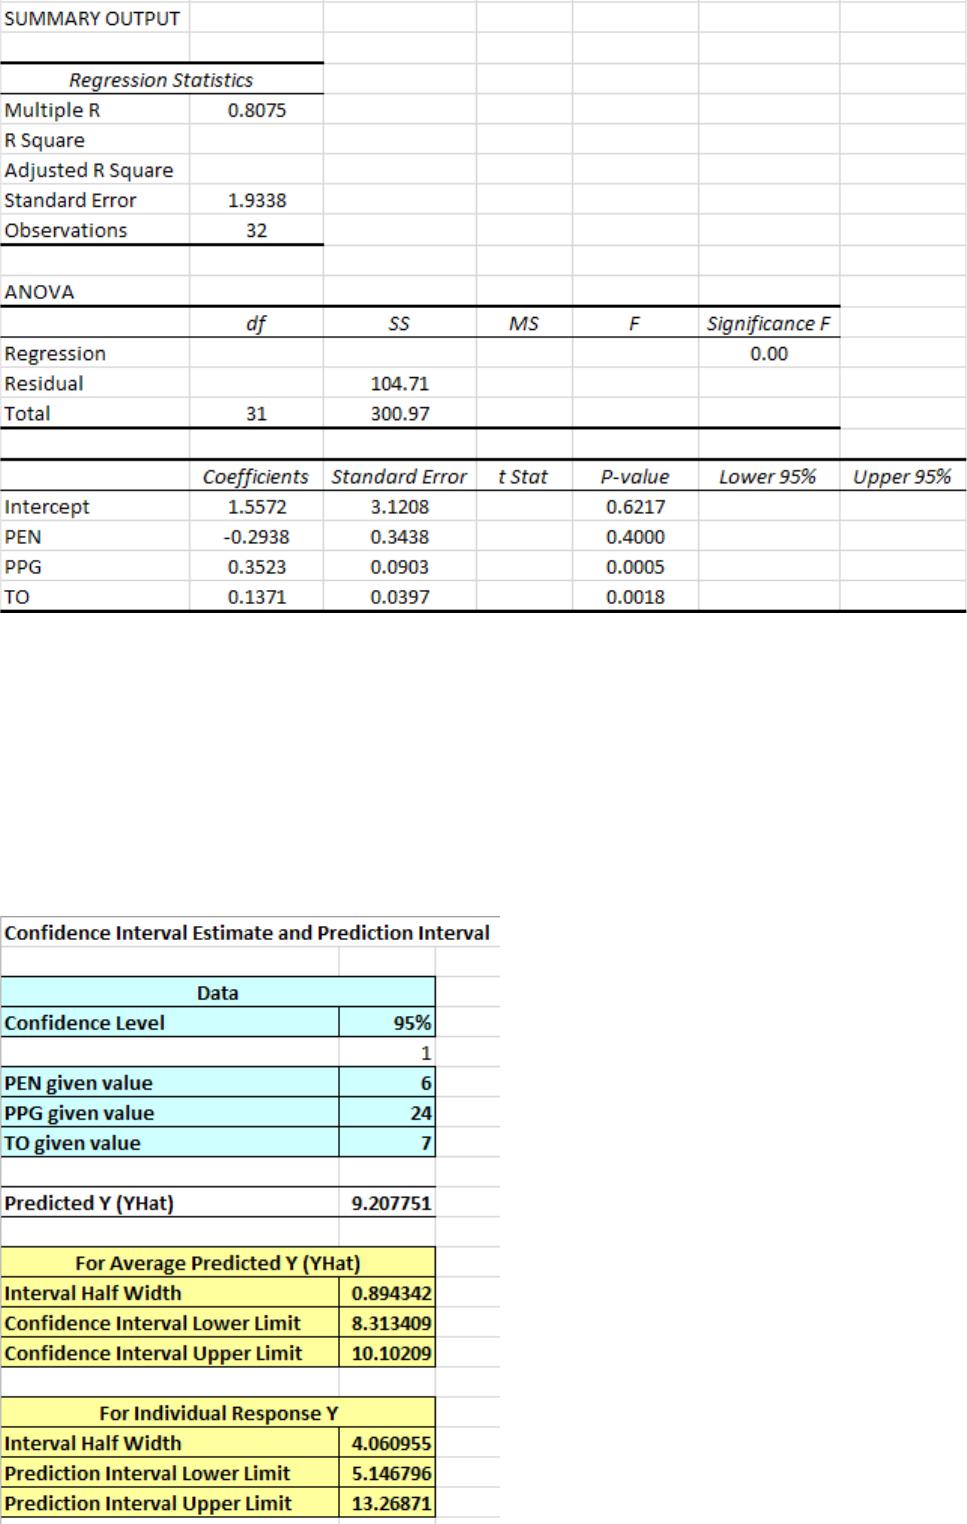

The multiple coefficient of determination for this model is ________.
A) 0.6019
B) 0.6148
C) 0.6521
D) 0.8075
According to the IRS, the average refund in the last tax year was $2,974. Assuming that
the standard deviation for these refunds was $812, the standard error of the mean for a
random sample of 60 tax returns is __________.
A) $72.55
B) $104.83
C) $127.10
D) $141.38
The sampling distribution of the proportion follows the ________ probability
distribution.
A) Poisson
B) uniform
C) binomial
D) exponential
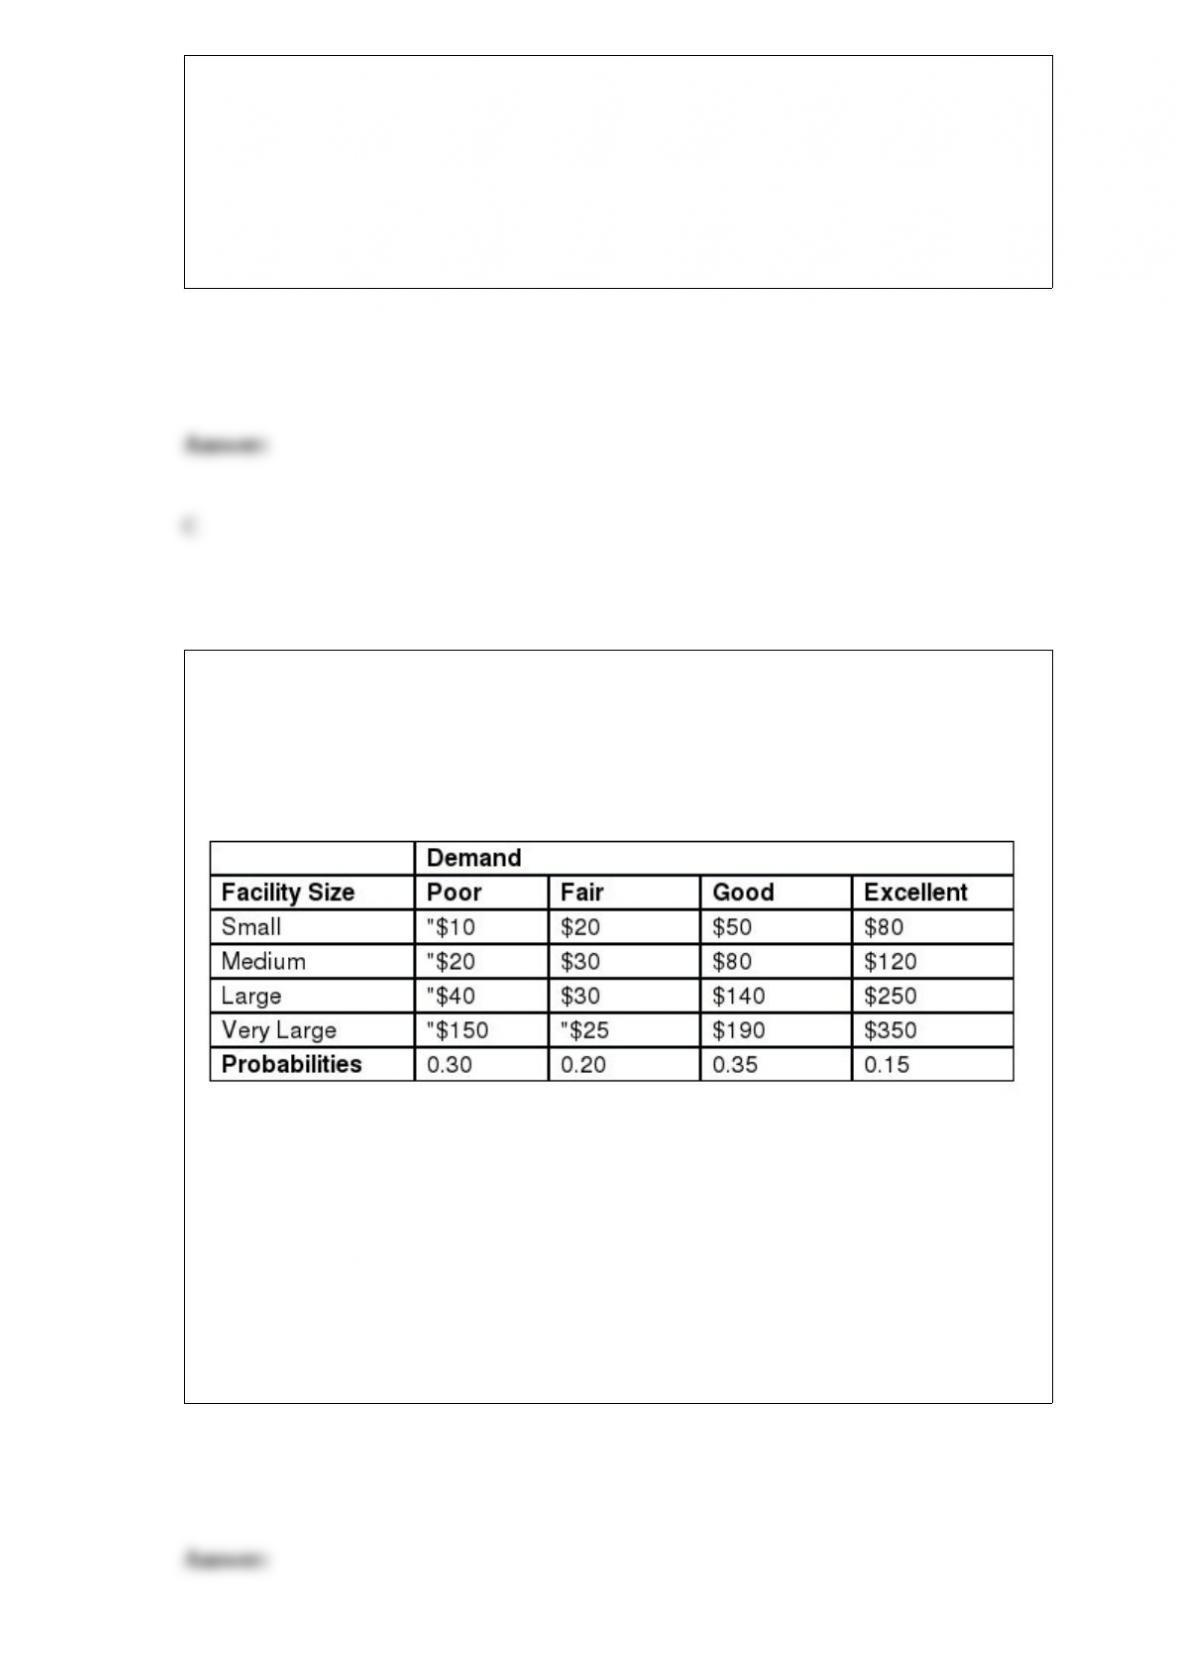
Scott has decided to invest in constructing and operating a new sandwich shop and
needs to decide how large to build this new facility. The annual profit, including the
depreciated investment, will depend on the demand for his products. The following
decision table shows the payoffs, in thousands of dollars, for various combinations of
facility size and demand along with Scott’s estimates for each demand level.
The expected value under certainty (EVUC), in thousands of dollars, is _________.
A) $96.50
B) $102.00
C) $122.00
D) $137.50

The following data represent a random sample the golf scores for a particular golfer
from a course that he regularly plays.
This golfer would like to test if his golf scores at this course follow the normal
probability distribution with μ = 85.0 and σ = 5.0 using α = 0.05. The expected number
of scores from this sample that would fall in the interval of more than 85 to 90 is
________.
A) 5.55
B) 7.20
C) 9.36
D) 11.95
The Canadian government would like to test the hypothesis that the average hourly
wage for men is more than $2.00 higher than the average hourly wage for women. The
following data summarizes the sample statistics for hourly wages for men and women.
Assume that the population variances are equal.
If Population 1 is defined as men and Population 2 is defined as women, the 95%
confidence interval for the difference in population means is ________.

A) ($2.23, $6.17)
B) ($0.21, $8.19)
C) (“$1.71, $10.11)
D) (“$3.68, $12.08)
Many hotel chains that offer free Wi-Fi service to their customers have experienced
increasing demand for Internet bandwidth and increasing costs. Marriott International
would like to test the hypothesis that the proportion of customers that are carrying two
Wi-Fi devices exceeds 0.60. A random sample of 120 Marriott customers found that 78
have two Wi-Fi devices. Marriott International would like to set α = 0.01. Which one of
the following statements is true?
A) Because the p-value is greater than α, we reject the null hypothesis and cannot
conclude that the proportion of Marriott customers that carry two Wi-Fi devices is
greater than 0.60.
B) Because the p-value is greater than α, we fail to reject the null hypothesis and
conclude that the proportion of Marriott customers that carry two Wi-Fi devices is not
more than 0.60.
C) Because the p-value is less than α, we reject the null hypothesis and conclude that
the proportion of Marriott customers that carry two Wi-Fi devices is greater than 0.60.
D) Because the p-value is less than α, we fail to reject the null hypothesis and cannot
conclude that the proportion of Marriott customers that carry two Wi-Fi devices is less
than 0.60.

________ are obtained by averaging the ratio-to-moving-averages associated with each
season in the time series.
A) Seasonal factors
B) Dummy variables for seasonality
C) Normalized trend factors
D) Deseasonalized factors
Nationwide Insurance would like to perform a chi-square test to investigate whether a
difference exists in the proportion of male and female teenagers who text while they
drive. A random sample of 80 male teenagers found that 50 indicated they texted while
driving. A random sample of 120 female teenagers found that 65 indicated they texted
while driving. Using α = 0.5, the conclusion for this chi-square test would be that
because the test statistic is
__________________________________________________________________.
A) more than the critical value, we can reject the null hypothesis and conclude that
there is a difference in the proportion of male and female teenagers who text while they
drive
B) less than the critical value, we can reject the null hypothesis and conclude that there
is a difference in the proportion of male and female teenagers who text while they drive
C) more than the critical value, we cannot reject the null hypothesis and conclude that
there is no difference in the proportion of male and female teenagers who text while
they drive
D) less than the critical value, we cannot reject the null hypothesis and cannot conclude
that there is a difference in the proportion of male and female teenagers who text while
they drive
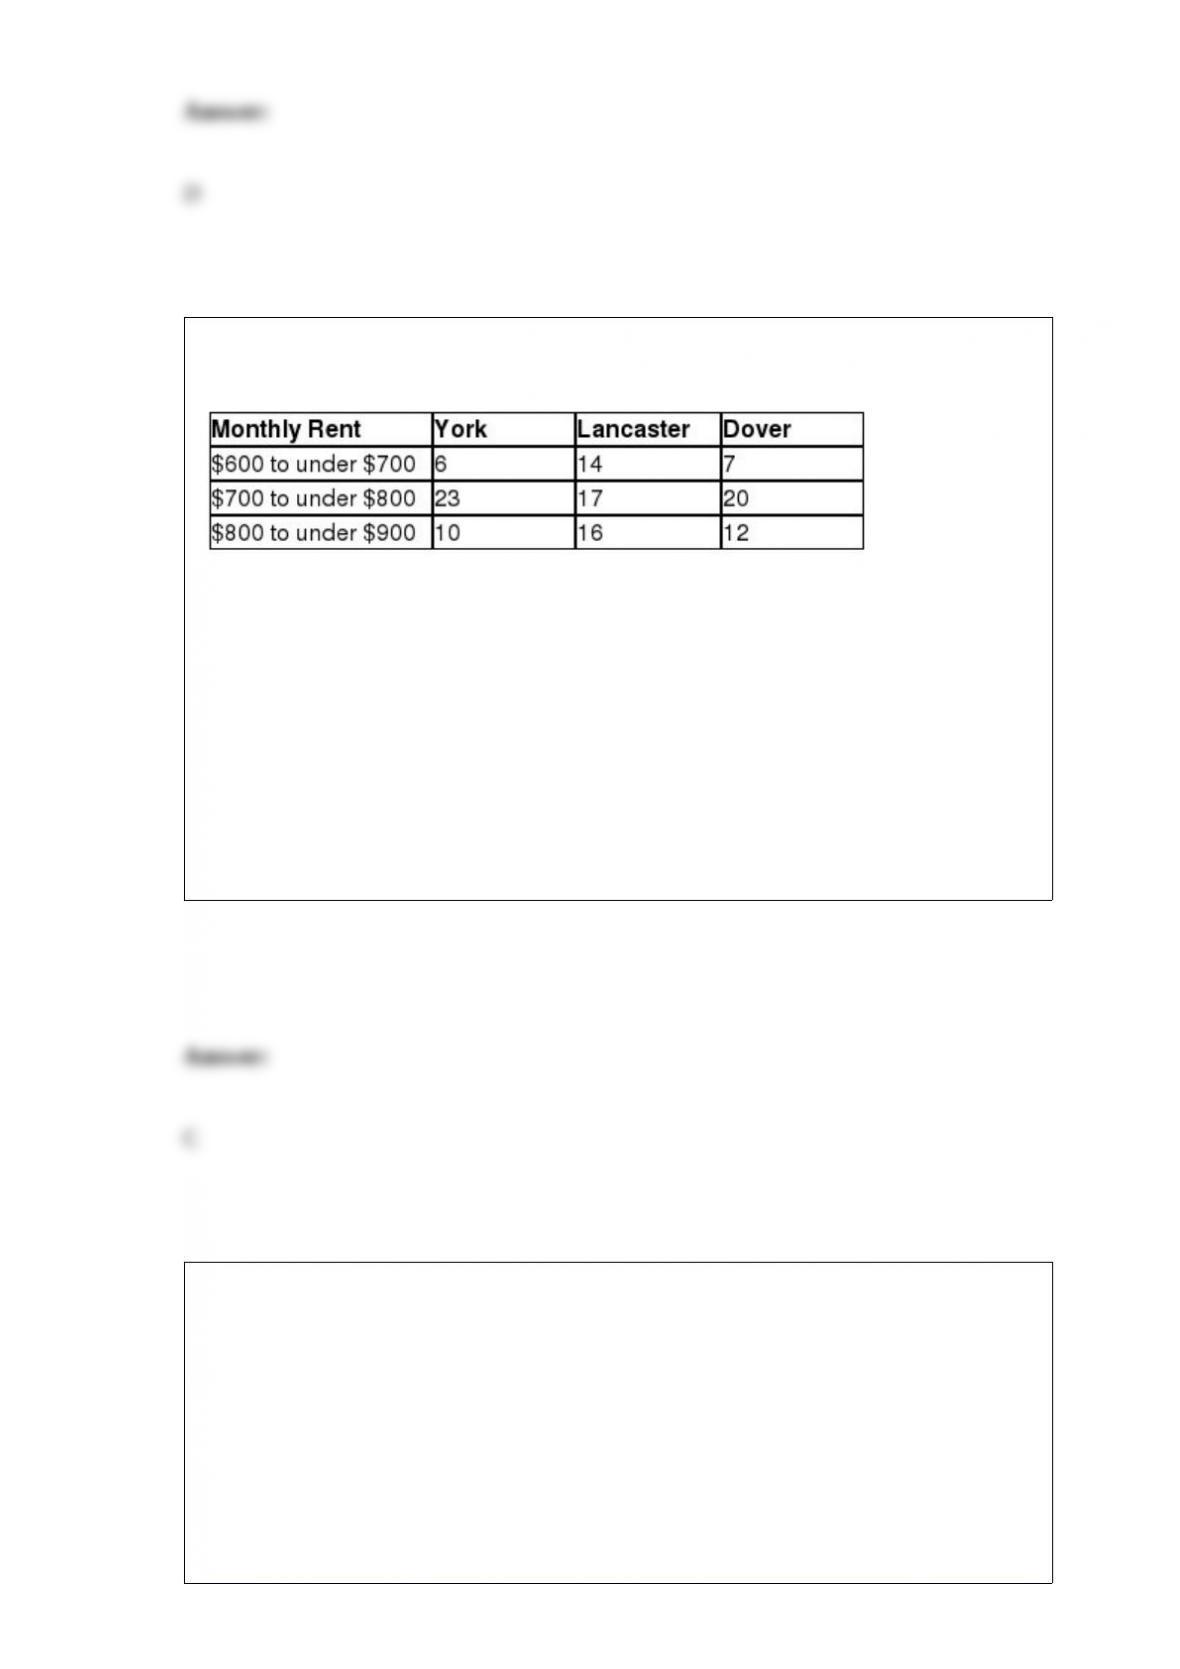
The following contingency table shows the number of two-bedroom apartments
grouped by monthly rent and location.
The probability that a randomly selected apartment from this group has a monthly rental
from $700 to under $800 is ________.
A) 0.216
B) 0.304
C) 0.480
D) 0.552
According to a recent survey, 38% of U.S. households used only cell phones for their
phone service. A random sample of four households was selected. The probability that
the first three used only cell phones and the fourth had a landline is ________.
A) 0.034
B) 0.070
C) 0.154

D) 0.195
A recent study reported that 18- to 24-year-olds averaged 192 restaurant visits per year.
Assume that the standard deviation for number of visits per year for this age group is
56.5. To validate these findings, a random sample of forty 18- to 24-year-olds was
selected and found to average 212 restaurant visits per year. Which of the following
statements is correct?
A) The interval that contains 95% of the sample means is 170.3 and 213.7 visits.
Because the sample mean is between these two values, we have support for the results
of the May 2011 study.
B) The interval that contains 95% of the sample means is 170.3 and 213.7 visits.
Because the sample mean is between these two values, we do not have support for the
results of the May 2011 study.
C) The interval that contains 95% of the sample means is 174.5 and 209.5 visits.
Because the sample mean is not between these two values, we have support for the
results of the May 2011 study.
D) The interval that contains 95% of the sample means is 174.5 and 209.5 visits.
Because the sample mean is not between these two values, we do not have support for
the results of the May 2011 study.
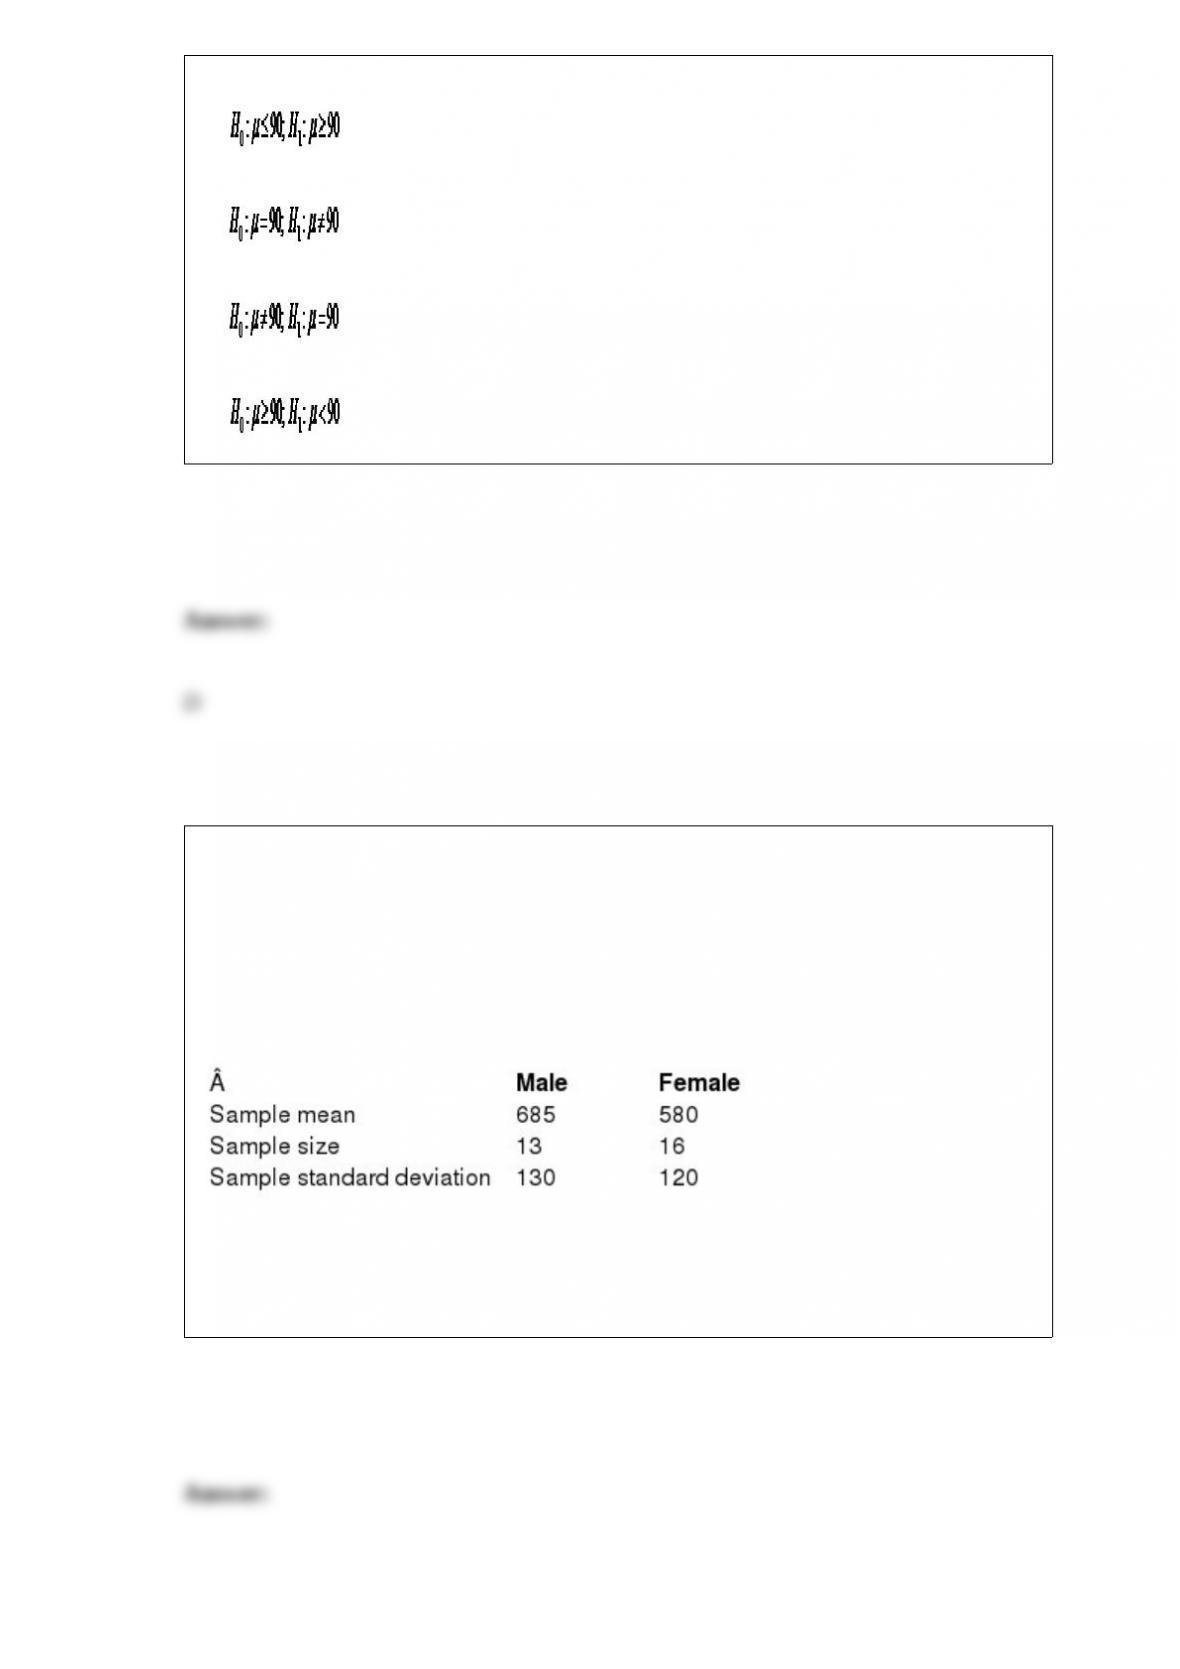
A golfer claims that his average golf score at the course he plays regularly is less than
90. The correct hypothesis statement for this golfer to prove his claim would be
____________________.
A)
B)
C)
D)
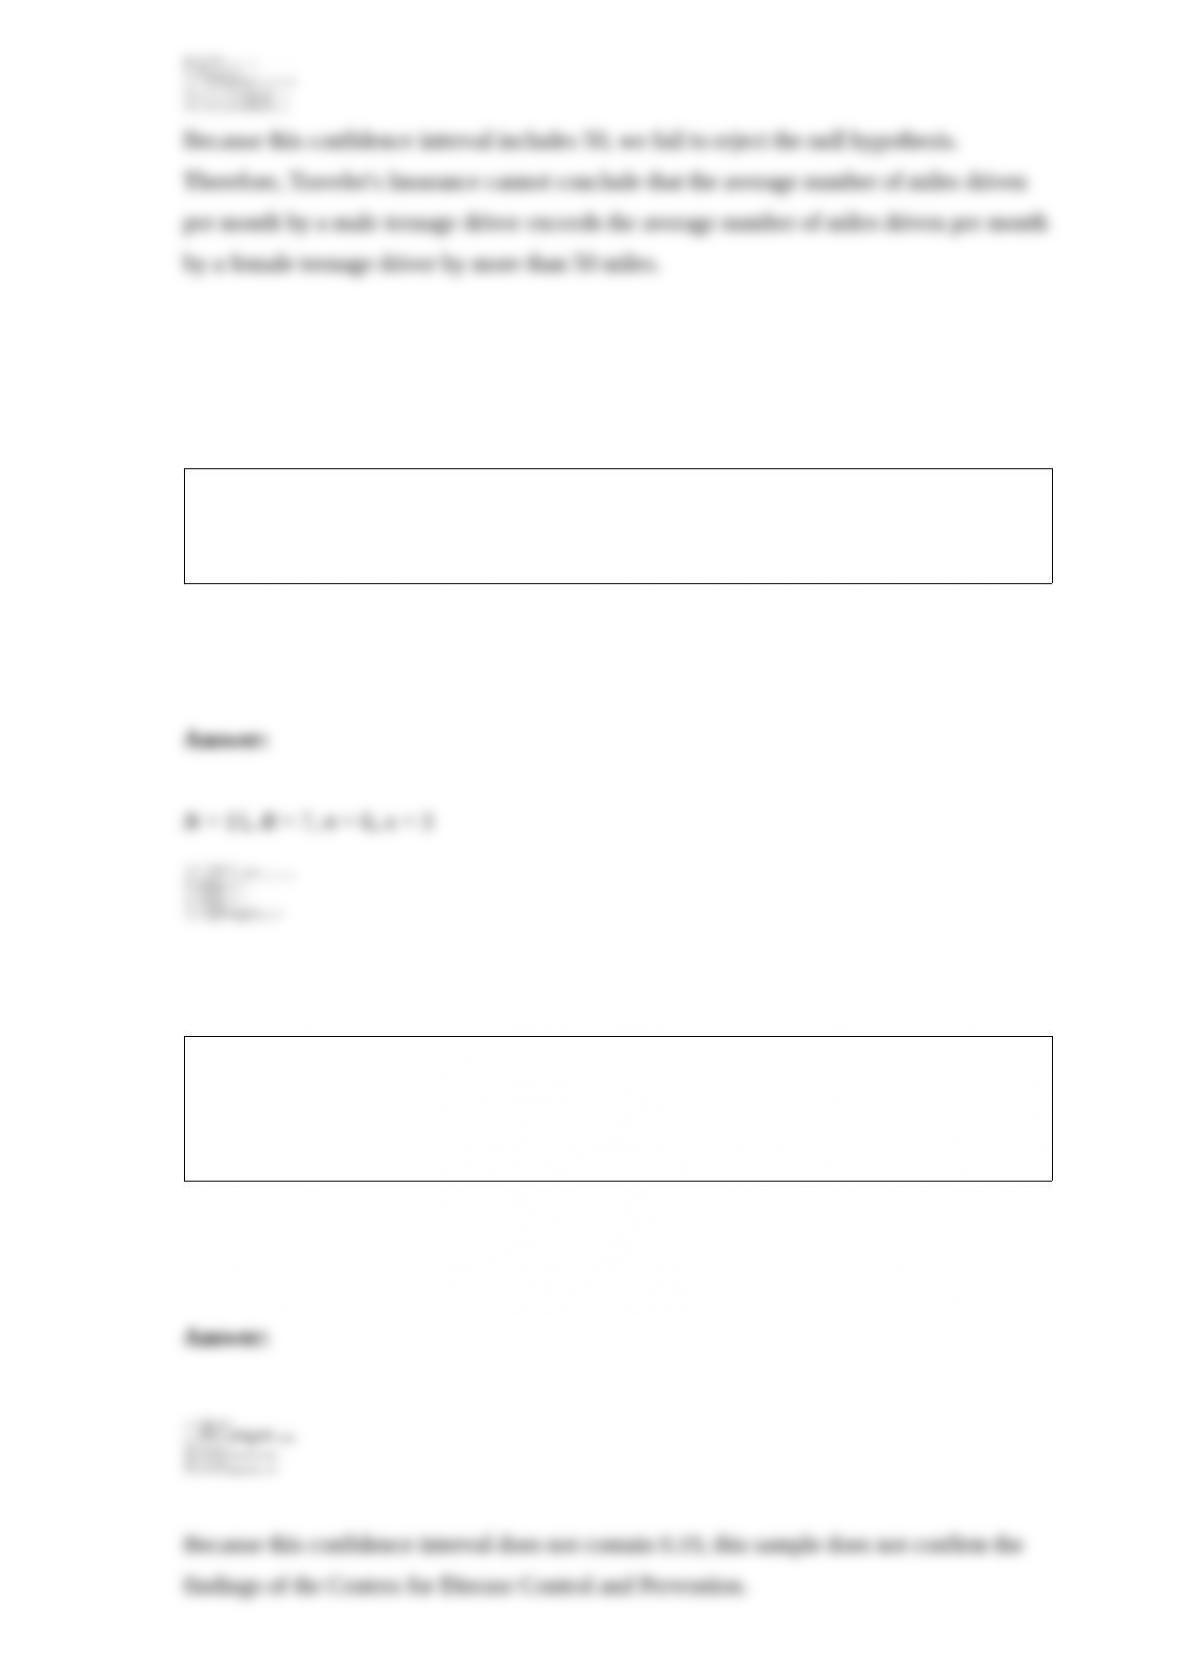
Traveler’s Insurance would like to test the hypothesis that the average number of miles
driven per month by a male teenage driver exceeds the average number of miles driven
per month by a female teenage driver by more than 50 miles. The following data
summarizes the sample statistics for the miles driven per month by each gender.
Assume that the population variances are equal.
Define Population 1 as male drivers and Population 2 as female drivers. Construct a
90% confidence interval for the difference in population mean and interpret the results.
A business school has 15 full-time faculty and seven of them have tenure. A random
sample of six faculty are randomly selected to form a committee. What is the
probability that three of the faculty on the committee have tenure?
The Centers for Disease Control and Prevention reported that 19% of U.S. adults are
cigarette smokers. A random sample of 160 adults contained 42 smokers. Use a 90%
confidence interval to confirm the findings of the Centers for Disease Control and
Prevention.
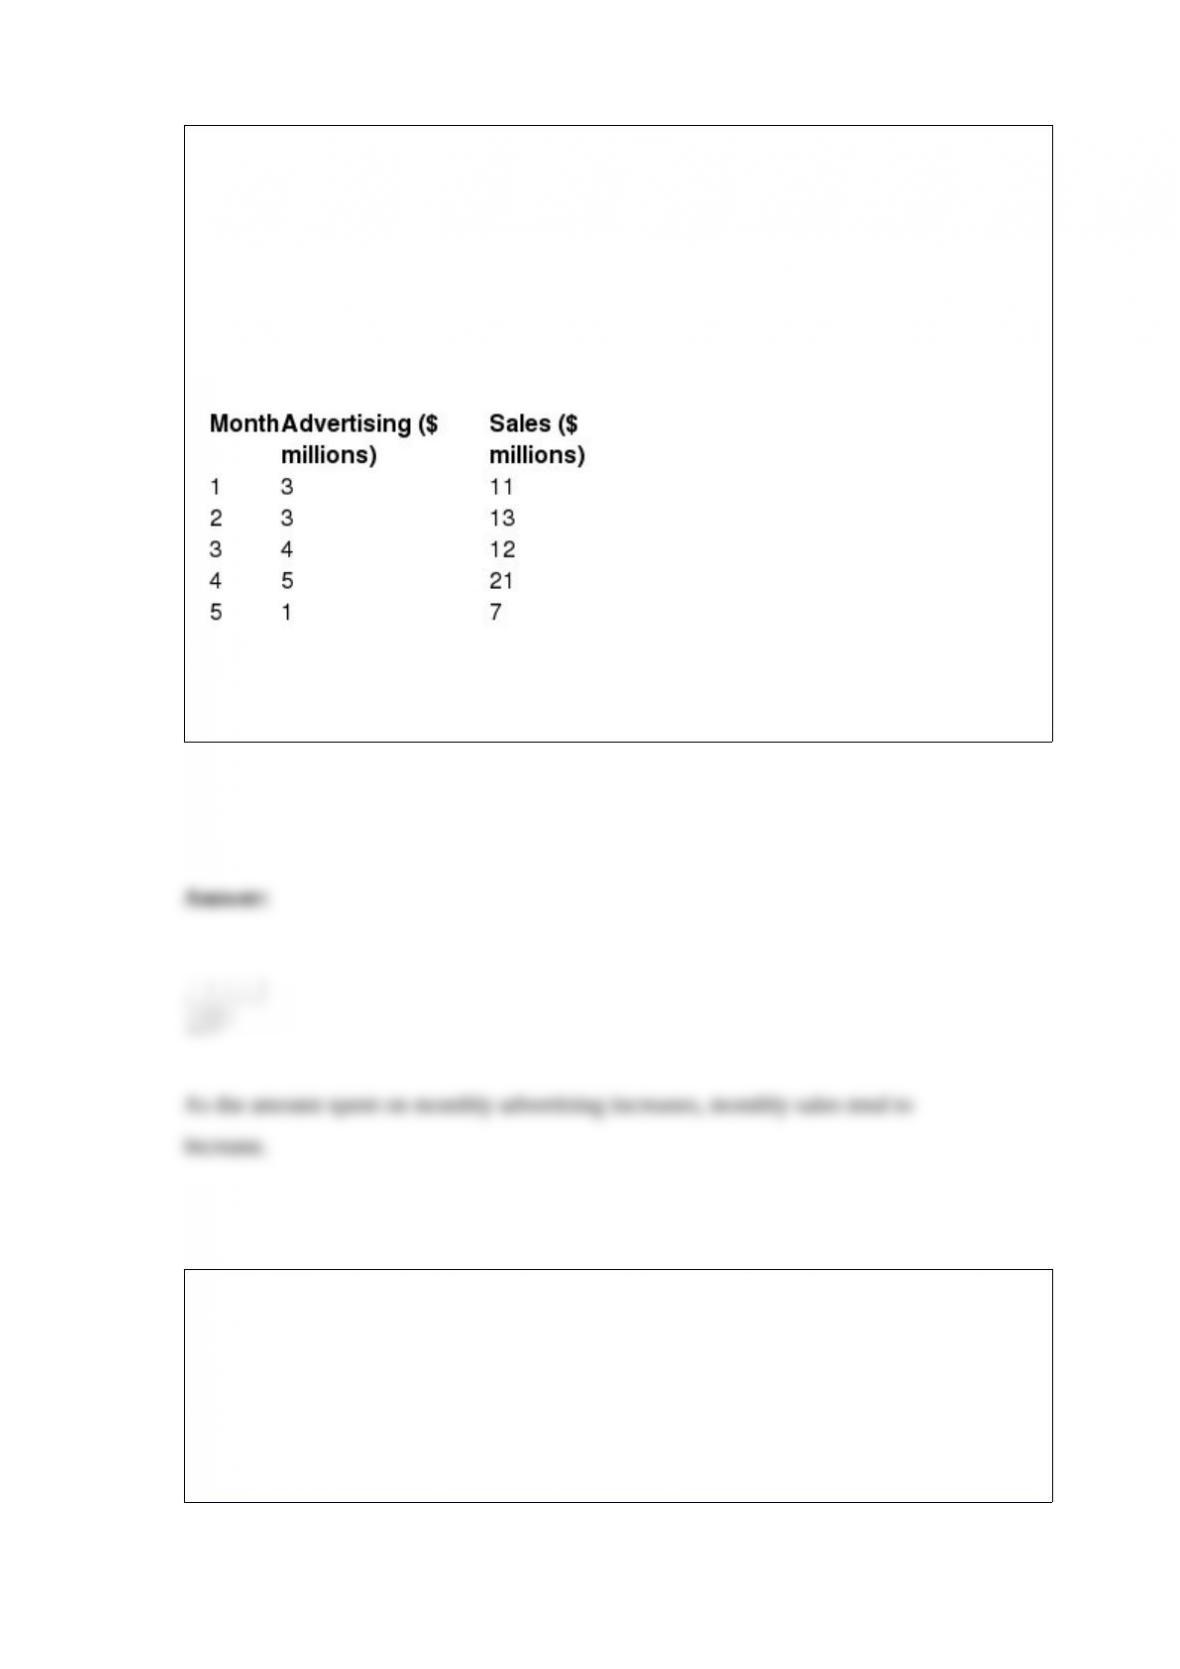
Use the information below to answer the following question(s).
Steve Taylor is the owner of Home Plus, which is a chain of home improvement stores.
He would like to investigate the relationship between month advertising and monthly
sales. The table below shows the amount spent on advertising, in millions of dollars,
over several months along with the corresponding sales, also in millions of dollars.
Use the Home Plus data to determine the correlation coefficient for this data and
interpret its meaning.
The Wall Street Journal reported that there is evidence that Mac users are shown more
expensive hotel prices when using Orbitz than PC users. Perform a hypothesis test to
determine if the average hotel price for Mac users on Orbitz is higher than for PC users.
The following data summarizes the sample statistics for hotel prices provided to each
type of user from Orbitz. Assume that the population variances are equal.
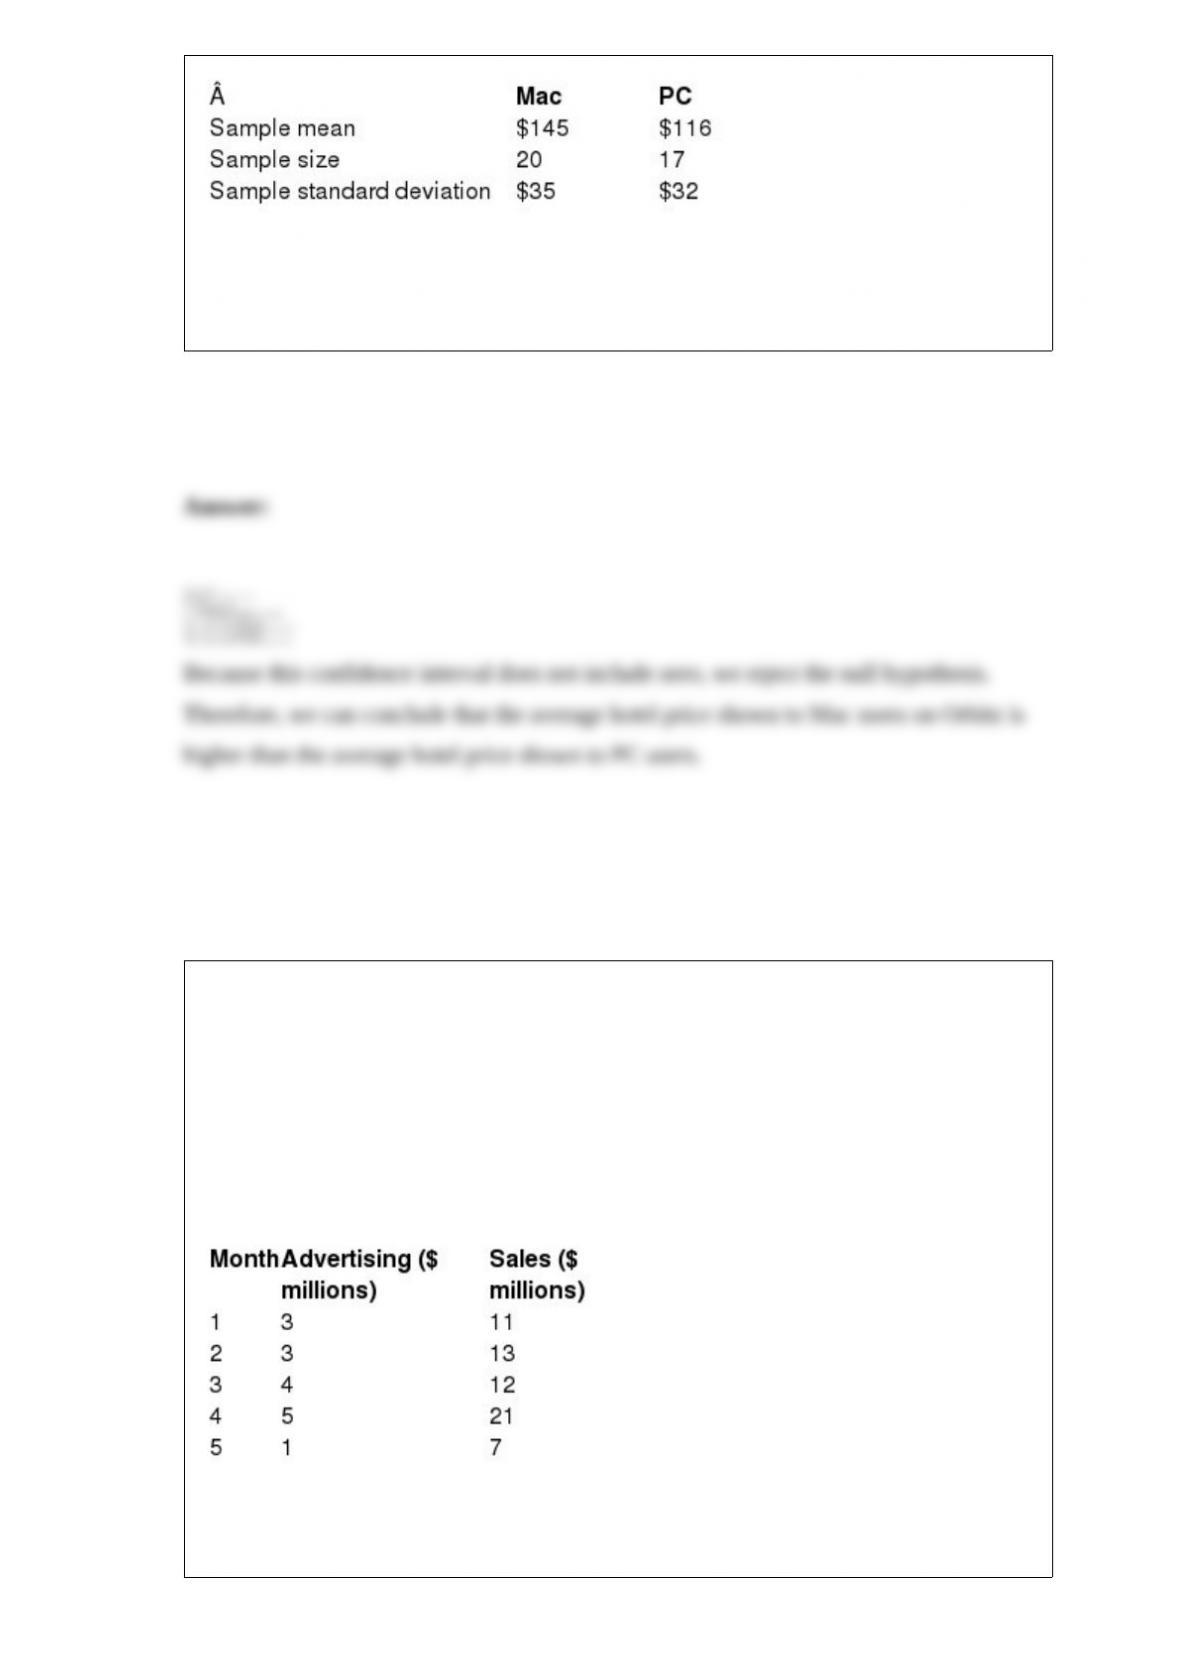
Define Population 1 as Mac users and Population 2 as PC users. Construct a 98%
confidence interval for the difference in population mean and interpret the results.
Use the information below to answer the following question(s).
Steve Taylor is the owner of Home Plus, which is a chain of home improvement stores.
He would like to investigate the relationship between month advertising and monthly
sales. The table below shows the amount spent on advertising, in millions of dollars,
over several months along with the corresponding sales, also in millions of dollars.
Use the Home Plus data to calculate the total sum of squares, sum of squares error, and
sum of squares regression.
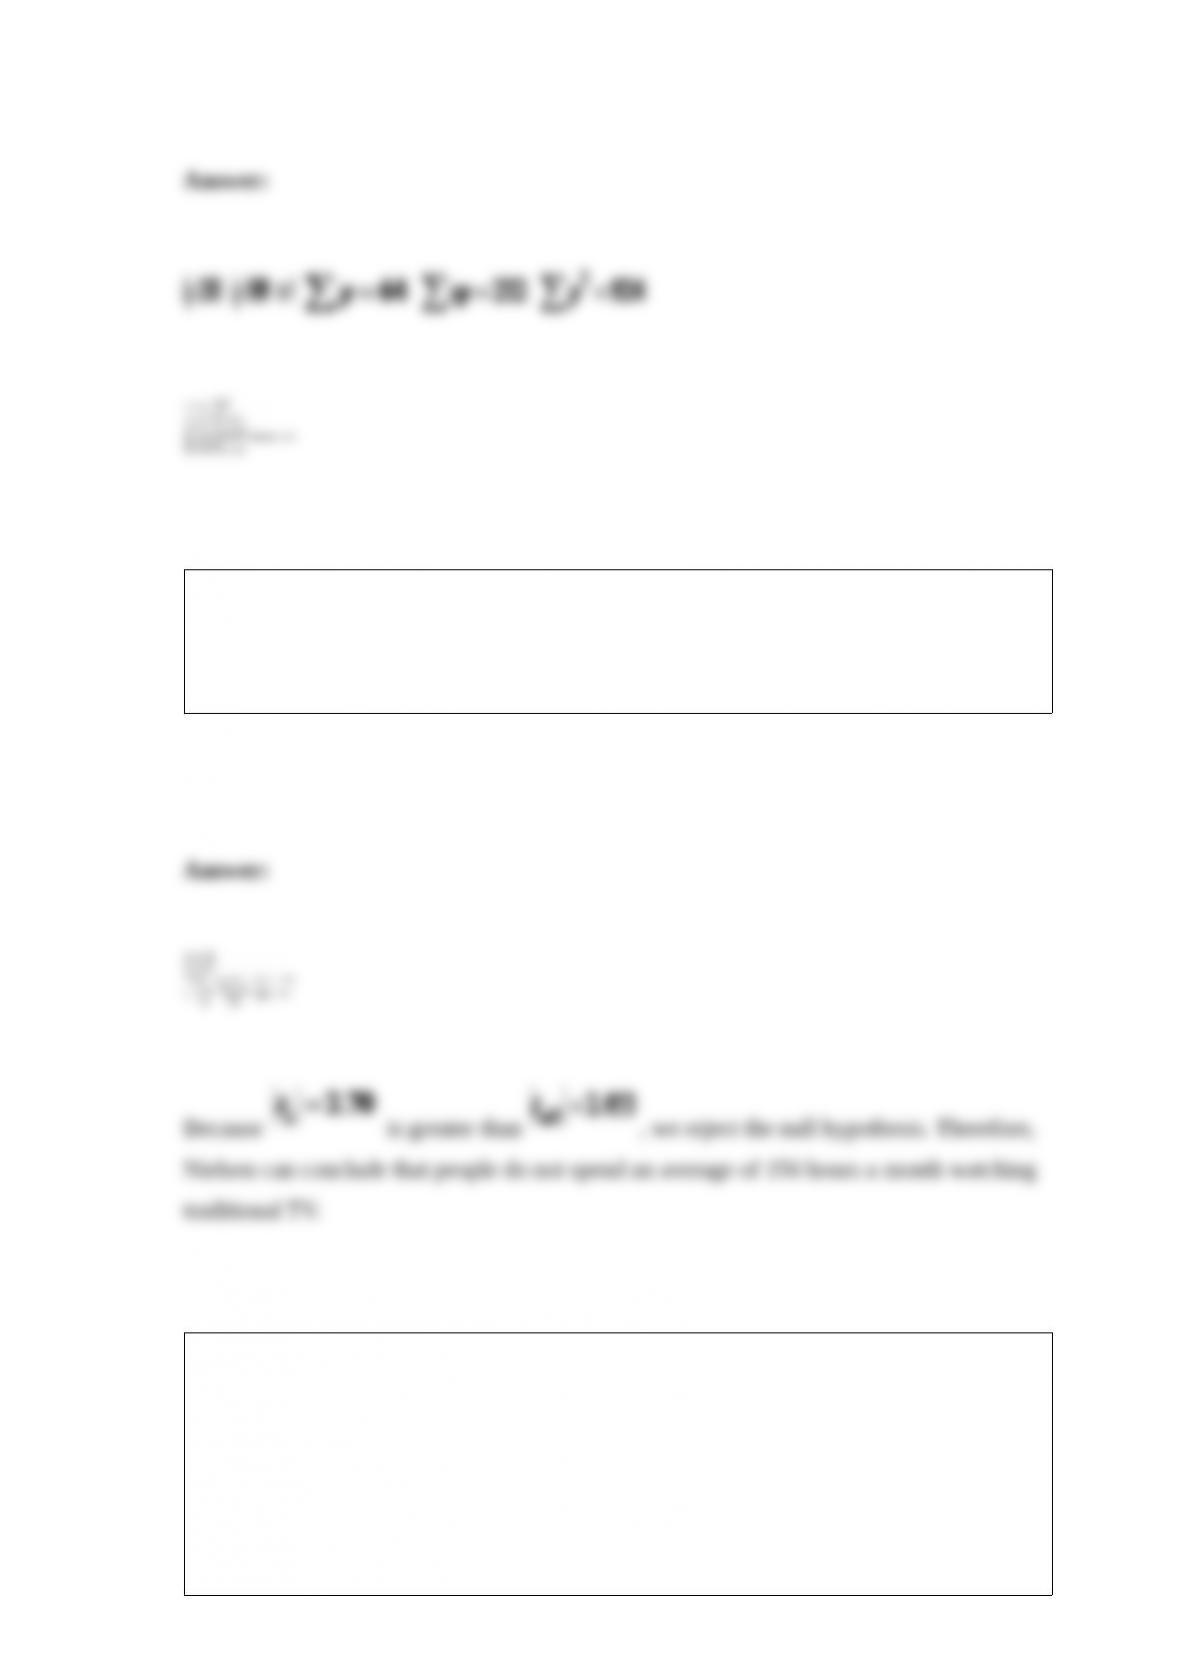
Suppose Nielsen would like to test the hypothesis that people spend an average of 156
hours a month watching traditional TV. A random sample of 32 people watched an
average of 140.7 hours of TV last month with a sample standard deviation of 32.1
hours. Test this hypothesis using α = 0.02 with the critical value approach.
The pH scale measures the amount of alkalinity or acidity in a liquid and ranges from 0
to 14. The ideal pH for a swimming pool is 7.2. A pH that is too high or low can cause
discomfort for the swimmers, especially in the eyes. Chemicals need to be added to the
water to adjust the pH to the desired level. Fifteen pH readings were taken at the Wilson
Community Pool from different locations at 10 am this morning. The average pH
reading from this sample was 7.02 with a standard deviation of 0.40. Using α = 0.05
and the p-value approach, determine if corrective action is needed at this pool to adjust
the pH value.