
1) A learning curve for an overqualified worker is higher than that for an average
worker.
2) The optimal solutions produced by quantitative techniques should always be
evaluated in terms of the larger framework.
3) Attribute data are counted, variable data are measured.
4) A learning percentage of 95 percent indicates greater learning than a percentage of 90
percent.
5) The average inventory level is inversely related to order size.
6) Some firms have structured their procurement function to include both centralized
and decentralized purchasing.
7) Disaggregating an aggregate plan leads to a master schedule.
8) Bullwhip effect refers to a phenomenon in which demand variations that exist at the
customer end of the supply chain are magnified as orders are generated back through
the supply chain.
9) Linear programming techniques will always produce an optimal solution to an LP
problem.
10) In exponential smoothing, an alpha of 1.0 will generate the same forecast that a
naive forecast would yield.
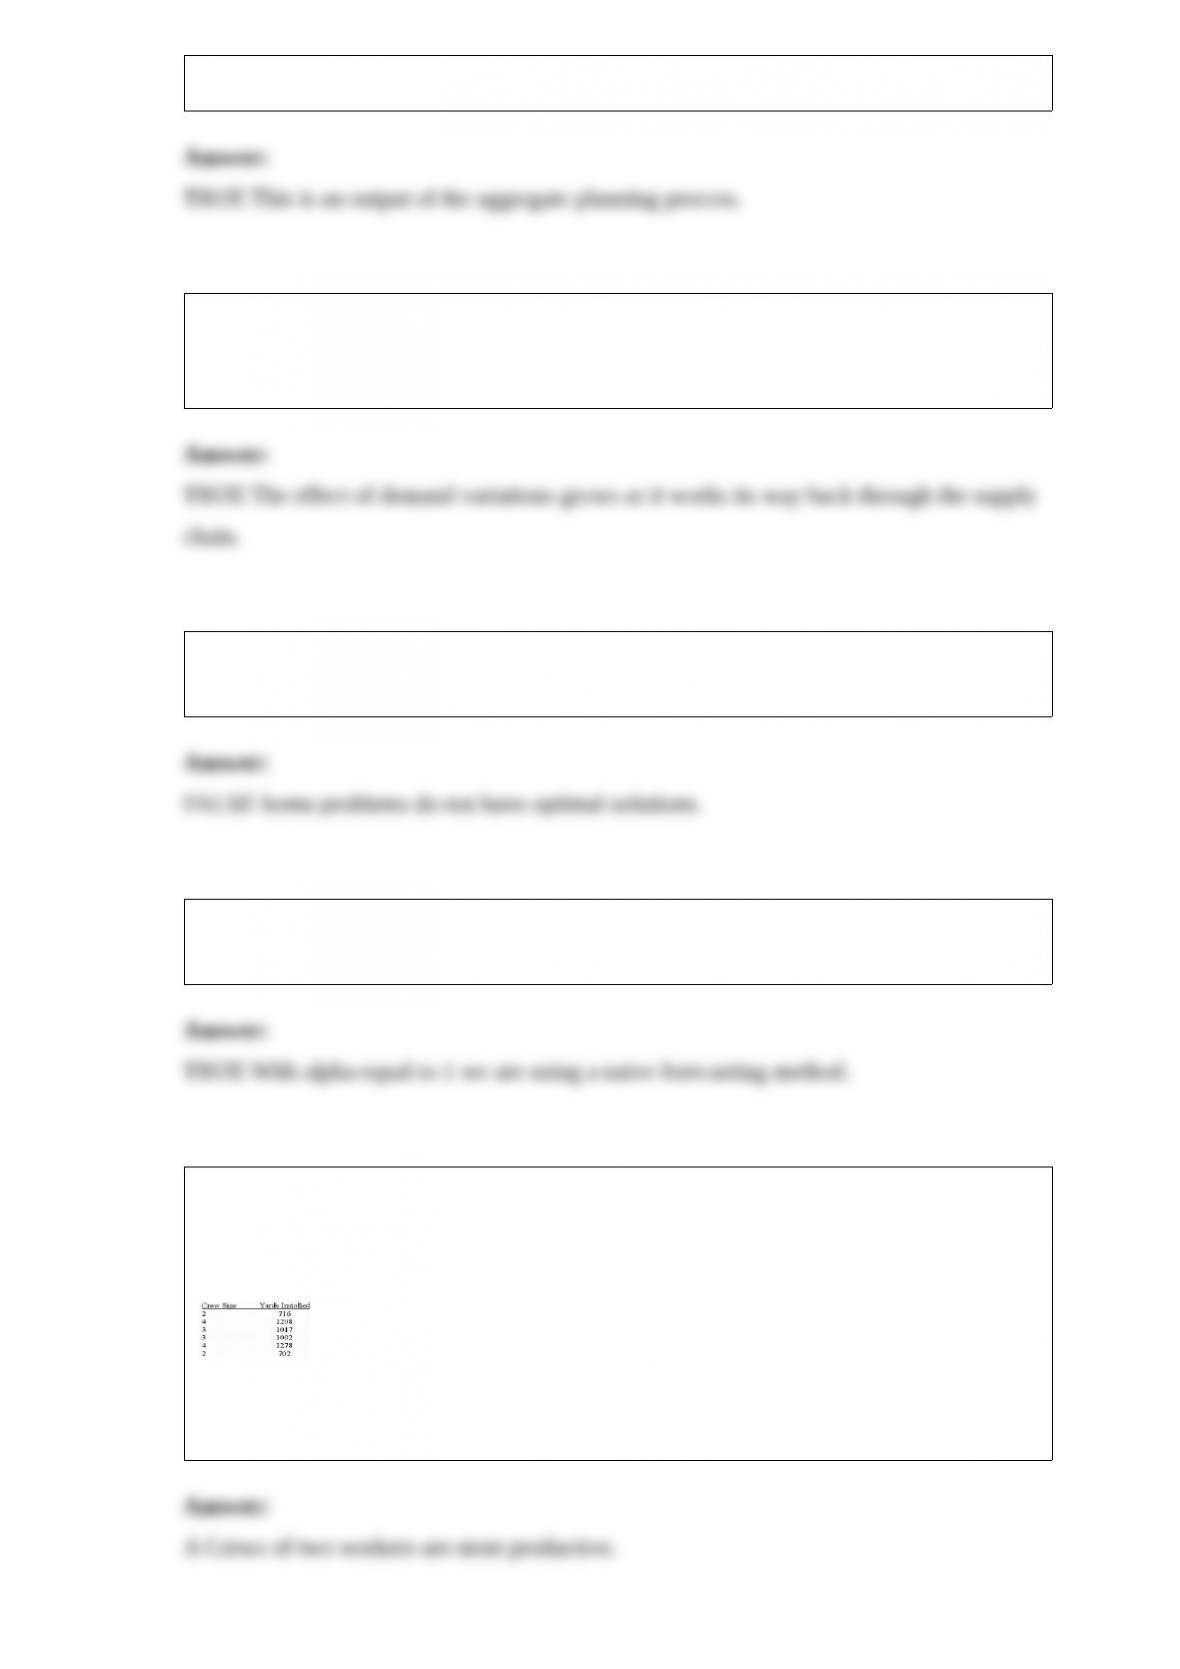
11) The manager of a carpet store is trying to determine the best installation crew size.
He has tried various crew sizes with the results shown below. Based on productivity,
what crew size do you recommend?
A.2
B.3
C.4
12) The type of processing system which is used for highly standardized products is:
A.continuous.
B.intermittent.
C.project.
D.batch.
E.unit.
13) A quality circle is:
A.responsible for quality.
B.total quality control.
C.an inspection stamp found on meat.
D.a voluntary group of employees.
E.a team of customers and their contacts within the company.
14) The two different approaches to load work centers in job-shop scheduling are:
A.load charts and schedule charts.
B.Gantt charts and assignment method.
C.infinite loading and finite loading.
D.linear programming and makespan.
E.infinite charting and finite charting.
15) Process chart symbols do not include:
A.delay.
B.inspection.
C.operation.
D.rejection.
E.storage.
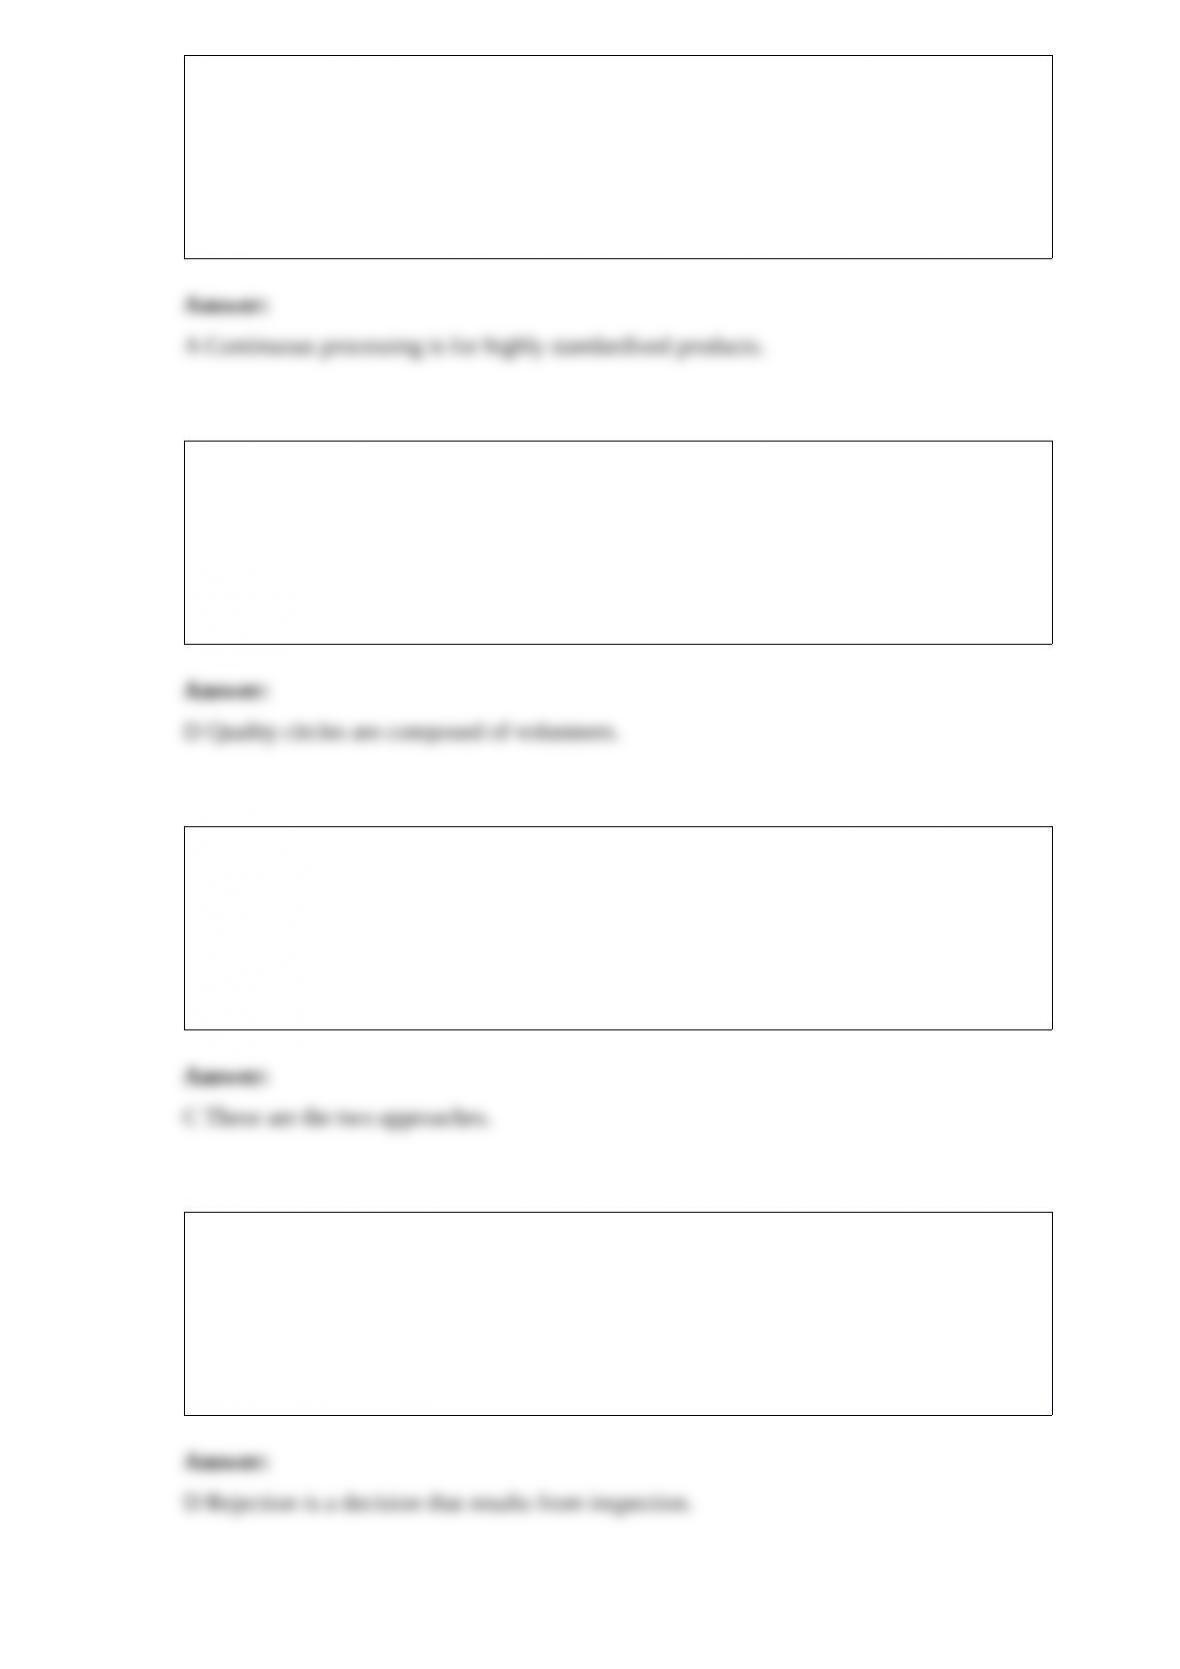
16) A project is represented by the following diagram:
The expected duration of this project is:
A.13
B.15
C.20
D.52
E.81
17) An investment proposal will have annual fixed costs of $60,000, variable costs of
$35 per unit of output, and revenue of $55 per unit of output.
(A) Determine the break-even quantity.
(B) What volume of output will be needed to produce an annual profit of $60,000?
FC = $60,000 per year, VC = $35 per unit, REV = $55 per unit
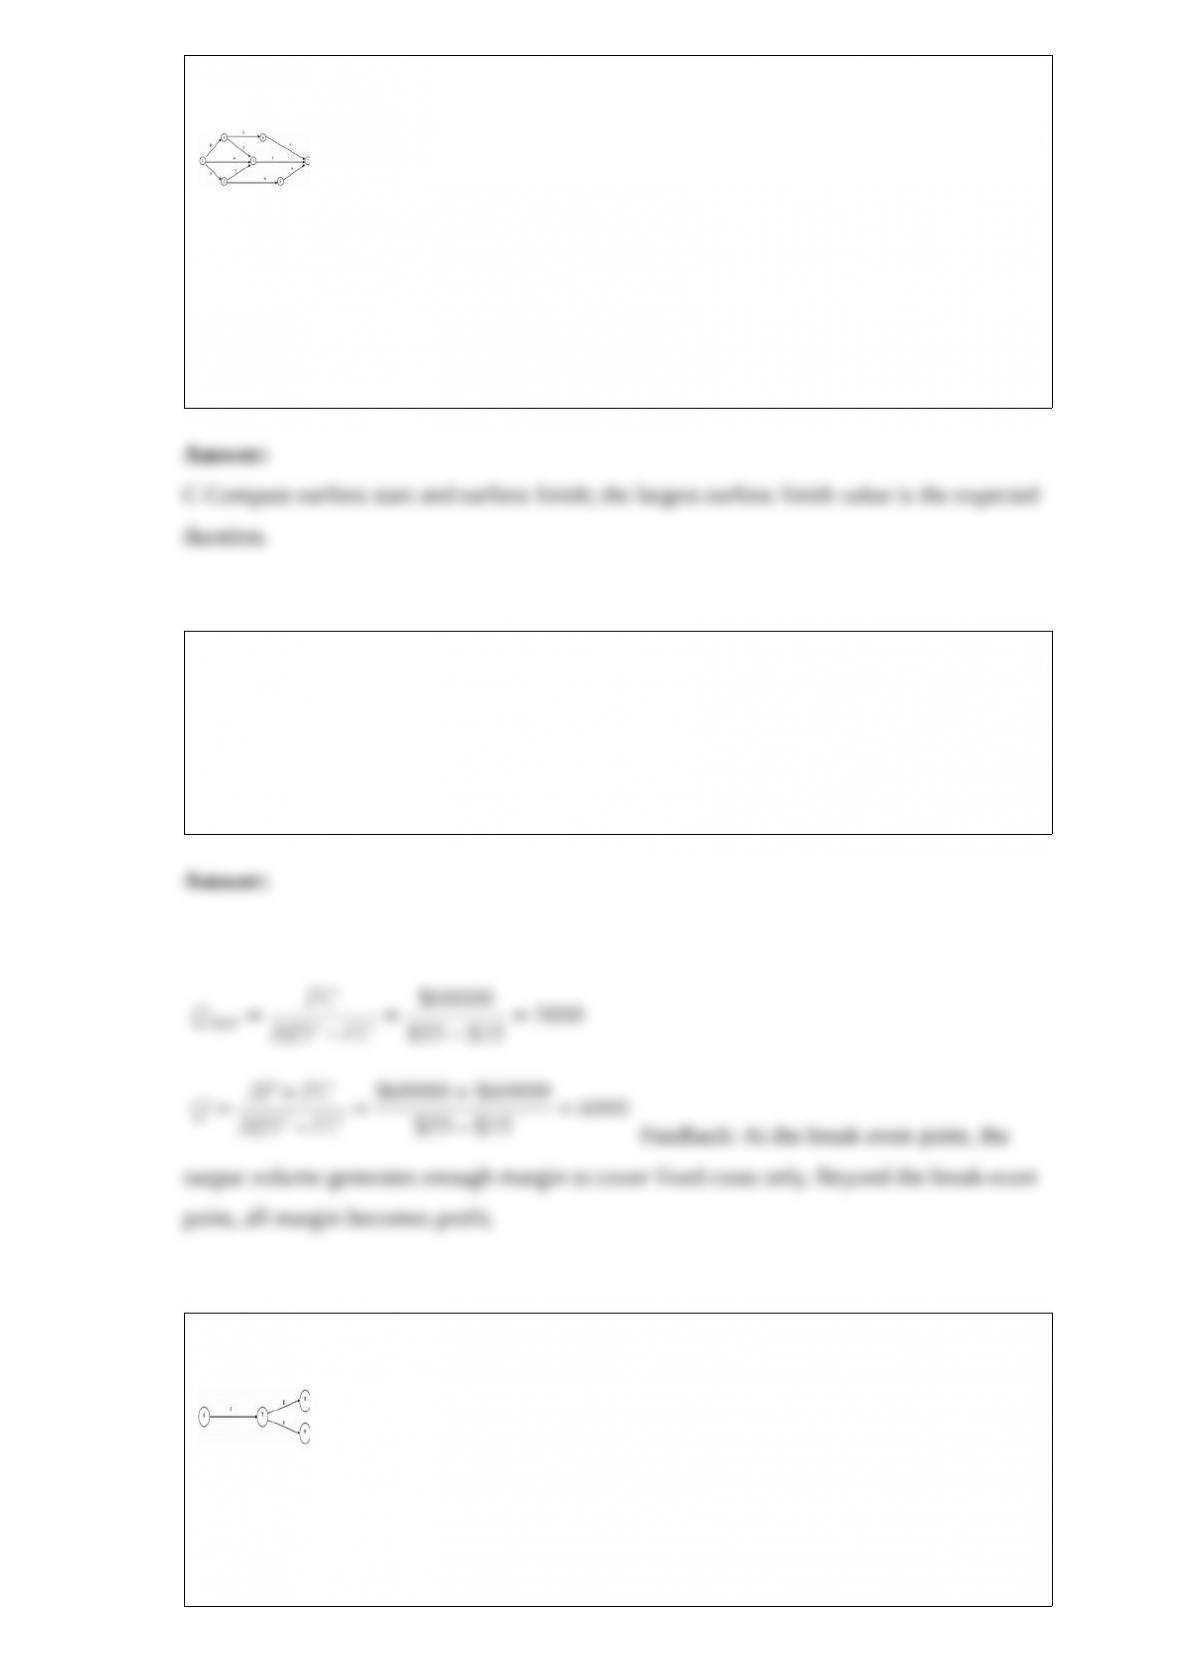
18) Consider the portion of a project depicted by this graph:
What is the latest start time of activity 6-7 if the latest finish of activity 7-8 is 26, and
the latest finish of activity 7-9 is 23?
A.18
B.17
C.13
D.12
E.10
19) Proactive and reactive aggregate planning strategies are best associated with:
A.input and output.
B.make and buy.
C.quantitative and qualitative.
D.exact and approximate.
E. demand and capacity options.
20) If customer satisfaction does not always lead to customer loyalty, firms may need to
focus additional effort on __________ strategies.
A.remediation
B.retention
C.rework
D.repatriation
E.reprocessing
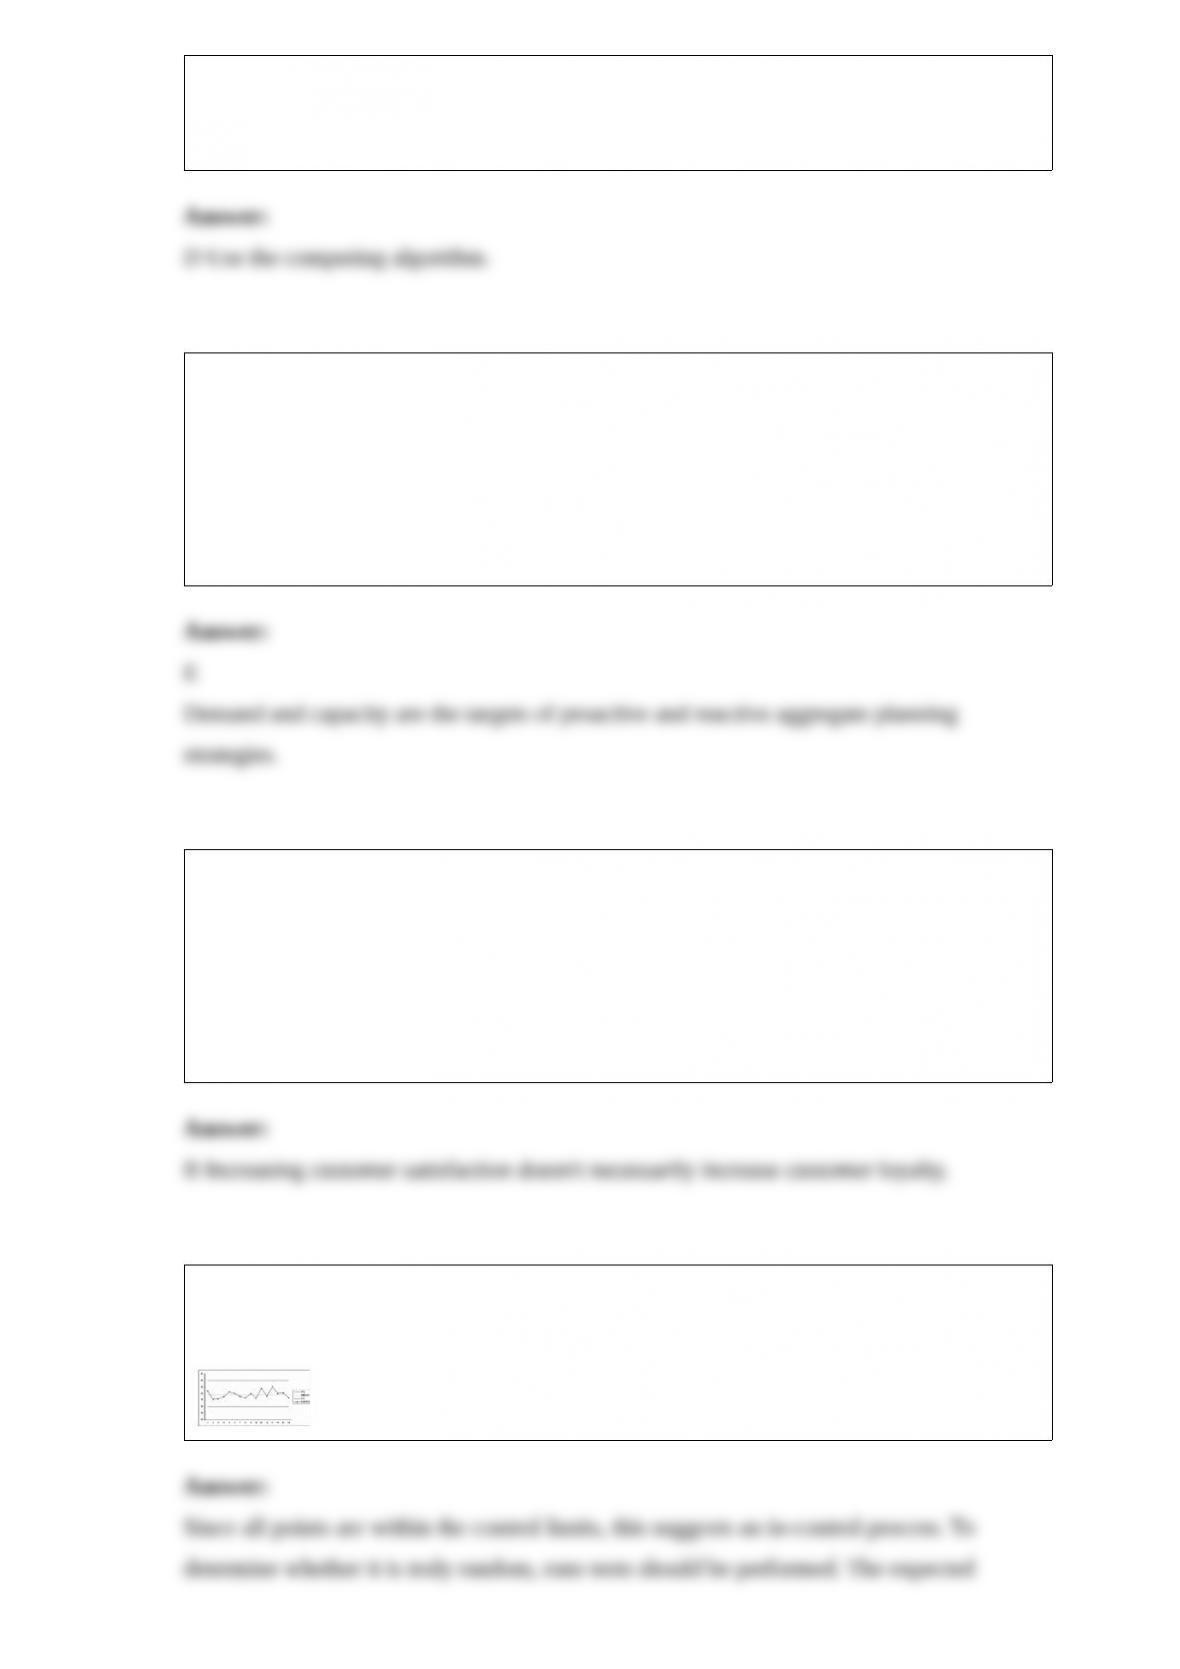
21) The following chart depicts 16 sample means that were taken at periodic intervals
and plotted on a control chart. Does the output appear to be random?
22) Consider the following information:
What are total back order costs?
23) Consider the following work breakdown structure:
What is the estimated standard deviation (in weeks) for the critical path completion
time?
24) Consider these data regarding the multiple-server, priority service queuing model:
Service Rate: 2 per hour (Poisson)
Number of Servers: 5
What is system utilization?
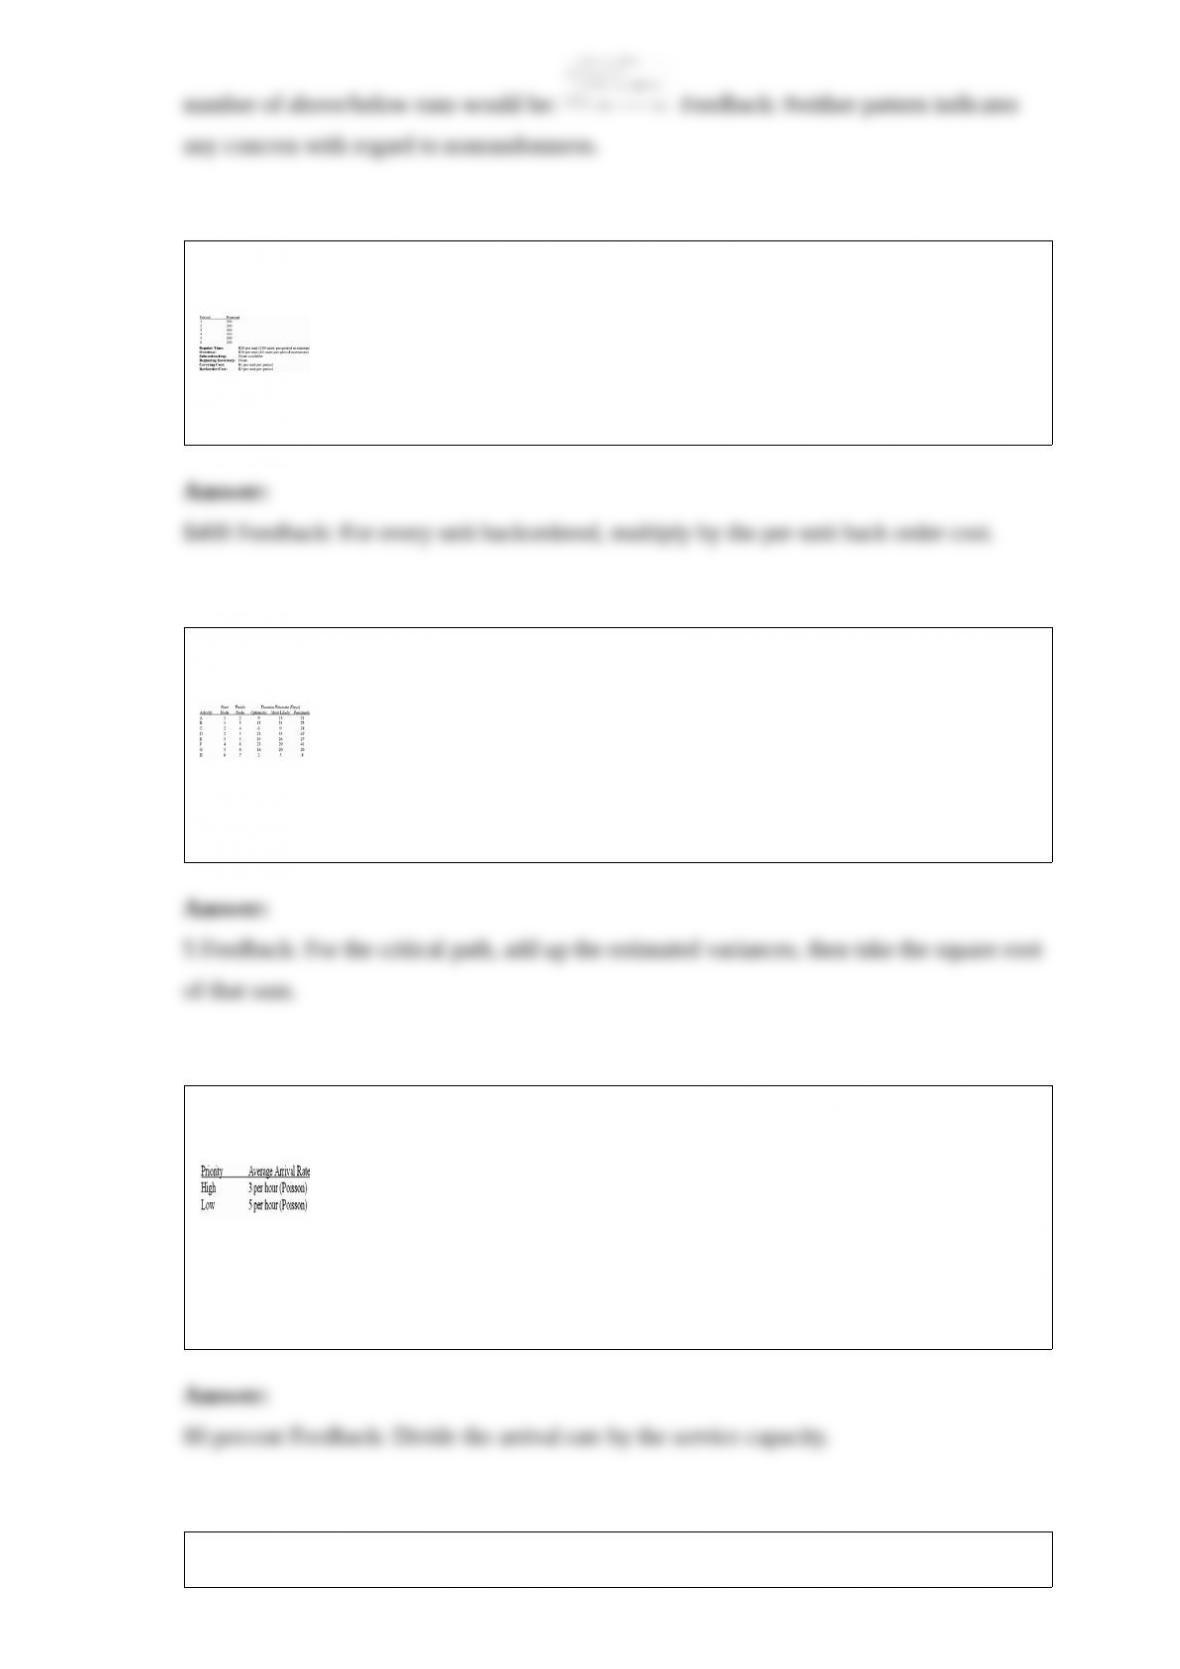
25) Given the following data for a particular inventory item:
For the economic order quantity, what are average weekly ordering costs?
26) Given the following line balance data:
For eight hours of operating time per day and a desired output rate of 960 units per day,
what is the efficiency for the balance which uses the minimum number of stations?
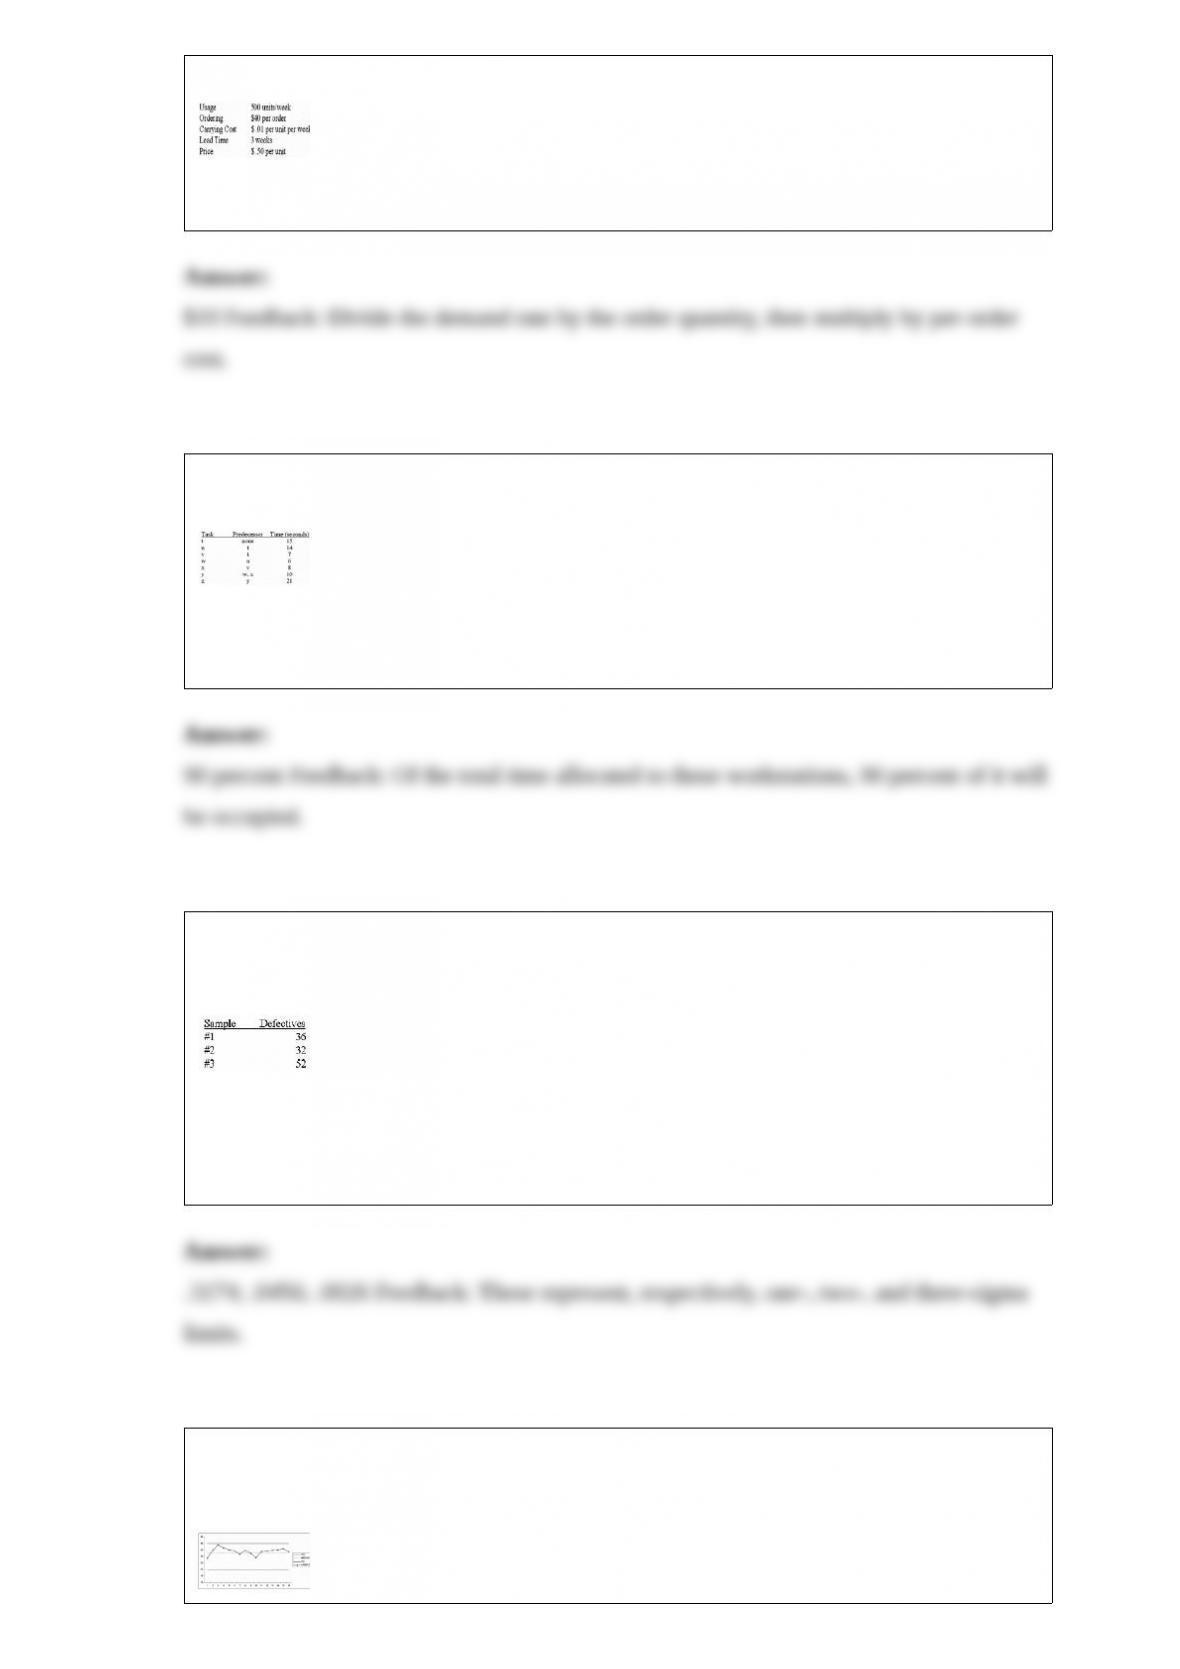
27) Given the following process control data for a quality attribute (three samples of
size 400 each):
If the process proportion of defectives is unknown, what is the alpha risk (probability of
Type I error) for upper and lower control limits of .115 and .085 respectively? .13 and .
07? .145 and .055?
28) Given the following control chart, would you say that the process appears to be
performing appropriately?