
A confidence interval for the population mean is meant to contain a specified
percentage of the individual population measurements.
Regression models that employ more than one independent variable are referred to as
multiple regression models.
An event is a collection of sample space outcomes.
When the level of confidence and sample proportion remain the same, a confidence
interval for a population proportion, p, based on a sample of n = 100 will be wider than
a confidence interval for p based on a sample of n = 400.

A tire manufacturer needs to choose the production level for the coming month (high
vs. low). The level of production largely depends on the level of demand. For this
situation, the level of demand (high, medium, low) is the state of nature.
To avoid overfitting in a neural network model, the parameter estimates that are used
minimize the least squares criterion.
A quantitative variable can also be referred to as a categorical variable.

In one-way ANOVA, the numerator degrees of freedom equals the number of samples
being compared.
When evaluating a new process, using the square root of the upper end of the
confidence interval for σ2 gives an estimate of the smallest that σ for the new process
might reasonably be.
Depending on the mean of the Poisson distribution, the distribution can either be very
skewed to the right or quite symmetrical.

The actual counts in the cells of a contingency table are referred to as the expected cell
frequencies.
The larger the p-value, the more we doubt the null hypothesis.
The standard deviation of the sampling distribution of the sample mean is σ.

The more variable that the population measurements are, the larger the sample size that
is needed to accurately estimate at a specific confidence level.
Treemaps are used to display qualitative measures of performance.
A probability model is a mathematic representation of a random phenomenon.

The smoothing constant is a number that determines how much weight is attached to
each observation.
A statistical model is a set of assumptions based solely on the sample data that have
been selected.
First, a 90 percent confidence interval is constructed from a sample size of 100. Then,
for the same identical data, a 92 percent confidence interval is constructed. The width of
the 90 percent interval is wider than the 92 percent confidence interval.

An assumption of the Wilcoxon rank sum test is that the variances of the two
populations are equal.
Dummy variables are used to model increasing seasonal variation.
Sigma level capability is the number of estimated process standard deviations between
the estimated process mean and the specification limit closest to the estimated process
mean.

When the null hypothesis is not rejected, there is no possibility of making a Type I
error.
When solving for the sample size needed to compute a 95 percent confidence interval
for a population proportion p, having a given error bound E, we choose a value of
that makes as small as reasonably possible.
In one-way ANOVA, other factors being equal, the further apart the treatment means
are from each other, the more likely we are to reject the null hypothesis associated with
the ANOVA F test.

A neural network model is nonlinear.
Prescriptive analytics involve methods used to find anomalies, patterns, and
associations in data sets with the purpose of predicting future outcomes.
In order to select a stratified random sample, we divide the population into overlapping
groups of similar elements.

The sampling distribution of a sample statistic is the probability distribution of the
population of all possible values of the sample statistic.
When calculating the geometric mean, a quantity of 1 is added to the nth root of the
product (1 + R1)(1 + R2) . . . (1 + Rn).
If a process is only influenced by common causes of variation, we can state that the
process is in statistical control.

The method of assigning probabilities when all outcomes are equally likely to occur is
called the classical method.
Process leeway is the distance between natural tolerance limits and control limits.
Holt-Winters double exponential smoothing would be an appropriate method to use to
forecast a time series that exhibits a linear trend with no seasonal or cyclical patterns.
In the first step of setting up a Pareto chart, a frequency table should be constructed of
the defects (or categories) in decreasing order of frequency.

A univariate time-series model is used to predict future values of a time series based
only upon past values of a time series.
The expected monetary value criterion is best used when a large number of similar
decisions will be made.
A cholesterol test was given to ten heart patients with high cholesterol levels. The same
ten heart patients are then given a new cholesterol-reducing drug for six months. Before
the patients begin taking the drug, they are told to maintain their current diets and
eating habits so that the effect of the drug can be more effectively determined. After
taking the drug for six months, the same patients are given a cholesterol test again. The
pharmaceutical company that manufactures the drug wants to determine if the drug is
helpful in reducing cholesterol levels. The cholesterol level readings are not normally
distributed. State the alternative hypothesis for this problem.
A. The probability distribution of cholesterol readings of patients before and after the

trials is identical.
B. The probability distribution of cholesterol readings at the end of six months has
shifted to the left of the probability distribution of cholesterol readings at the beginning
of the trials.
C. The probability distribution of cholesterol readings at the end of six months has
shifted to the right of the probability distribution of cholesterol readings at the
beginning of the trials.
D. The probability distribution of cholesterol readings of patients at the end of six
months has shifted to the right or left of the probability distribution of cholesterol
readings at the beginning of the trials.
What is the probability that any two people chosen at random were born on the same
day of the week?
A. 1/7
B. 1/49
C. 2/7
D. 2/49
The number of estimated process standard deviations between and the closest
specification limit is the _____________ of the process.

A. sigma level capability
B. leeway
C. mean
D. capability
A probability distribution that describes the time or space between successive
occurrences of an event is a(n) ____________ probability distribution.
A. binomial
B. uniform
C. exponential
D. normal
Which one of the following nonparametric methods can be used to compare more than
two independent populations in a single test?
A. Wilcoxon signed ranks test
B. sign test
C. Kruskal-Wallis test
D. Wilcoxon rank sum test

E. Spearman’s test
Packages of sugar bags for Sweeter Sugar Inc. have an average weight of 16 ounces and
a standard deviation of 0.3 ounces. The weights of the sugar packages are normally
distributed. What is the probability that 9 randomly selected packages will have an
average weight in excess of 16.025 ounces?
A. .5987
B. .0062
C. .4013
D. .9938
Assume that the following data set is not normally distributed.
(21, 18, 4, 9, 14, 16, 17, 12, 15, 8, 7, 5)
If Ha: Md < 6, then the value of S is
A. 0.
B. 1.
C. 2.

D. 3.
E. 4.
If the mean is greater than the median, then the distribution is ___________.
A. skewed right
B. skewed left
C. symmetrical
D. bimodal
A plant manager knows that the number of boxes of supplies received weekly is
normally distributed with a mean of 200 and a standard deviation of 20. What
percentage of the time will between 180 and 210 boxes of supplies arrive in a week?
A. 69.15%
B. 19.15%
C. 53.28%
D. 15.87%

Since a(n) ____________ index employs the base-period quantities in all succeeding
periods, it allows for ready comparisons for identical quantities of goods purchased
between the base period and all succeeding periods.
A. simple
B. aggregate
C. Laspeyres
D. Paasche
E. quantity
A lawyer believes that the probability is .3 that she can win a discrimination suit. If she
wins the case, she will make $400,000; but if she loses, she gets nothing. Assume that
she has to spend $75,000 preparing the case. What is her expected gain?
A. $325,000
B. $45,000
C. $150,000
D. $22,500

As the Type II error, β,of a statistical test increases, the power of the test
_____________.
A. increases
B. decreases
C. stays the same
D. randomly fluctuates
In a local survey, 100 citizens indicated their opinions on a revision to a local land-use
plan. Of the 62 persons giving favorable responses, 40 were males. Of the 38 giving
unfavorable responses, 15 were males. If one citizen is randomly selected, find the
probability that person is female or has an unfavorable opinion.
A. 0.83
B. 0.17
C. 0.51
D. 0.60
E. 0.61
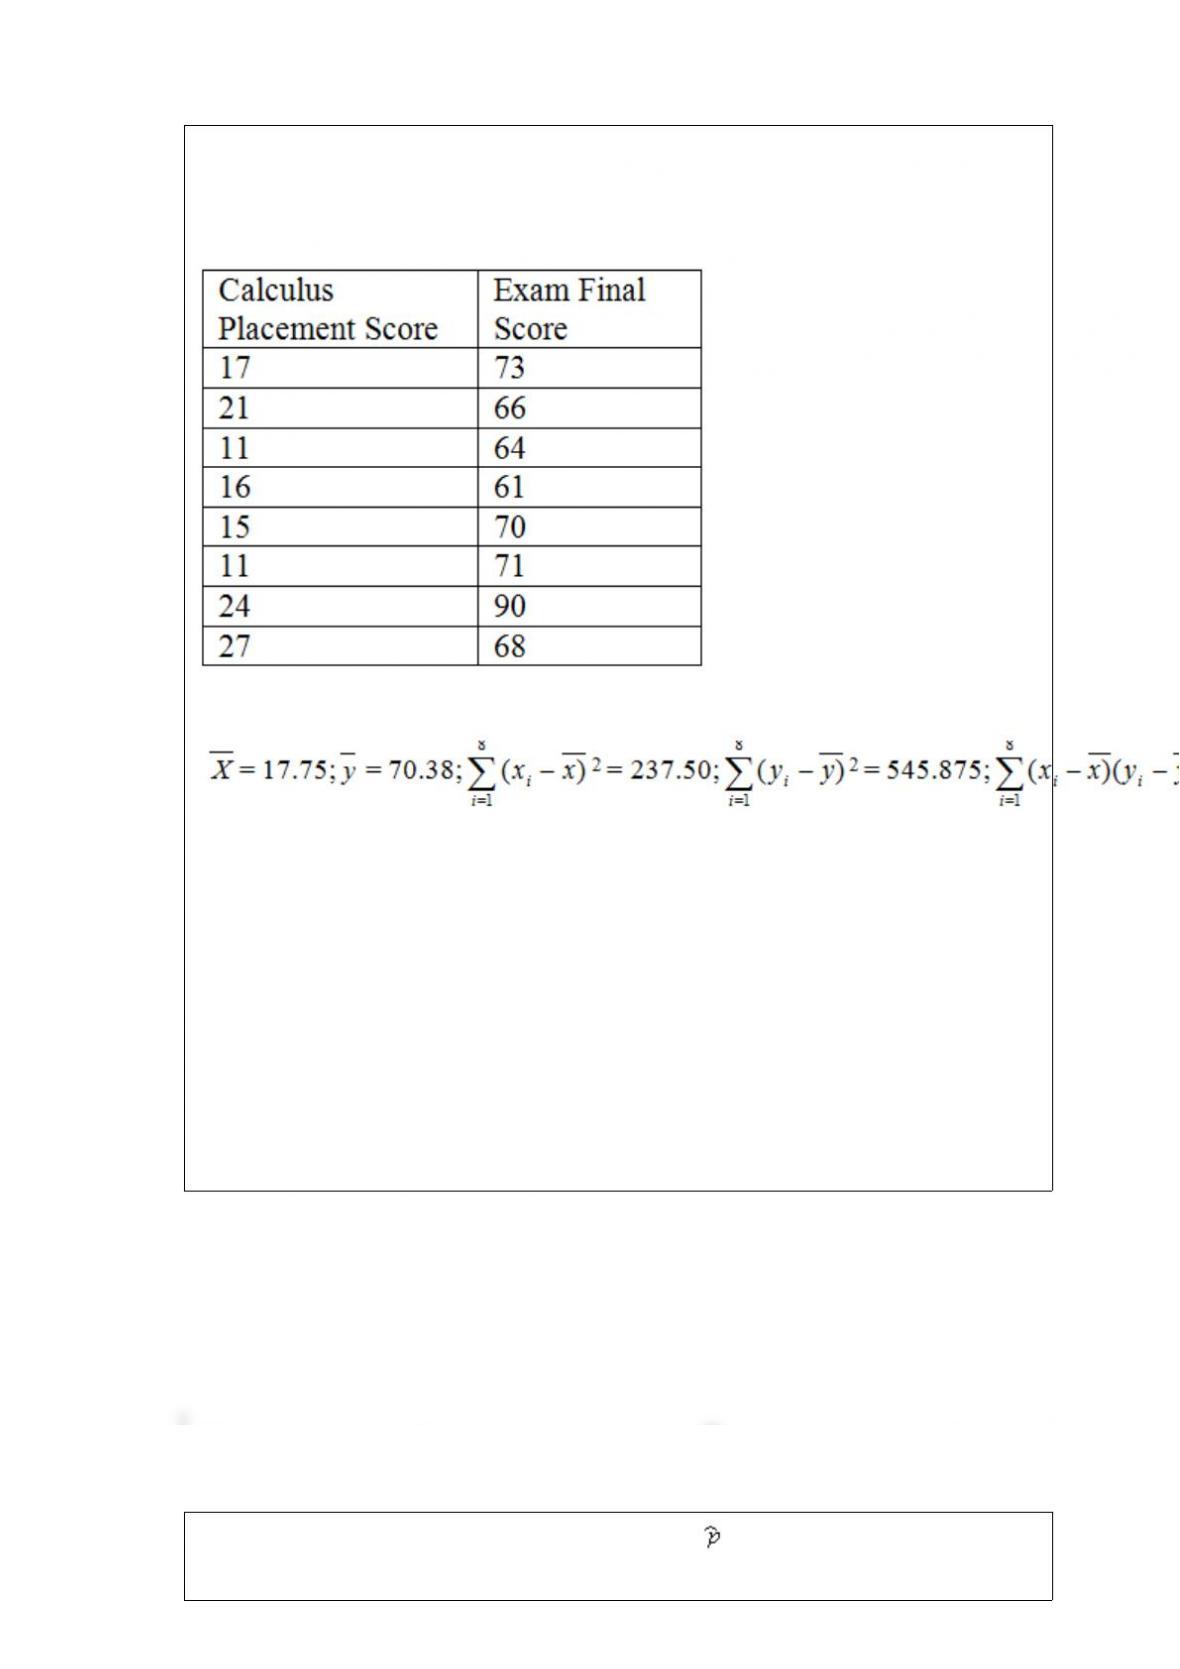
In a study of the factors that affect success in economics, data were collected for 8
business students. Scores on a calculus placement test are given with economics final
exam scores. The data are below.
It can be shown that for these data:
Calculate the sample correlation coefficient.
A. 0.15
B. 0.11
C. 0.39
D. −0.39
E. −0.11
When the level of confidence and sample proportion remain the same, a confidence
interval for a population proportion p based on a sample of n = 100 will be

______________ a confidence interval for p based on a sample of n = 400.
A. wider than
B. narrower than
C. equal to
The diameter of small Nerf balls manufactured overseas is expected to be
approximately normally distributed with a mean of 5.2 inches and a standard deviation
of .08 inches. Suppose a random sample of 20 balls is selected. What percentage of
sample means will be less than 5.14 inches?
A. 0.043%
B. 22.66%
C. 4.3%
D. .00043%
When the level of confidence and sample standard deviation remain the same, a
confidence interval for a population mean based on a sample of n = 100 will be
______________ a confidence interval for a population mean based on a sample of n =
50.
A. wider than
B. narrower than

C. equal to
The mean square error of a multiple regression model with k independent variables and
n observations is __________.
A. SSE/n
B. SSE/[n + (k+1)]
C. SSE/[n− (k+1)]
D. SSE/(k+1)
If the wages of workers for a given company are normally distributed with a mean of
$15 per hour, then the proportion of the workers earning more than $13 per hour
A. is greater than the proportion earning less than $13 per hour.
B. is greater than the proportion earning less than $18 per hour.
C. is less than 50 percent.
D. is less than the proportion earning more than the mean wage.

In a multiple regression analysis, the current model has three independent variables.
The analyst decides to add another (fourth) independent variable while retaining the
other three independent variables. As a result of this addition, the value of MSE will
____________ decrease.
A. always
B. sometimes
C. never
The y-intercept (β0) in a multiple regression model represents the estimated value of the
__________ variable, when the value of all independent variables are _________.
A. response, one
B. dummy, zero
C. response, zero
D. dummy, one
Any value of the error term in a regression model _____________ any other value of
the error term.
A. increases with

B. is dependent on
C. is independent of
D. is exactly the same as
The average life of Canadian women is 73.75 years, and the standard deviation of the
life expectancy of Canadian women is 6.5 years. Using Chebyshev’s Theorem,
determine the minimum percentage of women in Canada whose life expectancy is
between 64 and 83.5 years.
A. 93.17%
B. 68.26%
C. 55.56%
D. 88.89%
E. 33.33%
In simple regression analysis, the quantity is called the __________ sum of
squares.
A. total
B. explained
C. unexplained

D. error
If a control chart is used correctly and the necessary corrective actions are taken, then
as the control limits get close to each other, the potential quality of the product
_____________.
A. decreases
B. increases
C. stays the same
D. fluctuates
The manager of the local grocery store has determined that, on average, 4 customers
use the service desk every half-hour. Assume that the number of customers using the
service desk has a Poisson distribution. What is the probability that during a randomly
selected half-hour period, no more than 2 customers use the service desk?
A. .2381
B. .1465
C. .7619
D. .8535
E. .0916

An experiment consists of 400 observations and four mutually exclusive groups. If the
probability of a randomly selected item being classified into any of the four groups is
equal, then the expected number of items that will be classified into group 1 is _____.
A. 25
B. 100
C. 125
D. 150
In the quadratic regression model y = β0 + β1X1 + β2X12 + ε, if the term β2 is
___________ zero, then the parabola opens ____________.
A. less than, upward
B. greater than, upward
C. greater than, either upward or downward
D. less than, either upward or downward
E. equal to, downward

The number of measurements falling within a class interval is called the ___________.
A. frequency
B. relative frequency
C. leaf
D. cumulative sum
In performing a chi-square goodness-of-fit test with multinomial probabilities, the
___________ the difference between observed and expected frequencies, the higher the
probability of concluding that the probabilities specified in the null hypothesis are
correct.
A. larger
B. smaller
The local amusement park was interested in the average wait time at their most popular

roller coaster at the peak park time (2 p.m.). They selected 13 patrons and had them get
in line between 2 and 3 p.m. Each was given a stopwatch to record the time they spent
in line. The times recorded were as follows (in minutes;mean = 114.15):
118, 124, 108, 116, 99, 120, 148, 118, 119, 121, 45, 130, 118.
What is the standard deviation?
A. 103
B. 23.62
C. 557.97
D. 128.8
E. 115
A powder metal manufacturing company is producing sleeves for a locking mechanism.
The target (nominal) value for the inside diameter is 1 inch. The inside diameter
specifications are 1 .005 inches. Assume that the process is in statistical control with =
1.0002 inches, = .003 inches, and subgroup size of 5. Determine the estimated number
of standard deviations of process leeway.
A. 3
B. 1.667
C. 3.72
D. 1.443
E. .72
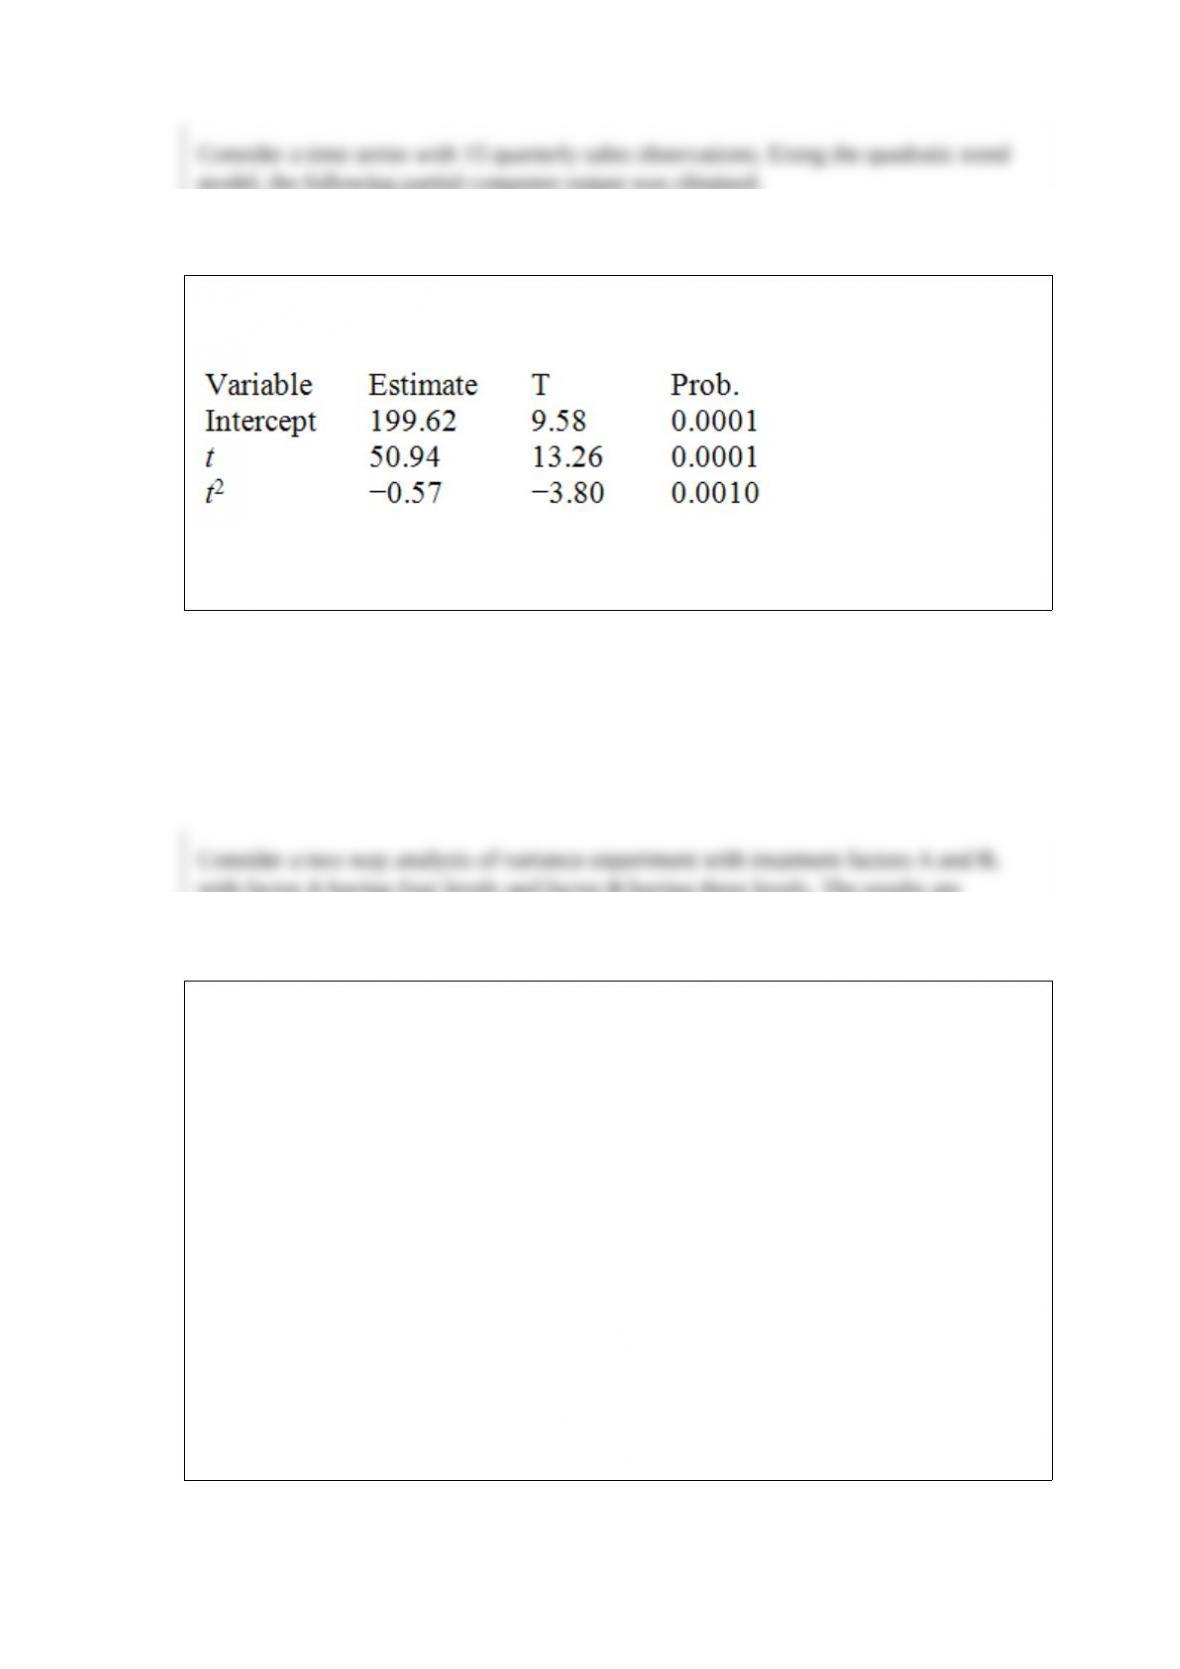
Consider a time series with 15 quarterly sales observations. Using the quadratic trend
model, the following partial computer output was obtained.
Write the prediction equation.
Consider a two-way analysis of variance experiment with treatment factors A and B,
with factor A having four levels and factor B having three levels. The results are
summarized below.
Source of Variation df SS
Factor A 71
Factor B 63
Interaction 50
Error 280
Total 71 446
Compute the mean squares and appropriate F statistics to test the null hypotheses of no
effect from either factor at α = .05 (assumption: no interaction effect).

The local pharmacy prides itself on the accuracy of the number of tablets that are
dispensed in a 60-count prescription. The new manager feels that the pharmacy
assistants might have become careless in counting due to an increase in the volume of
prescriptions. To test her theory, she randomly selects 40 prescriptions requiring 60
tablets and recounts the number in each bottle. She finds a sample mean of 61.35.
Assume a population standard deviation of 4.45. If we want the probability of a Type I
error and Type II error to be equal to .05, what is the sample size needed to make both
the probability of a Type I error and the probability of a Type II error as small as
possible. (Assume an alternative value of the population mean of 61.) The claim is that
the tablet count is different from 60.
A cereal manufacturer is concerned that the boxes of cereal not be underfilled or
overfilled. Each box of cereal is supposed to contain 13 ounces of cereal. A random
sample of 31 boxes is tested. The average weight is 12.58 ounces, and the standard
deviation is 0.25 ounces. What is the critical value for testing the hypotheses at α = .

001.
The linear trend equation for the following data is = 1.4286 + 2.5(t).
What is the predicted value of the fund in the period t = 1?
The distance (in thousands of miles) traveled by buses before their first major motor
failure is distributed below, with an estimated mean and standard deviation of 95.7 and
38.1. Also shown are the expected frequencies of these intervals if the original
population was a normal distribution.

What is the df for testing the hypothesis that the original population is a normal
distribution?
When sample size is 11, find t.025.
Consider an engine parts supplier, and suppose the supplier has determined that the
mean and variance of the population of all cylindrical engine part outside diameters
produced by the current machine are, respectively, 2.5 inches and .00075. To reduce this
variance, a new machine is designed. A random sample of 20 outside diameters
produced by this new machine has a sample mean of 2.5 inches and a variance of s2 = .
0002 (normal distribution). In order for a cylindrical engine part to give an engine long
life, the outside diameter must be between 2.43 and 2.57 inches. Find the 95 percent
confidence intervals for σ2 and σ for the new machine.

Block
Treatment 1 2 3 4 Treatment Mean
Tr1 2 1 2 3 2
Tr2 4 4 1 1 2.5
Tr3 3 4 3 2 3
Block Mean 2 3 3 2 overall mean = 2.5
Consider the randomized block design with 4 blocks and 3 treatments given above.
What is the mean square error?

When sample size is 11, find t.10.
A marketing research company surveyed grocery shoppers on the East Coast and West
Coast to find the percentage of the customers who prefer chicken to other meat. The
data are given below.
The marketing research company is testing the hypothesis that the proportion of
customers who prefer chicken is the same for the two regions. Test at α = .10.

Two different firms design their own tests for business graduates, and an employer
administers both versions to a random selection of prospective employees. Results are
below. At α = .02, test the claim that both versions produce the same score.
Mean difference = −4.25
Standard error of the difference = 1.411

A coffee shop franchise owner is looking at two possible locations for a new shop. To
help him decide, he looks at the number of pedestrians that go by each of the two
locations in one-hour segments. At location A, counts are taken for 35 one-hour units,
with a mean number of pedestrians of 421 and a sample standard deviation of 122. At
the second location (B), counts are taken for 50 one-hour units, with a mean number of
pedestrians of 347 and a sample standard deviation of 85. Assume the two population
variances are not known but are equal. Set up the null hypothesis to test the claim that
both sites have the same number of pedestrians.
A test of mathematical ability is given to a random sample of 10 eighth-grade students
before and after they complete a semester-long basic mathematics course. The mean
score before the course was 119.60, and after the course the mean score was 130.80.
The standard deviation of the difference is 16.061. Calculate the test statistic to test the
claim that scores were higher after the course.
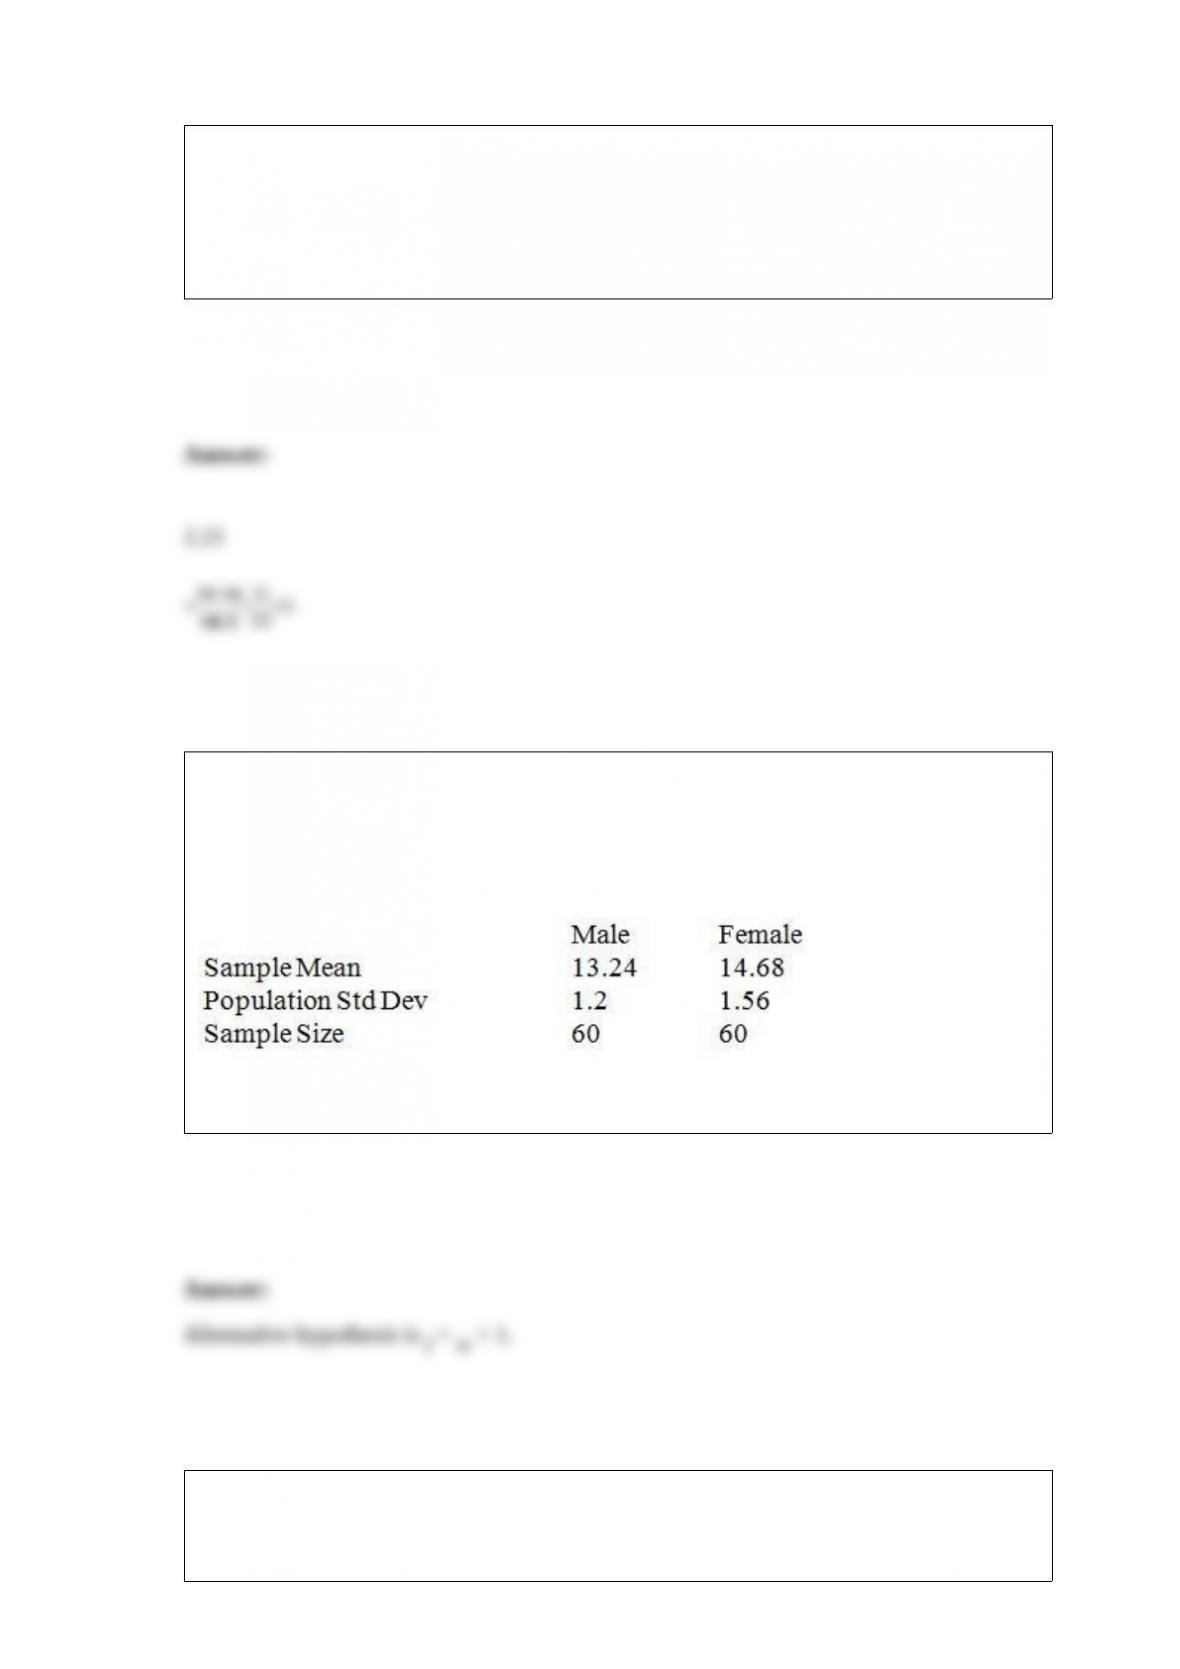
The registrar at a state college is interested in determining whether there is a difference
of more than one credit hour between male and female students in the average number
of credit hours taken during a term. She selected a random sample of 60 male and 60
female students and observed the following sample information.
Set up the alternative hypothesis to test the claim.
When testing H0: σ12= σ12, HA: σ12> σ22 at α = .01, where n1 = 5, n2 = 6, s12 = 15,750,
and s22 = 10,920, what critical value do we use?