Figure: Indifference Curves and Consumption Bundles
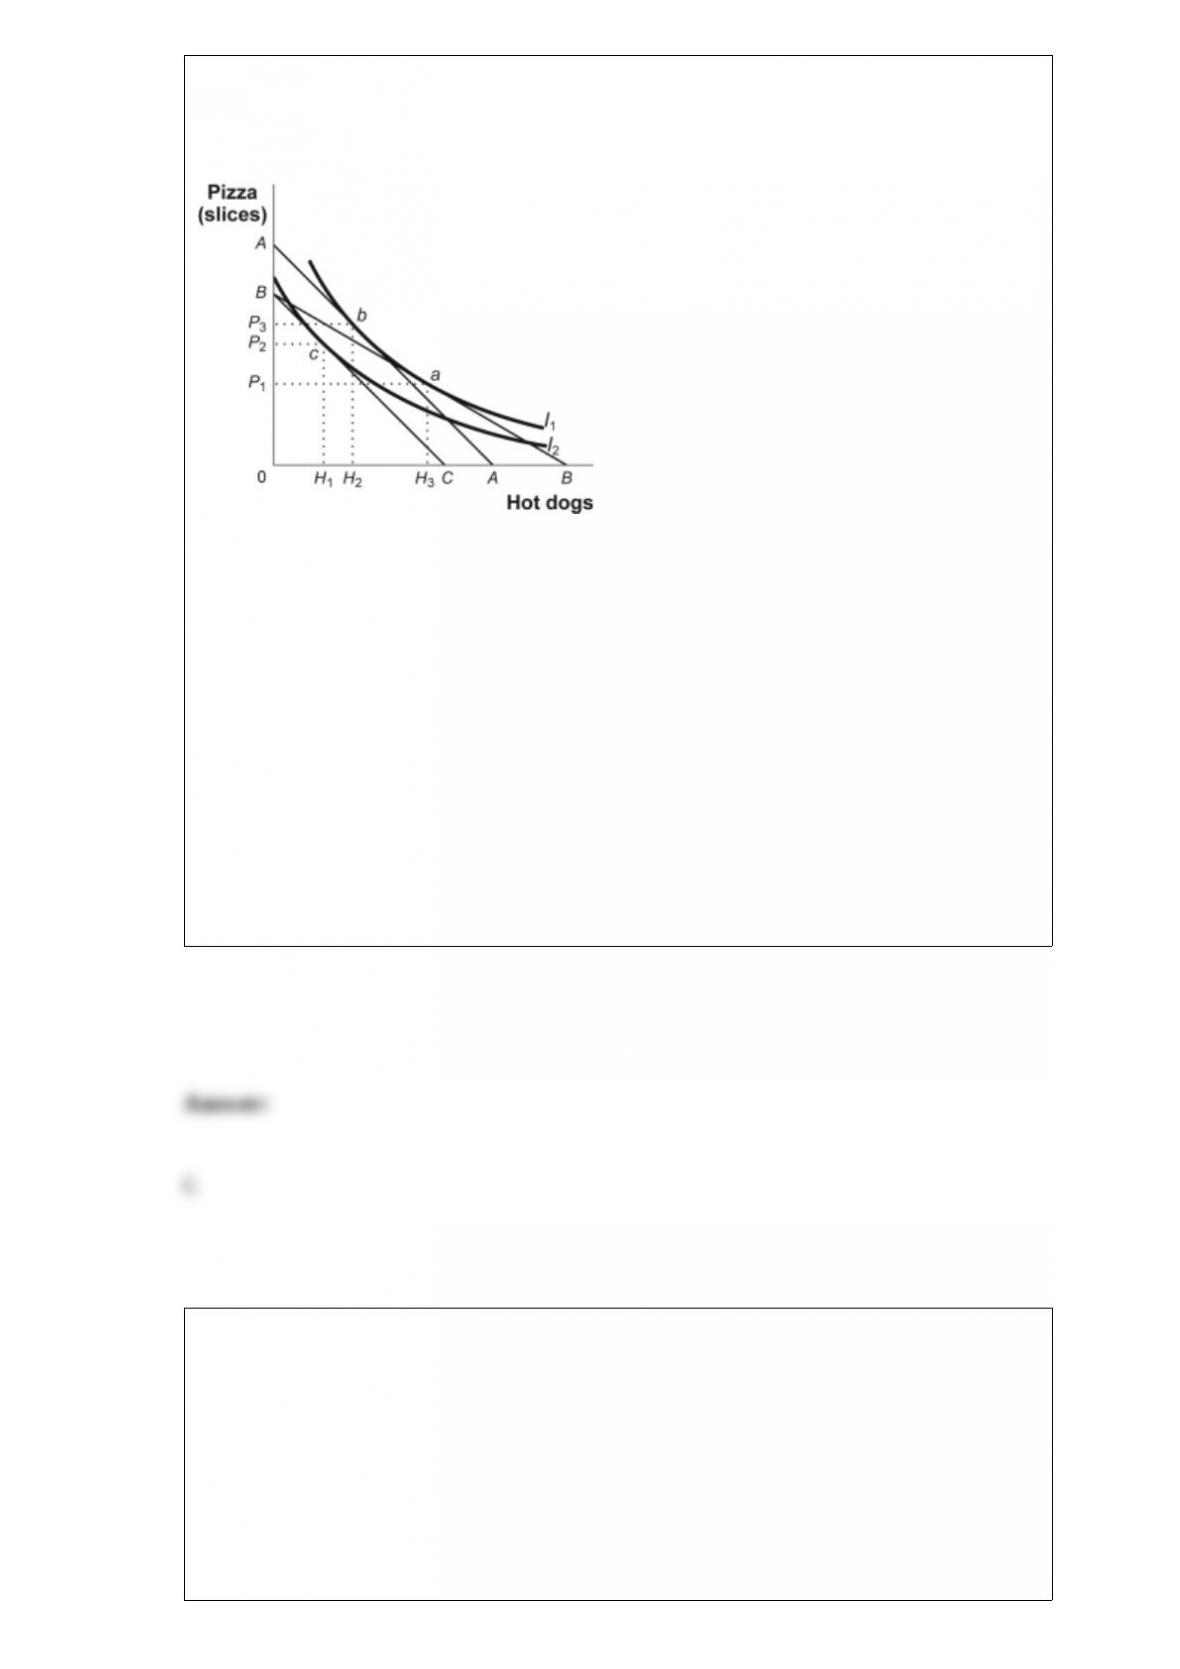
(Figure: Indifference Curves and Consumption Bundles) Look at the figure Indifference
Curves and Consumption Bundles. In the figure, the initial optimum is at a. The price of
hot dogs increases, and the new equilibrium point is c. The change in hot dog
consumption due to the income effect of the price change is:
A) H3 to H2.
B) H3 to H1.
C) H2 to H1.
D) H1 to H2.
The price elasticity of demand measures the responsiveness of the change in the:
A) quantity demanded to a change in the price.
B) price to a change in the quantity demanded.
C) slope of the demand curve to a change in the price.
D) slope of the demand curve to a change in the quantity demanded.

The government has adopted an emissions tax if it:
A) transfers the ownership of city air to a private firm that charges automobile drivers a
profit-maximizing price, based in part on the pollution capacity of the atmosphere.
B) charges automobile drivers $0.10 for each unit of automobile emissions.
C) pays automobile drivers $0.10 for each 10% reduction in automobile emissions.
D) specifies the type of catalytic converter that must be used to reduce automobile
emissions.
The demand for food is very inelastic compared to the supply of food, so if a tax is
imposed on the consumers of food, the tax incidence:
A) is typically on consumers more than producers.
B) is typically on producers more than consumers.
C) is typically split equally between consumers and producers.
D) cannot be determined without more information.

Part of the _____ associated with the Chicago Cubs baseball team is their batting cages
used in practice.
A) labor
B) land
C) capital
D) entrepreneurship
Scenario: Two Identical Firms
Two identical firms make up an industry in which the market demand curve is
represented by Q = 5,000 ” 4P, where Q is the quantity demanded and P is price per
unit. The marginal cost of producing the good in this industry is constant and equal to
$650. Fixed cost is zero.
(Scenario: Two Identical Firms) When the firms in the scenario Two Identical Firms
collude and produce the profit-maximizing output, what is the profit earned by each
firm?
A) $360,000
B) $180,000
C) $15,000
D) $25,000
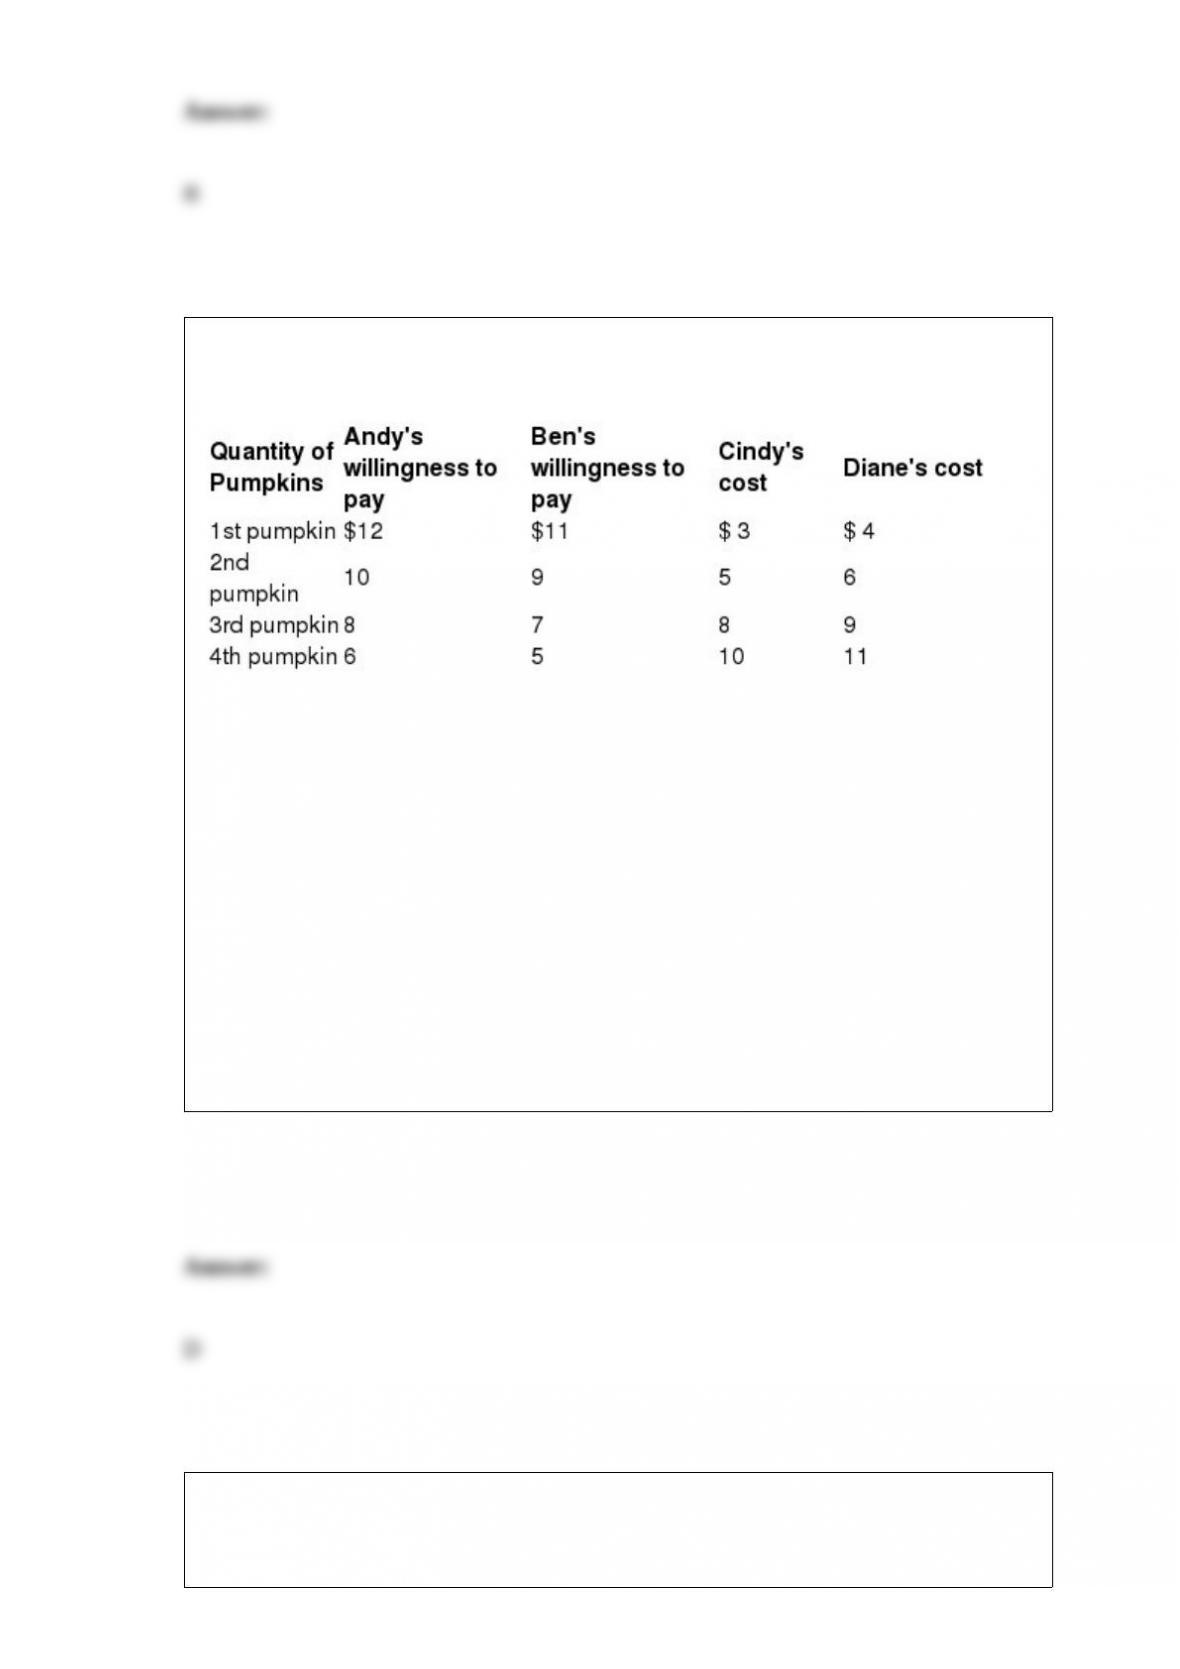
Table: Pumpkin Market
(Table: Pumpkin Market) There are two consumers, Andy and Ben, in the market for
pumpkins. Their willingness to pay for each pumpkin is shown in the table Pumpkin
Market. There are two producers of pumpkins, Cindy and Diane, and their costs are also
shown. The equilibrium price for pumpkins is $8 and the equilibrium quantity is 5. If
Ben buys one more pumpkin and Cindy sells one fewer pumpkin than in equilibrium,
total surplus will _____ by _____.
A) increase; $14
B) increase; $12
C) decrease; $12
D) decrease; $3
A resource is anything that:
A) can be used in production.

B) you pay for.
C) is in scarce supply.
D) can be consumed.
Which of the following characteristics make an industry more conducive to collusive
behavior?
A) Firms in the industry have very different marginal costs of production.
B) Firms in the industry produce goods with significantly different product attributes.
C) Firms in the industry are operating at a maximum productive capacity that cannot be
easily altered in the short run.
D) Firms in the industry serve customers that can easily switch between firms as they
search for the best price.
Scenario: Diversification
Morris is considering investing $10,000 in a sunglass company or a rain poncho
company. If it is a rainy year and he invests only in the sunglass company, he will lose
$5,000. However, if it is a rainy year and he invests only in the rain poncho company,

he will earn $10,000. If it is a sunny year and he invests only in the sunglass company,
he will earn $10,000; if he invests only in the rain poncho company, he will lose $5,000
in a sunny year. There is a 50% chance of a sunny year and a 50% chance of a rainy
year.
(Scenario: Diversification) Look at the scenario Diversification. If Morris invests half
of his money in the sunglass company and half in the rain poncho company, he will
earn _____ in a sunny year and _____ in a rainy year.
A) $2,500; $0
B) $1,250; $1,250
C) “$2,500; $2,500
D) $2,500; $2,500
Scenario: The Market for Good X: The market for good X can be depicted with the
following demand and supply equations: Demand: P = 50 ” 0.5Q Supply: P = 0.33Q
where P is price per unit and Q represents quantity in units. Policy makers plan on
imposing a $1 per unit tax on this good.
(Scenario: The Market for Good X) Look at the scenario The Market for Good X. The
per-unit tax incidence on producers is equal to:
A) $1.00.
B) $0.40.
C) $58.80.
D) $60.00.

(Table: Demand Schedule for Gadgets) Look at the table Demand Schedule for
Gadgets. The market for gadgets consists of two producers, Margaret and Ray. Each
firm can produce gadgets at a marginal cost of $2 and no fixed cost. If industry output is
300 gadgets produced by Margaret and 200 gadgets produced by Ray and if Ray
decides to increase output by 100, Margaret’s profit will be _____, and Ray’s profit will
be _____.
A) $1,750; $1,250
B) $1,250; $1,250
C) $1,400; $1,000
D) $600; $600
If in a competitive market the quantity supplied exceeds the quantity demanded, we
expect prices to:
A) stay the same.
B) rise.
C) fall.
D) rise to clear the market.
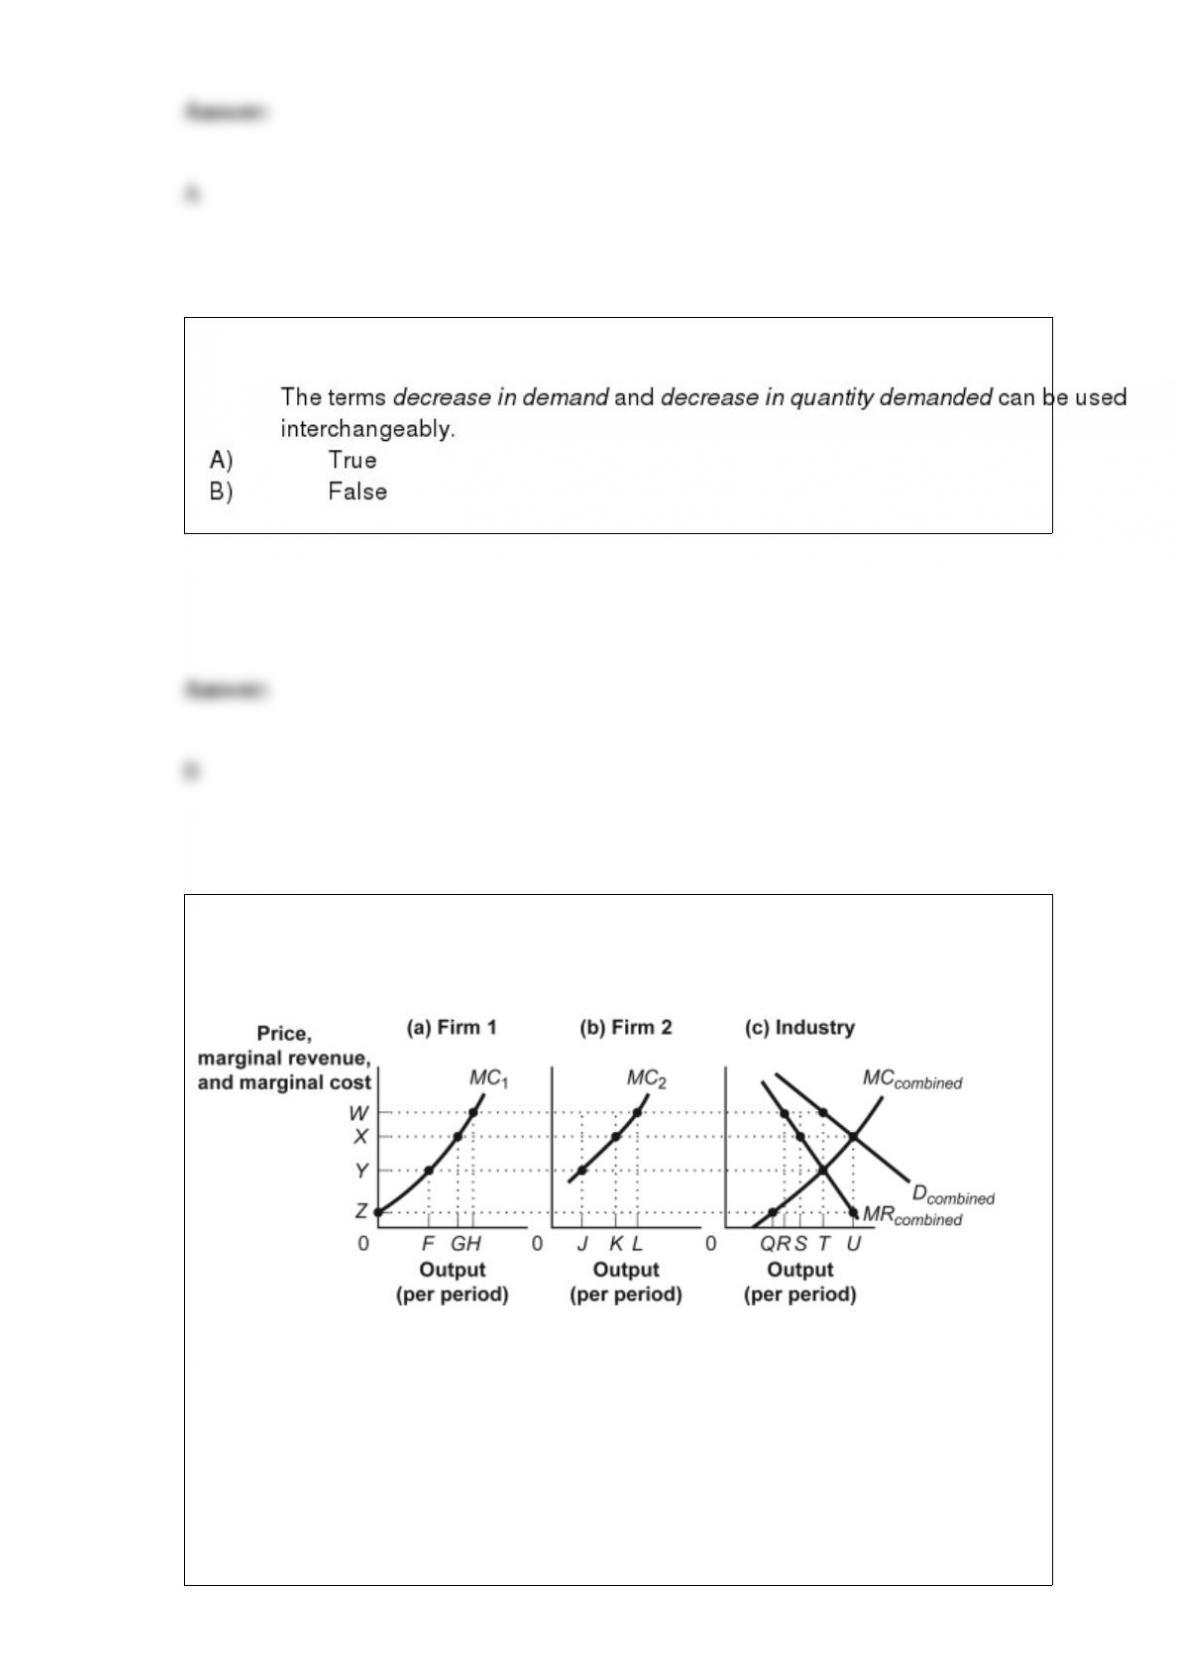
Figure: Collusion
(Figure: Collusion) Look at the figure Collusion. The quantity of output produced by
the industry with collusion is shown by:
A) Q.
B) R.
C) S.

D) T.
For a perfectly competitive firm, the short-run supply curve is the:
A) entire MC curve.
B) rising part of the MC curve beginning at the shut-down point.
C) rising part of the MC curve beginning where the firm starts earning economic profit.
D) MC curve below the shut-down point.
Criteria that economists use in selecting a tax system include:
A) the ability to pay.
B) employment status.
C) consumer debt.
D) the maximal deadweight loss.
The marginal benefit of pollution emissions _____ as the quantity of pollution
emissions _____.
A) decreases; increases
B) increases; increases
C) decreases; decreases
D) remains unchanged; goes up or down

If the price is greater than the average variable cost and less than the average total cost
at the profit-maximizing quantity of output in the short run, a perfectly competitive firm
will:
A) produce at an economic loss.
B) produce at an economic profit.
C) shut down production.
D) produce more than the profit-maximizing quantity.
Figure: Strawberries and Submarines II
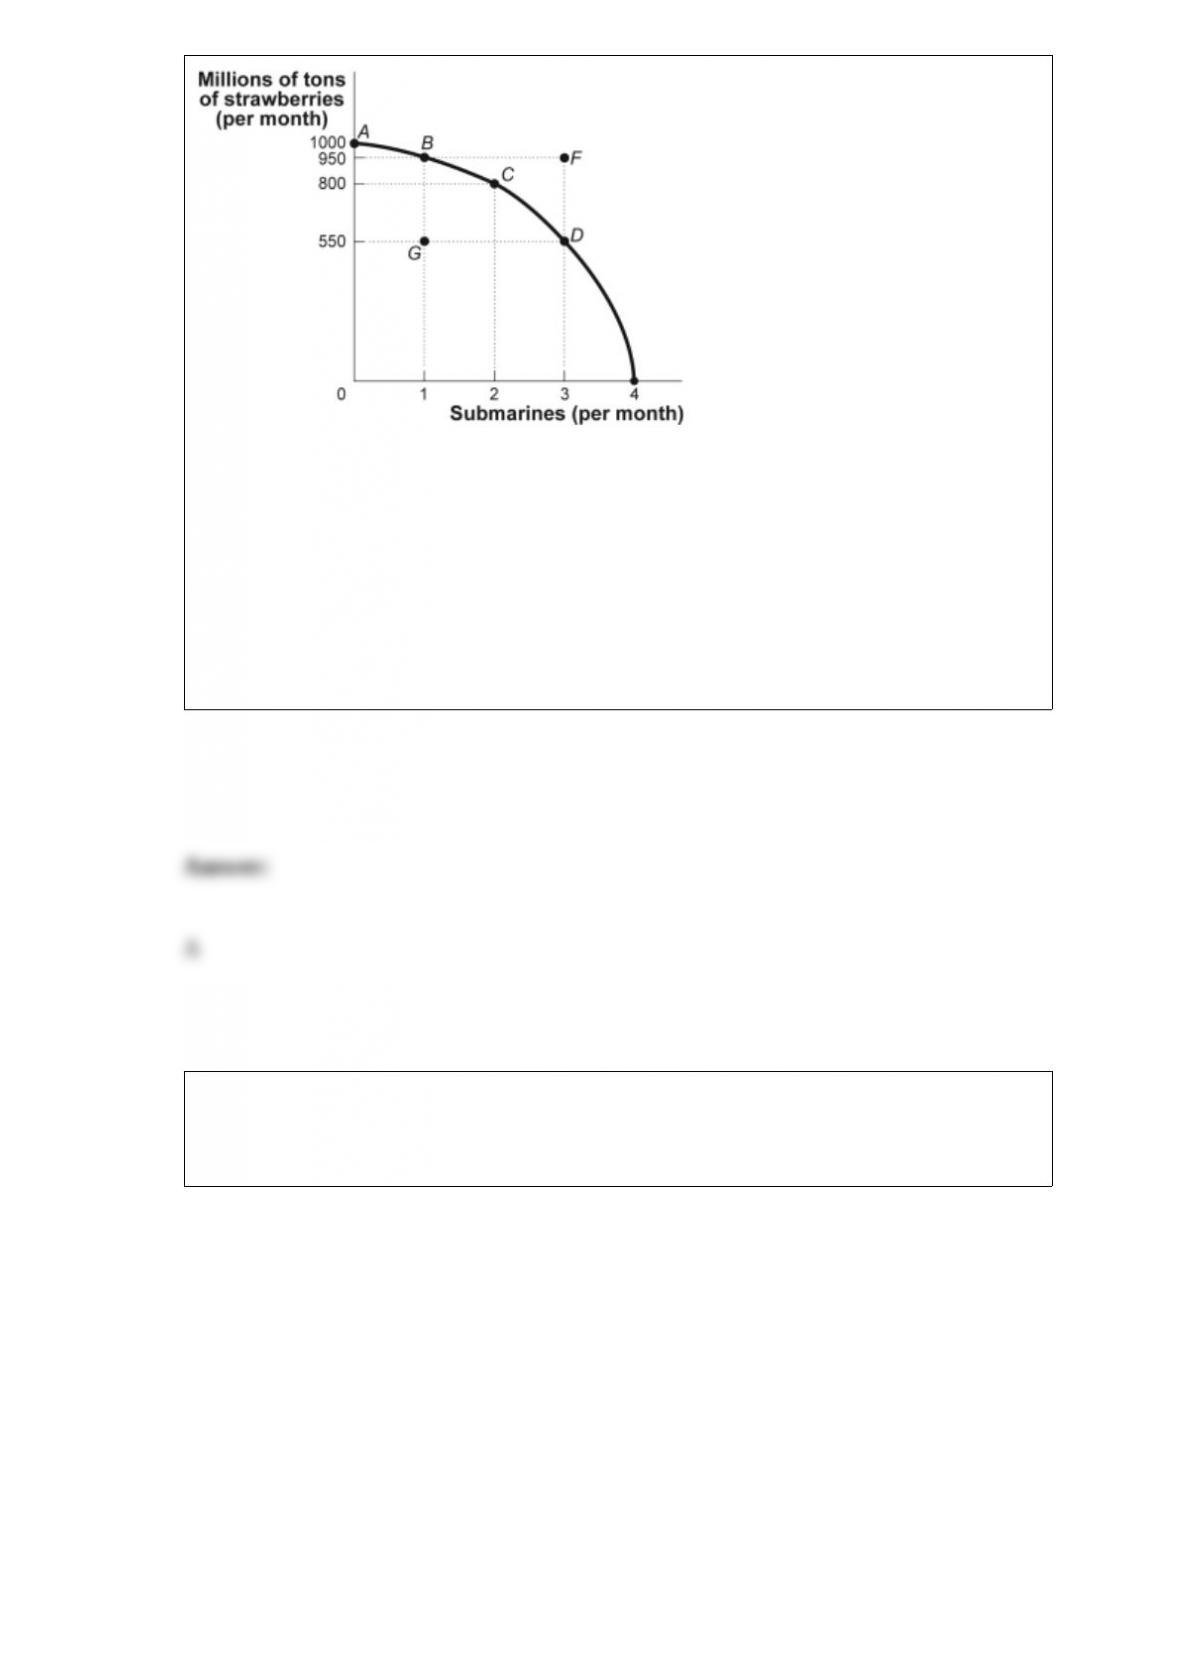
(Figure: Strawberries and
Submarines II) Look at the figure Strawberries and Submarines II. Point F:
A) is unattainable, all other things unchanged.
B) is attainable if the quantity and/or quality of factors decreases.
C) is attainable if the economy is able to reach full employment.
D) is feasible but not efficient.
Figure: Efficiency and Pollution
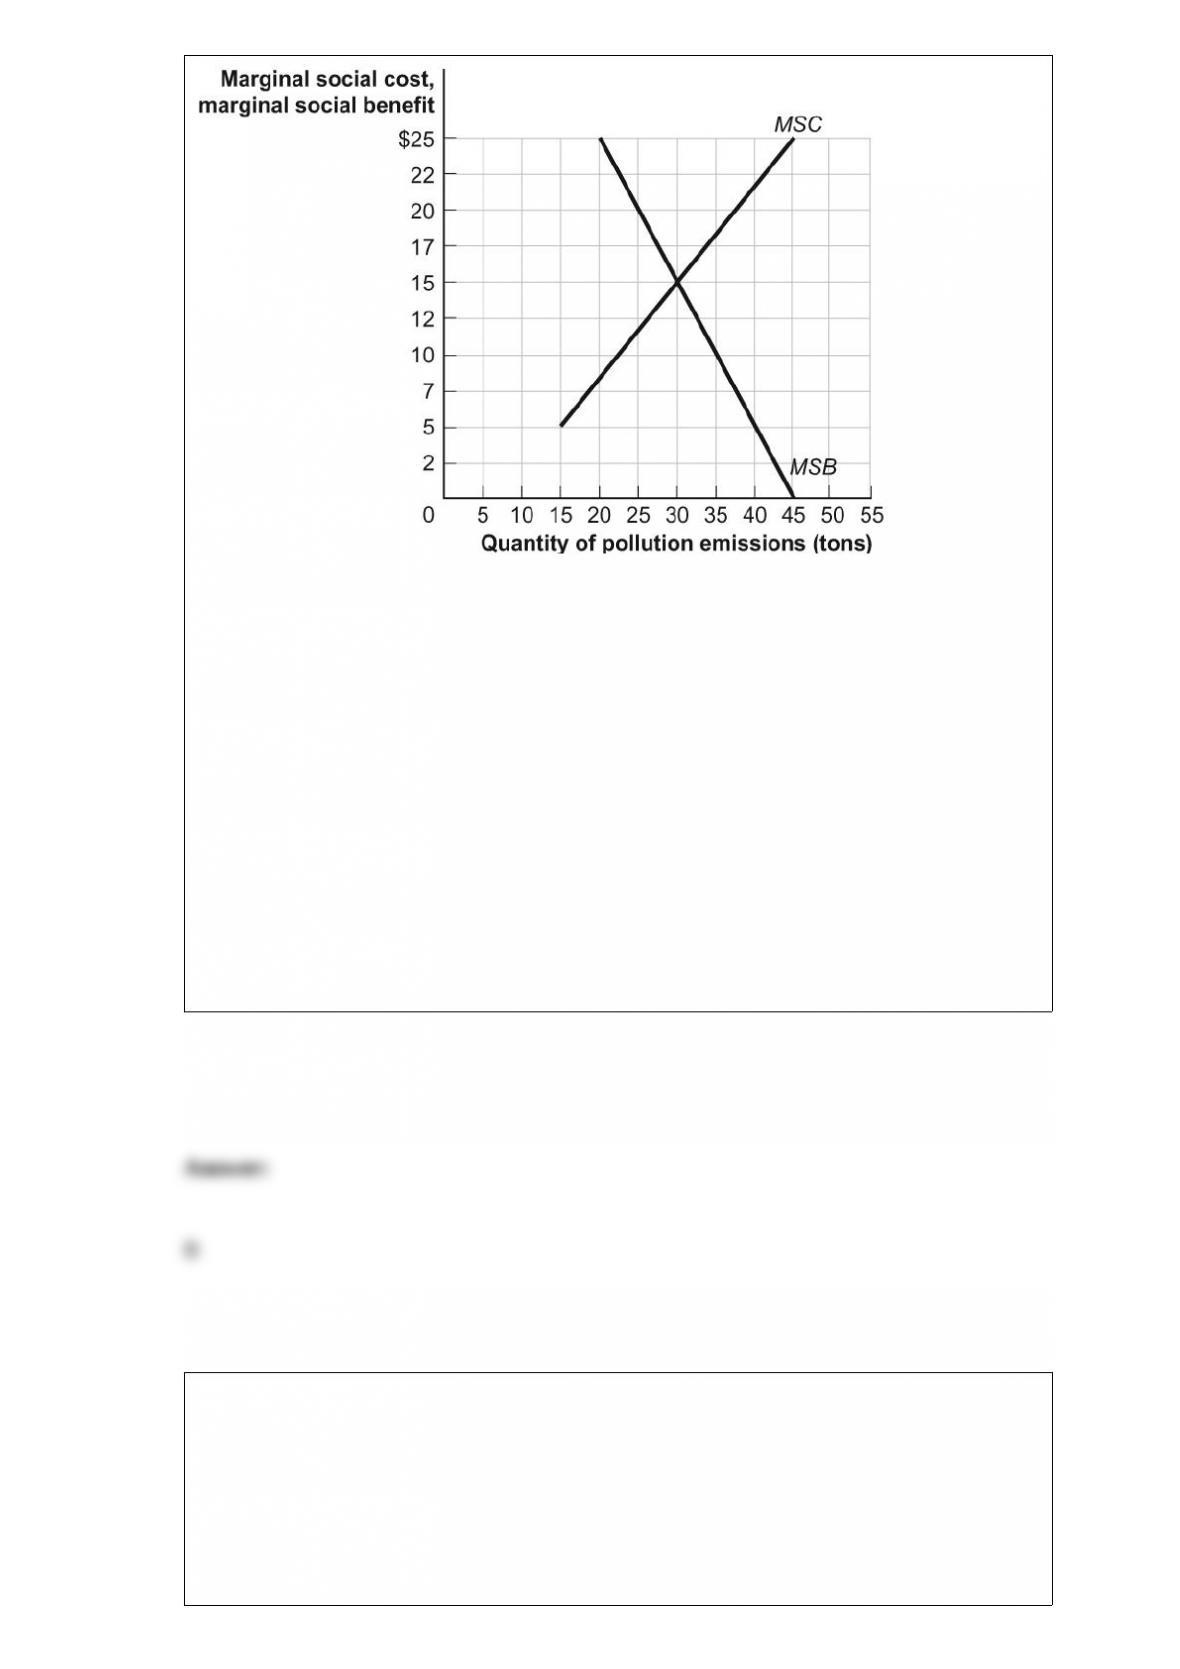
(Figure: Efficiency and Pollution) Look at the figure Efficiency and Pollution. If the
government imposed an environmental standard that did not allow the quantity of
pollution to exceed 20 tons, there would be:
A) a socially optimal quantity of pollution.
B) too little pollution, because its marginal social benefit would exceed its marginal
social cost.
C) too much pollution, because its marginal social cost would exceed its marginal social
benefit.
D) too much pollution, because any pollution is too much from an economist’s
perspective.
Which of the following is NOT a determinant of supply?
A) expectations regarding future prices
B) the technology of production
C) the cost of production
D) consumer tastes
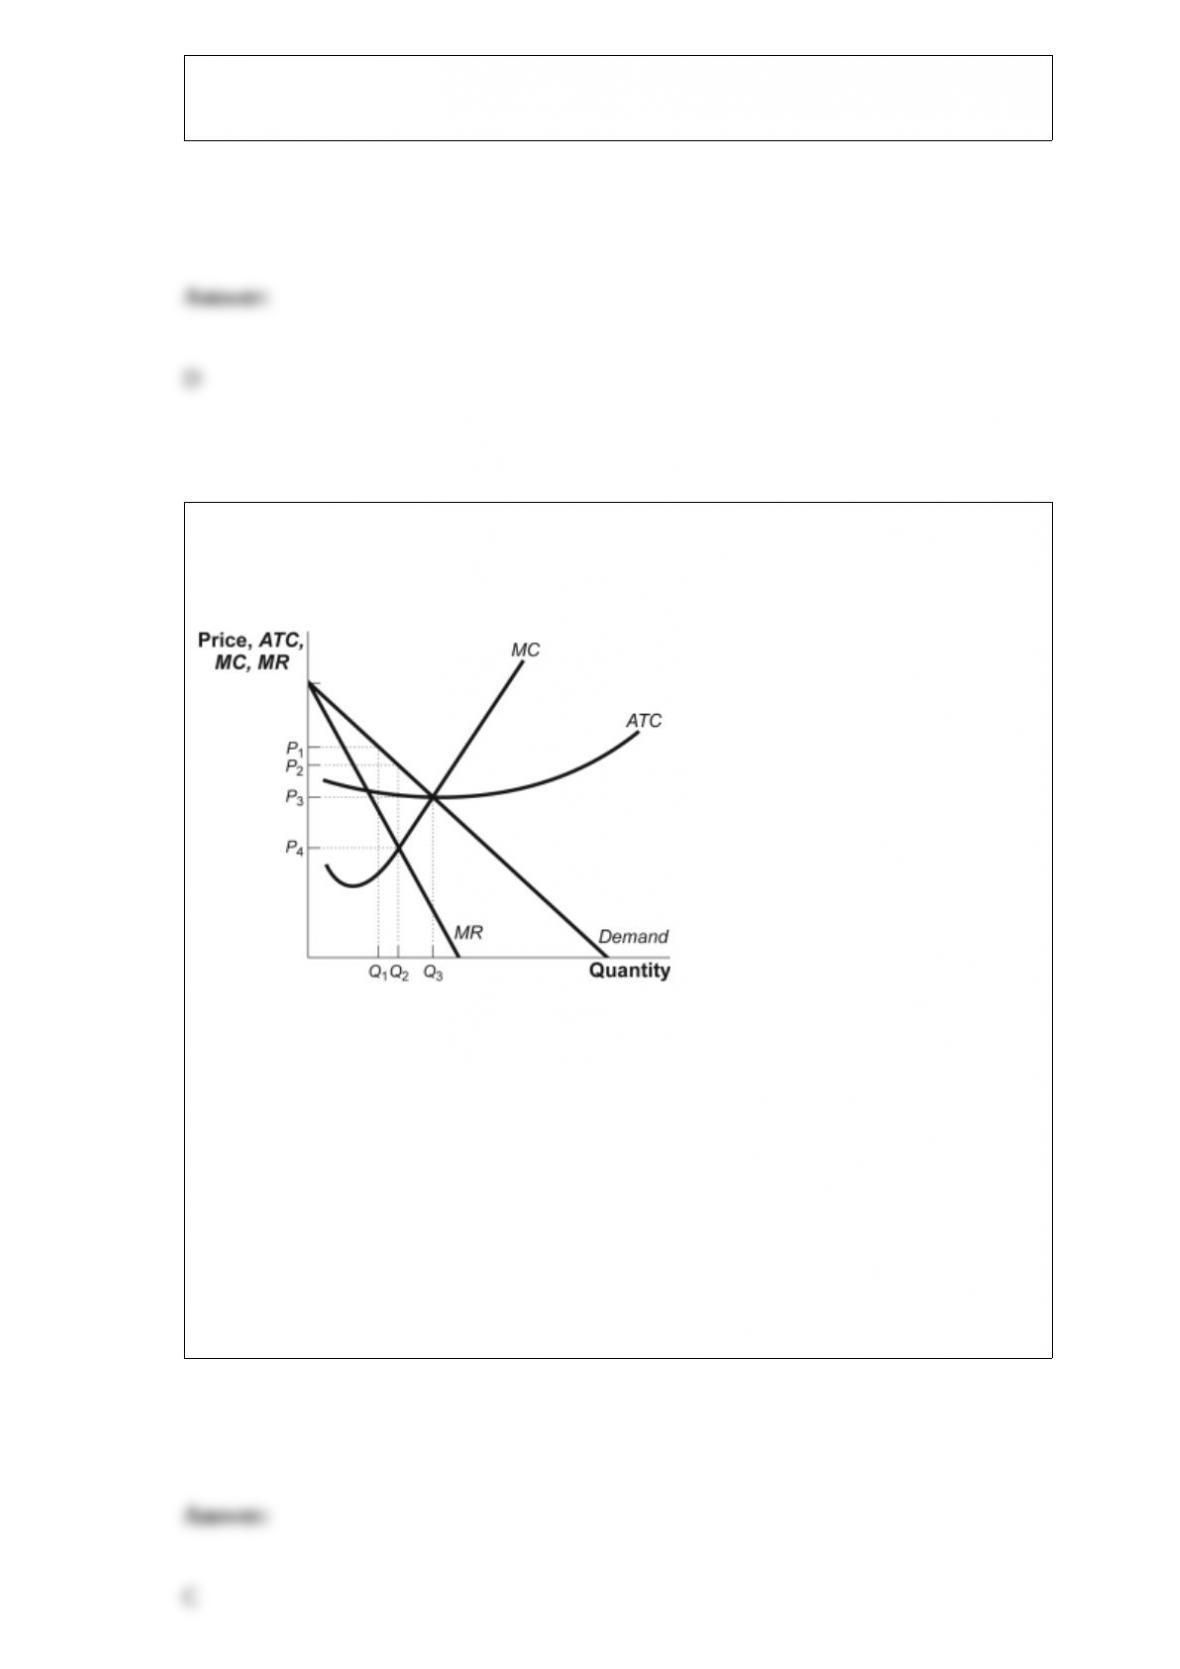
Figure: The Monopolist
(Figure: The Monopolist) Look at the figure The Monopolist. If this monopolist were
forced to act like a perfect competitor, it would produce _____ units and sell at _____.
A) Q1; P1
B) Q2; P2
C) Q3; P3
D) Q2; P4
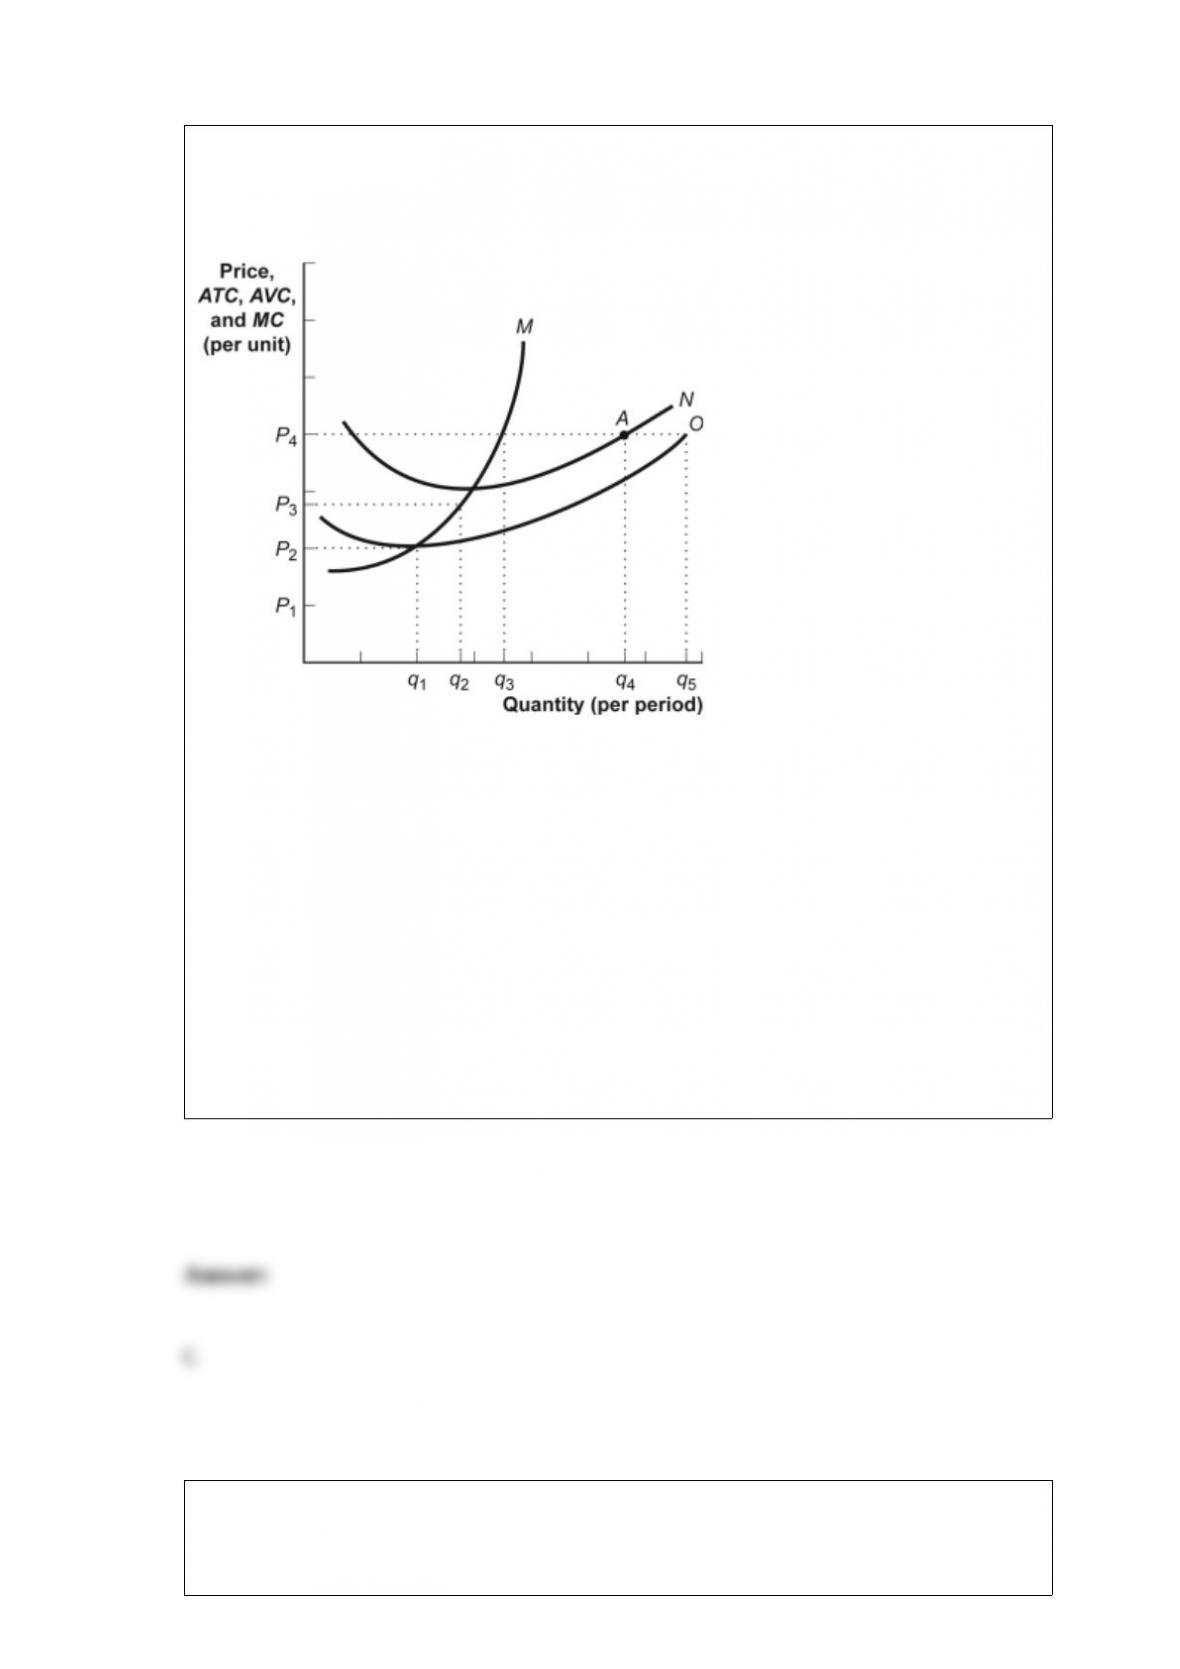
Figure: The Profit-Maximizing Firm in the Short Run
(Figure: The Profit-Maximizing Firm in the Short Run) Look at the figure The
Profit-Maximizing Firm in the Short Run. If the market price is less than P2, the firm
will _____ in the short run.
A) produce q1 and break even
B) produce q1 and incur a loss
C) shut down
D) produce q3 and make a profit
Firms will continue to hire workers as long as:
A) they make a profit.
B) the value of the marginal product is greater than the marginal cost of hiring labor.
C) the wage is below the product price.
D) there are no diminishing returns.
Increases in total output realized when individuals specialize in particular tasks and
trade are known as:
A) the gains from trade.
B) the profits obtained from sales of a good or service.
C) marginal analysis.
D) a trade-off.
A good that is nonexcludable but rival in consumption is a _____ good.
A) common resource
B) private
C) public
D) normal
Javon has 80 hours per week to allocate between labor and leisure. Graph hours of

leisure per week on the horizontal axis and income per week on the vertical axis. If
Javon’s hourly wage is $8, then the vertical intercept of his time allocation budget line
is:
A) $8.
B) $640.
C) 40 hours.
D) 80 hours.