In the Wilcoxon signed rank test for testing about a single population median, if the
sample size is large (n > 20), the test statistic can be approximated by the standard
normal distribution.
The sampling distribution for is actually the distribution of possible sampling error for
samples of a given size selected at random from the population.
In conducting multiple regression analysis, t-tests should be conducted prior to
conducting the F-test.
The following regression model has been computed based on a sample of twenty
observations: = 34.2 + 19.3x. Given this model, the predicted value for y when x = 40
is 806.2.

Three brands of running shoes are each tested by 10 different runners. The amount of
wear on the sole of the shoes is then measured. The objective is to determine if there is
any difference among the three brands of shoes based on how long the soles last. The
null hypothesis is:
H0 : μ1 = μ2 = μ3.
When a market research manager records the number of potential customers who were
surveyed indicating that they like the product design, the random variable, number who
like the design, is a discrete random variable.
The marketing manager for Voice-talk, a cell phone company, has taken a sample of
300 customers from the list of 4,356 total customers. The mean monthly bill for the last
October based on the sample data is $45.62. The manager should realize that the mean
bill for all 4,356 customers will actually be higher than $45.62.

Roscoe and Associates makes computer software for use in the telecommunications
industry. Recently, managers at the company collected data for the year 2001 on three
variables: total dollars spent on research and development, total sales dollars, and total
employee salaries. To graphically present these three variables, the managers would be
justified in using a line chart with all three variables plotted.
An accounting firm has been hired by a large computer company to determine whether
the proportion of accounts receivables with errors in one division (Division 1) exceeds
that of the second division (Division 2). The managers believe that such a difference
may exist because of the lax standards employed by the first division. The null and
alternative hypotheses that will be tested are:
H0 : μ1 ≥ μ2
Ha : μ1 < μ2
There is interest at the American Savings and Loan as to whether there is a difference
between average daily balances in checking accounts that are joint accounts (two or
more members per account) versus single accounts (one member per account). To test
this, a random sample of checking accounts was selected with the following results:
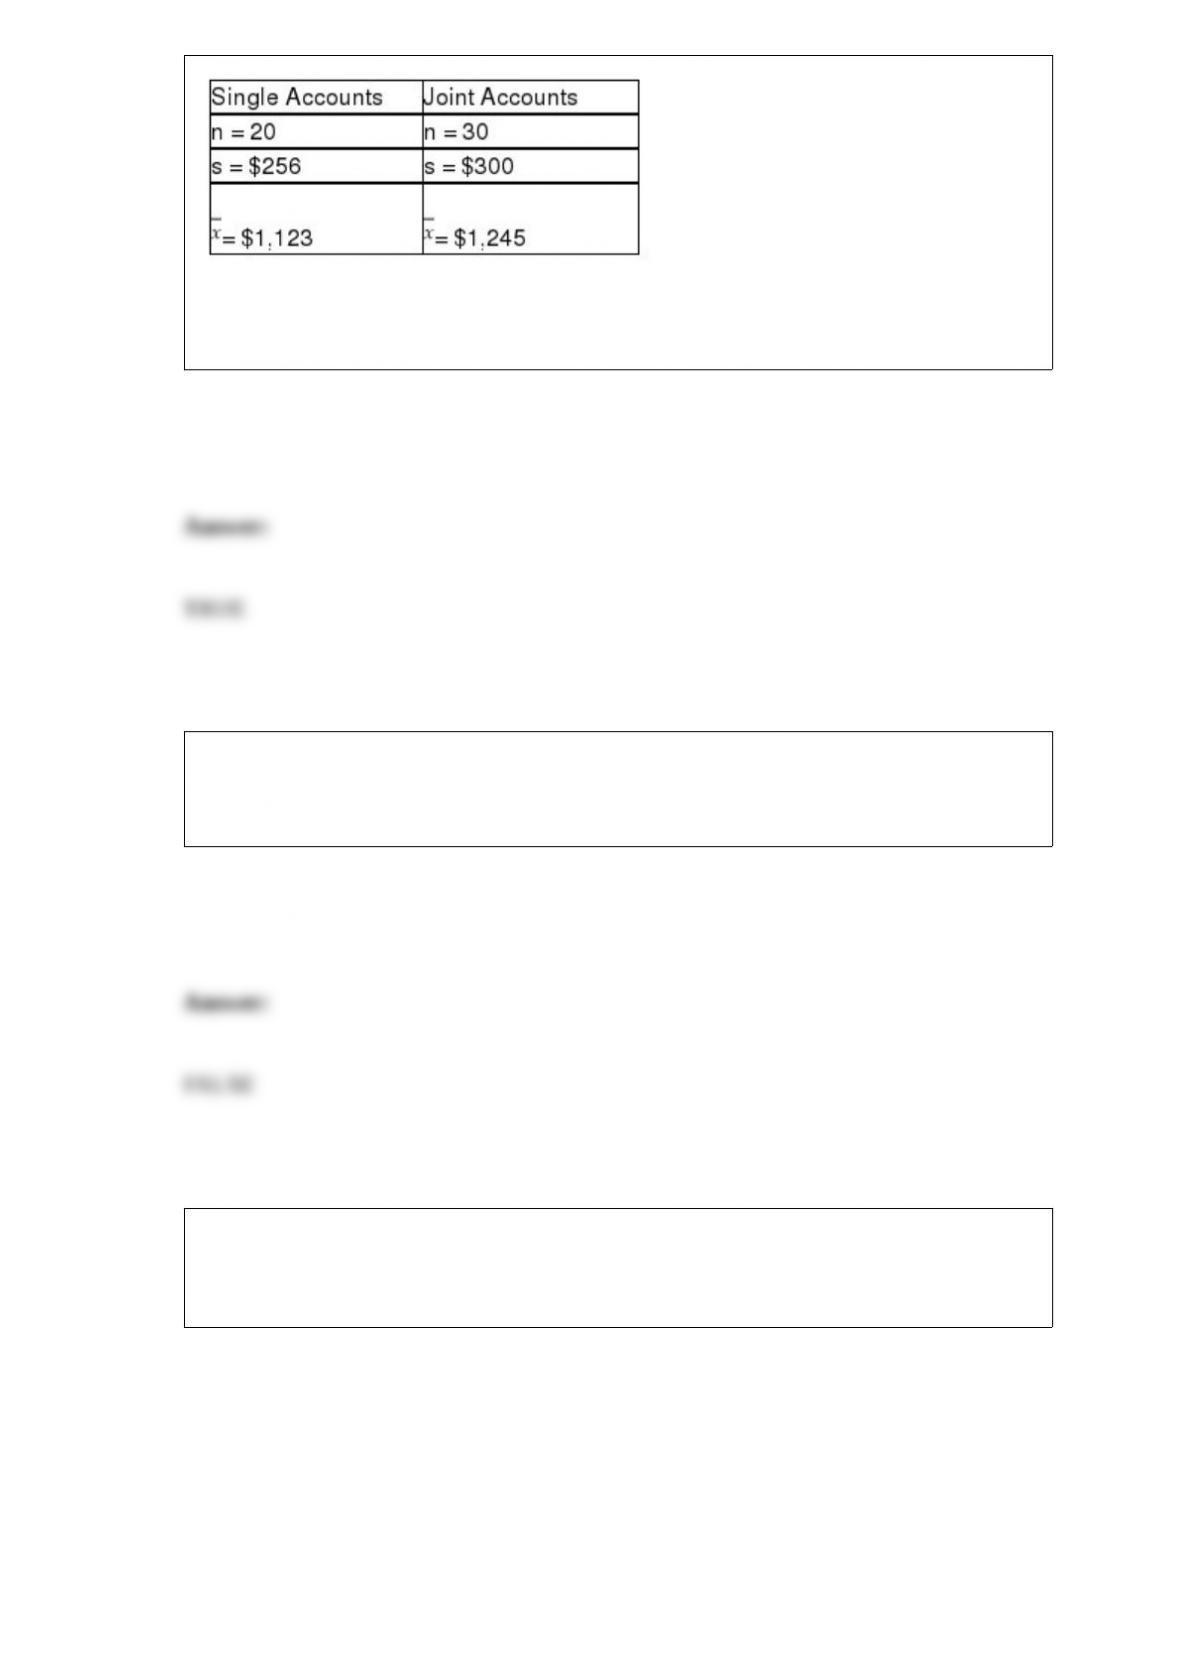
Based upon these data, the test statistic for testing whether the two populations have
equal variances is F = 1.3733.
If a contingency analysis test performed with a 4 6 design results in a test statistic value
of 18.72, and if alpha = .05, the null hypothesis that the row and column variable are
independent should be rejected.
The following output is for a second-order polynomial regression model where the
independent variables are x and x2 (x^2 in output). Some of the output has been
omitted.
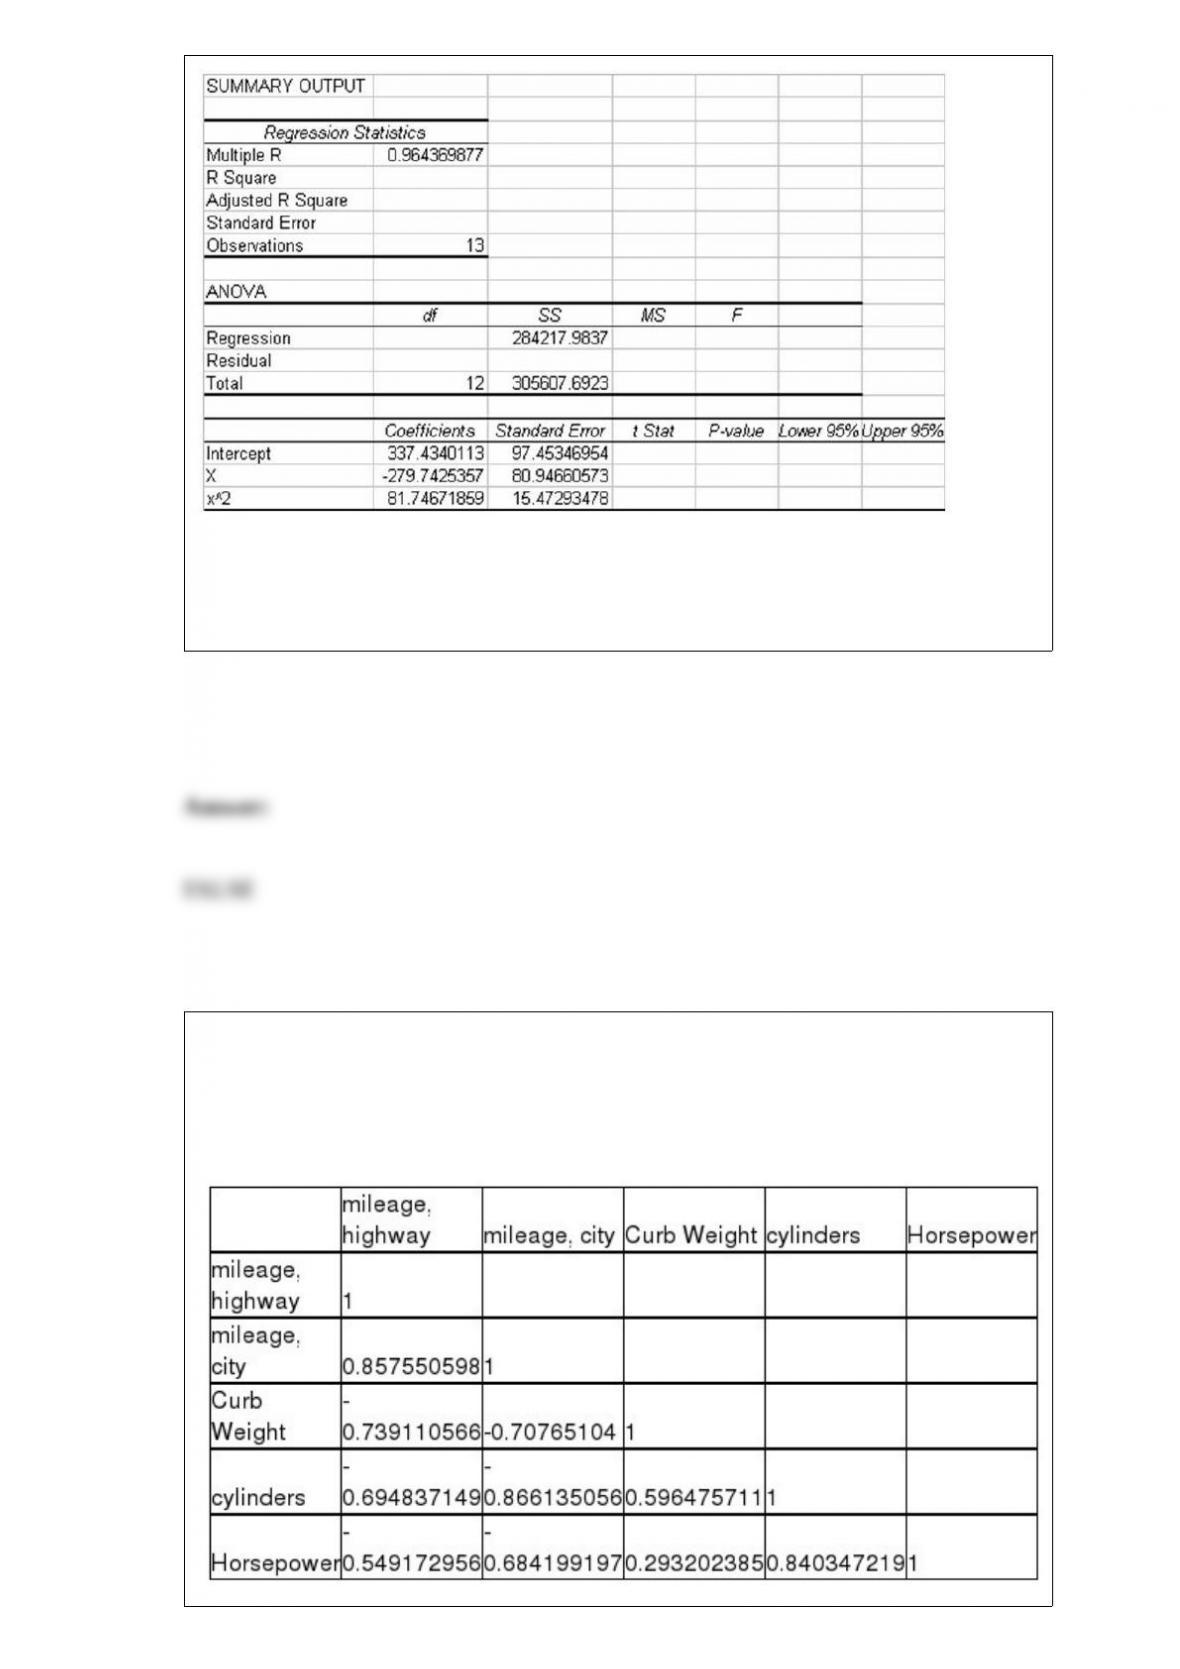
Considering the above information, it is clear that the second-order polynomial model
will be a more effective regression model for explaining the variation in the y variable
than would a linear regression model involving only one independent variable, x.
A major car magazine has recently collected data on 30 leading cars in the U.S. market.
It is interested in building a multiple regression model to explain the variation in
highway miles. The following correlation matrix has been computed from the data
collected:
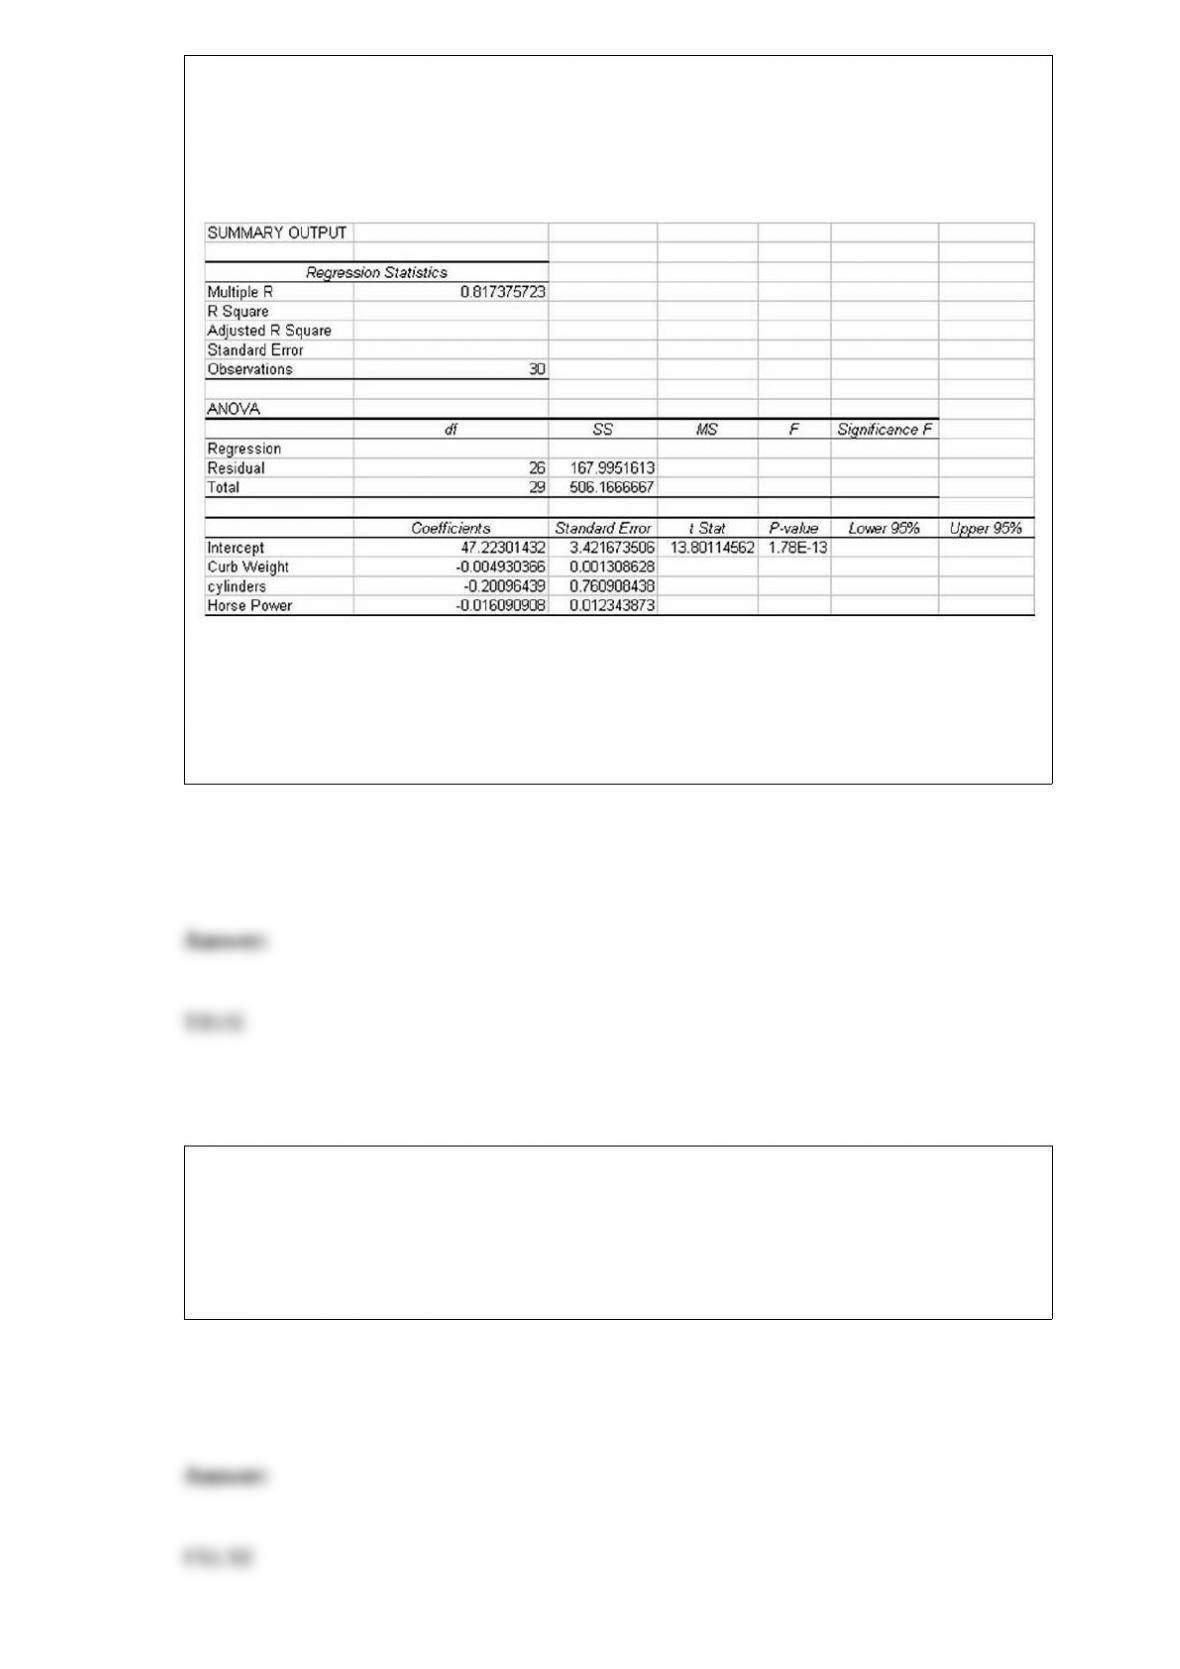
The analysts also produced the following multiple regression output using curb weight,
cylinders, and horsepower as the three independent variables. Note, a number of the
output fields are missing, but can be determined from the information provided.
Based on the information provided, the 95 percent confidence interval estimate for
regression slope coefficient for horsepower is approximately – 0.041 to 0.009 and since
this interval crosses zero, we are unable to conclude that the regression slope coefficient
for this variable is different from zero.
The Nationwide Motel Company has determined that 70 percent of all calls for motel
reservations request nonsmoking rooms. Recently, the customer service manager for the
company randomly selected 25 calls. Assuming that the distribution of calls requesting
nonsmoking rooms is described by a binomial distribution, the standard deviation of
requests for nonsmoking rooms is 5.25 customers.
Sampling error occurs when the population parameter and the sample statistic are
different.
When people fail to respond to a survey, the data collection process may suffer from
nonresponse bias.
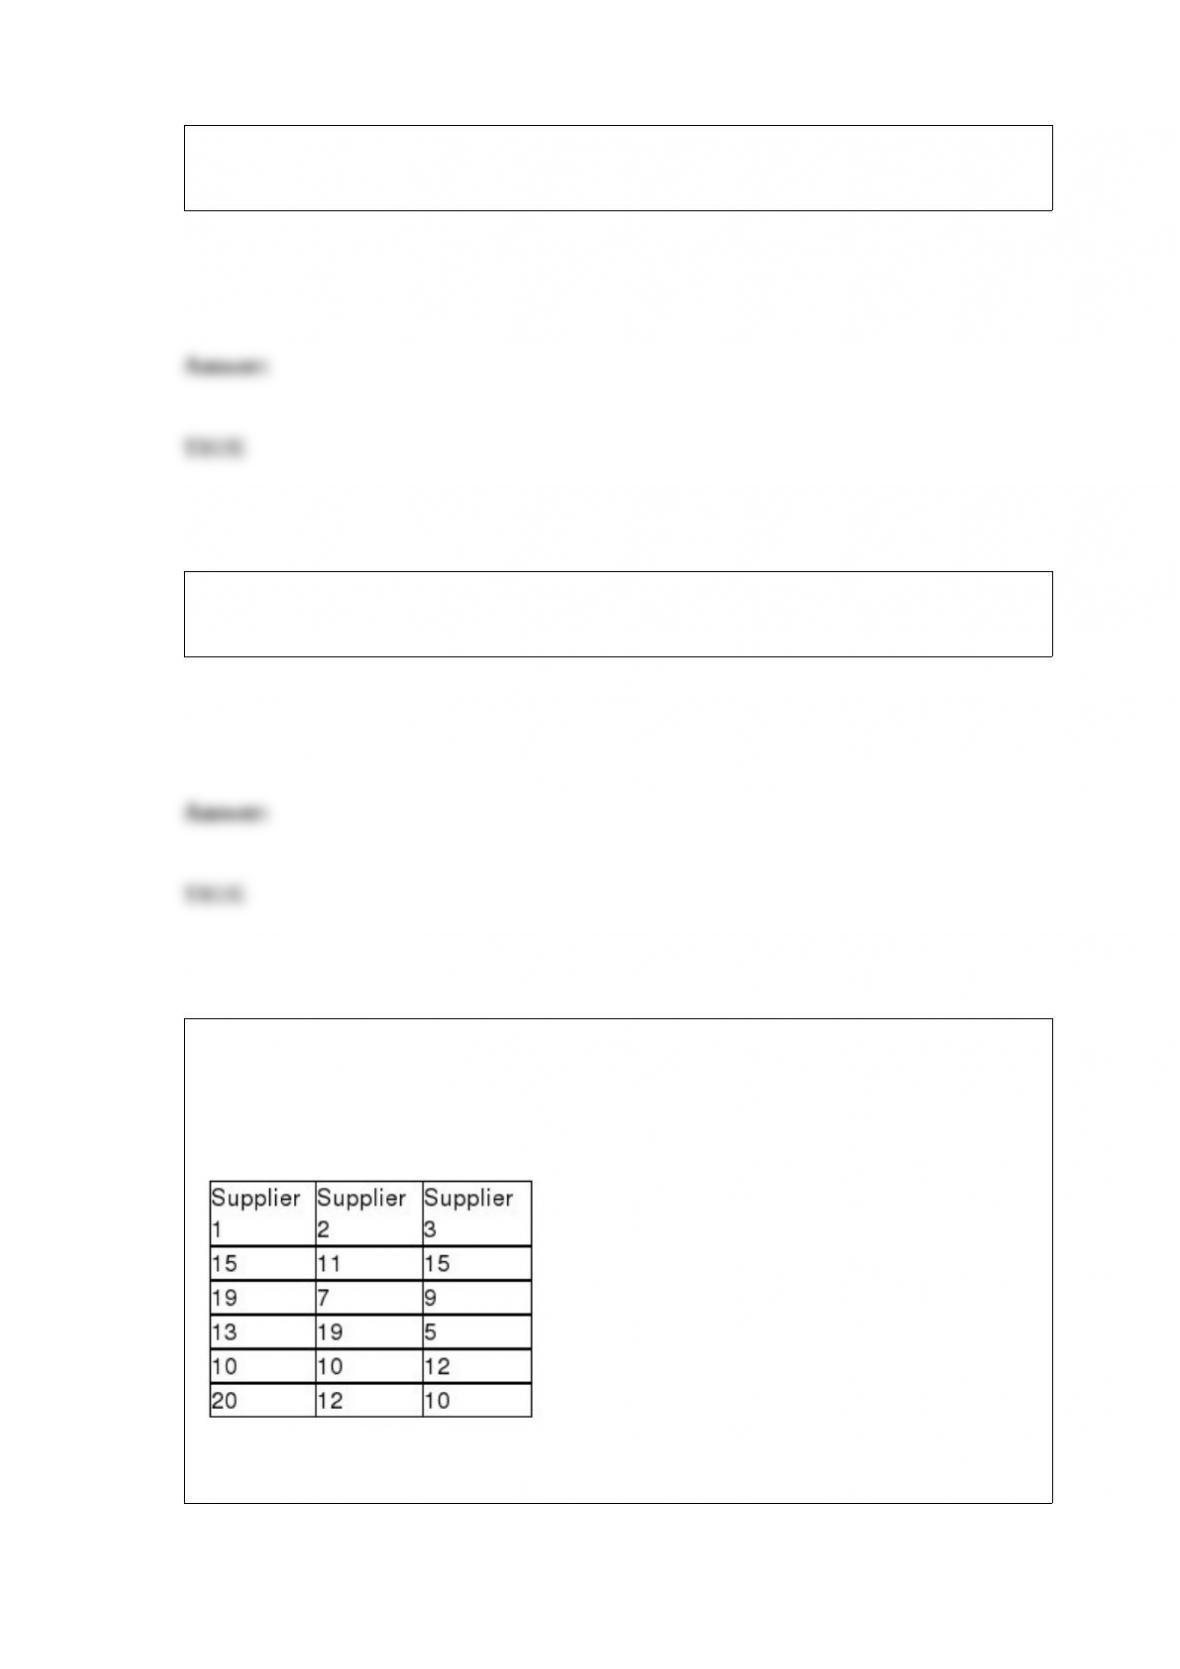
A recent study was conducted to determine if any of three suppliers of electronic
components has a different median delivery time on special orders. To test this, five
orders were given to each supplier and the delivery days were recorded. These data are
shown as follows:
If a Kruskal-Wallis test is to be performed, the sum of the rankings for Supplier 1 is 45.

A dependent variable is the variable that we wish to predict or explain in a regression
model.
Lube-Tech is a major chain whose primary business is performing lube and oil changes
for passenger vehicles. The national operations manager has stated in an industry
newsletter that the mean number of miles between oil changes for all passenger cars
exceeds 4,200 miles. To test this, an industry group has selected a random sample of
100 vehicles that have come into a lube shop and determined the number of miles since
the last oil change and lube. The sample mean was 4,278 and the standard deviation
was known to be 780 miles. Based on a significance level of 0.10, the critical value for
the test is approximately z = 1.28.
The sales data for a company measured weekly for the past year would be considered
cross-sectional data since the sales values are computed from the entire company.

A pharmaceutical company conducts a study where 50 patients are given a drug. They
find that 10 percent of patients experience nausea as a side effect. This 10 percent is an
example of a parameter.
It has been determined the weight of bricks made by the Dillenger Stone Company is
uniformly distributed between 1 and 1.5 pounds. Based on this information, the
probability that two randomly selected bricks will each weigh more than 1.3 pounds is
0.16.
One of the most common sources of common cause variation is the people who are
working in the process.

In one-way analysis of variance, the within-sample variation is not affected by whether
the null hypothesis is true or not.
An analyst for a financial investment firm recently went through the effort to determine
the required sample size for estimating the mean number of transactions per year for the
clients of his firm. The calculations, which were based on a 95 percent confidence level
and a margin of error of 3, gave a required sample size of 300. Given this information,
the value used for the population standard deviation must have been about 26.5
transactions.
Total process variation is made up of the sum of common cause variation and special
cause variation.

When a variance is calculated for a data set, the resulting value is the same regardless of
whether the data set is treated as a population or a sample.
The chance of making a Type II statistical error increases if the “true” population mean
is closer to the hypothesized population mean, all other factors held constant.
If a scatter diagram shows points that are reasonably aligned and are sloping downward
from left to right, this implies that there is a negative linear relationship between the
two variables.
In a study of 30 customers’ utility bills in which the monthly bill was the dependent
variable and the number of square feet in the house is the independent variable, the
resulting regression model is = 23.40 + 0.4x. Given this, the sample correlation
coefficient is known to be positive.
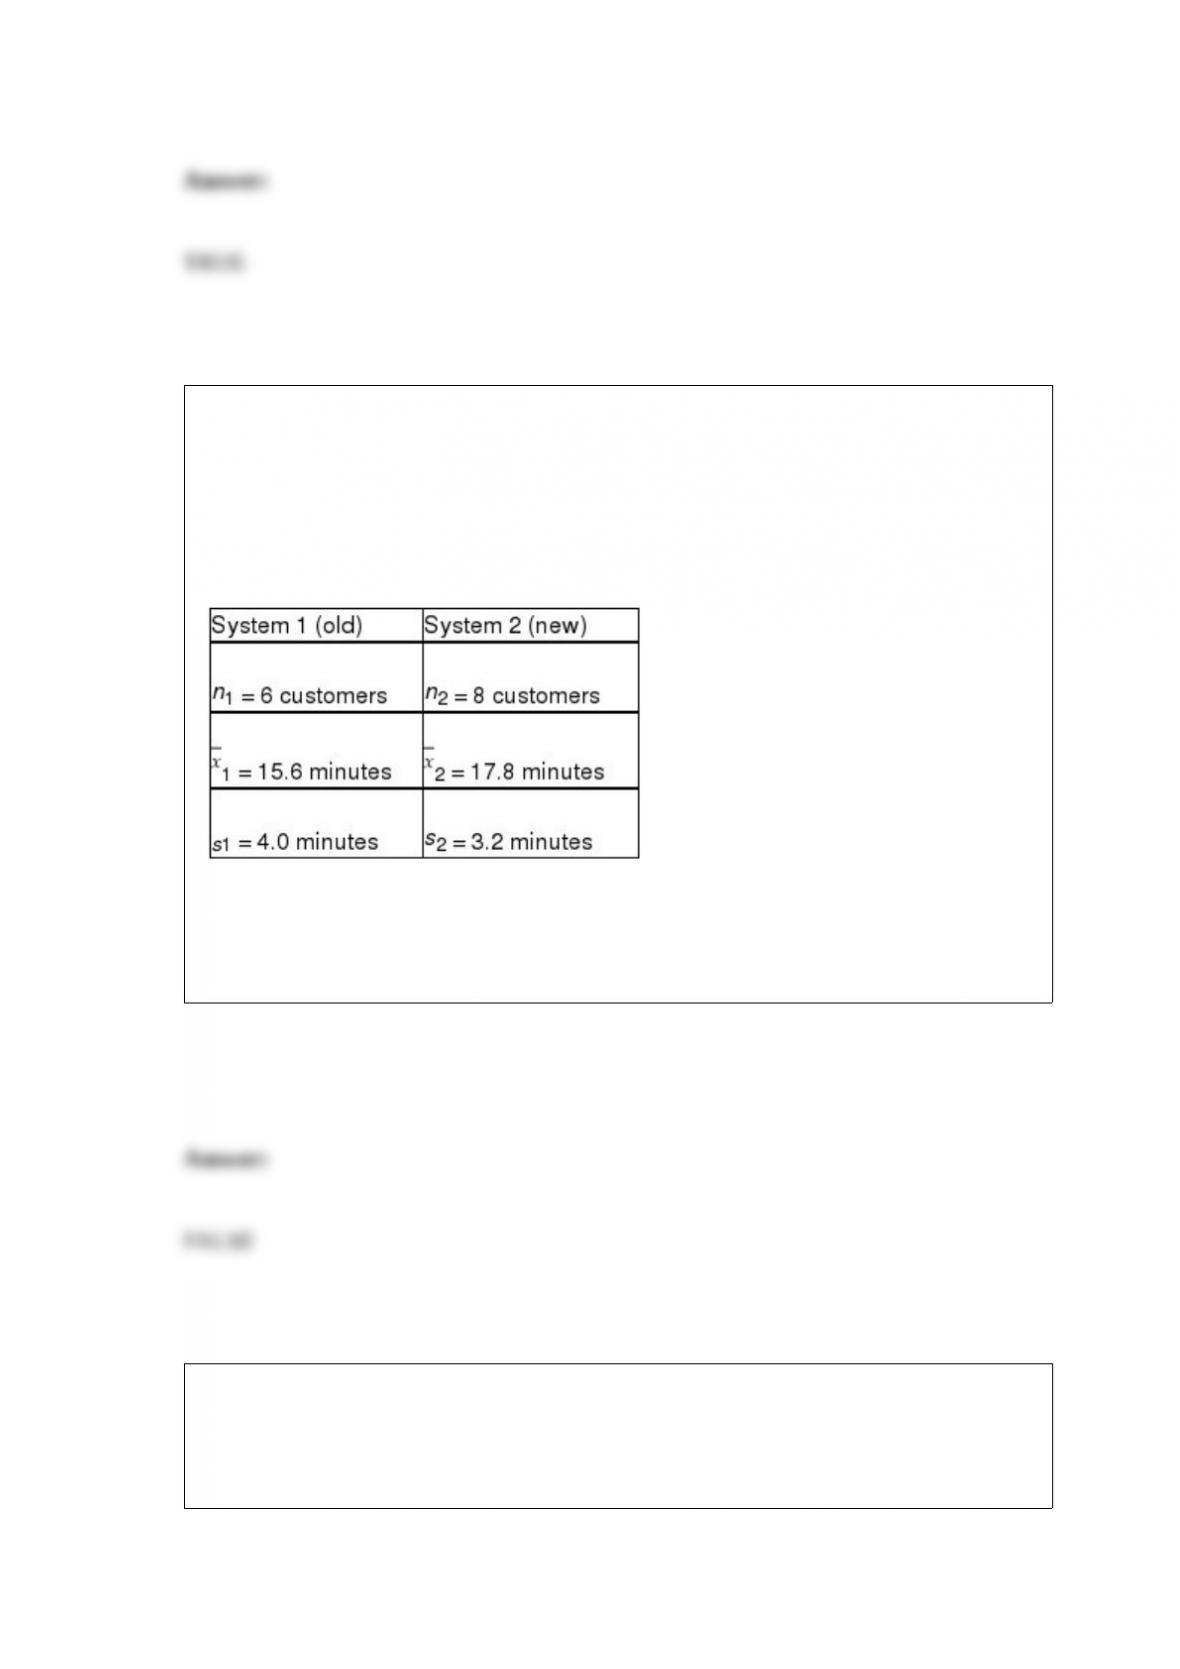
One of the key quality characteristics in many service environments is that the variation
in service time be reasonably small. Recently, a major amusement park company
initiated a new line system at one of its parks. It then wished to compare this new
system with the old system in place at a comparable park in another state. At issue is
whether the standard deviation in waiting time is less under the new line system than
under the old line system. The following information was collected:
Assuming that it wishes to conduct the test using a 0.05 level of significance, the null
hypothesis should be rejected since the test statistic exceeds the F-critical value from
the F-distribution table.
Six food critics each visited and rated four different restaurants. Each critic visited each
restaurant on three separate occasions and recorded a score for each visit. The critical
value for testing whether there is any difference among the four restaurants, using the
0.05 level of significance is approximately F = 2.8.

Standard stepwise regression is a good way of identifying potential multicollinearity
problems since we are able to see the impact on the model at each step that occurs when
a new variable is added to the model. For instance, if bringing in a new variable causes
the sign to change on a previously entered variable, we have evidence of
multicollinearity.
In conducting a test of independence for a contingency table that has 4 rows and 3
columns, the number of degrees of freedom is 11.
A bar chart is the same as a histogram.

The standard normal distribution table provides probabilities for the area between the
z-value and the population mean.
One reason for examining the adjusted R-square value in a multiple regression analysis
is that the R-square value will increase just by adding additional independent variables
to the model, whereas the adjusted R-square accounts for the relationship between the
number of independent variables and the sample size and may actually decline if
inappropriate independent variables are included in the model.
The Wilcoxon signed rank test should be used in place of the t-test whenever the sample
size is less than 20.
The manager of an online shop wants to determine whether the mean length of calling
time of its customers is significantly more than 3 minutes. A random sample of 100
customers was taken. The average length of calling time in the sample was 3.1 minutes
with a standard deviation of 0.5 minutes. At a 0.05 level of significance, it can be
concluded that the mean of the population is:
A) significantly greater than 3.
B) not significantly greater than 3.
C) significantly less than 3.
D) not significantly different from 3.10.
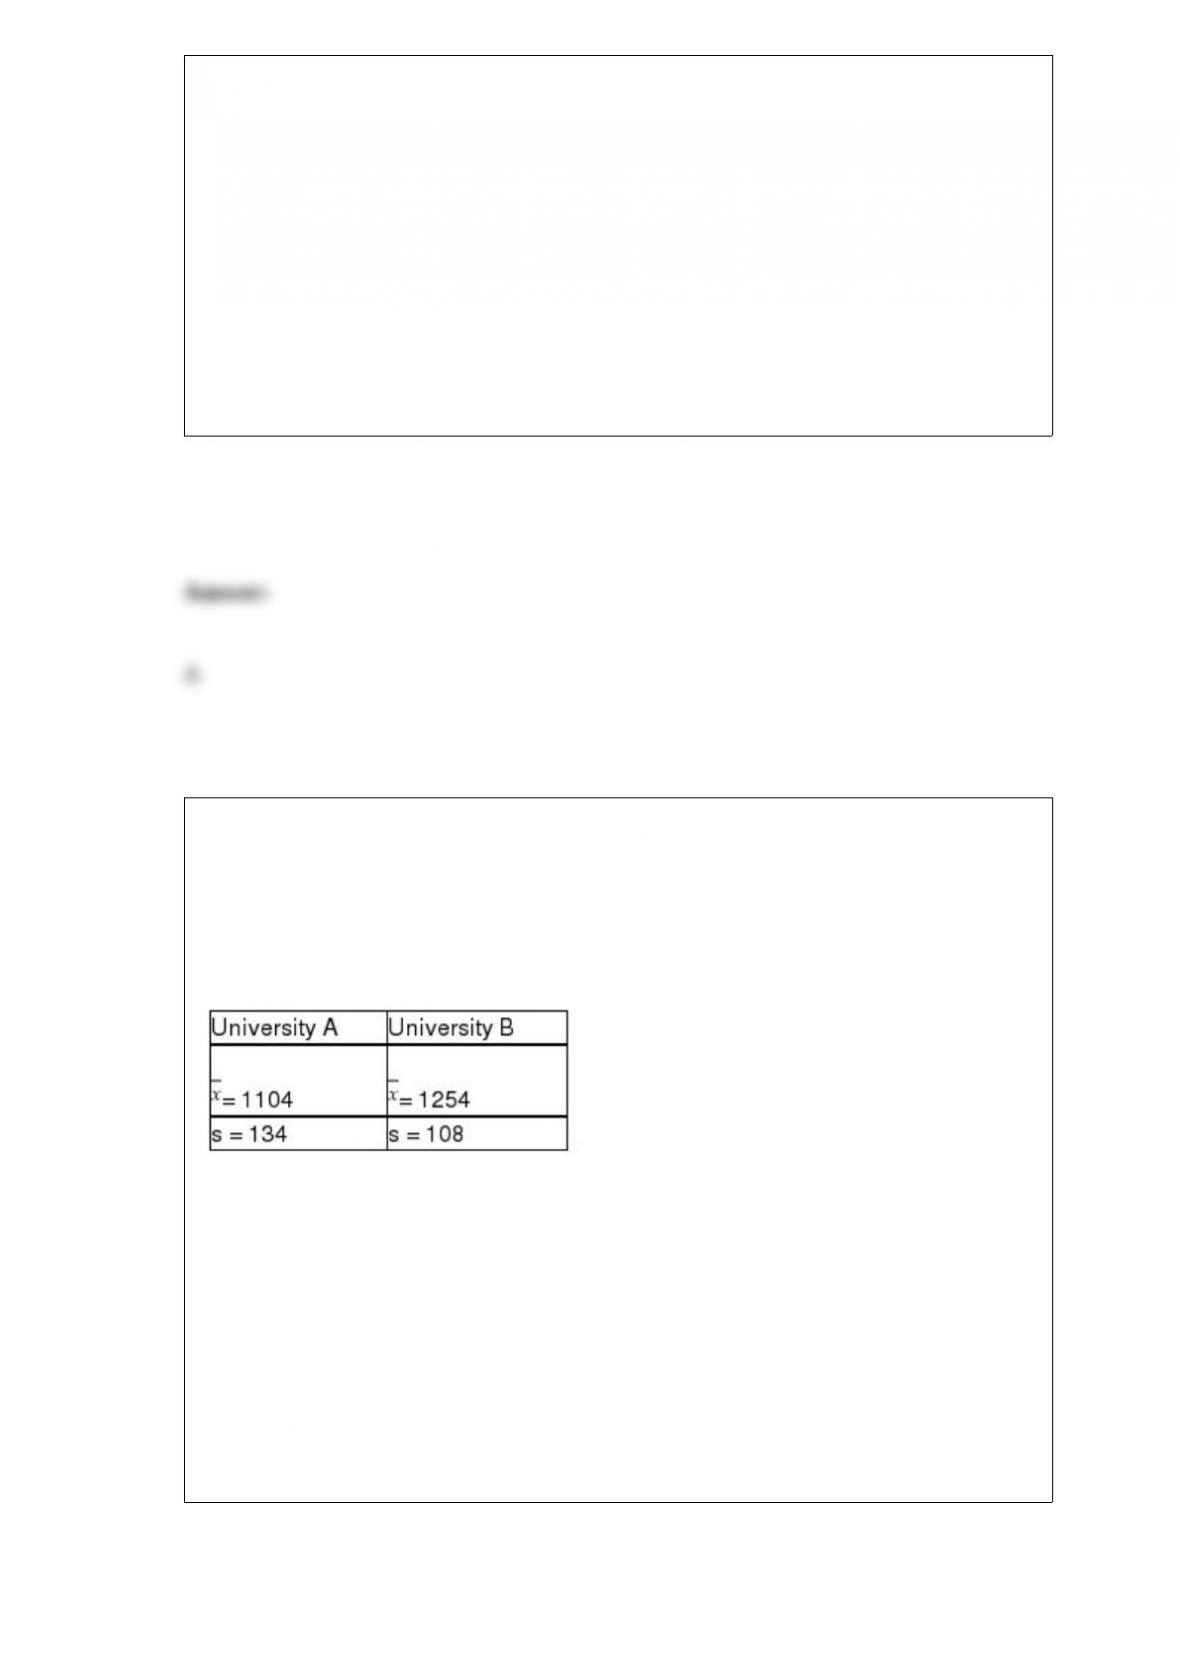
It is believed that the SAT scores for students entering two state universities may have
different standard deviations. Specifically, it is believed that the standard deviation at
University A is greater than the standard deviation at University B. To test this using an
alpha = 0.05 level, a sample of 14 student SAT scores from University A was selected
and a sample of 8 SAT scores from University B was selected. The following sample
results were observed:
Based on this information, what is the critical value that will be used to test the
hypothesis?
A) = 3.55
B) = 2.832
C) z = 1.645
D) = 3.237

If the residuals have a constant variance, which of the following should be evident?
A) The residuals should have a variance equal to zero for all levels of the independent
variable.
B) The plot of the residuals against each x variable should show that the spread in the
residuals is about the same at all levels of each of the independent variables.
C) The average residual should be about zero and the residual standard deviation should
be approximately 1.
D) None of the above
In a randomized complete block design analysis of variance, which of the following
correctly describes the number of degrees of freedom associated with the between sum
of squares?
A) One less than the number of populations involved
B) One less than the number of blocks
C) One less than the combined sample size in the experiment
D) One less than the total number of observations
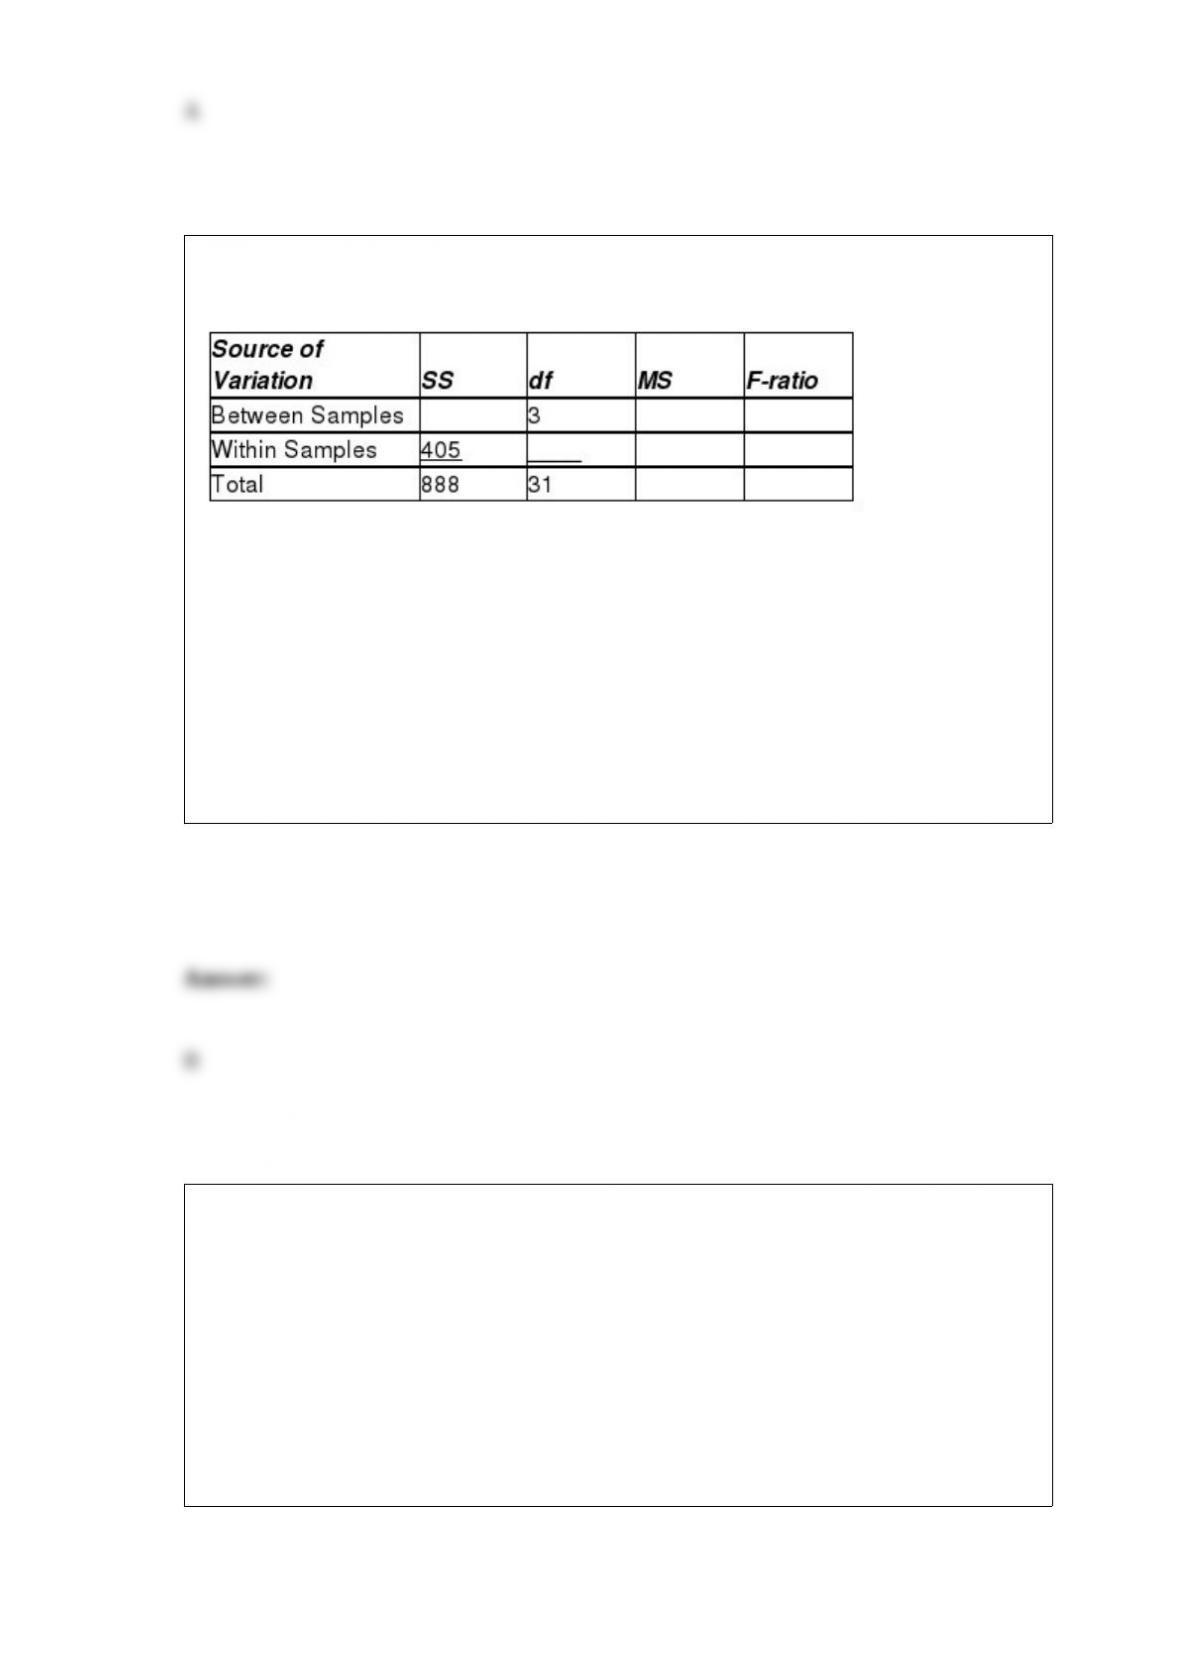
Respond to the following questions using this partially completed one-way ANOVA
table:
How many different populations are being considered in this analysis?
A) 2
B) 4
C) 6
D) 5
What method of probability assessment would most likely be used to assess the
probability that a major earthquake will occur in California in the next three years?
A) Classical probability based on the ratio of the number of ways the event can occur
B) Relative frequency based on previous history
C) Subjective probability based on expert opinion
D) Independent probability based on two unrelated outcomes

United Manufacturing and Supply makes sprinkler valves for use in residential
sprinkler systems. United supplies these valves to major companies such as Rain Bird
and Nelson, who in turn sell sprinkler products to retailers. United recently entered into
a contract to supply 40,000 sprinkler valves. The contract called for at least 97% of the
valves to be free of defects. Before shipping the valves, United managers tested 200
randomly selected valves and found 190 defect-free valves in the sample. The managers
wish to know the probability of finding 190 or fewer defect-free valves if in fact the
population of 40,000 valves is 97% defect-free. The probability is:
A) 0.0111
B) 0.0612
C) 0.0475
D) 0.0212
Given the following null and alternative hypotheses
H0 : μ1 – μ2 = 0
HA : μ1 – μ2 ≠ 0
Together with the following sample information
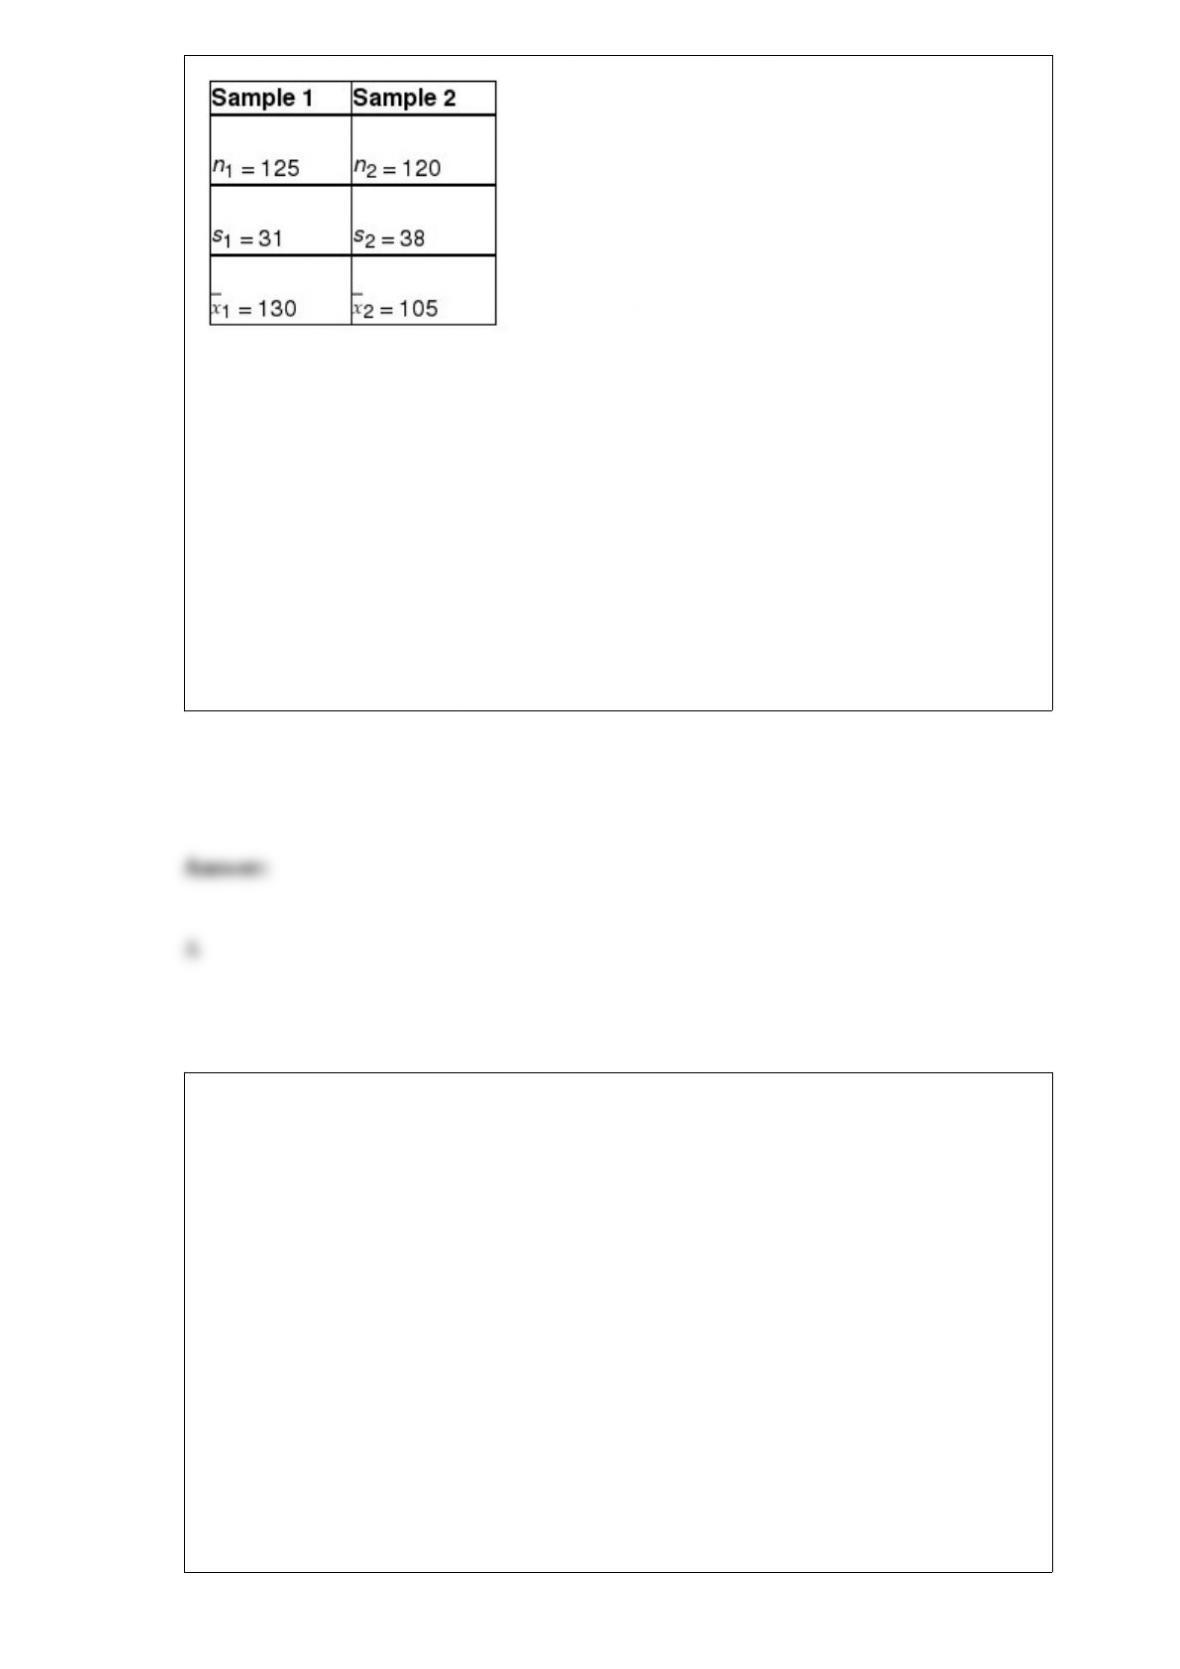
Develop the appropriate decision rule, assuming a significance level of 0.05 is to be
used.
A) If t > 1.9698 or t < -1.9698 reject H0, otherwise do not reject H0
B) If t > 1.5412 or t < -1.5412 reject H0, otherwise do not reject H0
C) If t > 1.8157 or t < -1.8157 reject H0, otherwise do not reject H0
D) If t > 2.0124 or t < -2.0124 reject H0, otherwise do not reject H0
Dell Computers receives large shipments of microprocessors from Intel Corp. It must
try to ensure the proportion of microprocessors that are defective is small. Suppose Dell
decides to test five microprocessors out of a shipment of thousands of these
microprocessors. Suppose that if at least one of the microprocessors is defective, the
shipment is returned.
Calculate the probability that the entire shipment will be kept by Dell even though the
shipment has 10% defective microprocessors.
A) 0.3995
B) 0.3979
C) 0.5905
D) 0.4550

In a multiple regression analysis involving 15 independent variables and 200
observations, SST = 800 and SSE = 240. The adjusted coefficient of determination is
A) 0.15
B) 0.50
C) 0.66
D) 0.70
If you are interested in testing whether the median of a population is equal to a specific
value, an appropriate test to use is:
A) the Mann-Whitney U test.
B) the t-test.
C) the Wilcoxon signed rank test.
D) the Wilcoxon Matched-Pairs Signed Rank test.

The State Transportation Department is thinking of changing its speed limit signs. It is
considering two new options in addition to the existing sign design. At question is
whether the three sign designs will produce the same mean speed. To test this, the
department has conducted a limited test in which a stretch of roadway was selected.
With the original signs up, a random sample of 30 cars was selected and the speeds
were measured. Then, on different days, the two new designs were installed, 30 cars
each day were sampled, and their speeds were recorded. Suppose that the following
summary statistics were computed based on the data:
Based on these sample results and significance level equal to 0.05, the sum of squares
between is:
A) approximately 3,586.
B) approximately 2,430.
C) approximately 1,215.
D) None of the above
In a one-way ANOVA, which of the following is true?
A) The degrees of freedom associated with the between sum of squares is equal to one
less than the number of populations.
B) The critical value will be an F-value from the F distribution.
C) If the null hypothesis is rejected, it may still be possible that two or more of the
population means are equal.
D) All of the above

The method of probability assessment that relies on an examination of historical data
from similar situations is:
A) relative frequency of occurrence.
B) classical assessment.
C) historical assessment.
D) subjective assessment.
For the following hypothesis test:
With n = 15, s = 7.5, and = 62.2, state the calculated value of the test statistic t.
A) 1.014
B) 0.012
C) 0.878
D) 1.312
Which of the following probability distributions can be used to describe the distribution
for a continuous random variable?
A) Normal distribution
B) Binomial distribution
C) Poisson distribution
D) Hypergeometric
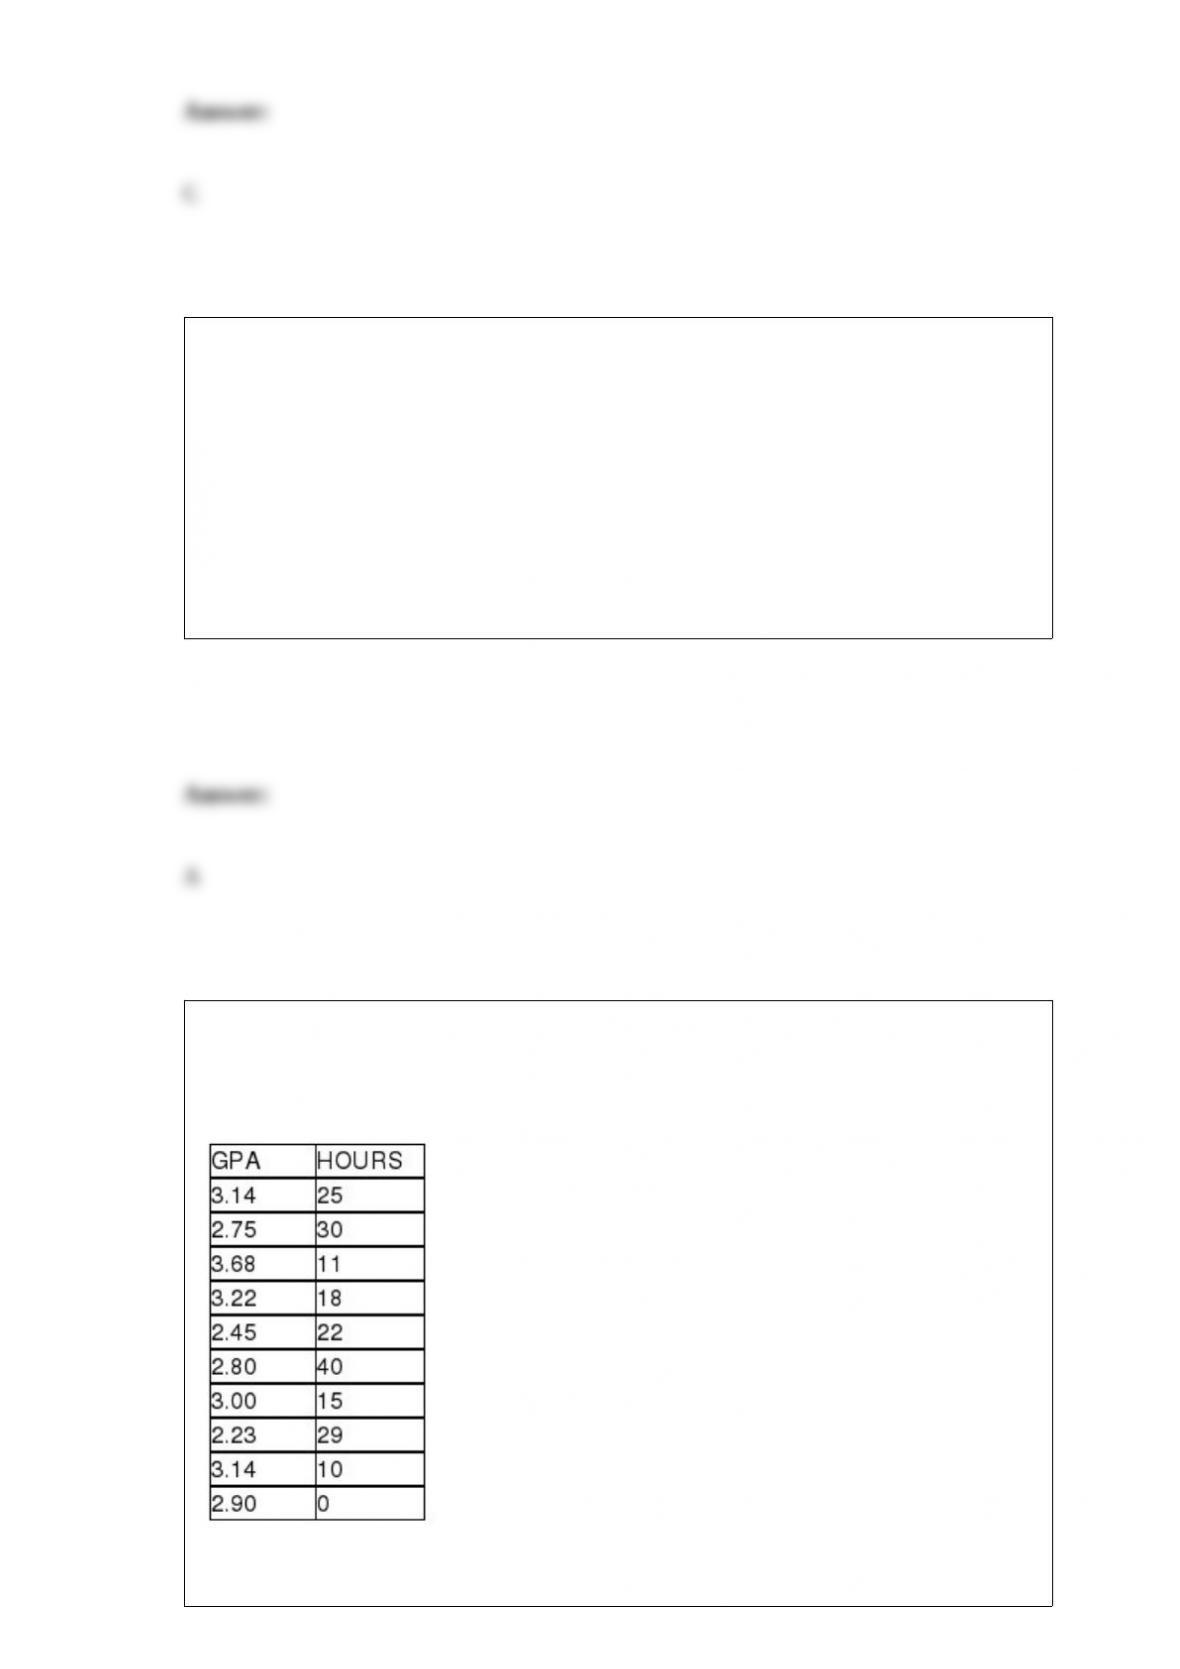
State University recently randomly sampled ten students and analyzed grade point
average (GPA) and number of hours worked off-campus per week. The following data
were observed:
The test statistic for testing whether the two variables are significantly correlated is
approximately z = 1.56.
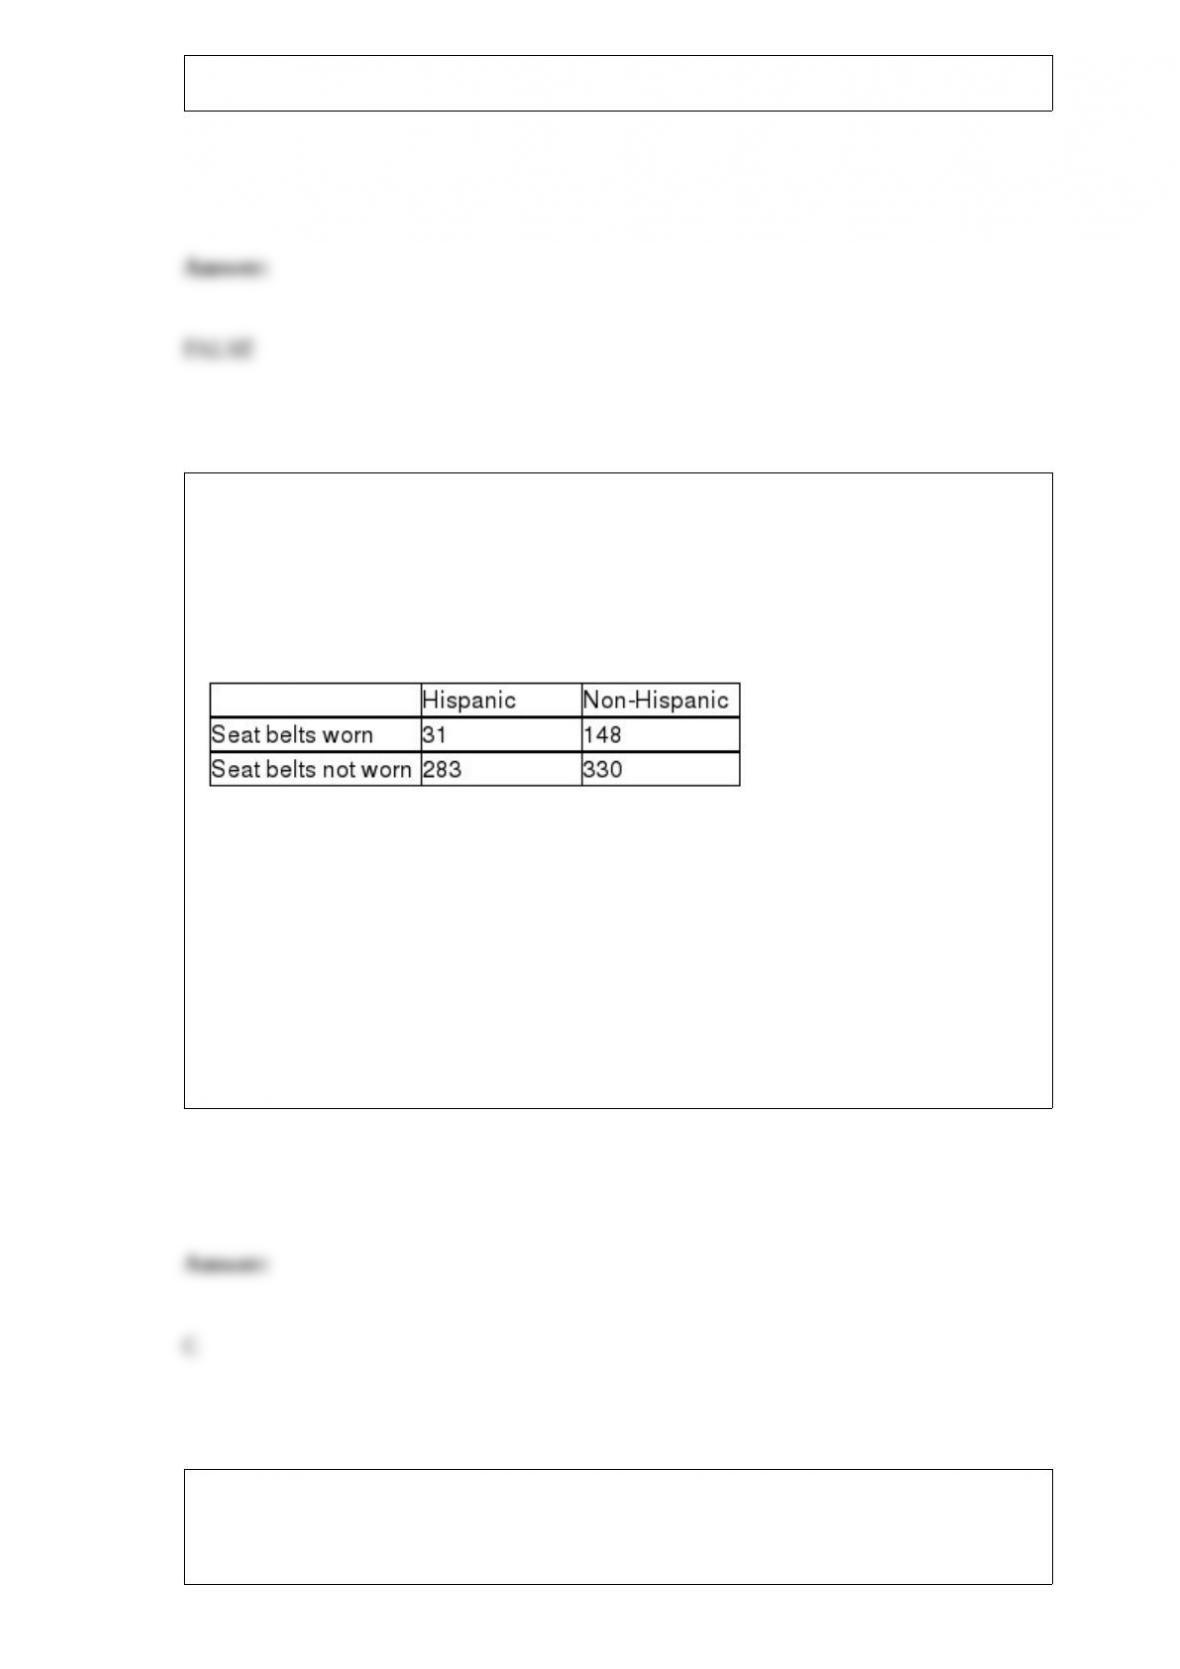
A study published in the American Journal of Public Health was conducted to
determine whether the use of seat belts in motor vehicles depends on ethnic status in
San Diego County. A sample of 792 children treated for injuries sustained from motor
vehicle accidents was obtained, and each child was classified according to (1) ethnic
status (Hispanic or non-Hispanic) and (2) seat belt usage (worn or not worn) during the
accident. The number of children in each category is given in the table below.
Referring to these data, the calculated test statistic is:
A) approximately -0.9991
B) nearly -0.1368
C) about 48.1849
D) approximately 72.8063
Which of the following is not an assumption of the Mann-Whitney U test?
A) The sample sizes are equal.

B) The samples are independent.
C) The value measured is continuous.
D) The population distributions are the same for shape and spread.
Assuming that a regression has been conducted for a group of small companies where x
= the number of employees at the company, y = annual revenue of the company
(recorded in thousands of dollars), and the largest company included in the study had 82
employees. The resulting regression equation is = 59.2 + 83.4x. Which of the
following is true?
A) For each additional employee, revenue on average will increase by $83.4
B) A company with 2100 employees could be predicted to have average revenue of
about $175 million.
C) For each additional employee, revenue on average will increase by $59.2 thousand.
D) This model should not be used to make predictions for companies with more than 82
employees.
The critical value in a null hypothesis test is called alpha.

The number of visible defects on a product container is thought to be Poisson
distributed with a mean equal to 3.5. Based on this, the probability that 2 containers will
contain a total of less than 2 defects is:
A) 0.0223
B) 0.1359
C) 0.0073
D) 0.1850
Which of the following describes a treatment in a randomized complete block analysis
of variance?
A) A treatment is a combination of one level of each factor.
B) A treatment is a level associated with each factor of the experiment.
C) A treatment is another term for the data that are collected in the experiment.
D) A treatment is considered to be the analysis that is performed on the sample data.

Which of the following statements is correct?
A) A process can be in statistical control, yet it can be producing defects in abundance.
B) At least three points outside the upper or lower control limits on a control chart are
required before the process is deemed to be out of control.
C) If a process is out of control, then the variation that is present is limited to common
cause variation.
D) When special cause variation is present, the process can be expected to be in control.
Suppose as part of a national study of economic competitiveness a marketing research
firm randomly sampled 200 adults between the ages of 27 and 35 living in metropolitan
Seattle and 180 adults between the ages of 27 and 35 living in metropolitan
Minneapolis. Each adult selected in the sample was asked, among other things, whether
they had a college degree. From the Seattle sample 66 adults answered yes and from the
Minneapolis sample 63 adults answered yes when asked if they had a college degree.
Based on the sample data, can we conclude that there is a difference between the
population proportions of adults between the ages of 27 and 35 in the two cities with
college degrees? Use a level of significance of 0.10 to conduct the appropriate
hypothesis test.
A) Since the test statistic, 1.8214, is greater than the critical value of 1.645, reject the
null hypothesis and conclude that there is a higher proportion of Seattle adults that have
a college degree
B) Since the test statistic, 2.0112, is greater than the critical value of 1.645, reject the
null hypothesis and conclude that there is a higher proportion of Seattle adults that have
a college degree.
C) Since the test statistic, 0.7001, is not greater than the critical value of 1.645, do not
reject the null hypothesis and conclude that there is not a higher proportion of Seattle
adults that have a college degree.
D) Since the test statistic, 0.8921, is not greater than the critical value of 1.645, do not
reject the null hypothesis and conclude that there is not a higher proportion of Seattle

adults that have a college degree.
A company that makes shampoo wants to test whether the average amount of shampoo
per bottle is 16 ounces. The standard deviation is known to be 0.20 ounces. Assuming
that the hypothesis test is to be performed using 0.10 level of significance and a random
sample of n = 64 bottles, which of the following would be the correct formulation of the
null and alternative hypotheses?
A) H0 : = 16
HA : = 16
B) H0 : μ = 16
HA : μ ≠ 16
C) H0 : μ ≥ 16
HA : μ < 16
D) H0 : ≥ 16
HA : < 16
A plywood manufacturer is interested in monitoring the thickness of the plywood.
Which of the following would be most useful for doing this?
A) p-charts
B) c-charts
C) -charts
D) Histograms
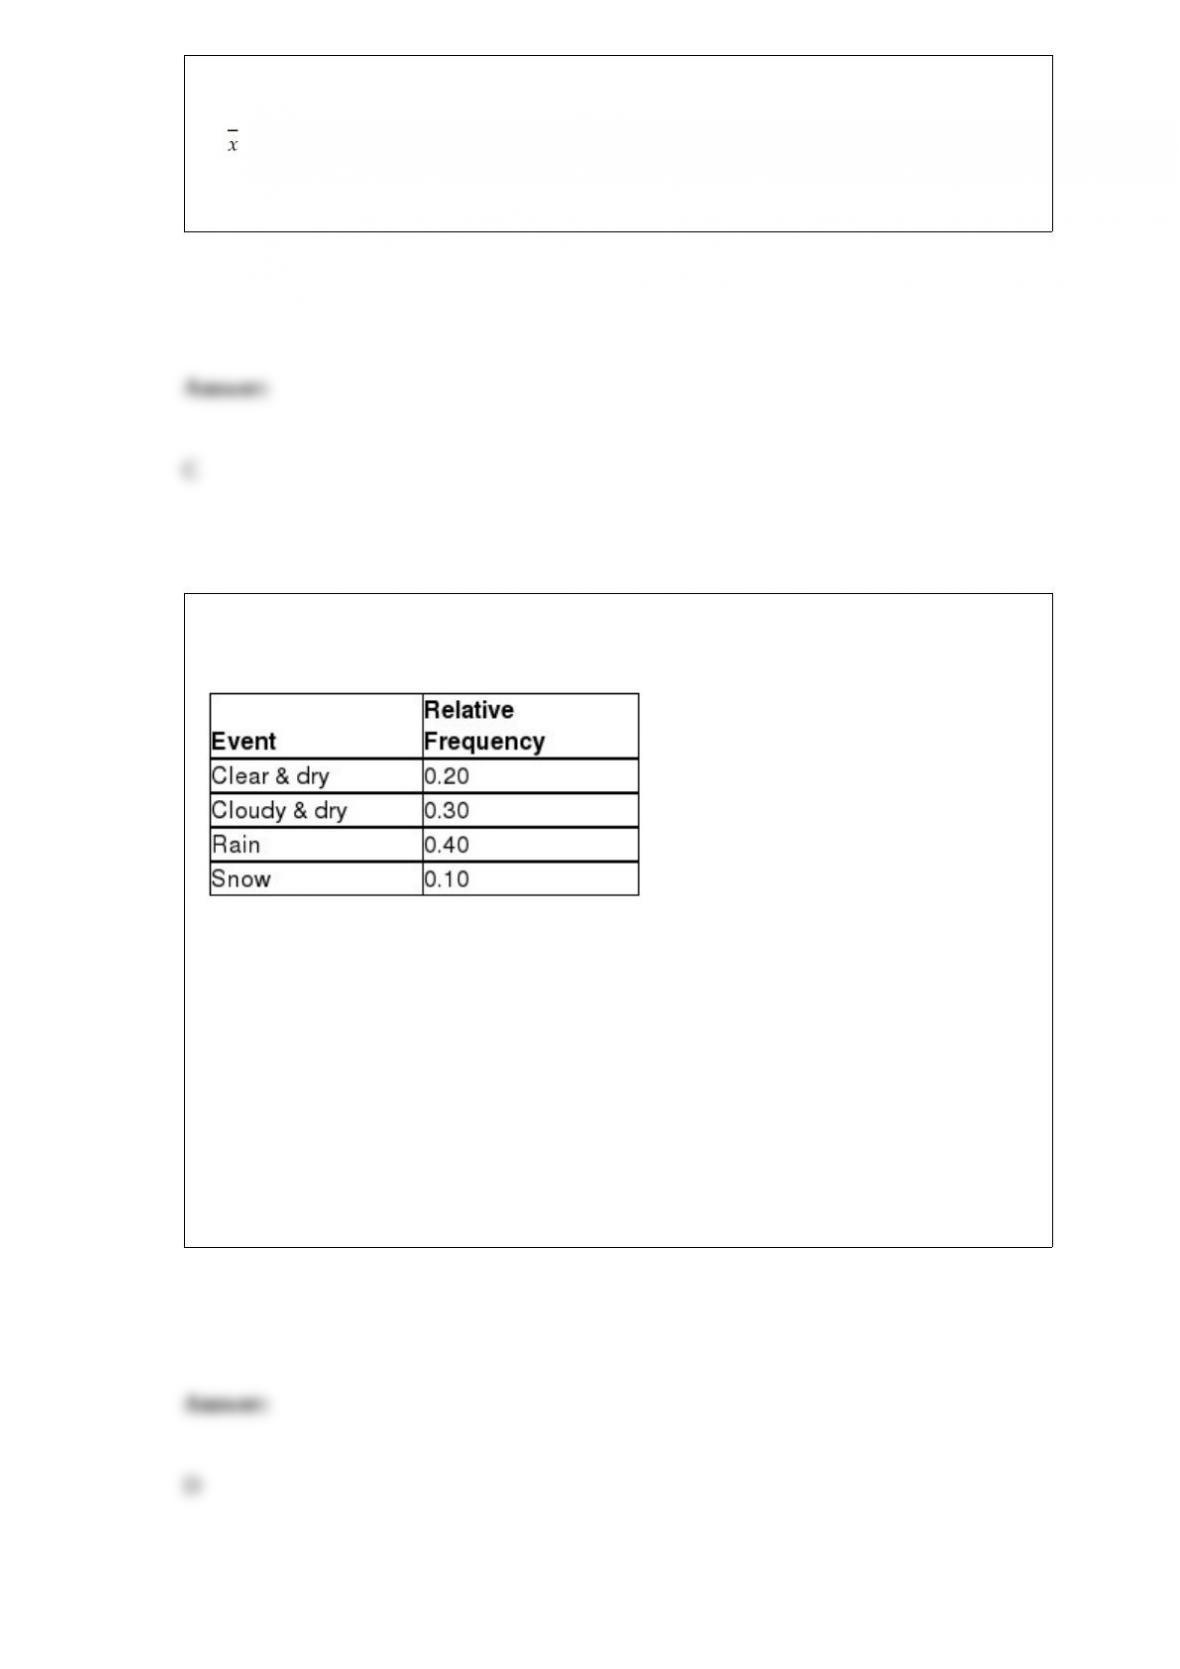
Based on weather data collected in Racine, Wisconsin, on Christmas Day, the weather
had the following distribution:
Based on the data, what is the probability that next Christmas will be rainy or cloudy
and dry?
A) 0.45
B) 0.50
C) 0.60
D) 0.70
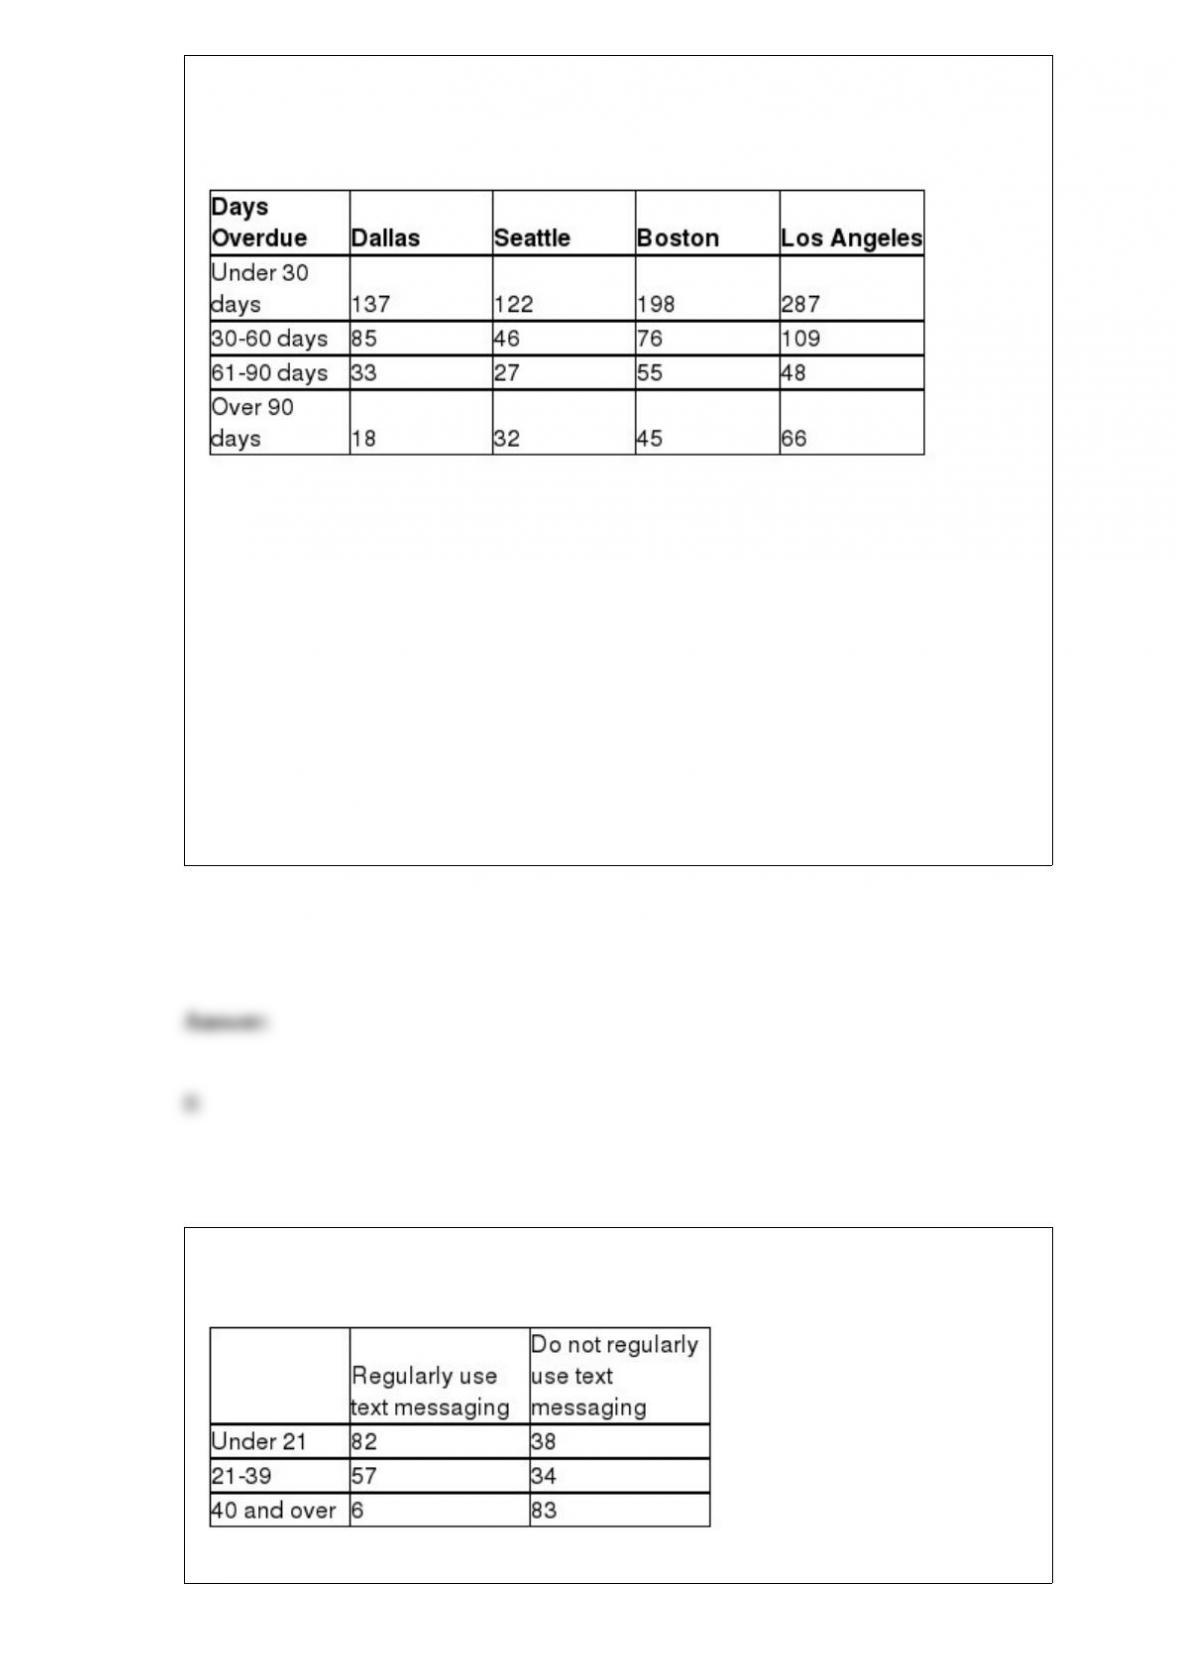
Micron Technology has sales offices located in four cities: Dallas, Seattle, Boston, and
Los Angeles. An analysis of the company’s accounts receivables reveals the number of
overdue invoices by days, as shown here.
Assume the invoices are stored and managed from a central database.
What is the probability that a randomly selected invoice from the database is over 90
days old and from the Seattle office?
A) 0.2702
B) 0.0231
C) 0.3461
D) 0.7765
A cell phone company wants to determine if the use of text messaging is independent of
age. The following data has been collected from a random sample of customers.
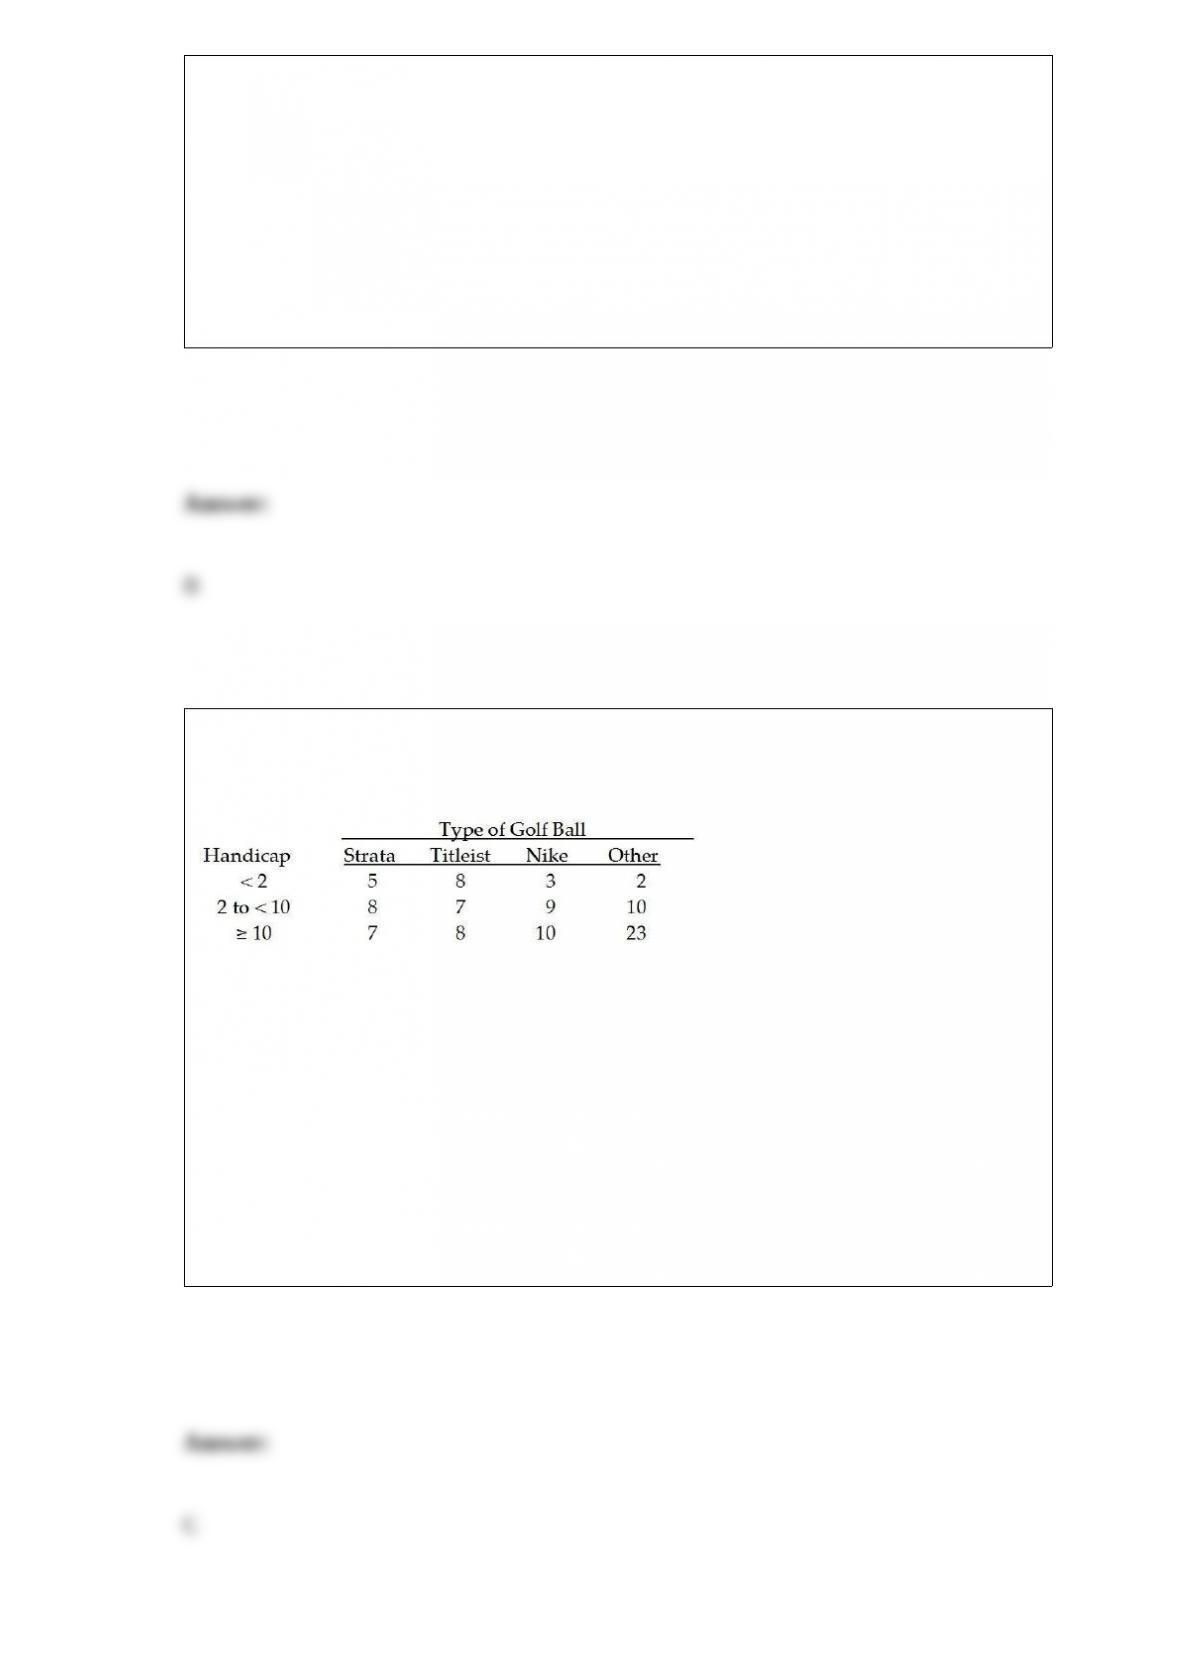
To conduct a contingency analysis, the value of the test statistic is:
A) 9.2104
B) 88.3
C) 275.02
D) 14.6
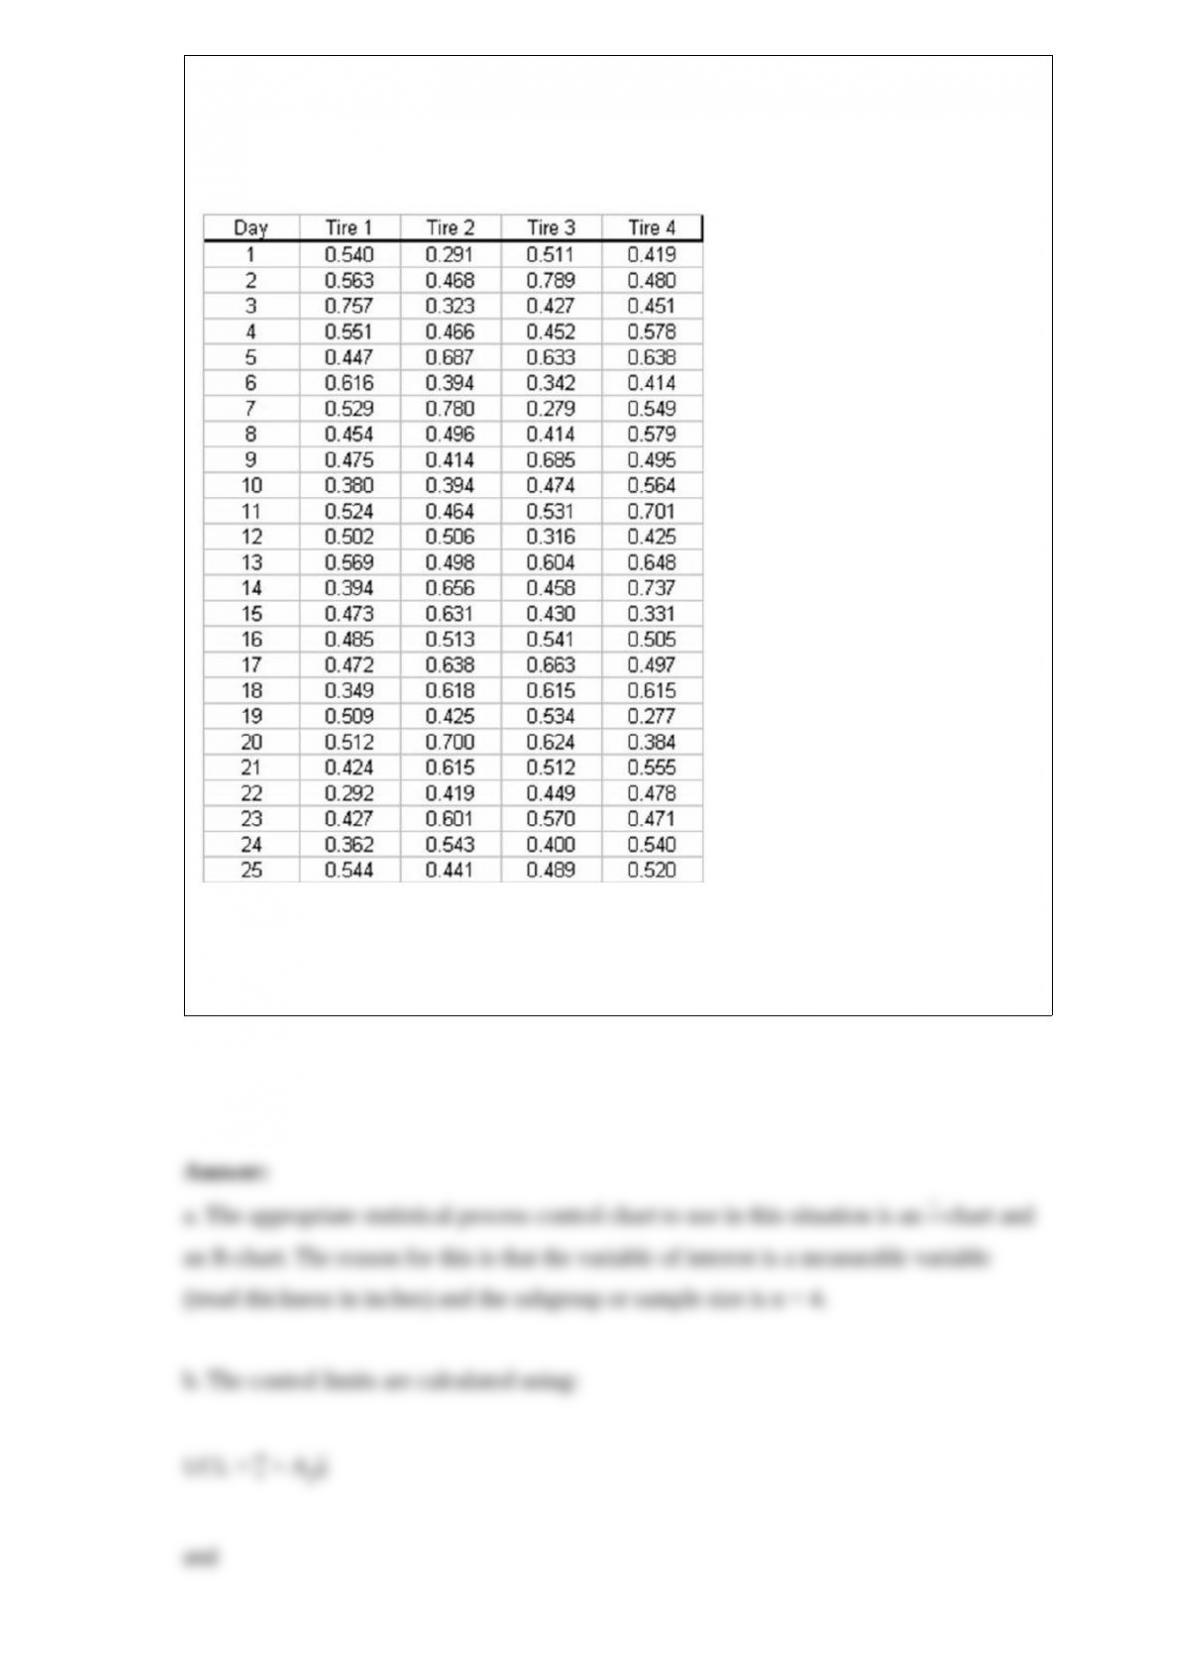
The managers of a local golf course have recently conducted a study of the types of golf
balls used by golfers based on handicap. A joint frequency table for the 100 golfers
covered in the survey is shown below:
If a player comes to the course using a Nike golf ball, the probability that he or she has
a handicap of at least 10 is:
A) 0.22
B) 0.48
C) slightly greater than 0.45
D) 0.10
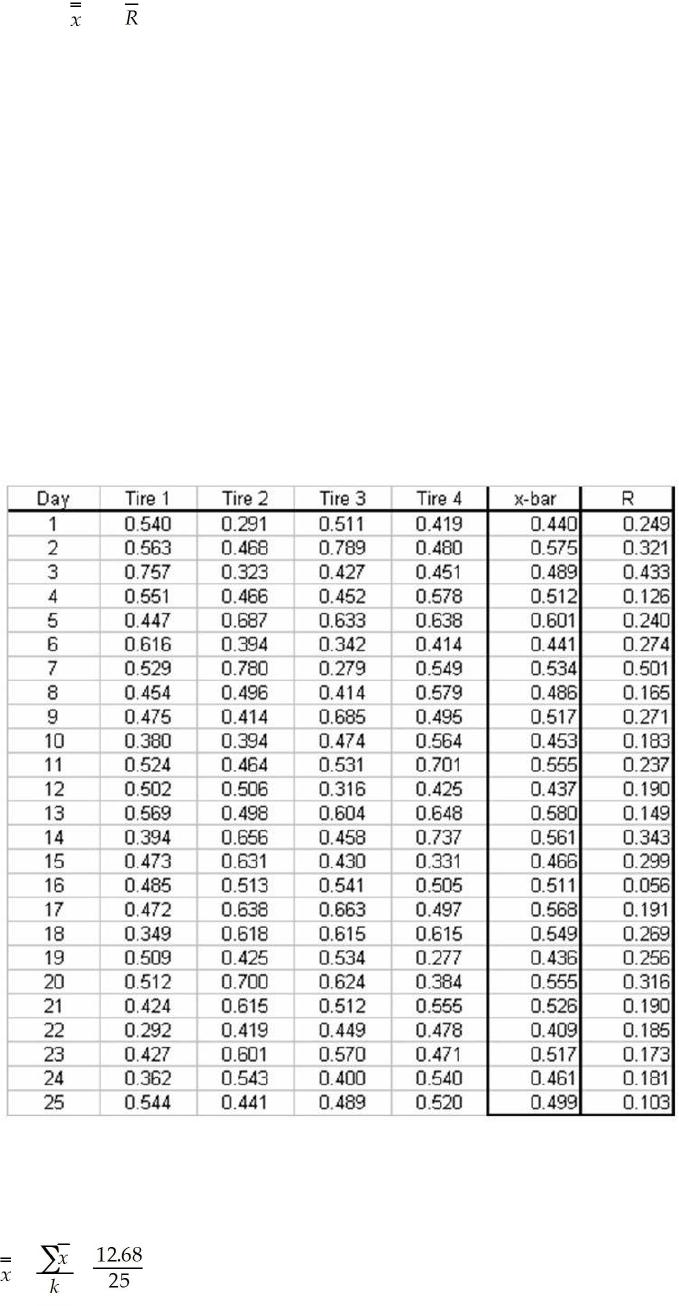
A tire company is interested in monitoring the process that produced tread thickness on
its tires. Every hour 4 tires are selected from production and the tread thickness is
measured. Data for the past 25 days is shown as follows:
a. What type of control chart would you recommend be used in this case?
b. Compute the upper and lower control limits for these data.
A random variable is normally distributed with a mean of 25 and a standard deviation of
5. If an observation is randomly selected from the distribution, what value will be
exceeded 10% of the time?
A) 31.40
B) 28.60
C) 66.23
D) 14.56
In performing chi-square contingency analysis, to overcome a small expected cell
frequency problem, we:
A) combine the categories of the row and/or column variables.
B) increase the sample size.
C) Both A and B
D) None of the above
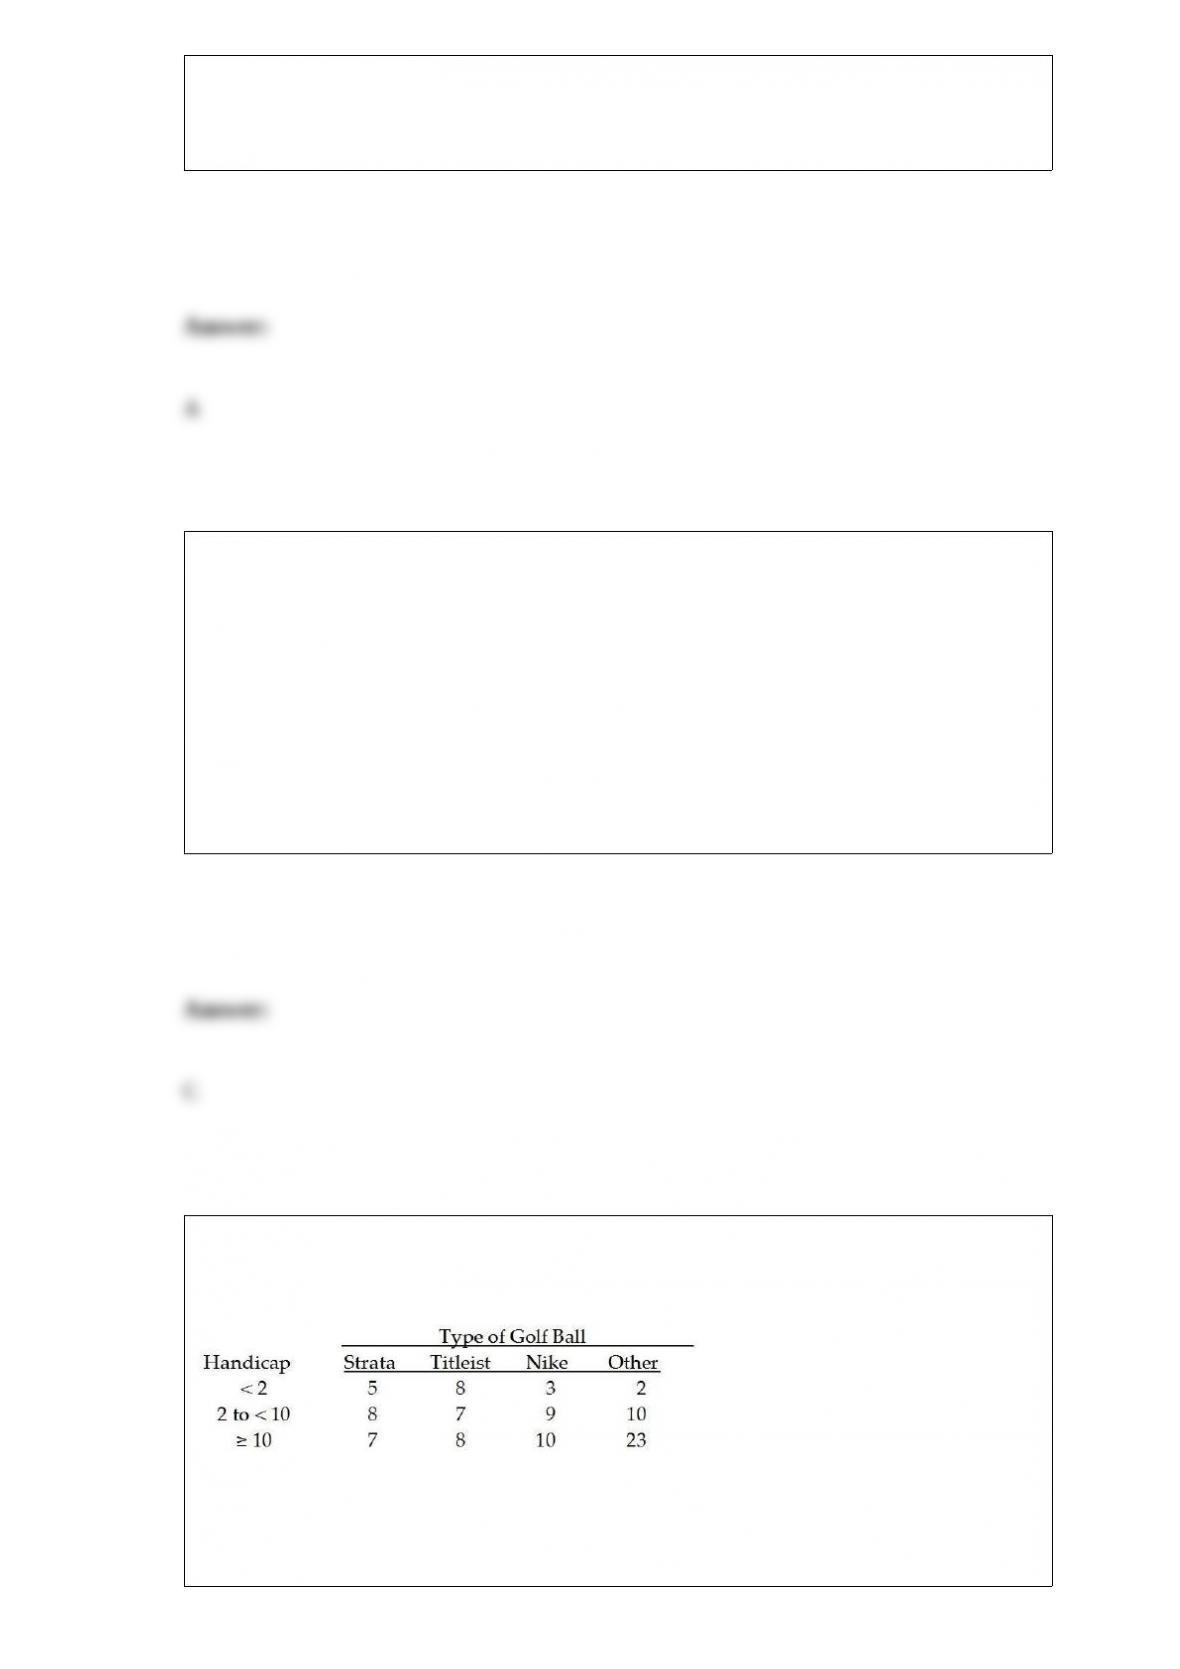
The managers of a local golf course have recently conducted a study of the types of golf
balls used by golfers based on handicap. A joint frequency table for the 100 golfers
covered in the survey is shown below:
Based on these data, the probability of someone using a Strata ball and having a
handicap under 2 is:

A) 0.05
B) 0.38
C) 0.25
D) None of the above