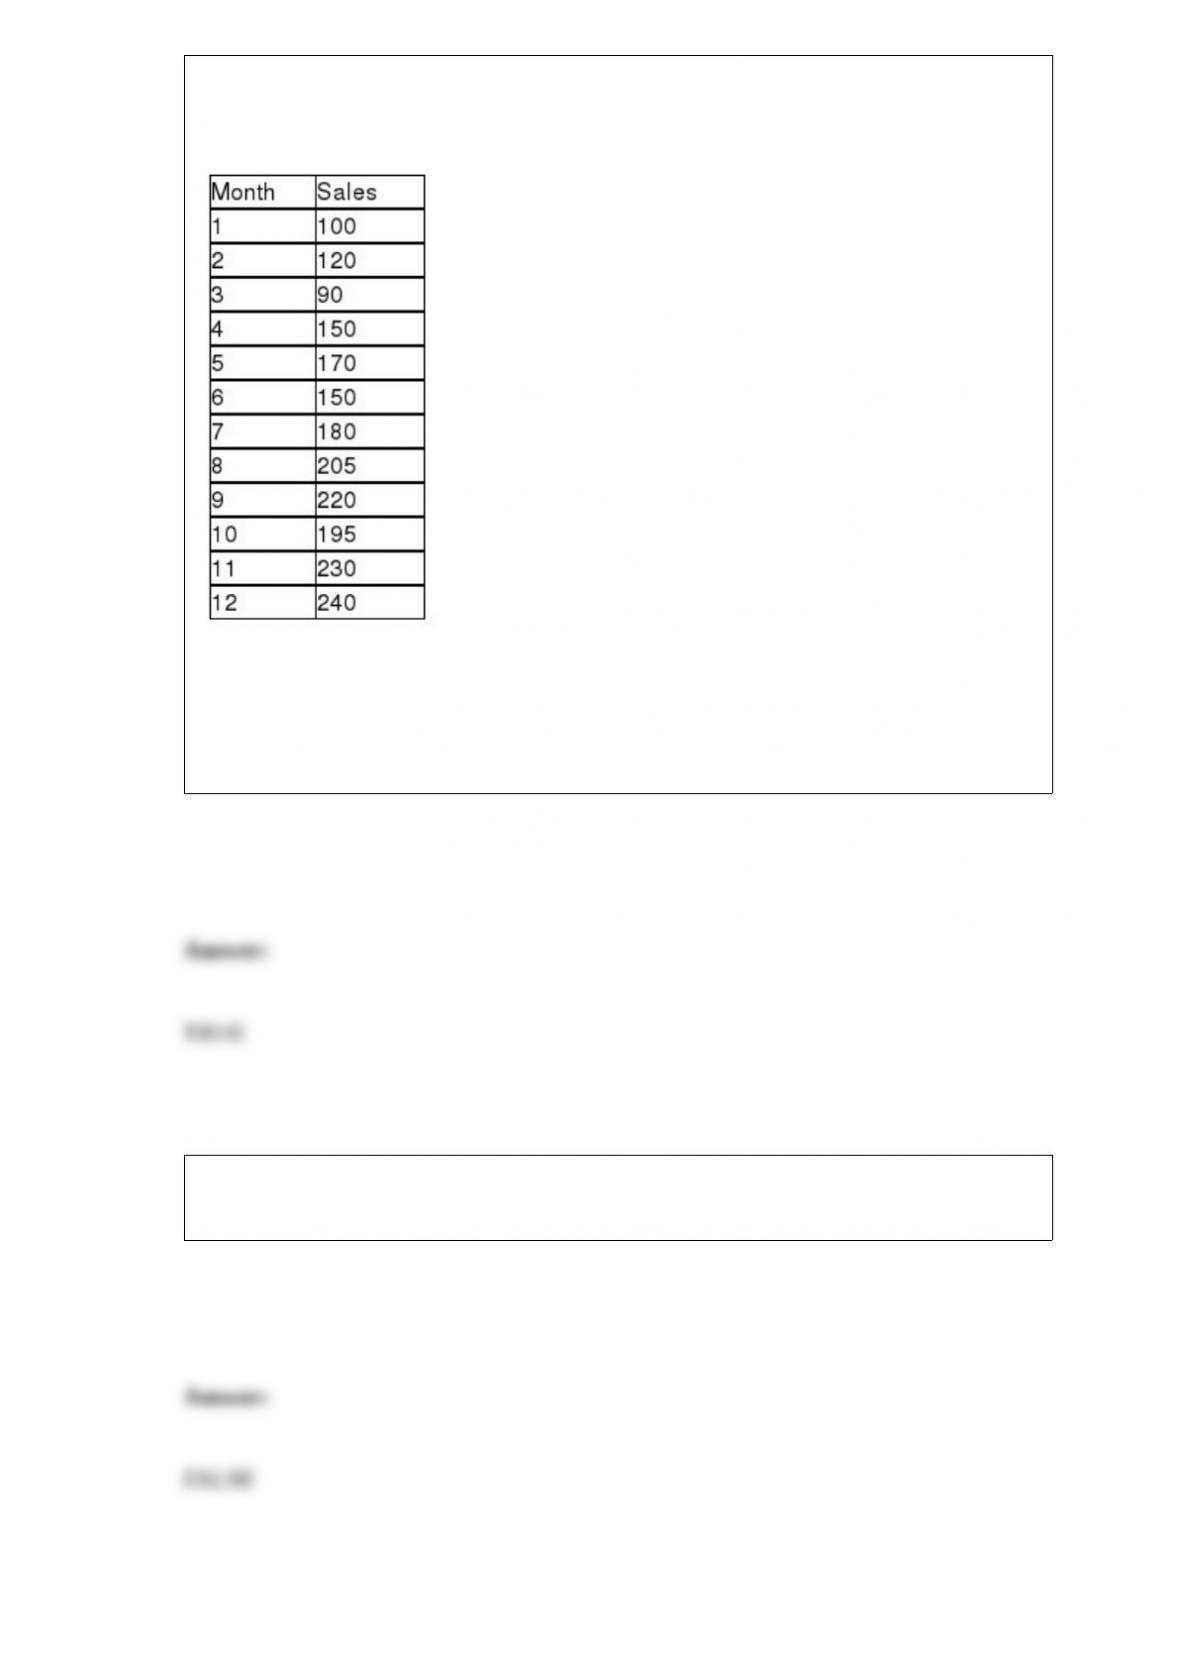
The Morgan Company is interested in developing a forecast for next month’s sales. It
has collected sales data for the past 12 months.
After analyzing these data, if the company wishes to use double exponential smoothing
with alpha = 0.20 and beta = 0.20, the starting values for the constant process and the
trend process can be derived from a linear trend regression model by using the intercept
and slope coefficient respectively.
The test statistic that is used when testing hypotheses about the difference between two
population proportions is the t-value from the t-distribution.

Special cause variation is variation in the output of a process that is naturally occurring
and expected and that may be the result of random causes.
Large values of the Durbin-Watson d statistic indicate that positive autocorrelation
among the forecast errors exists.
For a given significance level, increasing the sample size will tend to increase the
chi-square critical value used in testing the null hypothesis about a population variance.
When students are asked to list their age and the percentage of their college expenses
that they pay for themselves, the type of data being collected is quantitative.

If a simple least squares regression model is developed based on a sample where the
two variables are known to be positively correlated, the sign on the regression
coefficient will be positive also.
The best subsets method will involve trying fewer different regression models than
stepwise regression.
A bank manager wishes to estimate the mean waiting time spent by customers at his
bank. He knows from previous experience that the standard deviation is about 4.0
minutes. If he desires a 90 percent confidence interval estimate and wishes to have a
margin of error of 1 minute, the required sample size will be approximately 143.

To find a confidence interval for the difference between the means of independent
samples, when the variances are unknown but assumed equal, the sample sizes of the
two groups must be the same.
In comparing two distributions with the same mean, the coefficient of variation is the
only way to assess which distribution has the greatest relative variability.
If the Durbin-Watson d statistic has a value close to 2, there is reason to believe that
there is no autocorrelation between the forecast errors.
By combining cells we guard against having an inflated test statistic that could have led
us to incorrectly reject the H0.

In conducting a one-way analysis of variance, if the null hypothesis is true then the
variance between groups (MSB) should be approximately equal to the variance within
groups (MSW).
A publisher is interested in estimating the proportion of textbooks that students resell at
the end of the semester. He is interested in making this estimate using a confidence
level of 95 percent and a margin of error of 0.02. Based upon his prior experience, he
believes that π is somewhere around 0.60. Given this information, the required sample
size is over 2,300 students.
Given a regression equation of = 16 + 2.3x we would expect that an increase in x of
2.0 would lead to an average increase of y of 4.6.

A multiple regression model of the form = B0 + B1x + B2x2 + ε is called a
second-degree polynomial model.
An accounting firm has been hired by a large computer company to determine whether
the proportion of accounts receivables with errors in one division (Division 1) exceeds
that of the second division (Division 2). The managers believe that such a difference
may exist because of the lax standards employed by the first division. The null and
alternative hypotheses that will be tested are:
H0 : μ1 ≥ μ2
Ha : μ1 < μ2
The control limits in the x-bar chart are set so that 95 percent of the values will fall
inside the control limits when there is only common cause variation.

An electronics repair shop has determined that the time between failures for a particular
electronic component part is exponentially distributed with a mean time between
failures of 200 hours. Based on this information, the probability that a part will fail
between 20 and 100 hours is approximately 0.30.
In a multiple regression, the dependent variable is house value (in ‘000$) and one of the
independent variables is a dummy variable, which is defined as 1 if a house has a
garage and 0 if not. The coefficient of the dummy variable is found to be 5.4 but the
t-test reveals that it is not significant at the 0.05 level. Which of the following is true?
A) A garage increases the house value by $5,400.
B) A garage increases the house value by $5,400, holding all other independent
variables constant.
C) The house value remains the same with or without a garage.
D) We need to include other dummy variables.
Which of the following is the minimum number of required replications per cell for a

two-factor ANOVA design if you plan to test for interactive effects between factors A
and B?
A) 3
B) 1
C) 2
D) 5
The following sample data reflect electricity bills for ten households in San Diego in
March.
Compute the range, variance, and standard deviation for these sample data. Discuss
which of these three measures you would prefer to use as a measure of variation.
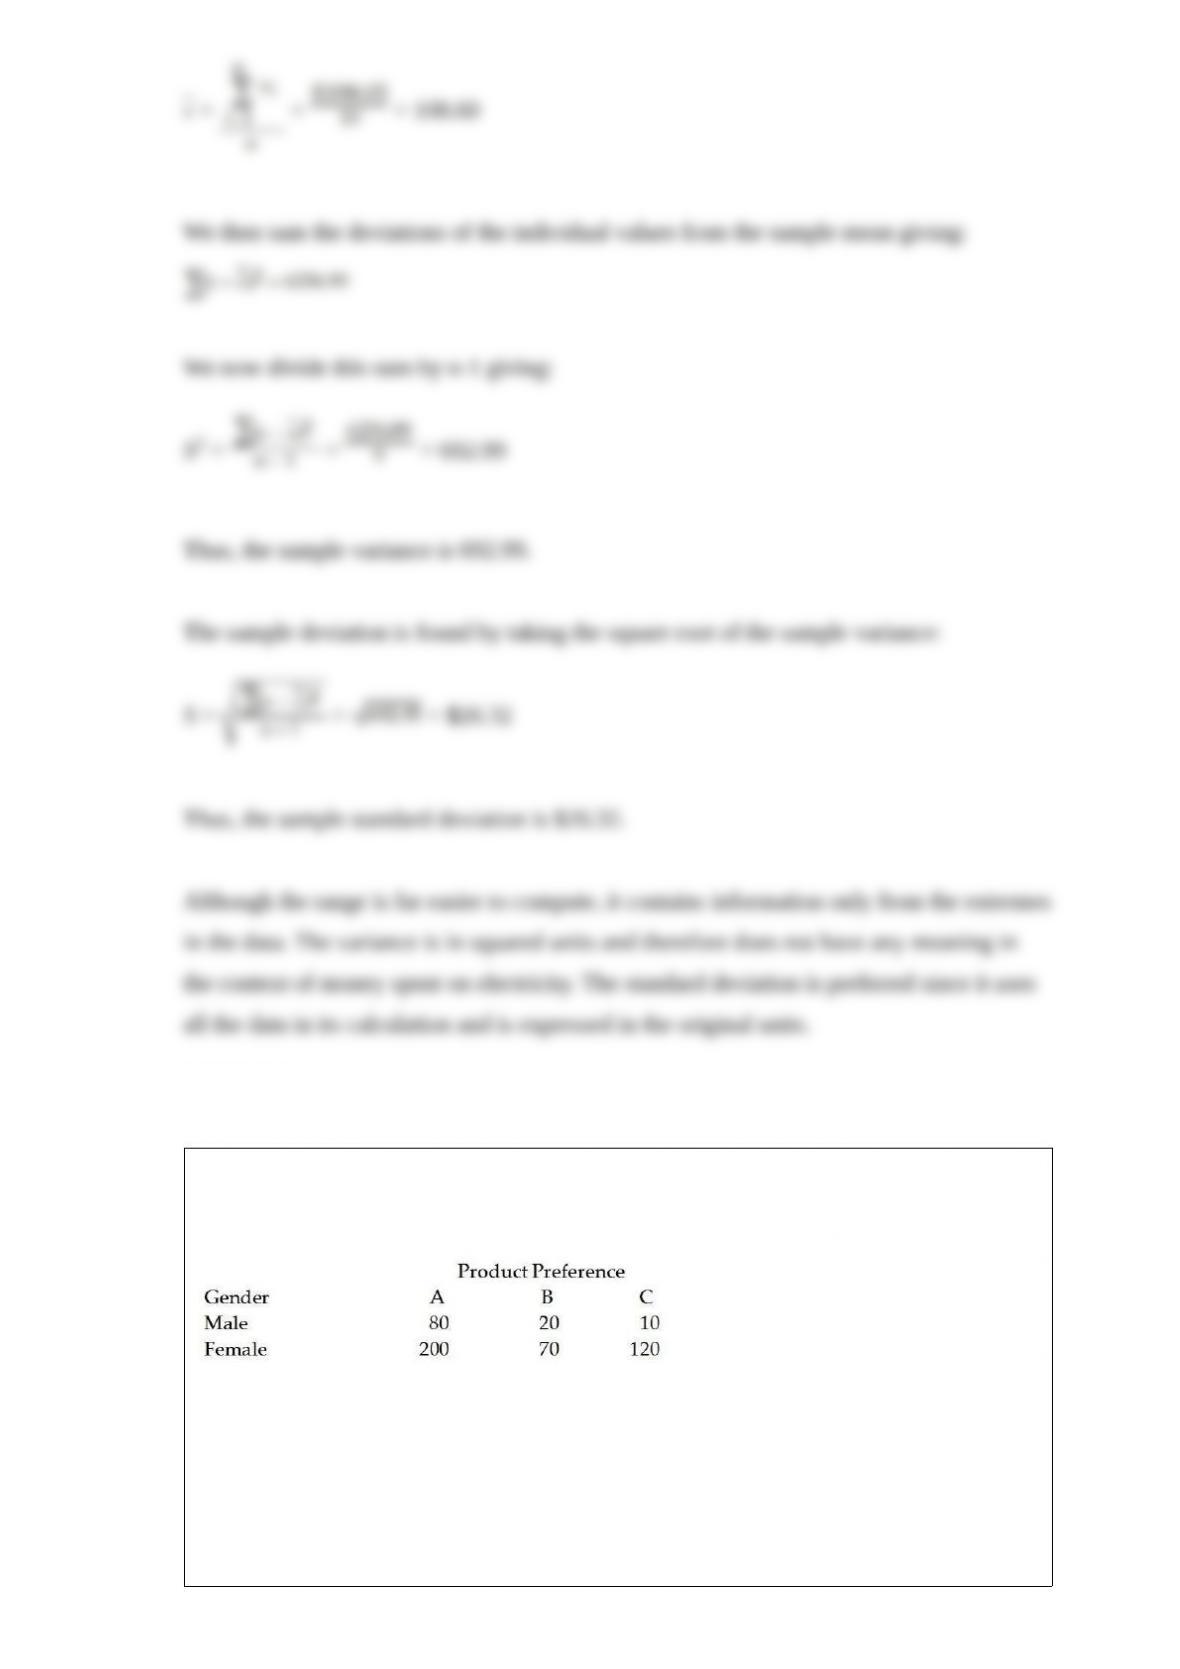
A study was recently done in which 500 people were asked to indicate their preferences
for one of three products. The following table shows the breakdown of the responses by
gender of the respondents.
Suppose one person is randomly chosen. Based on this data, what is the probability that
the person chosen is a female who prefers product C?
A) 0.24
B) 0.86

C) 0.92
D) 0.31
In a local community there are three grocery chain stores. The three have been carrying
out a spirited advertising campaign in which each claims to have the lowest prices. A
local news station recently sent a reporter to the three stores to check prices on several
items. She found that for certain items each store had the lowest price. This survey
didn’t really answer the question for consumers. Thus, the station set up a test in which
20 shoppers were given different lists of grocery items and were sent to each of the
three chain stores. The sales receipts from each of the three stores are recorded in the
data file Groceries.
Based on these sample data, can you conclude the three grocery stores have different
sample means? Test using a significance level of 0.05. Use a p-value approach.
A) Since the p-value of 2.68E – 10 < 0.05 reject H0 and conclude that at least two
means are different.
B) Since the p-value of 2.68E-10 < 0.05 do not reject H0 and conclude that means are
all the same.
C) Since the p-value of 0.027 < 0.05 reject H0 and conclude that at least two means are
different.
D) Since the p-value of 0.027 < 0.05 do not reject H0 and conclude that means are all
the same.

When a customer enters a store there are three outcomes that can occur: buy nothing,
buy a small amount, or buy a large amount. In this situation, if a customer buys a large
amount, he or she cannot also buy a small amount or buy nothing. Thus the events are:
A) independent.
B) mutually exclusive.
C) all inclusive.
D) dependent events.
Model specification is the process of determining how well a forecasting model fits the
past data.
It is thought that the time between customer arrivals at a fast food business is
exponentially distributed with λ equal to 5 customers per hour. Given this information,
what is the mean time between arrivals?
A) 12 minutes
B) 5 minutes
C) 5 hours

D) 2 minutes
A small company has 7 employees. The numbers of years these employees have worked
for this company are shown as follows:
Based upon this information, the mode number of years that employees have been with
this company is:
A) 16
B) 2
C) 9
D) 10
Magic Valley Memorial Hospital administrators have recently received an internal audit
report that indicates that 15% of all patient bills contain an error of one form or another.
After spending considerable effort to improve the hospital’s billing process, the
administrators are convinced that things have improved. They believe that the new error
rate is somewhere closer to 0.05.Suppose that recently the hospital randomly sampled
10 patient bills and conducted a thorough study to determine whether an error exists. It
found 3 bills with errors. Assuming that managers are correct that they have improved
the error rate to 0.05, what is the probability that they would find 3 or more errors in a

sample of 10 bills?
A) 0.0115
B) 0.0233
C) 0.0884
D) 0.0766
A professor noted that the grades of his students were normally distributed with a mean
of 75.07 and a standard deviation of 11.65. If only 10 percent of the students received
grades of A, what is the minimum score needed to receive an A?
A) 80.00
B) 85.00
C) 90.00
D) 95.00
If the monthly electrical utility bills of all customers for the Far East Power and Light
Company are known to be distributed as a normal distribution with mean equal to
$87.00 a month and standard deviation of $36.00, which of the following would be the
largest individual customer bill that you might expect to find?

A) Approximately $811.00
B) About $195.00
C) Nearly $123.00
D) There is no way to determine this without more information.
A start-up cell phone applications company is interested in determining whether
house-hold incomes are different for subscribers to three different service providers. A
random sample of 25 subscribers to each of the three service providers was taken, and
the annual household income for each subscriber was recorded. The partially completed
ANOVA table for the analysis is shown here:
Based on the sample results, can the start-up firm conclude that there is a difference in
household incomes for subscribers to the three service providers? You may assume
normal distributions and equal variances. Conduct your test at the alpha= 0.10 level of
significance. Be sure to state a critical F-statistic, a decision rule, and a conclusion.
A) H0: 1 = 2 = 3HA: Not all populations have the same mean
F = MSB/MSW = 1,474,542,579/87,813,791 = 16.79
Because the F test statistic = 16.79 > Fα = 2.3778, we do reject the null hypothesis
based on these sample data.
B) H0: 1 = 2 = 3HA : Not all populations have the same mean
F = MSB/MSW = 87,813,791 /1,474,542,579= 0.060
Because the F test statistic = 0.060 < Fα = 2.3778, we do not reject the null hypothesis
based on these sample data.

C) H0 : 1 = 2 = 3HA : Not all populations have the same mean
F = SSW/MSW = 6,322,592,933/87,813,791 = 72
Because the F test statistic = 72 > Fα = 2.3778, we do reject the null hypothesis based
on these sample data.
D) H0 : 1 = 2 = 3HA : Not all populations have the same mean
F = SSW/MSW = 6,322,592,933/1,474,542,579= 4.28
Because the F test statistic = 4.28 > Fα = 2.3778, we do reject the null hypothesis based
on these sample data
The number of days that homes stay on the market before they sell in Houston is
bell-shaped with a mean equal to 56 days. Further, 95 percent of all homes are on the
market between 40 and 72 days. Based on this information, what is the standard
deviation for the number of days that houses stay on the market in Houston?
A) 8
B)
C) 16
D) 4

The Kruskal-Wallis test is usually limited to comparing sample values from ________
or more populations.
A) 2
B) 3
C) 4
D) 5
In forming the classes for a frequency distribution and histogram, suppose there were a
number of empty classes. You should:
A) increase the class width.
B) decrease the class width.
C) keep the current class width.
D) use an ogive instead.
A company that fills soft drinks into bottles wishes to establish an -chart to monitor the
average fill level in the bottles. To do this, the company has taken a series of samples of
size n = 4 bottles. The overall average fill is 12.03 ounces. The average range for the
subgroups has been .06 ounces. Based on this information, what is the upper limit of the
3-sigma control limit?

A) .729
B) .0437
C) 12.09
D) 12.074
Which of the following statements is correct?
A) A process can be in statistical control, yet it can be producing defects in abundance.
B) At least three points outside the upper or lower control limits on a control chart are
required before the process is deemed to be out of control.
C) If a process is out of control, then the variation that is present is limited to common
cause variation.
D) When special cause variation is present, the process can be expected to be in control.
Second-order polynomial models:
A) always curve upward.
B) always curve downward.

C) can curve upward or downward depending on the data.
D) measure interaction between variables.
The National Football League has performed a study in which the total yards gained by
teams in games was used as an independent variable to explain the variation in total
points scored by teams during games. The points scored ranged from 0 to 57 and the
yards gained ranged from 187 to 569. The following regression model was determined:
= 12.3 + .12x
Given this model, which of the following statements is true?
A) The average points scored for teams who gain zero yards during a game is -12.3
points.
B) The average yards gained will increase by .12 for every additional point scored.
C) The average change in points scored for each increase of one yard will be 0.12
D) The average number of points scored per game is 12.3
A histogram is used to display which of the following characteristics for a quantitative
variable?
A) The approximate center of the data
B) The spread in the data
C) The shape of the distribution
D) All of the above.
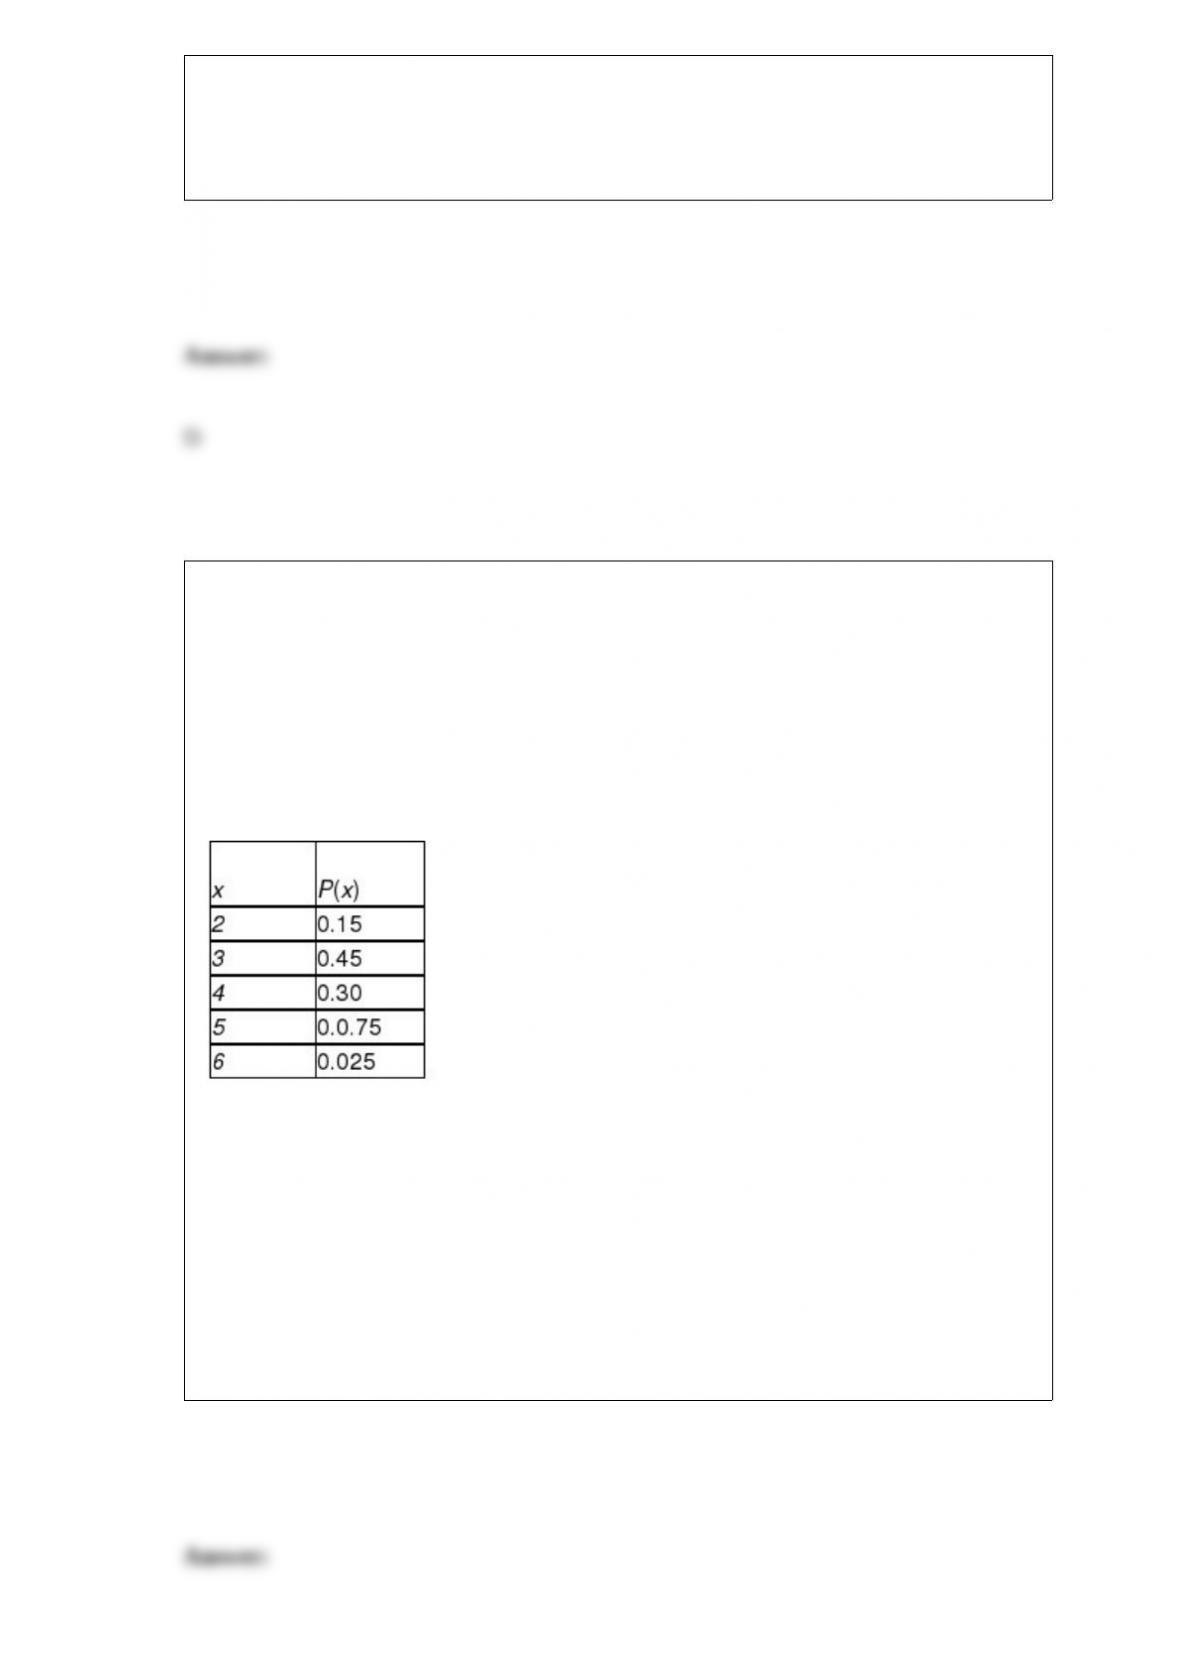
Jennings Assembly in Hartford, Connecticut, uses a component supplied by a company
in Brazil. The component is expensive to carry in inventory and consequently is not
always available in stock when requested. Furthermore, shipping schedules are such
that the lead time for transportation of the component is not a constant. Using historical
records, the manufacturing firm has developed the following probability distribution for
the product’s lead time. The distribution is shown here, where the random variable is the
number of days between the placement of the replenishment order and the receipt of the
item.
What is the average lead time for the component?
A) 2.375
B) 2.875
C) 3.275
D) 3.375
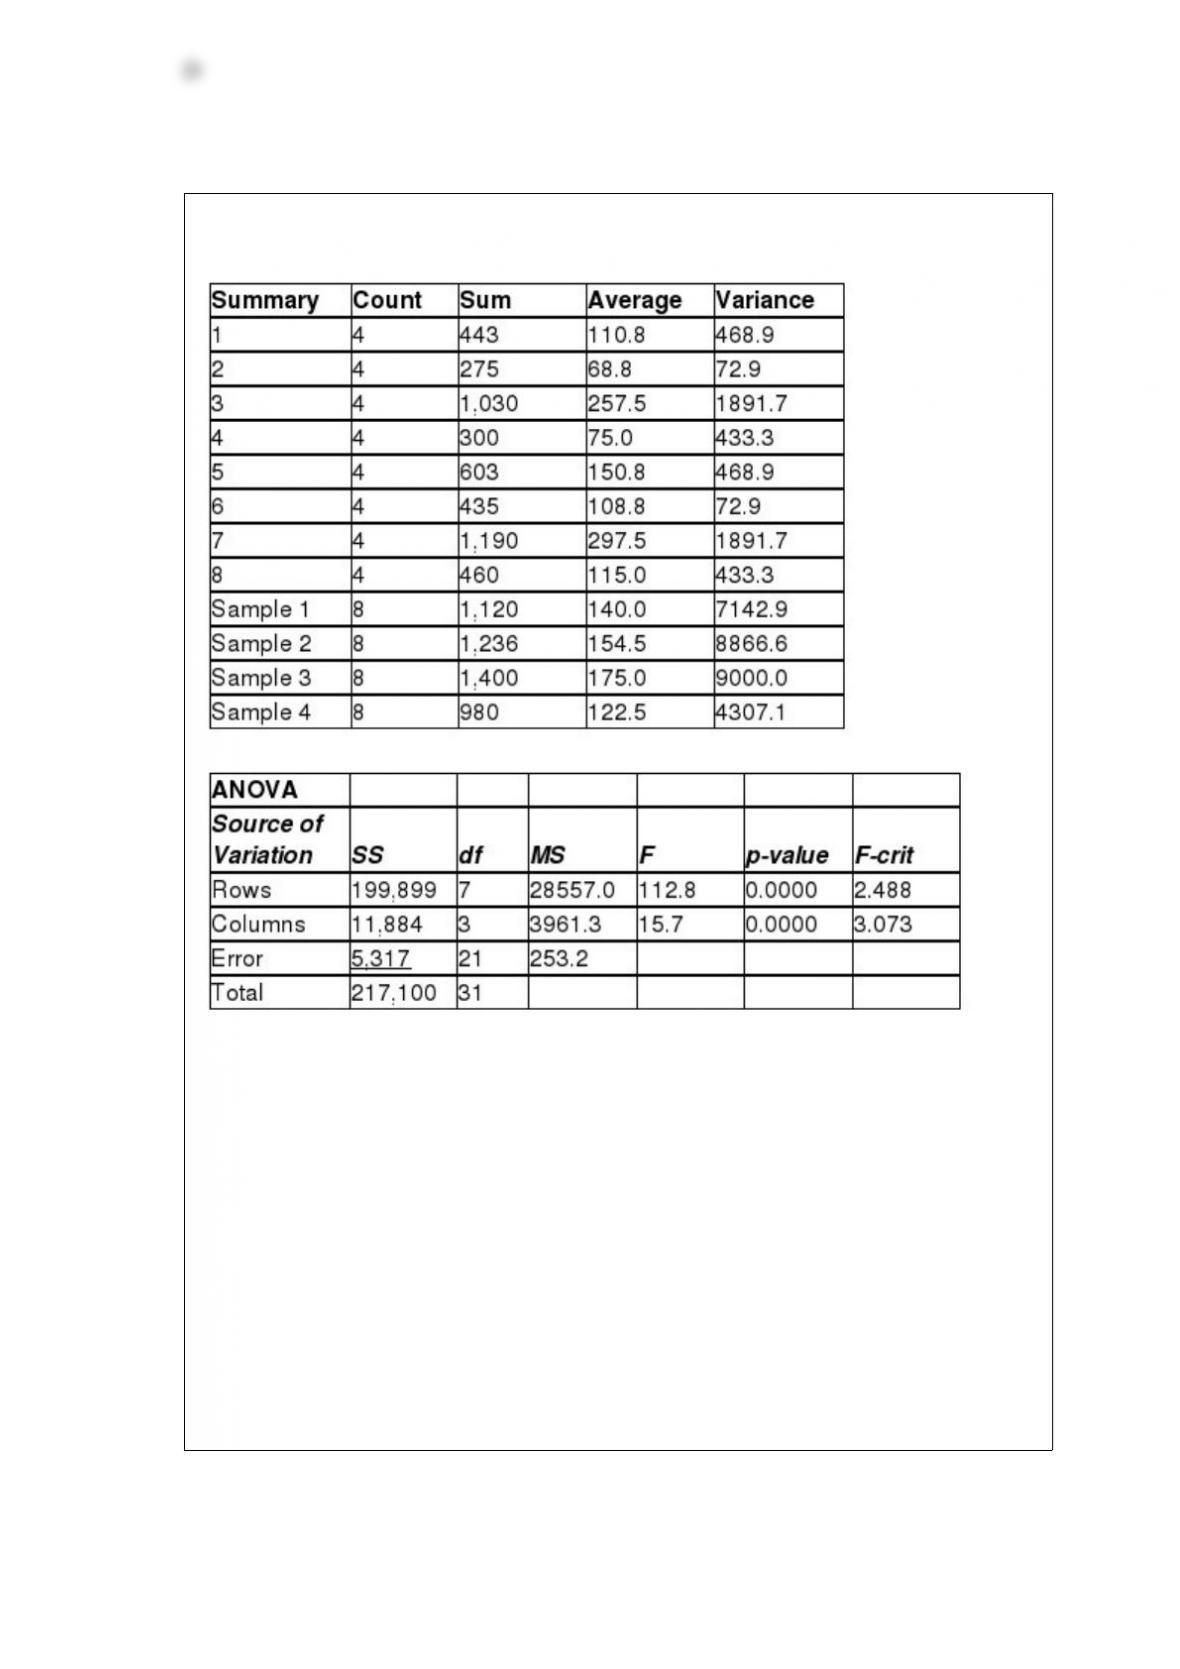
Consider the following:
Test the main hypothesis of interest using α = 0.05
A) Because F = 15.65 > critical F = 3.0, we reject the null hypothesis and conclude that
the four populations do not have the same mean.
B) Because F = 15.65 > critical F = 3.0, we do not reject the null hypothesis and
conclude that the four populations have the same mean.
C) Because F = 125.82 > critical F = 3.0, we reject the null hypothesis and conclude
that the four populations do not have the same mean.
D) Because F = 125.82 > critical F = 3.0, we do not reject the null hypothesis and
conclude that the four populations have the same mean.

A company has recorded 12 months of sales data for the past year and has found the
linear trend equation is = 286 + 64.9t. Based on this information, which of the
following is the forecast for period 13?
A) 3718
B) 842.4
C) 350.8
D) 1129.7
A cell phone service provider has selected a random sample of 20 of its customers in an
effort to estimate the mean number of minutes used per day. The results of the sample
included a sample mean of 34.5 minutes and a sample standard deviation equal to 11.5
minutes. Based on this information, and using a 95 percent confidence level:
A) the critical value is z = 1.96
B) the critical value is z = 1.645
C) the critical value is t = 2.093
D) The critical value can’t be determined without knowing the margin of error.

A consumer group plans to test whether a new passenger car that is advertised to have a
mean highway miles per gallon of at least 33 actually meets this level. They plan to test
the hypothesis using a significance level of 0.05 and a sample size of n = 100 cars. It is
believed that the population standard deviation is 3 mpg. Based upon this information,
if the “true” population mean is 32.0 mpg, what is the probability that the test will lead
the consumer group to “accept” the claimed mileage for this car?
A) About 0.45
B) Approximately 0.0455
C) About 0.9545
D) None of the above
Under what circumstances is it necessary to use the coefficient of variation to compare
relative variability between two or more distributions?
A) When the means of the distributions are equal
B) When the means of the distributions are not equal
C) When the standard deviations of the distributions are not equal
D) When the standard deviations of the distributions are equal

Nationwide Mutual Insurance, based in Columbus, Ohio, is one of the largest
diversified insurance and financial services organizations in the world, with more than
$157 billion in assets. Nationwide ranked 108th on the Fortune 100 list in 2008. The
company provides a full range of insurance and financial services. In a recent news
release Nationwide reported the results of a new survey of 1,097 identity theft victims.
The survey shows victims spend an average of 81 hours trying to resolve their cases. If
the true average time spent was 81 hours, determine the probability that a test of
hypothesis designed to test that the average was less than 85 hours would reject the
research hypothesis. Use α= 0.05 and a standard deviation of 50.
A) 0.0123
B) 0.5182
C) 0.1241
D) 0.1587
The editors of a national automotive magazine recently studied 30 different automobiles
sold in the United States with the intent of seeing whether they could develop a multiple
regression model to explain the variation in highway miles per gallon. A number of
different independent variables were collected. The following regression output (with
some values missing) was recently presented to the editors by the magazine’s analysts:
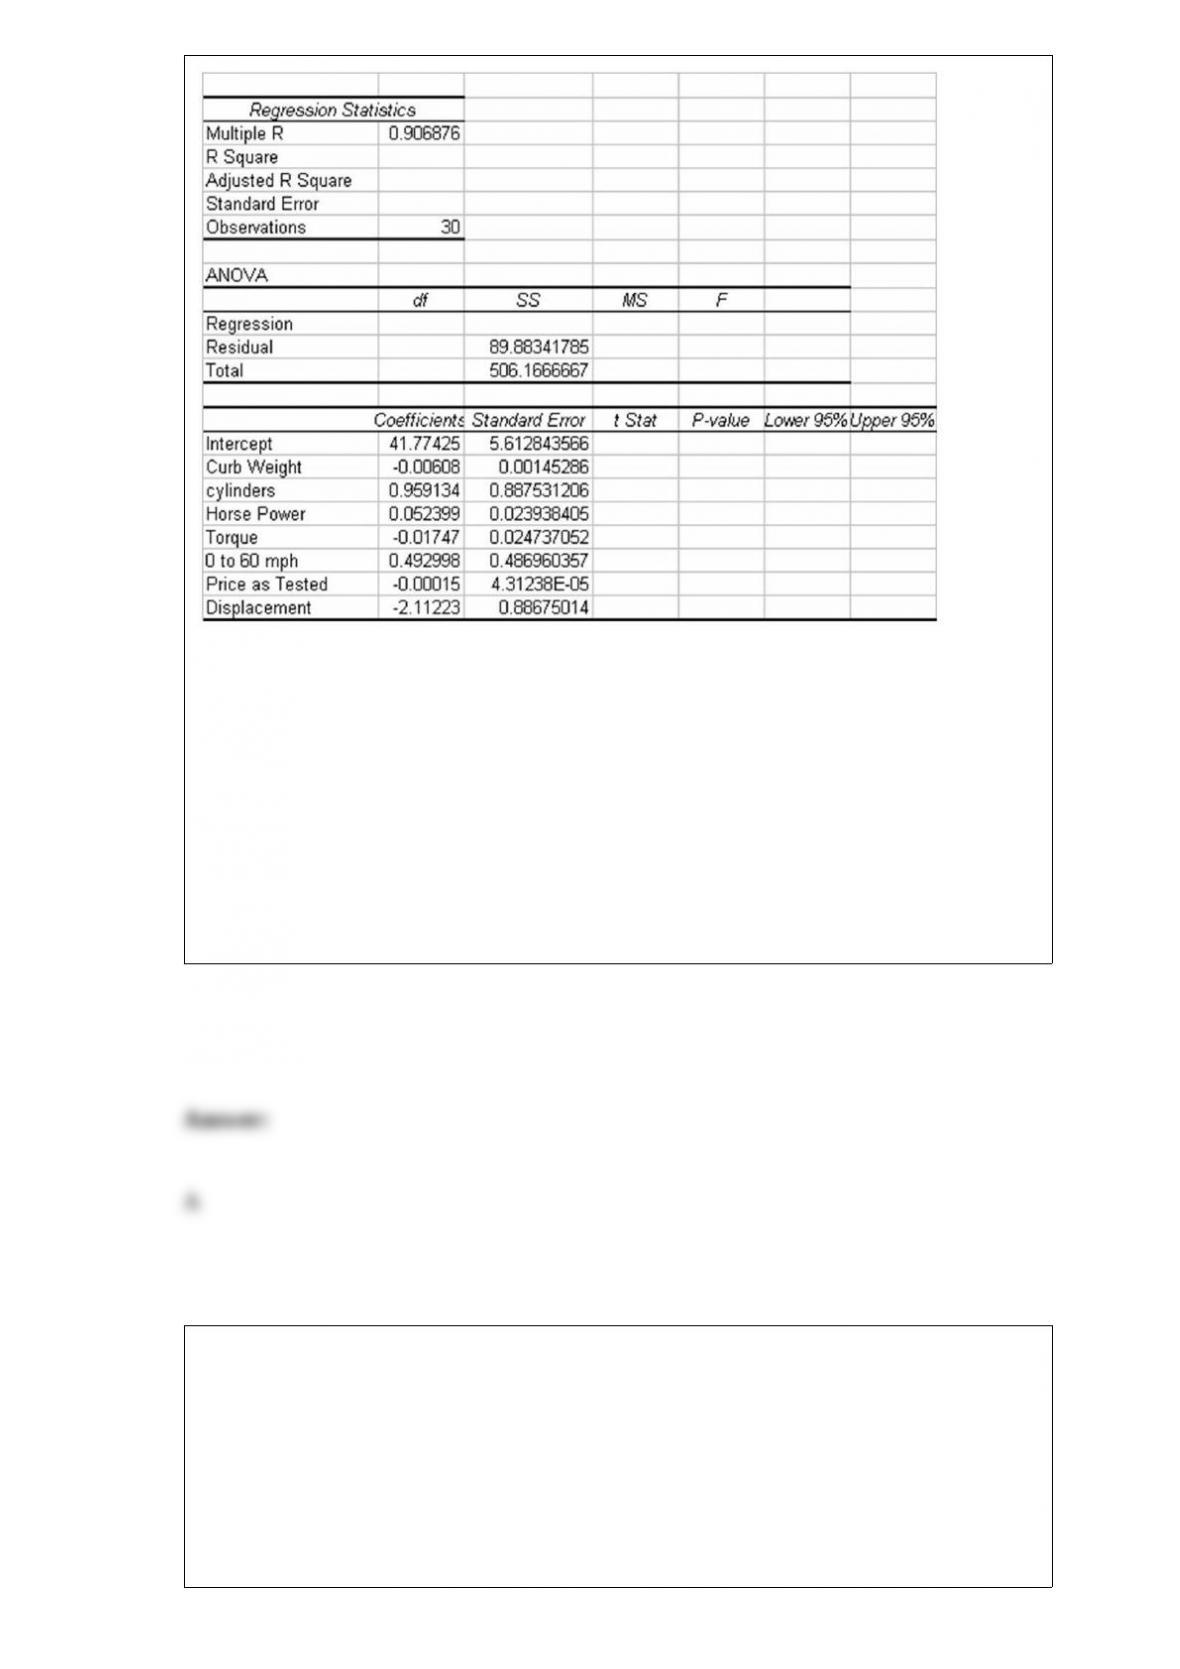
Based on this output and your understanding of multiple regression analysis, what
percentage of variation in the dependent variable is explained by the regression model?
A) Approximately 82 percent
B) Over 90 percent
C) About 37 percent
D) None of the above
The J R Simplot Company is one of the world’s largest privately held agricultural
companies, employing over 10,000 people in the United States, Canada, China, Mexico,
and Australia. More information can be found at the company’s Web site:
www.Simplot.com. One of its major products is french fries that are sold primarily on
the commercial market to customers such as McDonald’s and Burger King. French fries
have numerous quality attributes that are important to customers. One of these is called
“dark ends,” which are the dark-colored ends that can occur when the fries are cooked.
Suppose a major customer will accept no more than 0.06 of the fries having dark ends.

Recently, the customer called the Simplot Company saying that a recent random sample
of 300 fries was tested from a shipment and 27 fries had dark ends. Assuming that the
population does meet the 0.06 standard, what is the probability of getting a sample of
300 with 27 or more dark ends?
A) 0.0341
B) 0.0162
C) 0.0012
D) 0.0231