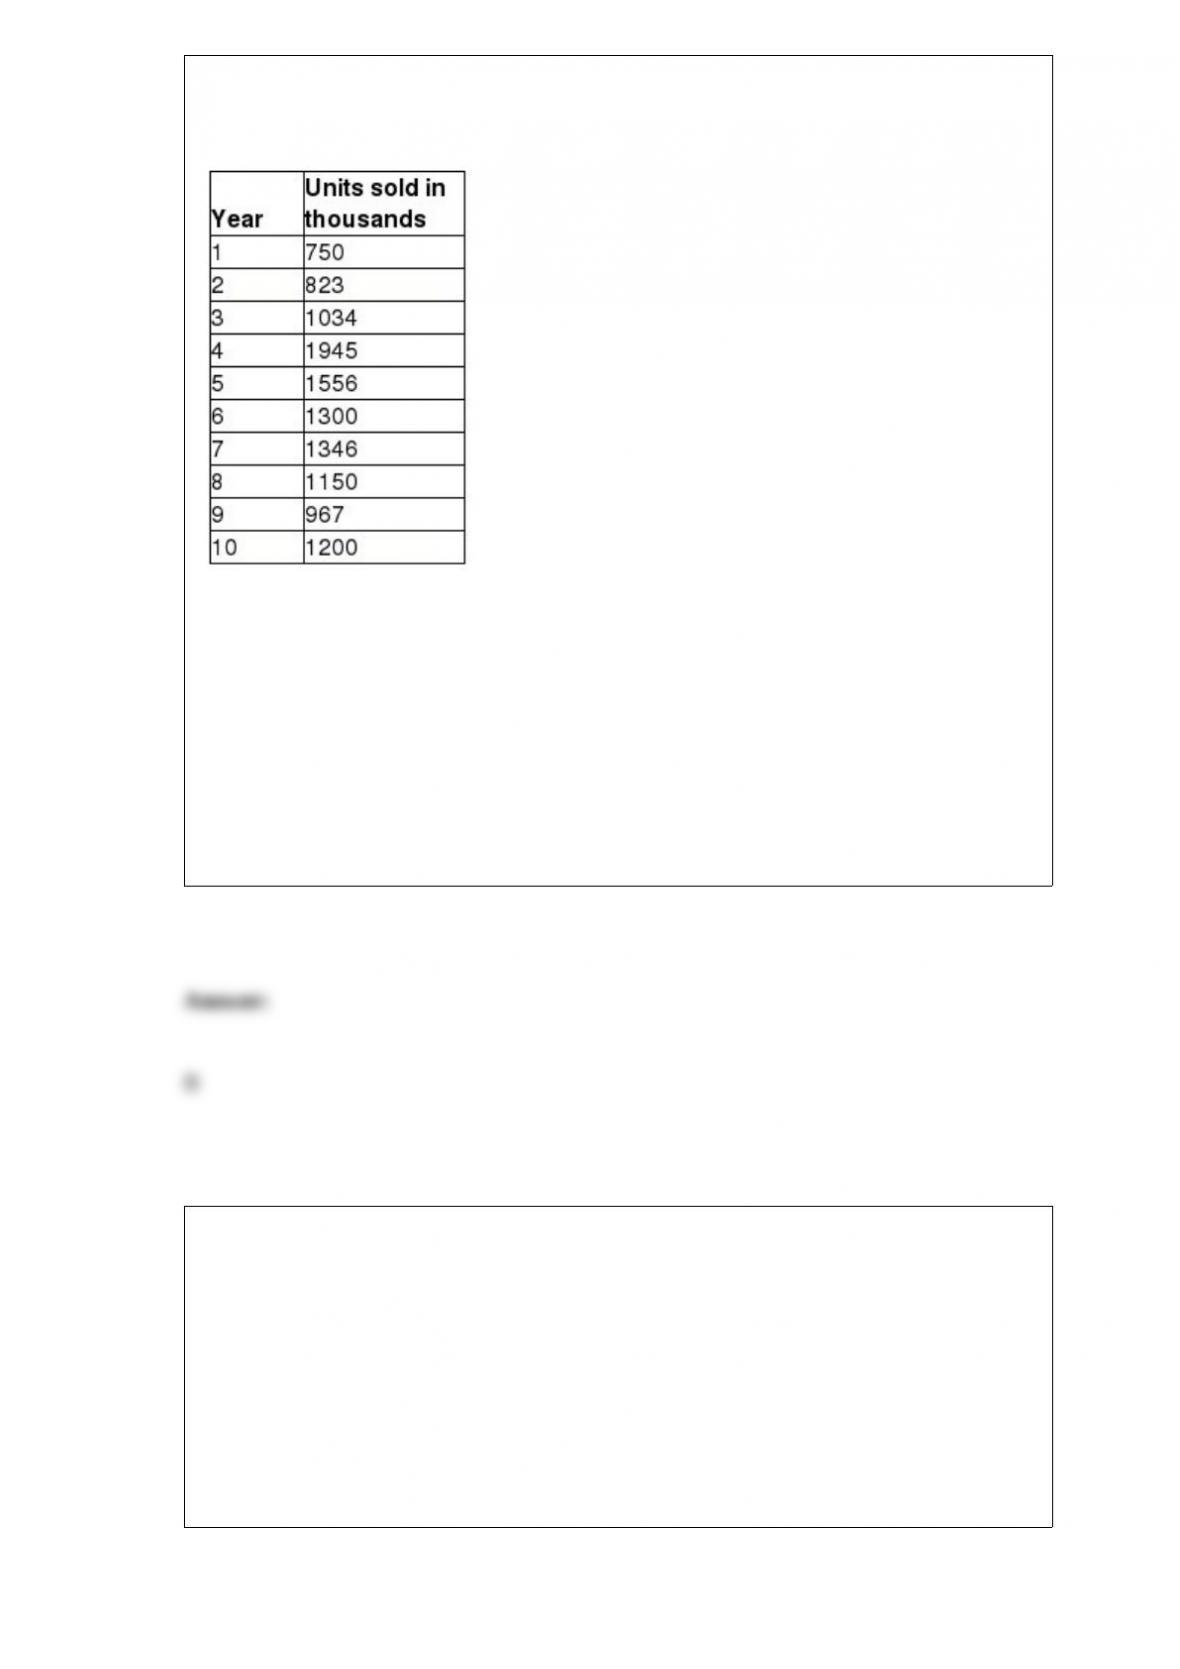
The worldwide sales of cars from 1981 -1990 are shown in the table below. Given: α =
0.2, γ = 0.05, and season length = 1. (Hint: Use XLMiner).
Which of the following is the forecast value for the 6th year?
A) 1256.06
B) 1328.04
C) 1321.31
D) 1327.24
Which of the following is true from the equation:∑, where is the mean of the sample?
A) The sum of the deviations above the mean are the same as the sum of the deviations
below the mean
B) Half the data lie above the mean of the values
C) The specific set of values does not have any outliers affecting the mean
D) Half the data lie below the mean of the values
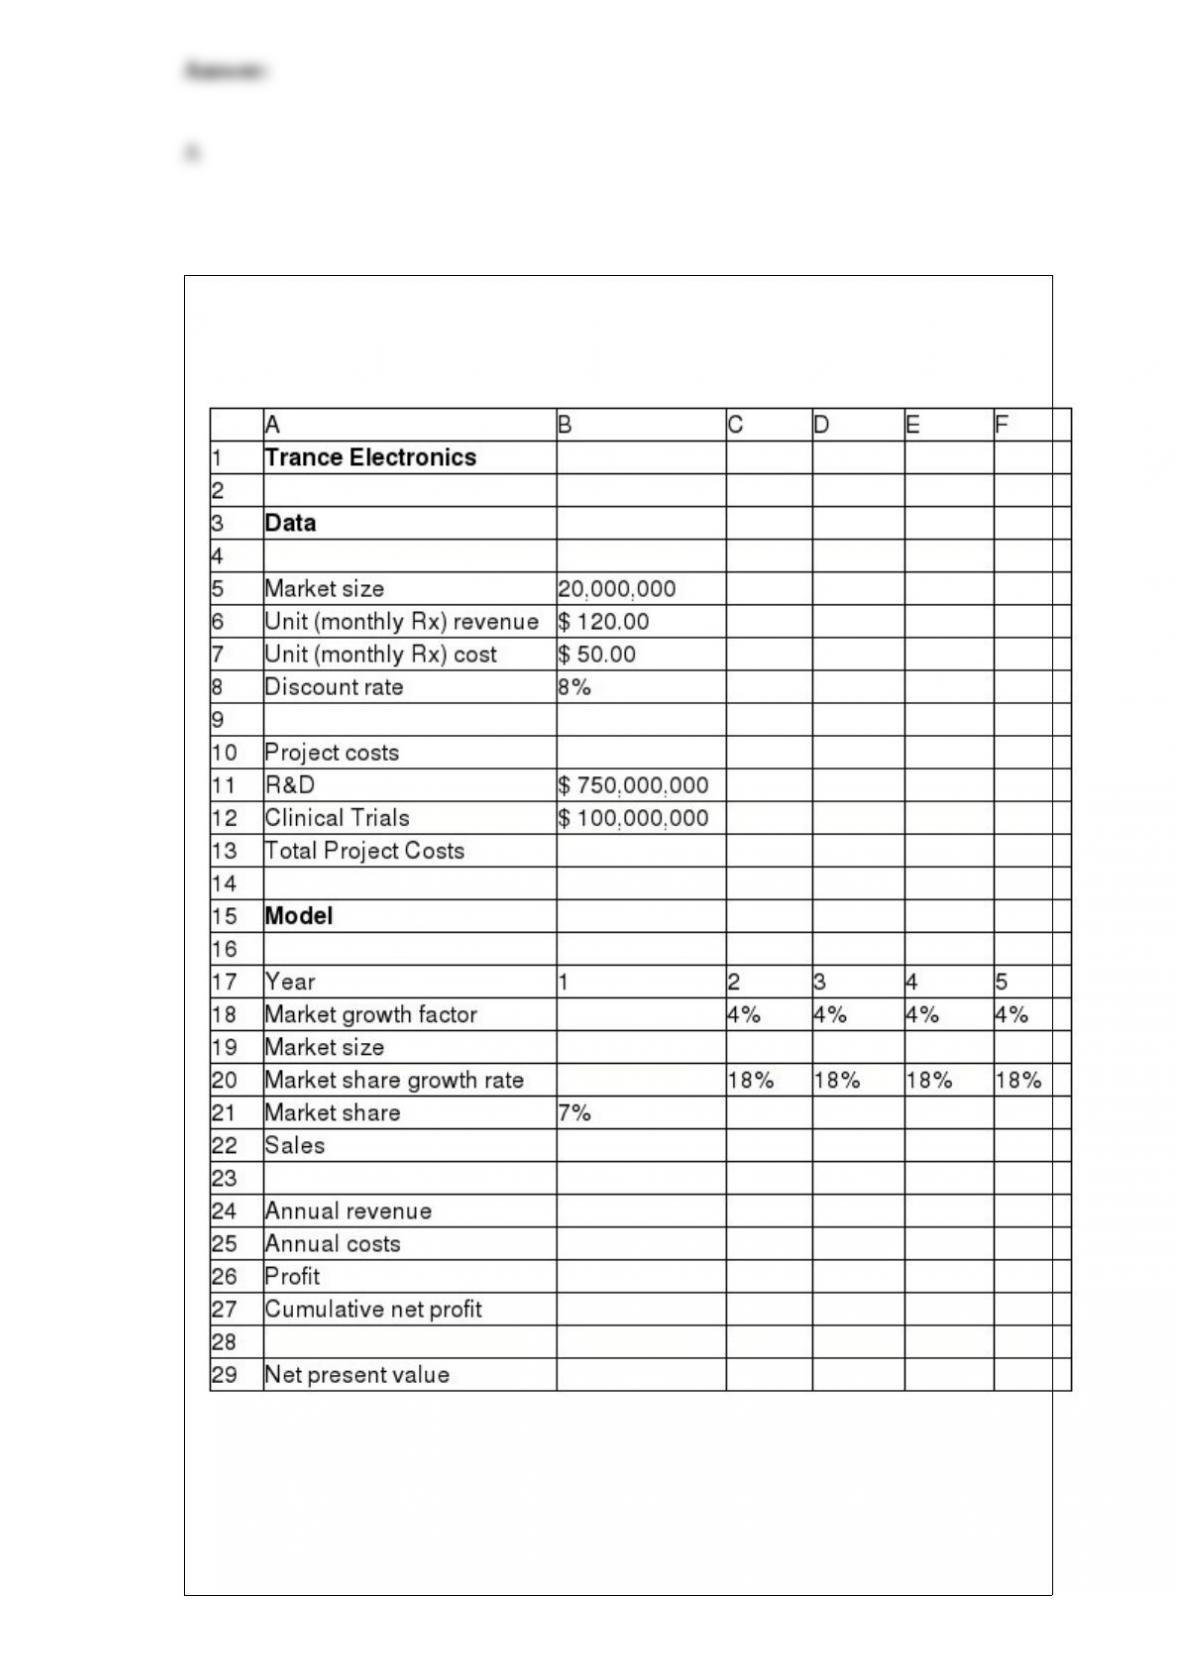
Below is a spreadsheet for Trance Electronics.
Suppose that the project manager of Trance Electronics has identified the following
uncertain variables in the model and the distributions and parameters that describe
them, as follows: Market size: normal with mean of 20,000,000 units and standard
deviation of 4,000,000 units. R&D costs: uniform between $600,000,000 and
$800,000,000.
Clinical trial costs: lognormal with mean of $150,000,000 and standard deviation
$30,000,000. Annual market growth factor: triangular with minimum = 2%,
maximum = 6%, and most likely = 3%.
Annual market share growth rate: triangular with minimum = 15%, maximum =
25%, and most likely = 20%.
The number of trials per simulation is equal to 10,000 at a Sim. Random Seed of 2. Run
the simulation and answer the following questions using the Risk Solver Platform.
What cumulative profit in the fifth year is likely to be realized with a probability of
0.50?
A) $78,244,098
B) $101,970,955
C) $144,058,696
D) $203,676,827
Below is a spreadsheet for Trance Electronics.
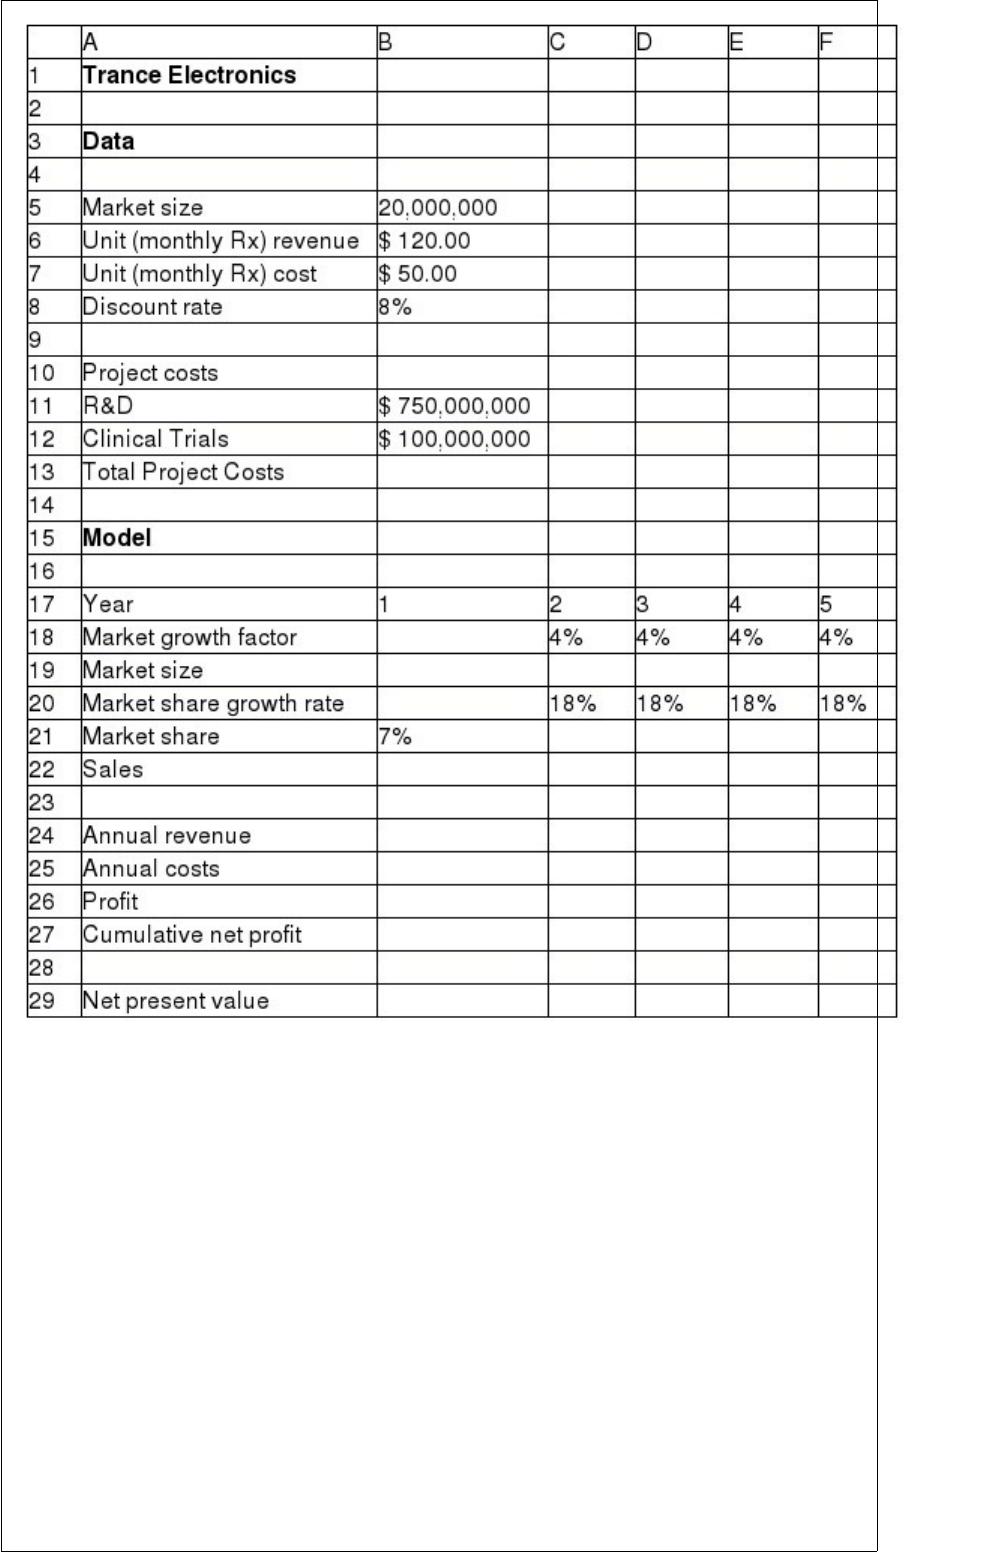
Suppose that the project manager of Trance Electronics has identified the following
uncertain variables in the model and the distributions and parameters that describe
them, as follows: Market size: normal with mean of 20,000,000 units and standard
deviation of 4,000,000 units. R&D costs: uniform between $600,000,000 and
$800,000,000.
Clinical trial costs: lognormal with mean of $150,000,000 and standard deviation
$30,000,000. Annual market growth factor: triangular with minimum = 2%,
maximum = 6%, and most likely = 3%.
Annual market share growth rate: triangular with minimum = 15%, maximum =
25%, and most likely = 20%.
The number of trials per simulation is equal to 10,000 at a Sim. Random Seed of 2. Run
the simulation and answer the following questions using the Risk Solver Platform.
With reference to the trend chart, which year shows the highest uncertainty in
forecasting the future?

A) Year 1
B) Year 3
C) Year 4
D) Year 5
Stone Age Surfboards is a small manufacturer of two types of popular low-tide
surfboards, the Graystone and the Lava models. The manufacturing process consists of
two departments: fabrication and finishing. The fabrication department has 8 skilled
workers, each of whom works 9.25 hours per day. The finishing department has 5
workers, each of whom works a 6 -hour shift per day. Each pair of Graystone
surfboards requires 2.5 labor hours in the fabrication department and 2 labor hours in
finishing. The Lava model requires 4.2 labor-hours in fabrication and 3.6 labor-hours in
finishing. The company operates 6 days a week. It makes a per unit profit of $40 on the
Graystone model and $60 on the Lava model. The company anticipates selling at least
twice as many Lava models as Graystone models.
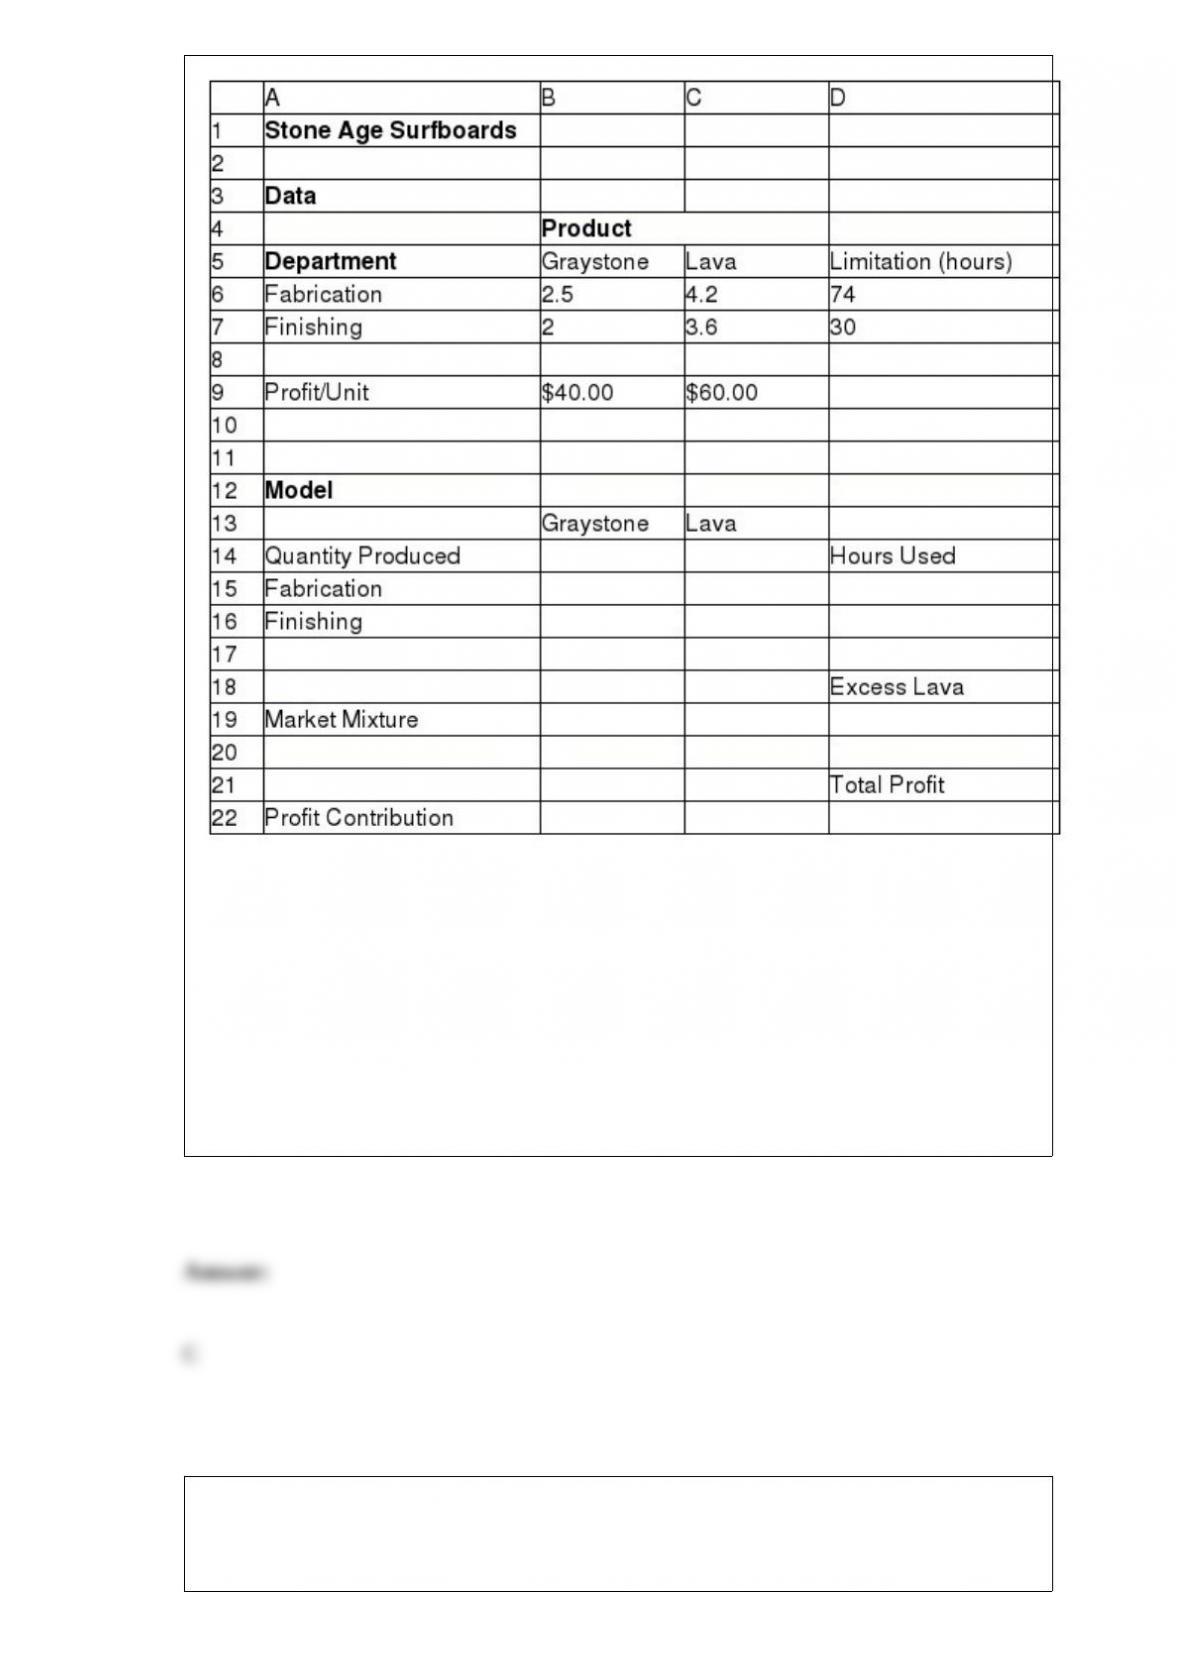
What is the total number of hours used for fabrication?
A) 54.5
B) 30.0
C) 35.5
D) 43.8
The means of all possible samples of a fixed size n from some population will form a
distribution which is known as the ________.

A) corollary of the mean
B) sampling distribution of the mean
C) standard error of the mean
D) point estimate
Which of the following is a valid one-sample hypothesis test?
A) H0: population parameter ≠constant vs. H1: population parameter = constant
B) H0: population parameter > constant vs. H1: population parameter ≤ constant
C) H0: population parameter < constant vs. H1: population parameter ≥ constant
D) H0: population parameter = constant vs. H1: population parameter ≠constant
Consider the following spreadsheet for an outsourcing decision model.
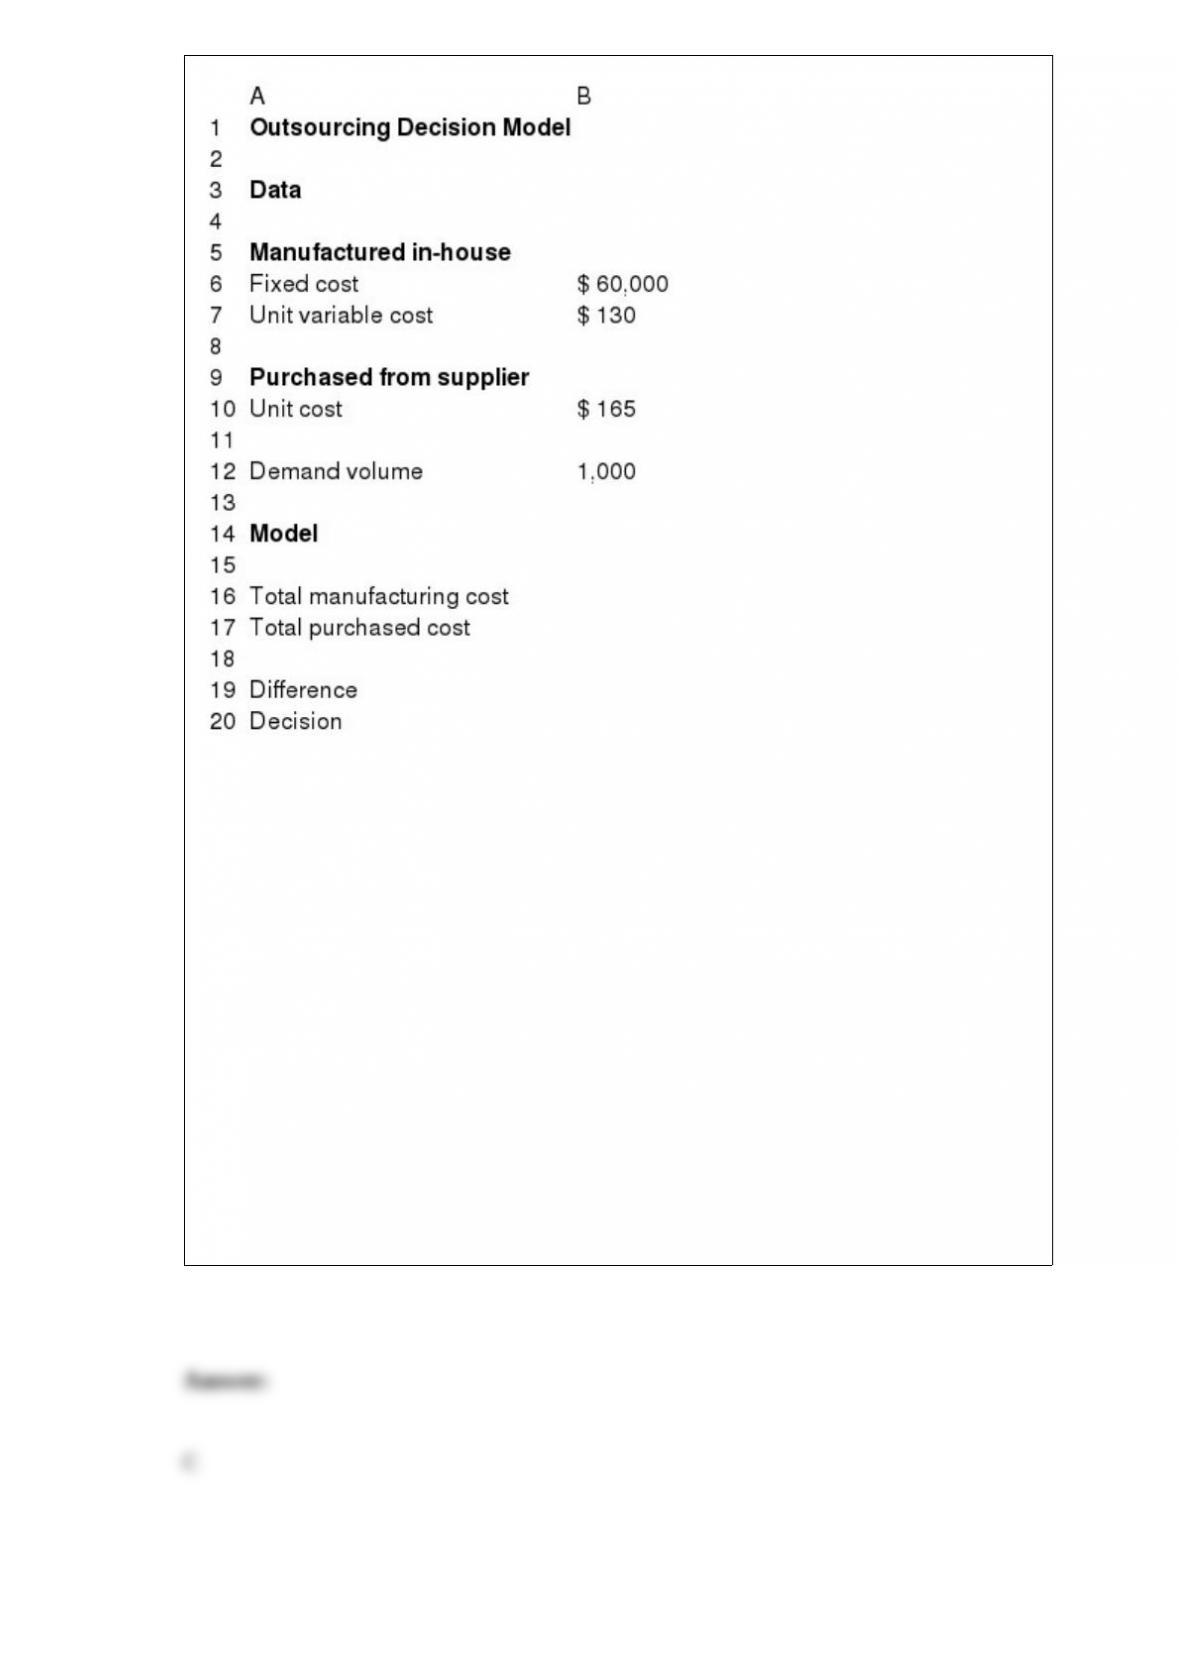
We assume that the production (demand) volume is normally distributed with a mean of
1,000 and a standard deviation of 100. For the unit cost, select the triangular
distribution. It has a minimum value of $150, most likely value of $165, and a
maximum value of $190. The number of trials per simulation is equal to 5,000 at a Sim.
Random Seed of 1. Run the simulation and answer the following question(s) using the
Risk Solver Platform.
What is the cost difference upper cutoff in thousands of dollars if the likelihood is 75%?
A) approximately 46
B) approximately 28
C) approximately 32
D) approximately 59

Which of the following is true of prediction intervals?
A) It provides estimates for variables that can have only two possible outcomes.
B) It is associated with the distribution of a random variable.
C) It provides an interval estimate of a population parameter.
D) It is associated with the sampling distribution of a statistic.
The measure of location that specifies the middle value when the data are arranged
from least to greatest is the ________.
A) outlier
B) mean
C) median
D) mode
Thereflectstheopportunitycosts ofspendingfunds now versus achievingareturn
through another investment, as well as the risks associated with not receiving returns
until a later time.
A) modified internal rate of return
B) payback period
C) accounting rate of return
D) discount rate
Following is an extract from the Cost per Order Database of Grogtes LLC.
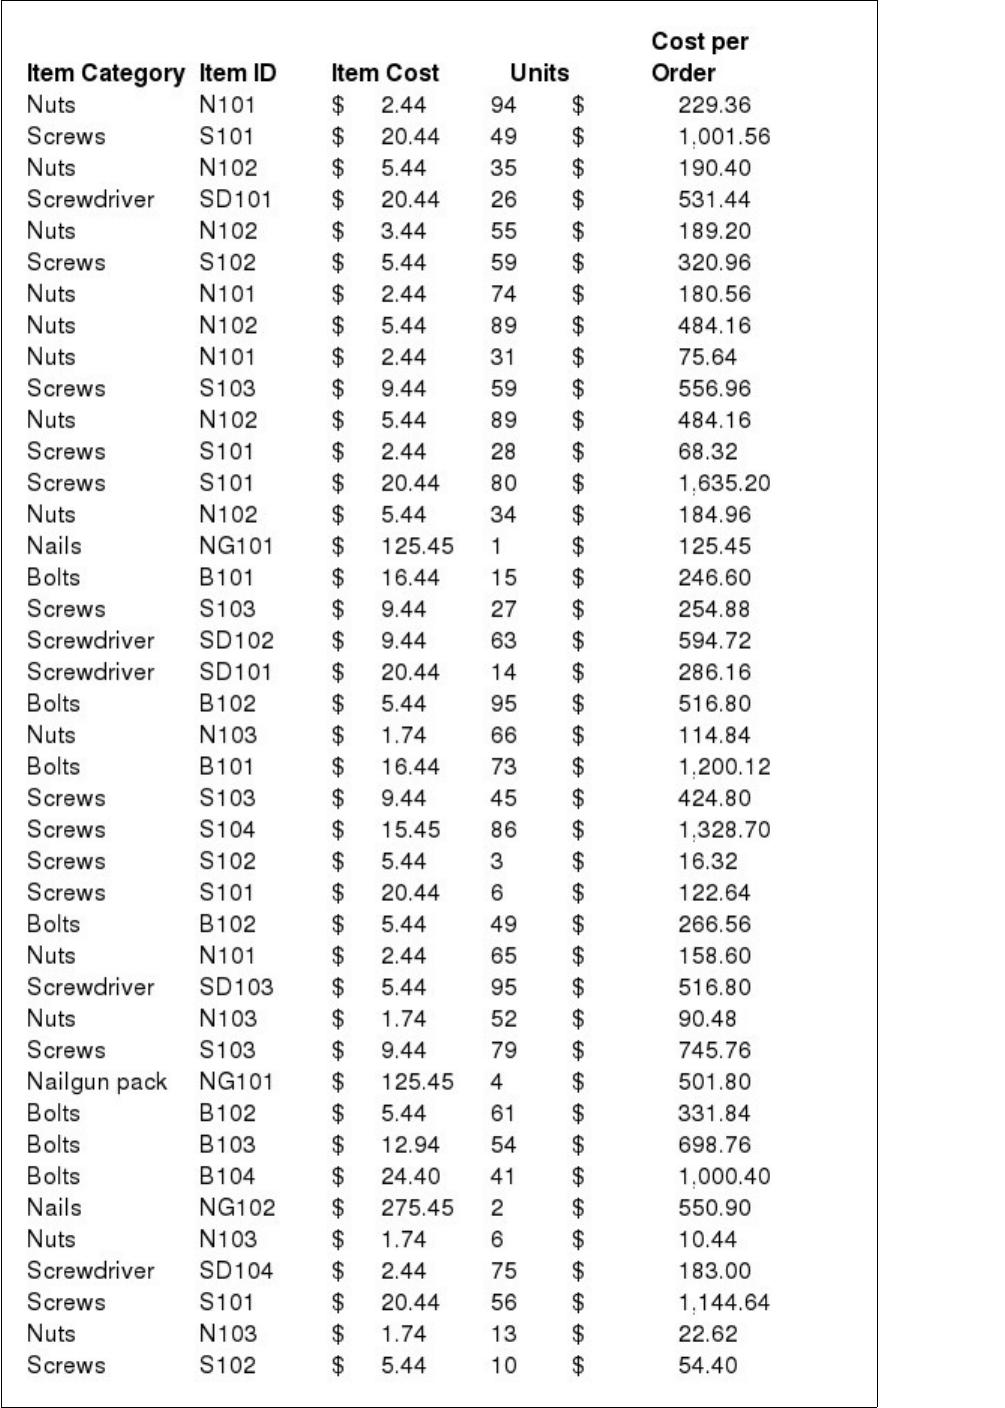
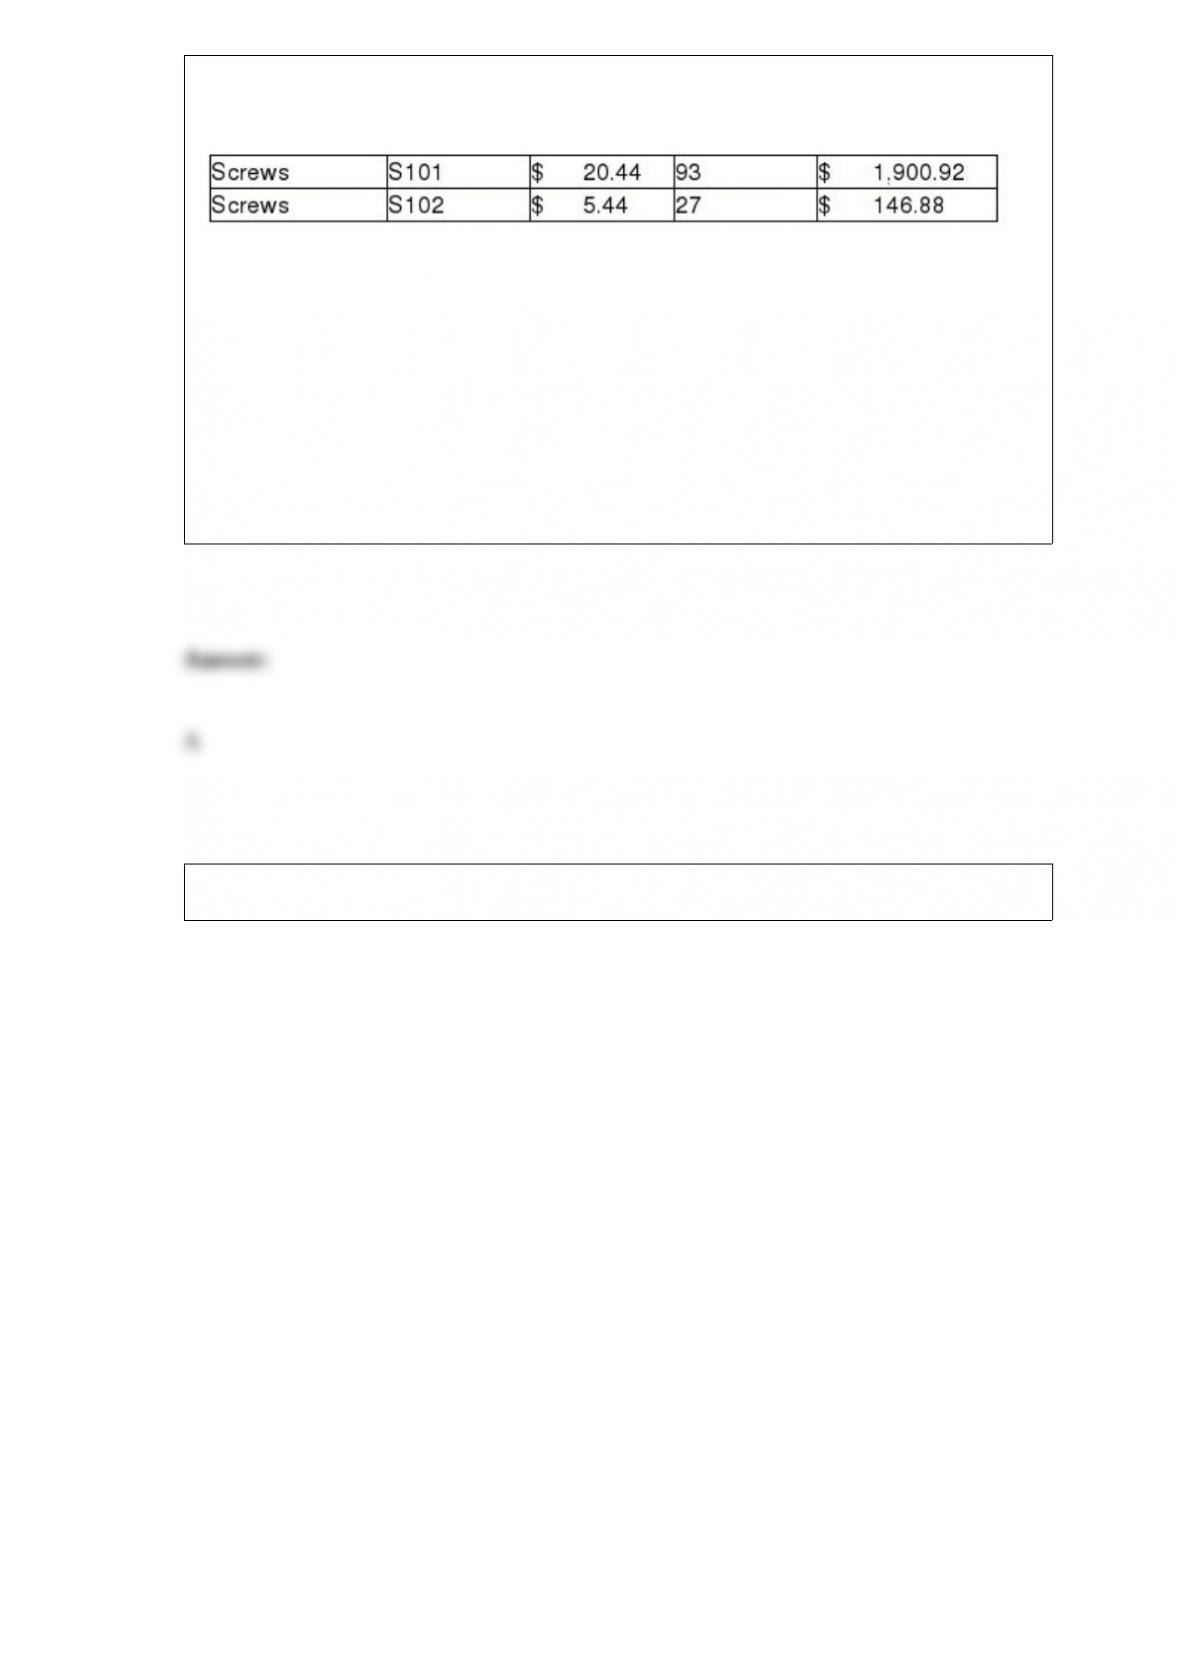
Which of the following will give the value for the third quartile?
A) PERCENTILE.INC(array, 0.75)
B) QUARTILE.INC(array, 0.75)
C) DECILE.INC(array, 0.30)
D) QUARTILE.INC(array, 0.25)
Following is an extract from the Cost per Order Database of Grogtes LLC.
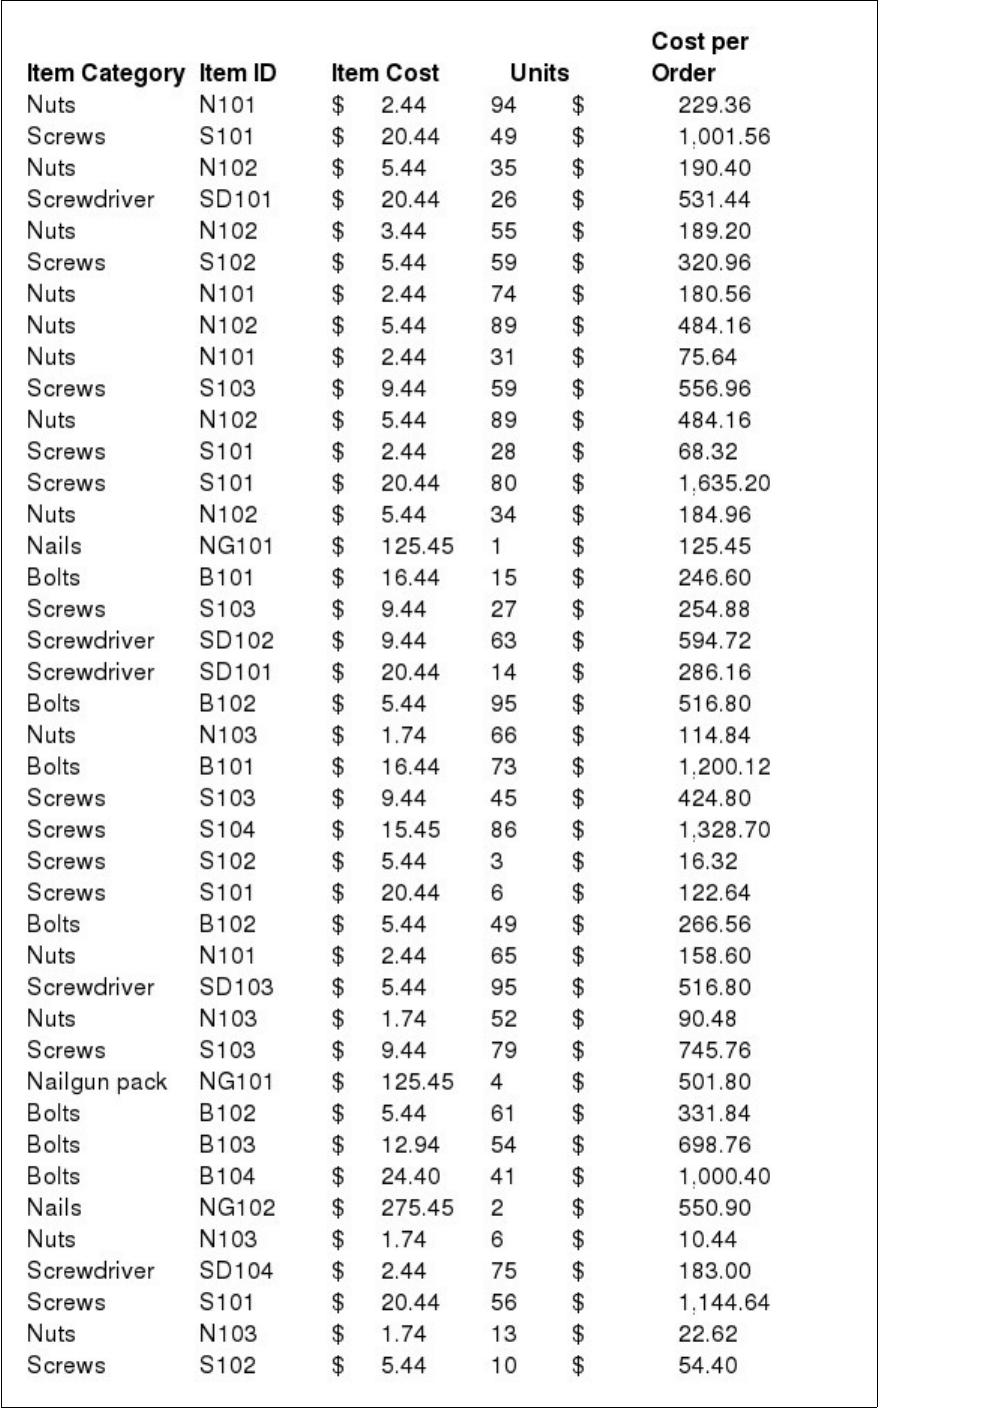
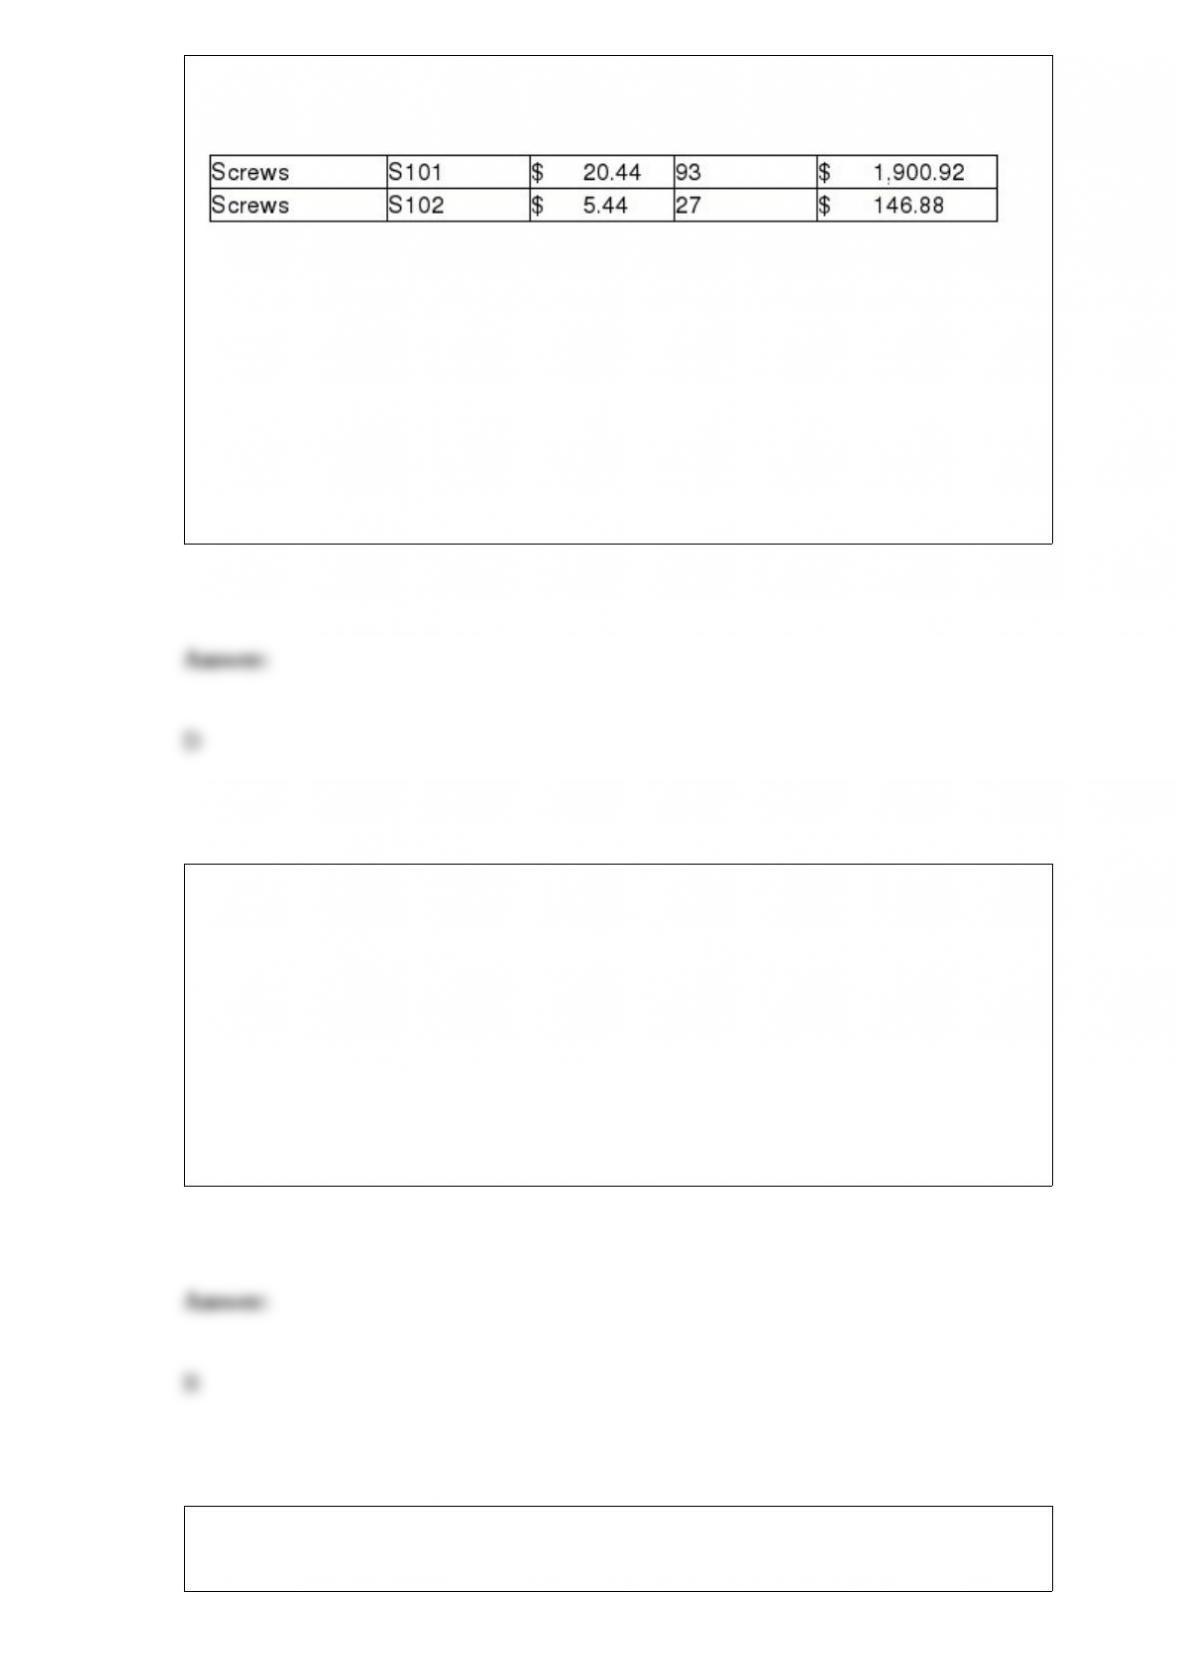
Which of the following does the second quartile of the costs per order indicate?
A) 2% of the costs per order are less than or equal to $114.84.
B) 20% of the costs per order are less than or equal to $1,200.12.
C) 5% of the costs per order are less than or equal to $229.36.
D) 50% of the costs per order are less than or equal to $286.16.
Howard has screened some employee details out of the employee database for tax
computation purposes. In order to restore the original data file, Howard must:
A) click Sort Newest to Oldest.
B) click Clear filter from Item Description.
C) click Unmerge cells.
D) click Clear outline from Ungroup.
15 students were asked to choose between the broad categories of Arts, Science, and
Math as their preferred area of study.
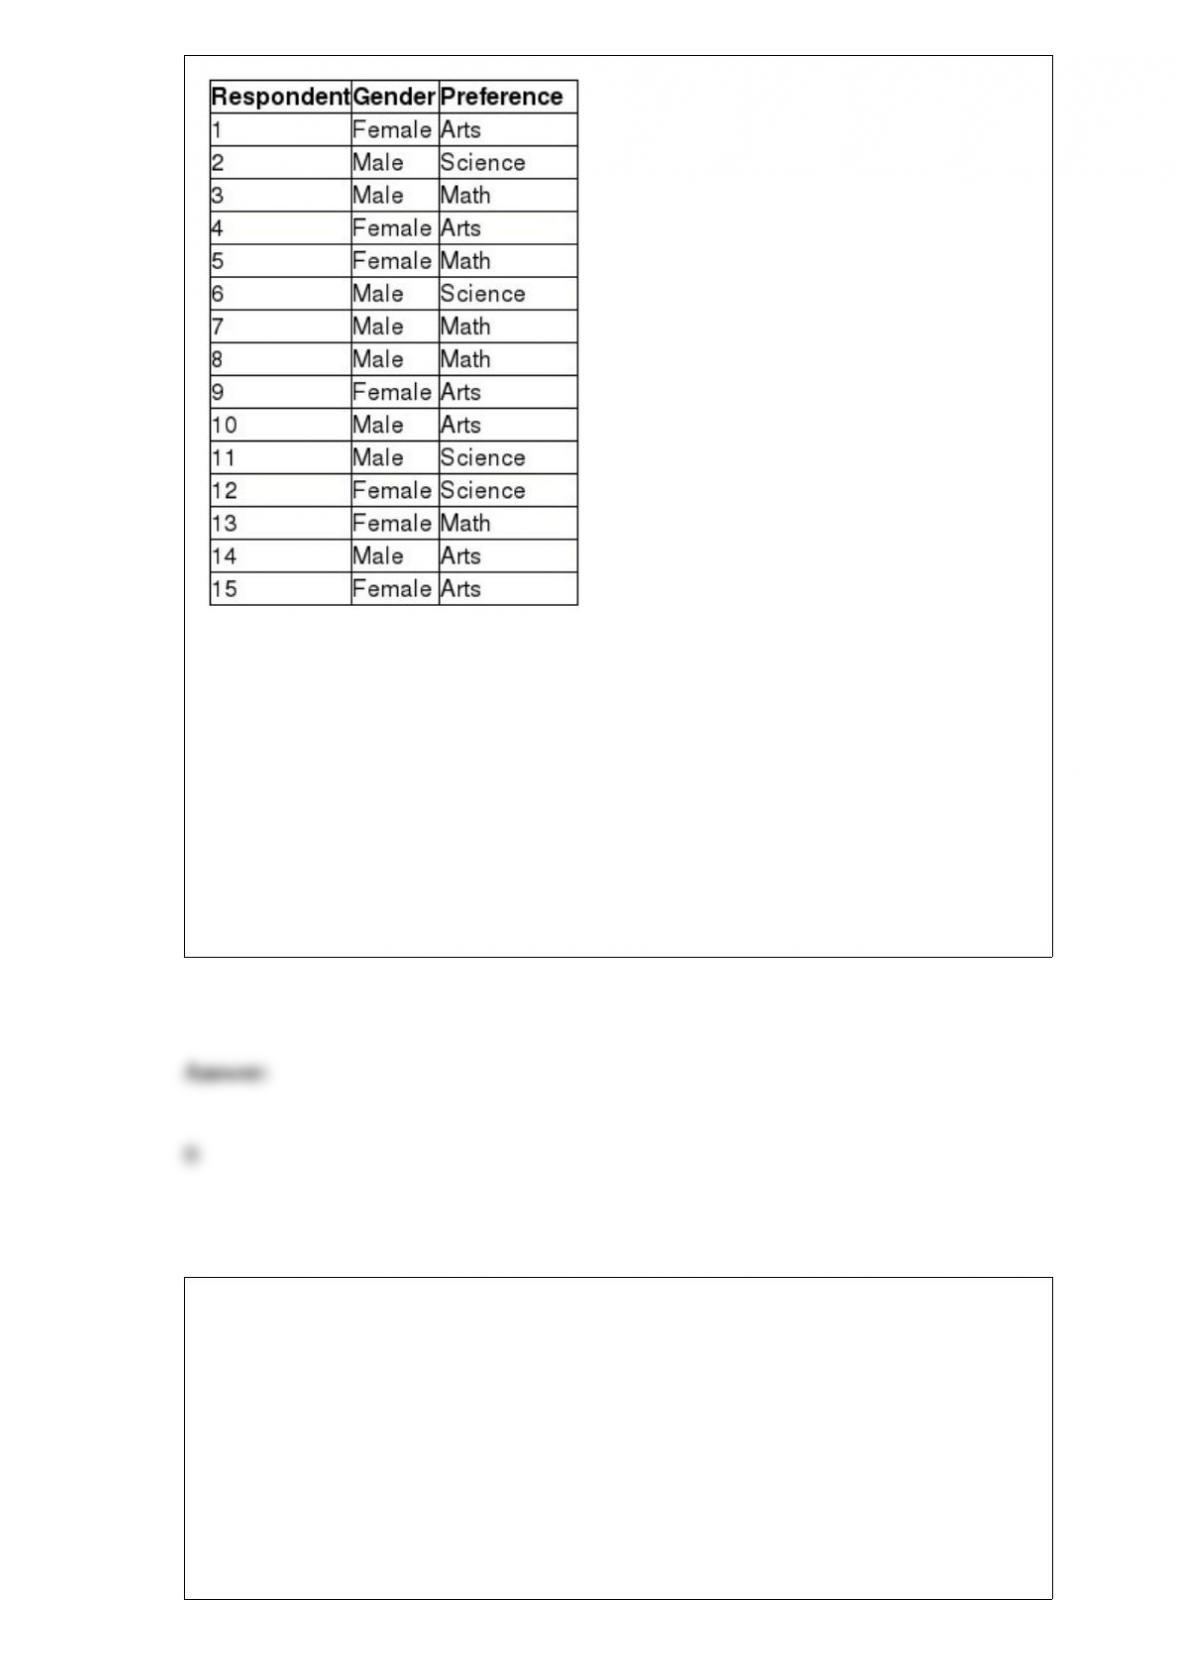
What is the probability that a respondent prefers Science given that the respondent is
female?
A) 1/15
B) 1/7
C) 7/15
D) 4/7
Which of the following is true about using sample data?
A) All samples have the same characteristics and hence always adequately represent the
underlying population.
B) It can limit the ability to predict uncertain events that may occur because potential
values outside the range of the sample data are not included.
C) It is better to use sample data than trying to identify the underlying probability
distribution and fitting a theoretical distribution to it.
D) Using sample data in a decision model increases the ability to predict uncertain
events.
Which of the following is true about one-tailed and two-tailed tests?
A) For standard normal and t-distributions, which have a mean of zero, lower-tail
critical values are negative and upper-tail critical values are positive.
B) For an upper one-tailed test, if the test statistic is greater than the critical value, the
decision would be to fail to reject the null hypothesis.
C) For a lower one-tailed test, if the test statistic is less than the critical value, the
decision would be to fail to reject the null hypothesis.
D) For a two-tailed test, if the test statistic is either greater than the upper critical value
or less than the lower critical value, the decision would be to fail to reject the null
hypothesis.
Consider the following spreadsheet for an outsourcing decision model.
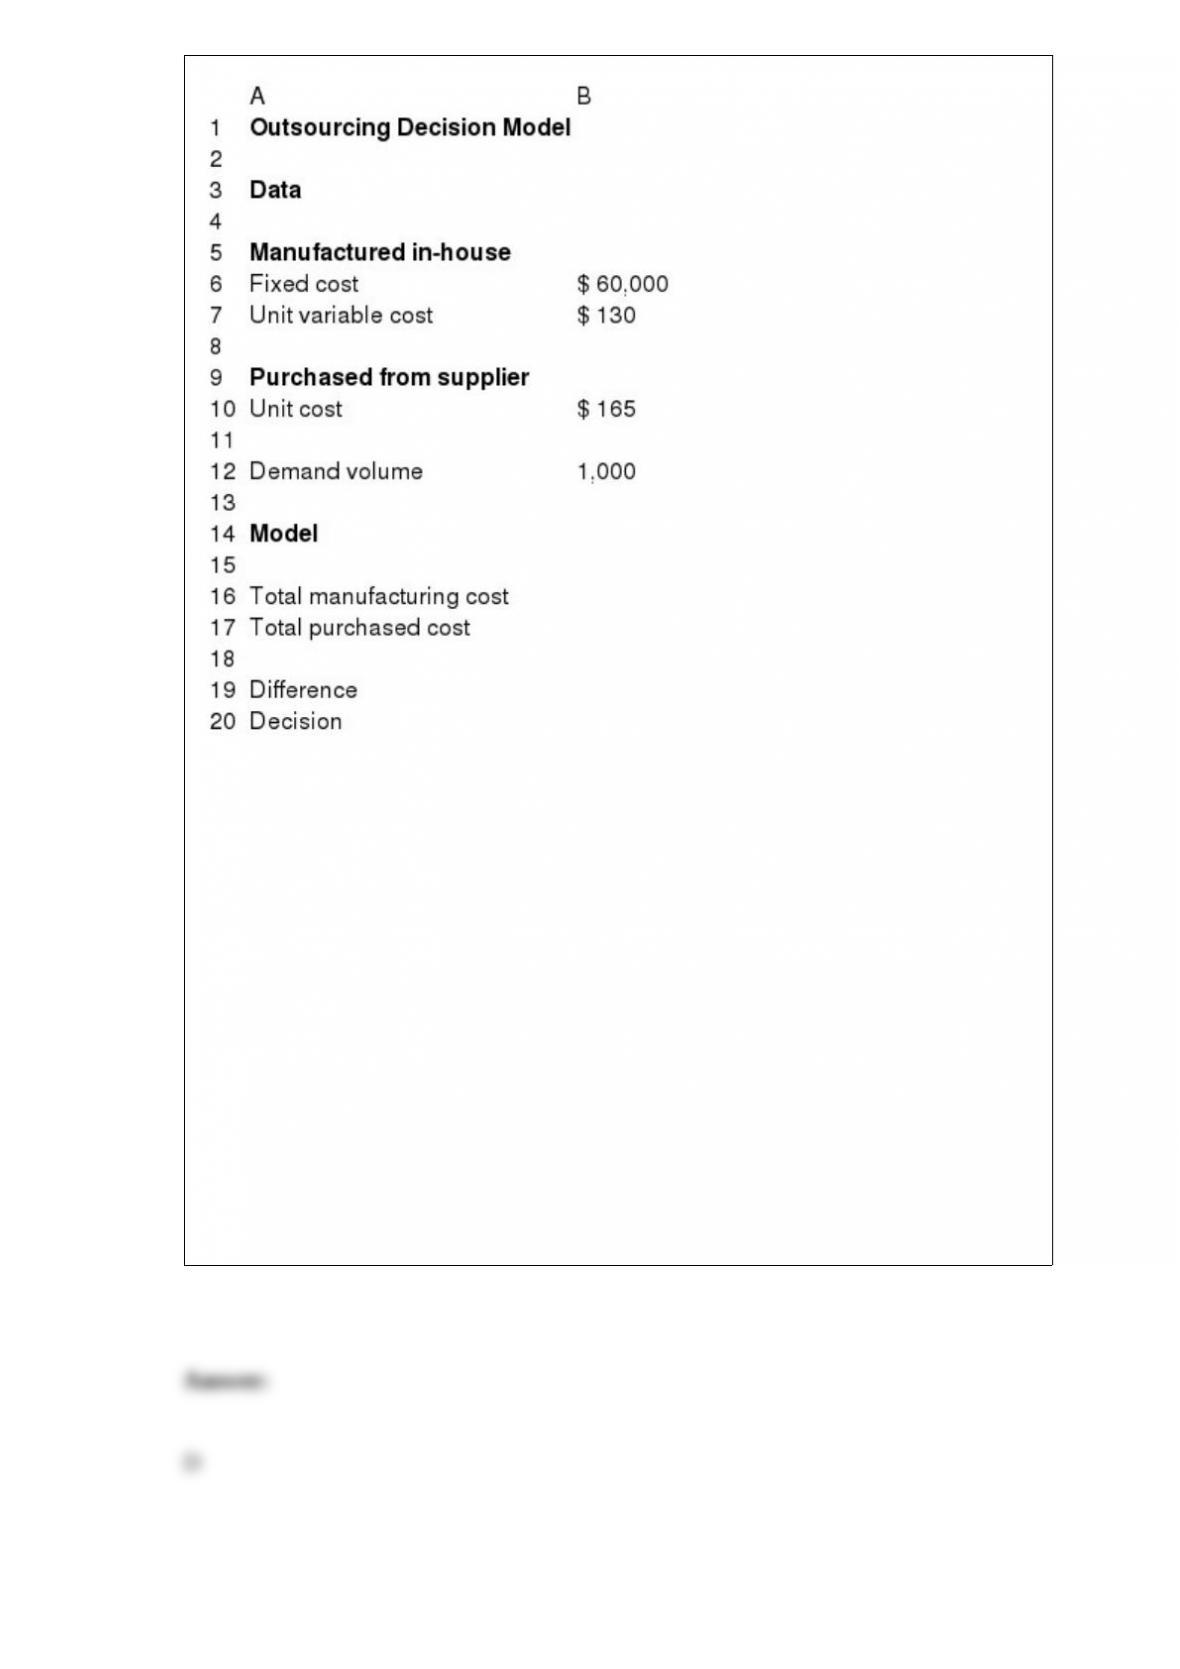
We assume that the production (demand) volume is normally distributed with a mean of
1,000 and a standard deviation of 100. For the unit cost, select the triangular
distribution. It has a minimum value of $150, most likely value of $165, and a
maximum value of $190. The number of trials per simulation is equal to 5,000 at a Sim.
Random Seed of 1. Run the simulation and answer the following question(s) using the
Risk Solver Platform.
What is the expected loss determined from the simulation results?
A) $(78)
B) $(120)
C) $(60)
D) $(47)
What is the expected value of sample information?
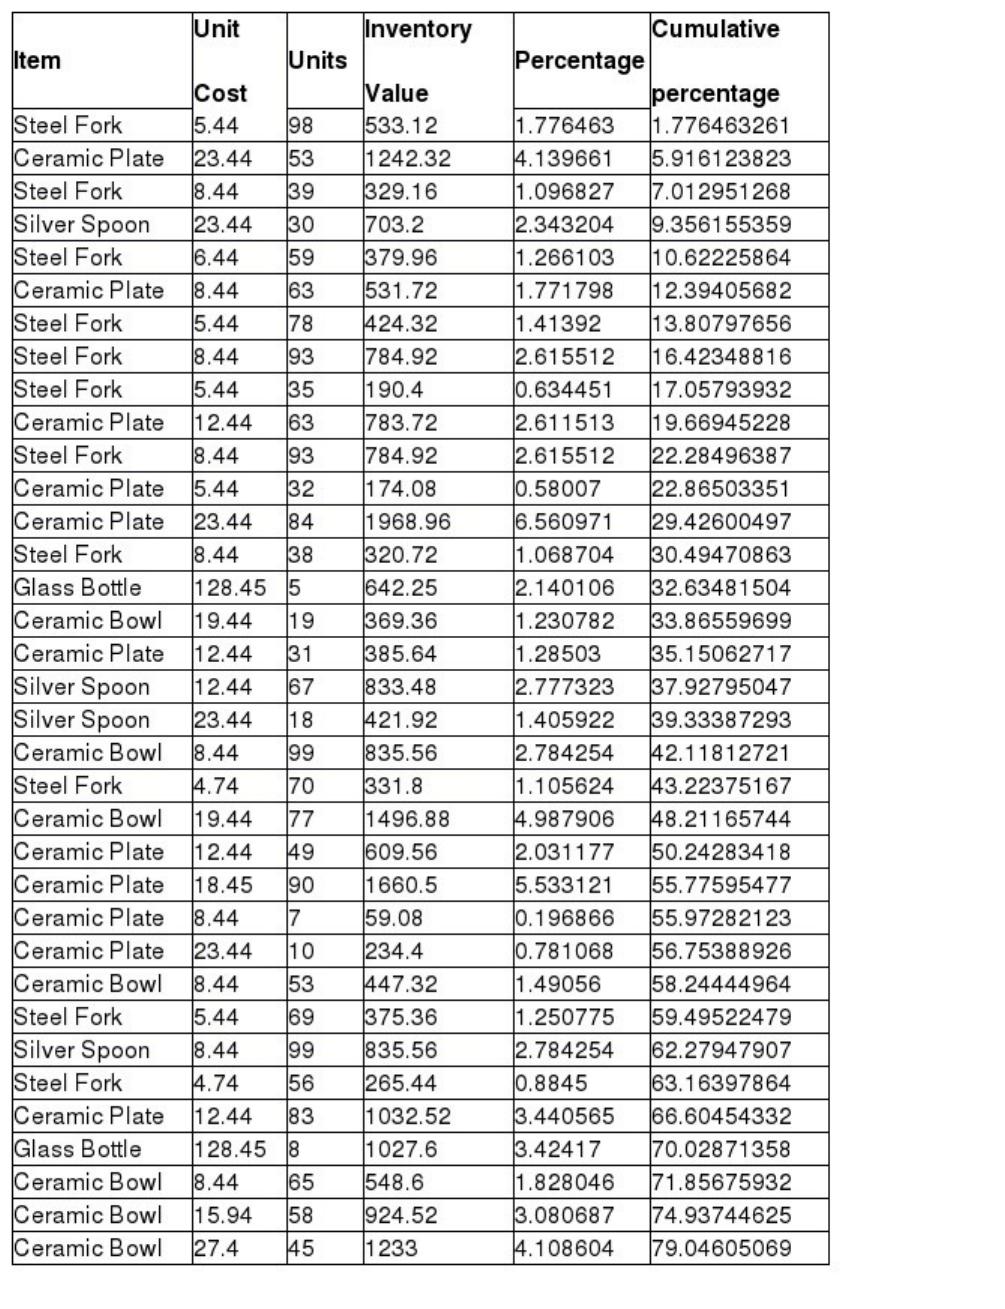
Describe how to sort the data by inventory value to compute cumulative percentage of
total inventory value to help the restaurateur conduct a Pareto analysis. (Assume that no
damages were caused to the inventory purchased over the three months)
What is the Insert function in Excel?
How is a frequency distribution calculated for categorical and numerical data?
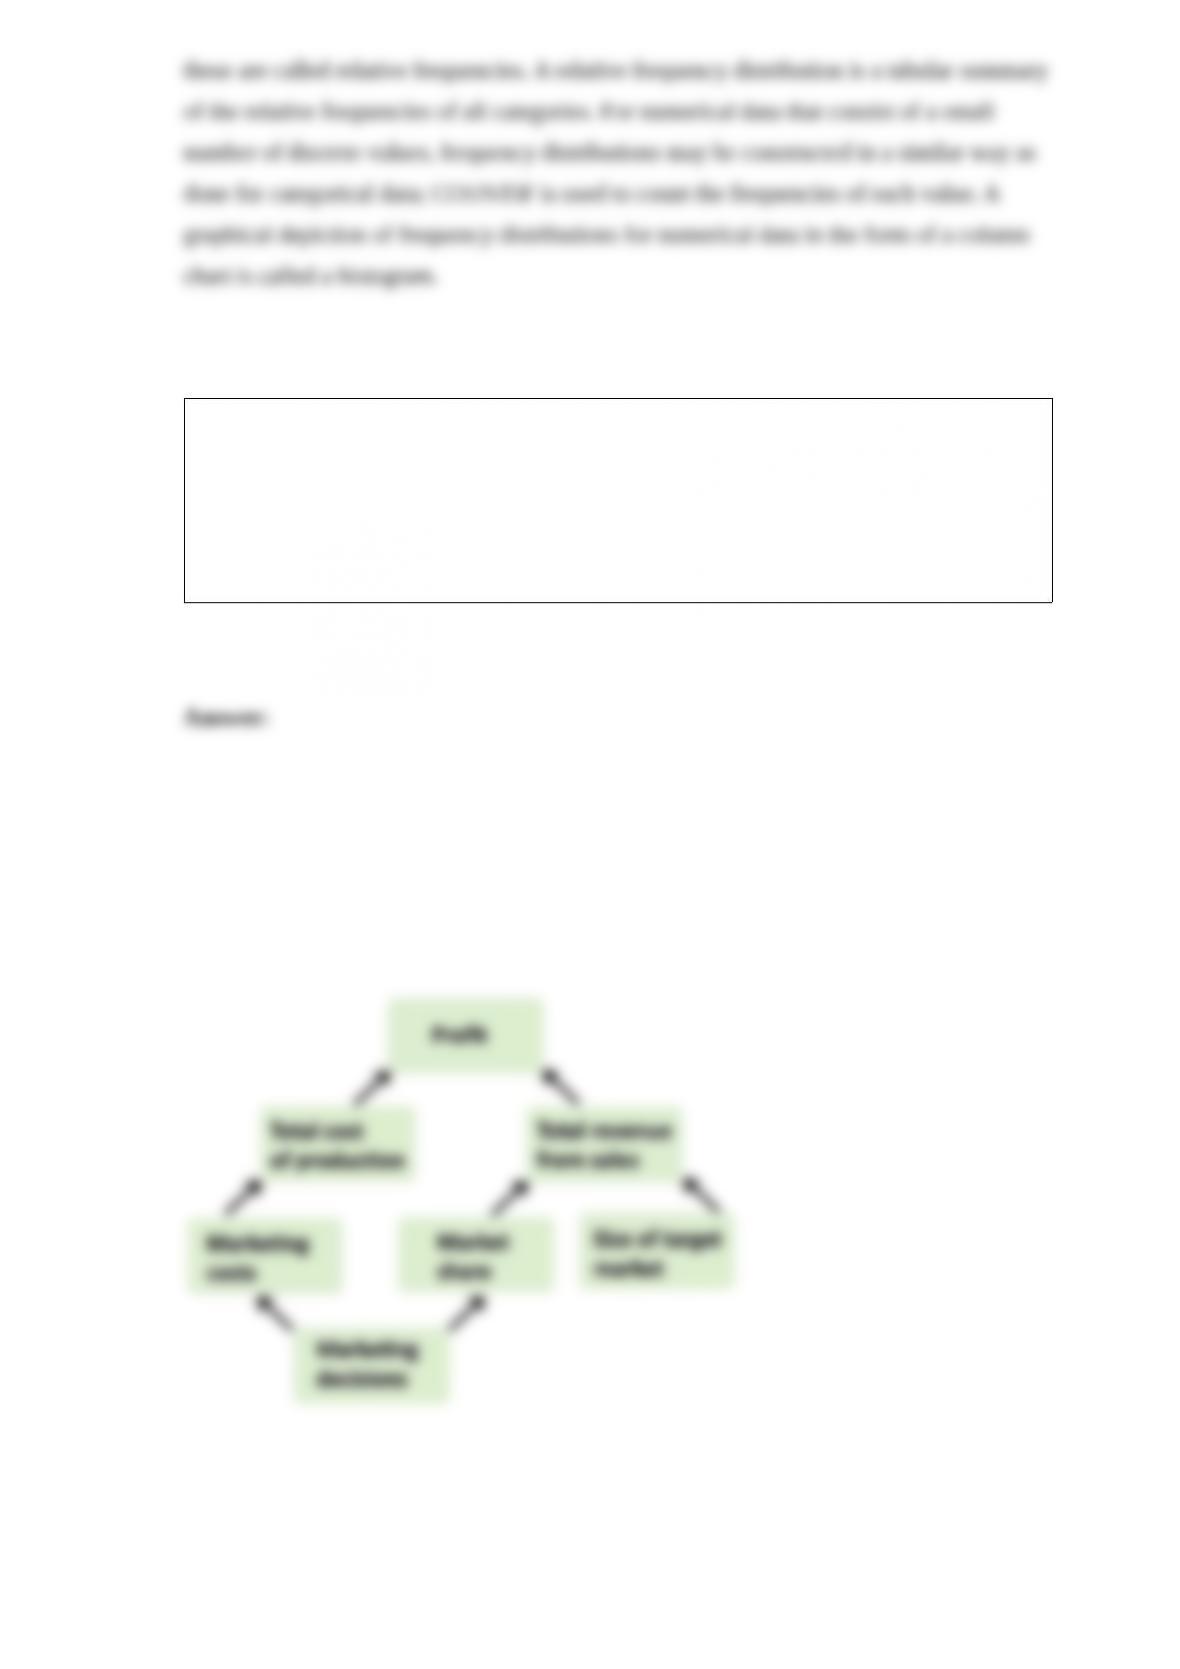
Profit is computed as the difference between total revenue from sales and total cost of
production. Revenue depends on the market share captured by a company and the size
of the target market. Various marketing decisions taken by managers are reflected upon
the market share. The decisions also have an impact on marketing costs which in turn
will affect the total cost of production. Construct an influence diagram that relates these
variables.