1)
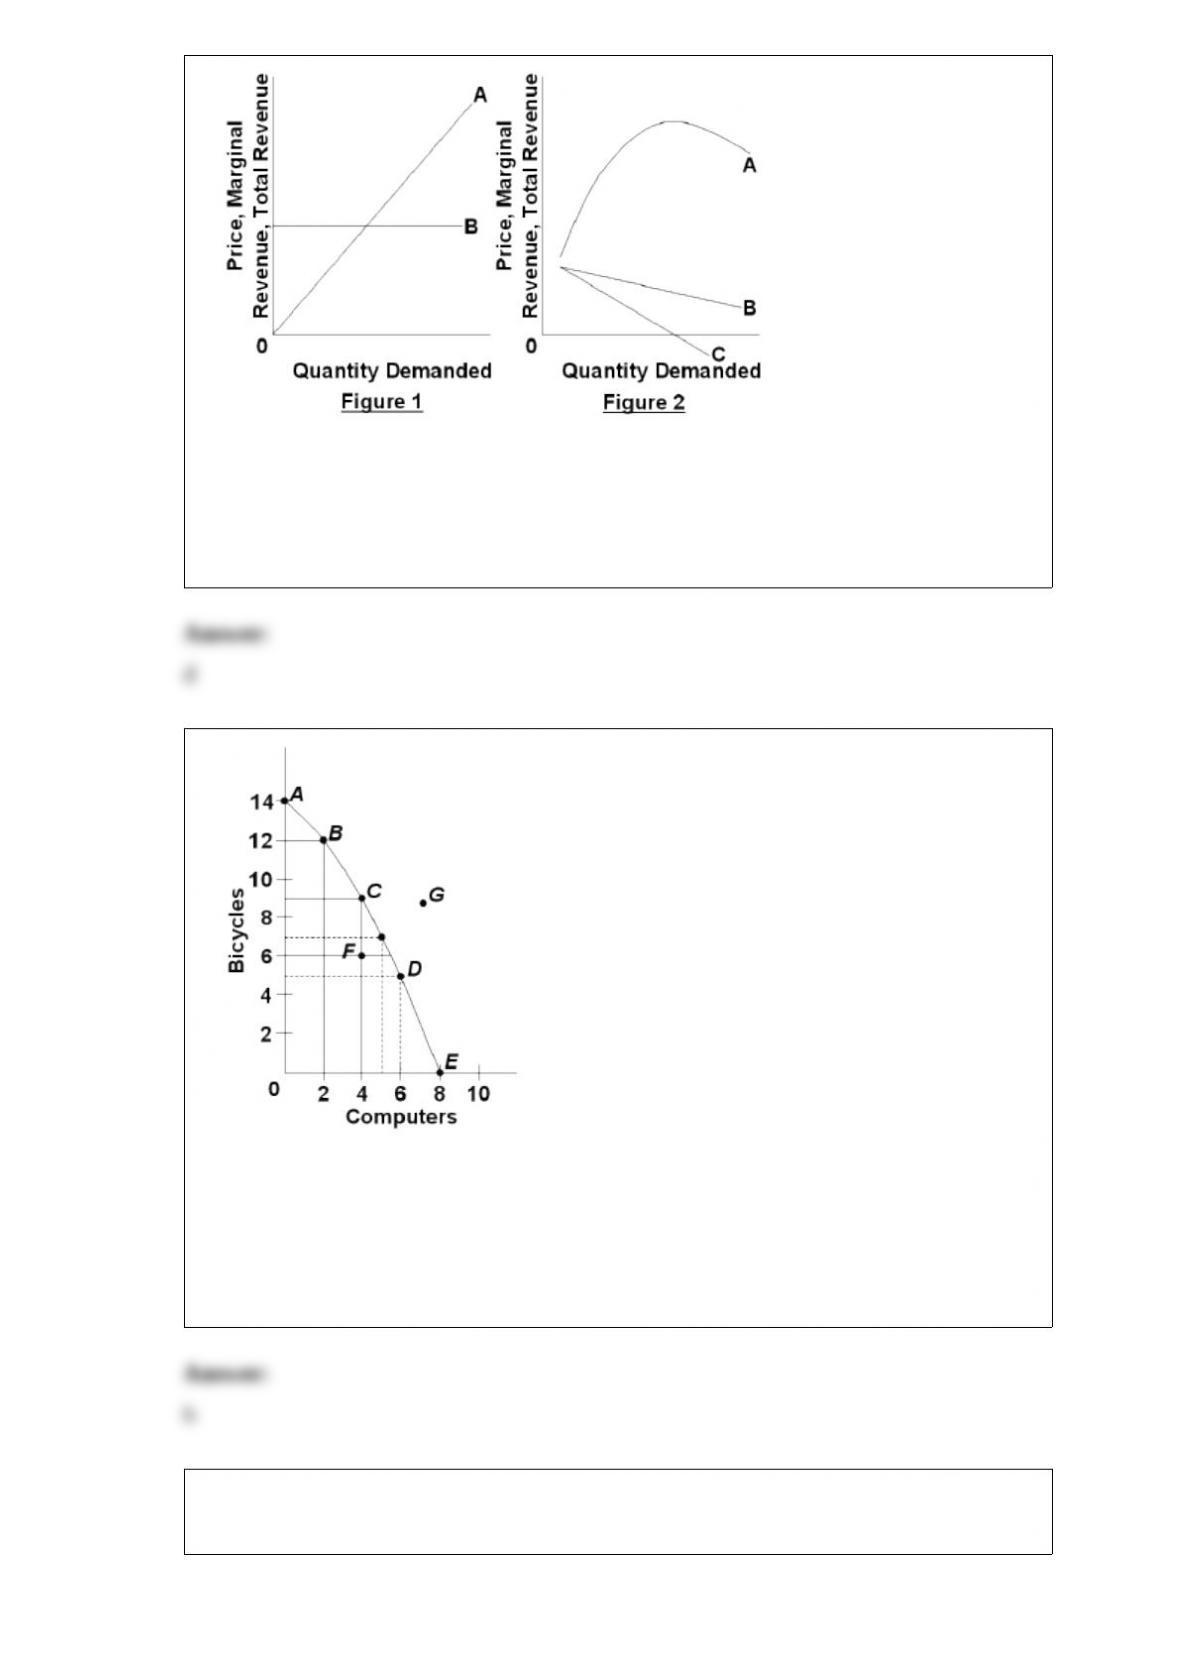
refer to the above two diagrams for individual firms. figure 2 pertains to:
a.a market characterized by government regulation of price and output.
b.either an imperfectly competitive or a purely competitive seller.
c.a purely competitive seller.
d.an imperfectly competitive seller.
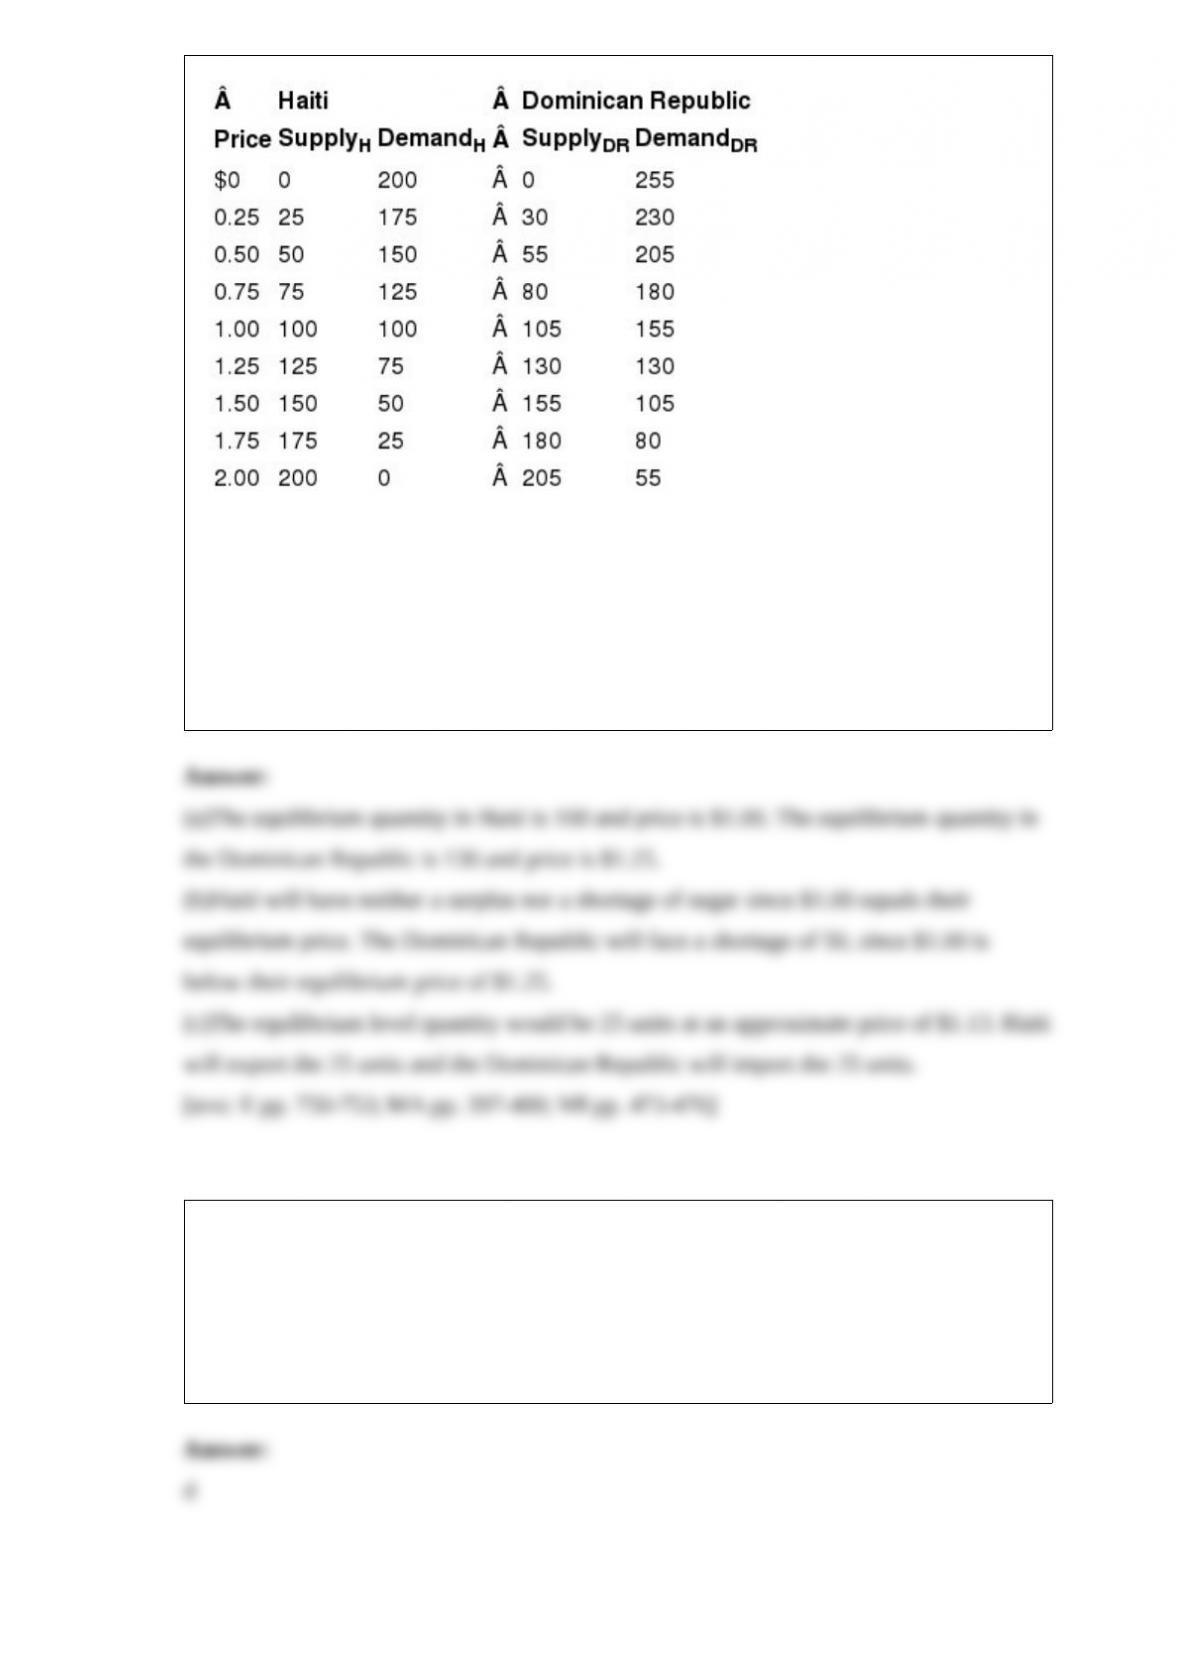
2)
refer to the above diagram. points a, b, c, d, and e show:
a.that the opportunity cost of bicycles increases, while that of computers is constant.
b.combinations of bicycles and computers that society can produce by using its
resources efficiently.
c.that the opportunity cost of computers increases, while that of bicycles is constant.
d.that society’s demand for computers is greater than its demand for bicycles.
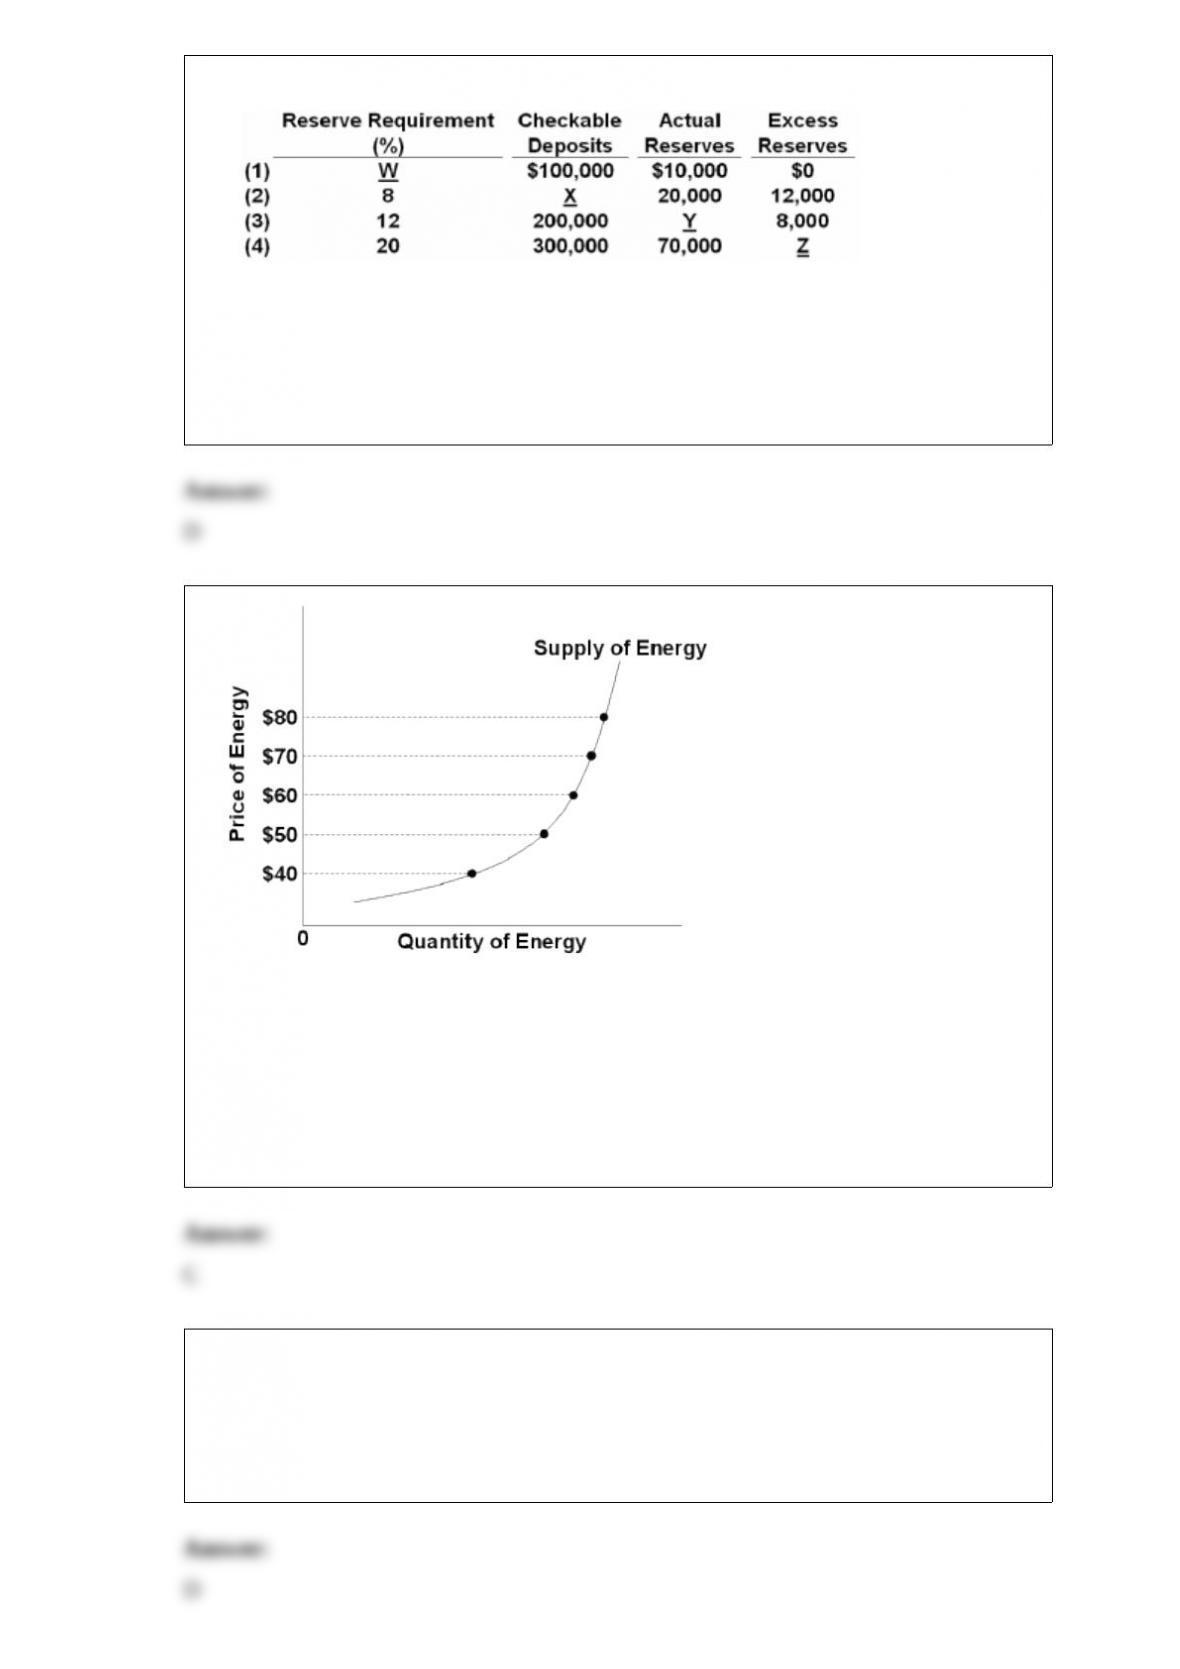
3) The table below lists the domestic supply, demand and price levels for sugar in Haiti
and the Dominican Republic. Use this information to answer the following questions.
(a)What is the domestic equilibrium level of quantity and price of sugar in each
country?
(b)Suppose the world price of sugar is currently $1.00. Will each country face a
shortage, surplus or neither for sugar?
(c)If the domestic markets for sugar of each country were combined, what would be the
equilibrium quantity and price of imports/exports? Which country will import sugar and
which will export? Support your answer graphically.
4) if the long-run average total cost curve of an industry is declining at the point where
it intersects the industry demand curve, we can expect:
a.an overallocation of resources.
b.the industry will be purely competitive.
c.the industry will be monopolistically competitive.
d.the industry will be a natural monopoly.
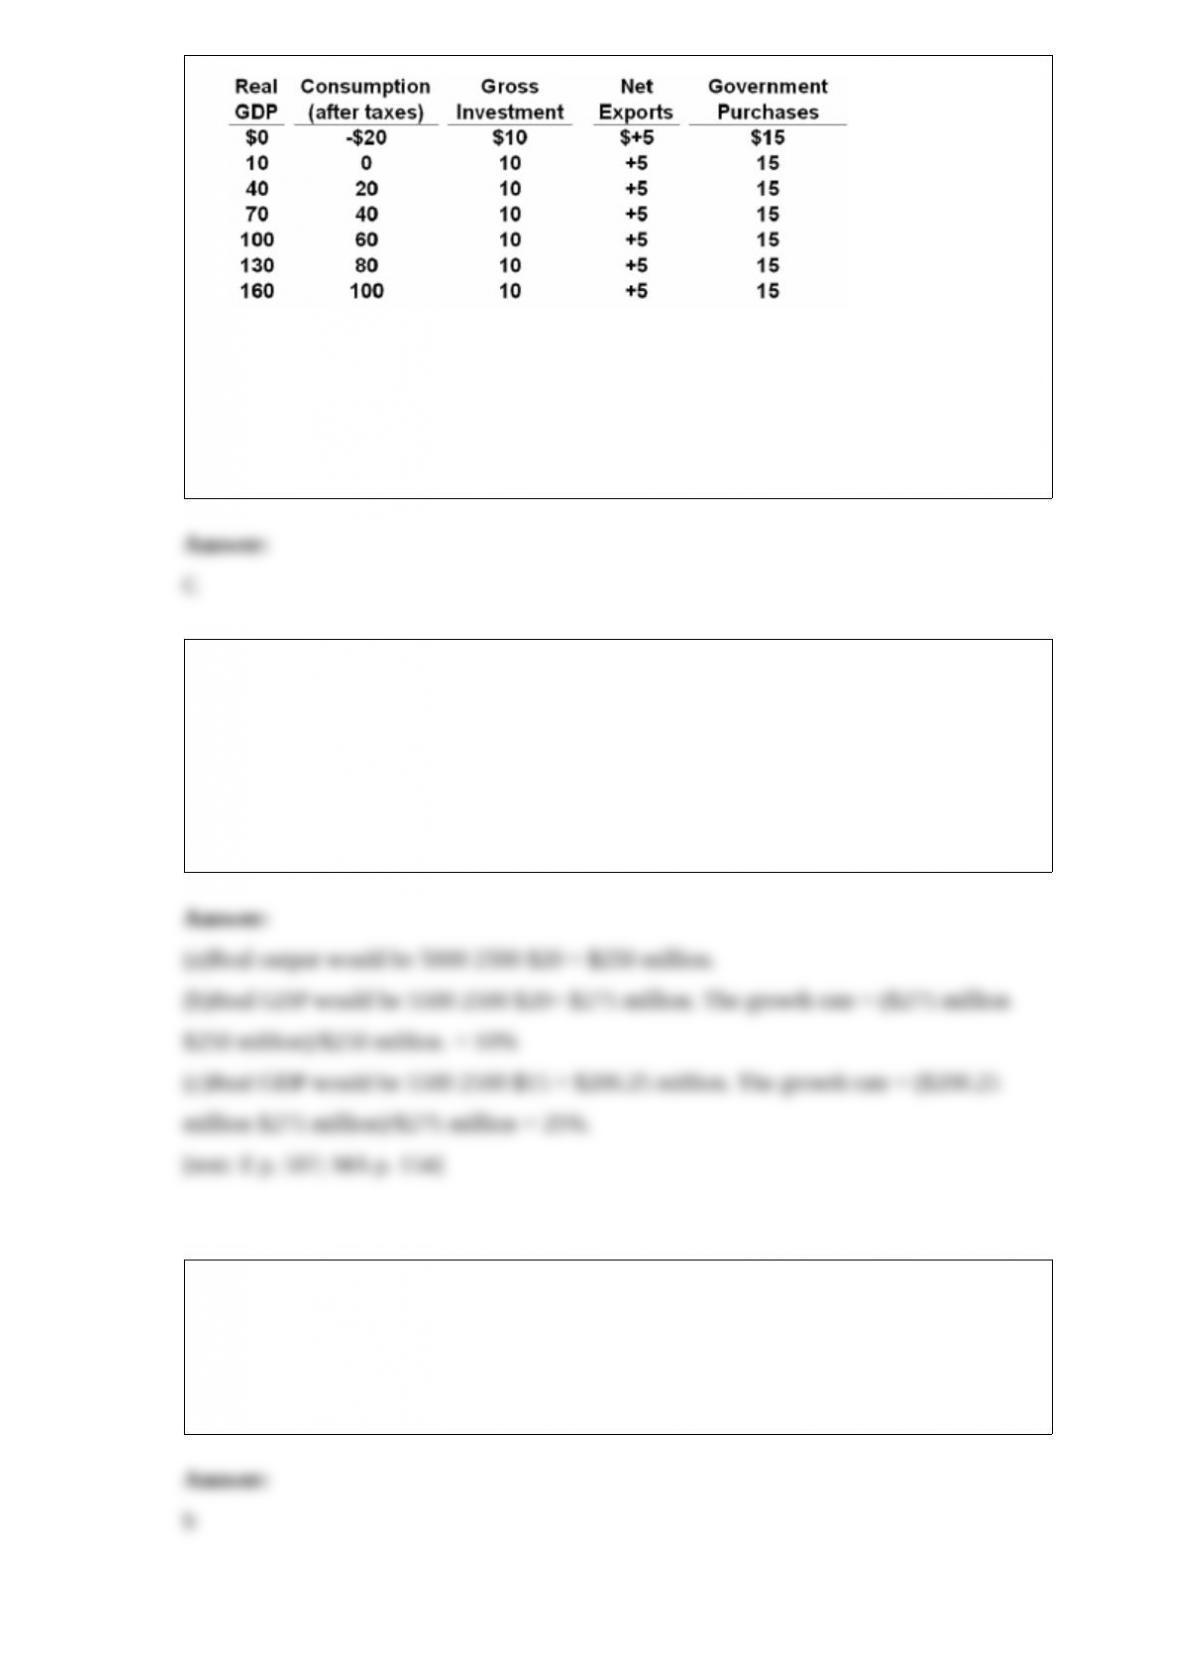
5)
Refer to row 2 in the above table. The number appropriate for space X is:
A.$20,000.
B.$60,000.
C.$200,000.
D.$100,000.
6)
Refer to the diagram above. Assuming it represents the overall supply of energy, at what
per barrel price of oil does the production of U.S. corn-based ethanol become
economically viable?
A.$40.
B.$50.
C.$60.
D.$70.
7) A firm is hiring the profit-maximizing amount of an input when:
A.AVC = MC.
B.MP = MRC.
C.MRC = MR.
D.MRP = MRC.
8)
Refer to the above table. The after-tax MPS shown is:
A..1.
B..2.
C..33.
D..4.
9) Assume that an economy has 5000 workers, each working 2500 hours per year. The
average real output per worker is $
(a)What would the total output or real GDP be?
(b)Suppose in year 2 the number of workers increased to 5500. What would real GDP
be? What would the growth rate be?
(c)Suppose in year 3 the average real output per worker declined to $15. What would
real GDP be? What would the growth rate be?
10) a government subsidy to the producers of a product:
a.reduces product supply.
b.increases product supply.
c.reduces product demand.
d.increases product demand.

11) Assume that a restaurant is hiring labor in an amount such that the MRC of the last
worker is $16 and her MRP is $12. On the basis of this information we can say that:
A.profits will be increased by hiring additional workers.
B.profits will be increased by hiring fewer workers.
C.marginal revenue product must exceed average revenue product.
D.the restaurant is maximizing profits.