A light bulb manufacturer wants to advertise the average life of its light bulbs so it tests
a subset of light bulbs. This is an example of inferential statistics.
The F-distribution can only have positive values.
Possibly the most frequently used nonstatistical sampling procedure is the simple
random sample.
Any normal distribution can be converted to a standard normal distribution.
The impact on the margin of error for a confidence interval for an increase in
confidence level and a decrease in sample size is unknown since these changes are
contradictory.
A histogram can be constructed for data that are either quantitative or qualitative.
A study of 4000 Dell PC customers listed the age of the customer among other
variables. The youngest customer was 14 years old and the oldest customer was 84
years old. If analysts for the company wish to develop a frequency distribution with 7
classes, the smallest value that the class width can be is 10 years.
For a normal distribution, the probability of a value being between a positive z-value
and its population mean is the same as that of a value being between a negative z-value
and its population mean.
To employ contingency analysis, we set up a 2-dimensional table called a contingency
table.
One of the difficulties in using the relative frequency of occurrence method for
assessing probabilities in business situations is getting a large enough set of examples
that match the one in question.
A study was recently done in which the following regression output was generated
using Excel.
SUMMARY OUTPUT
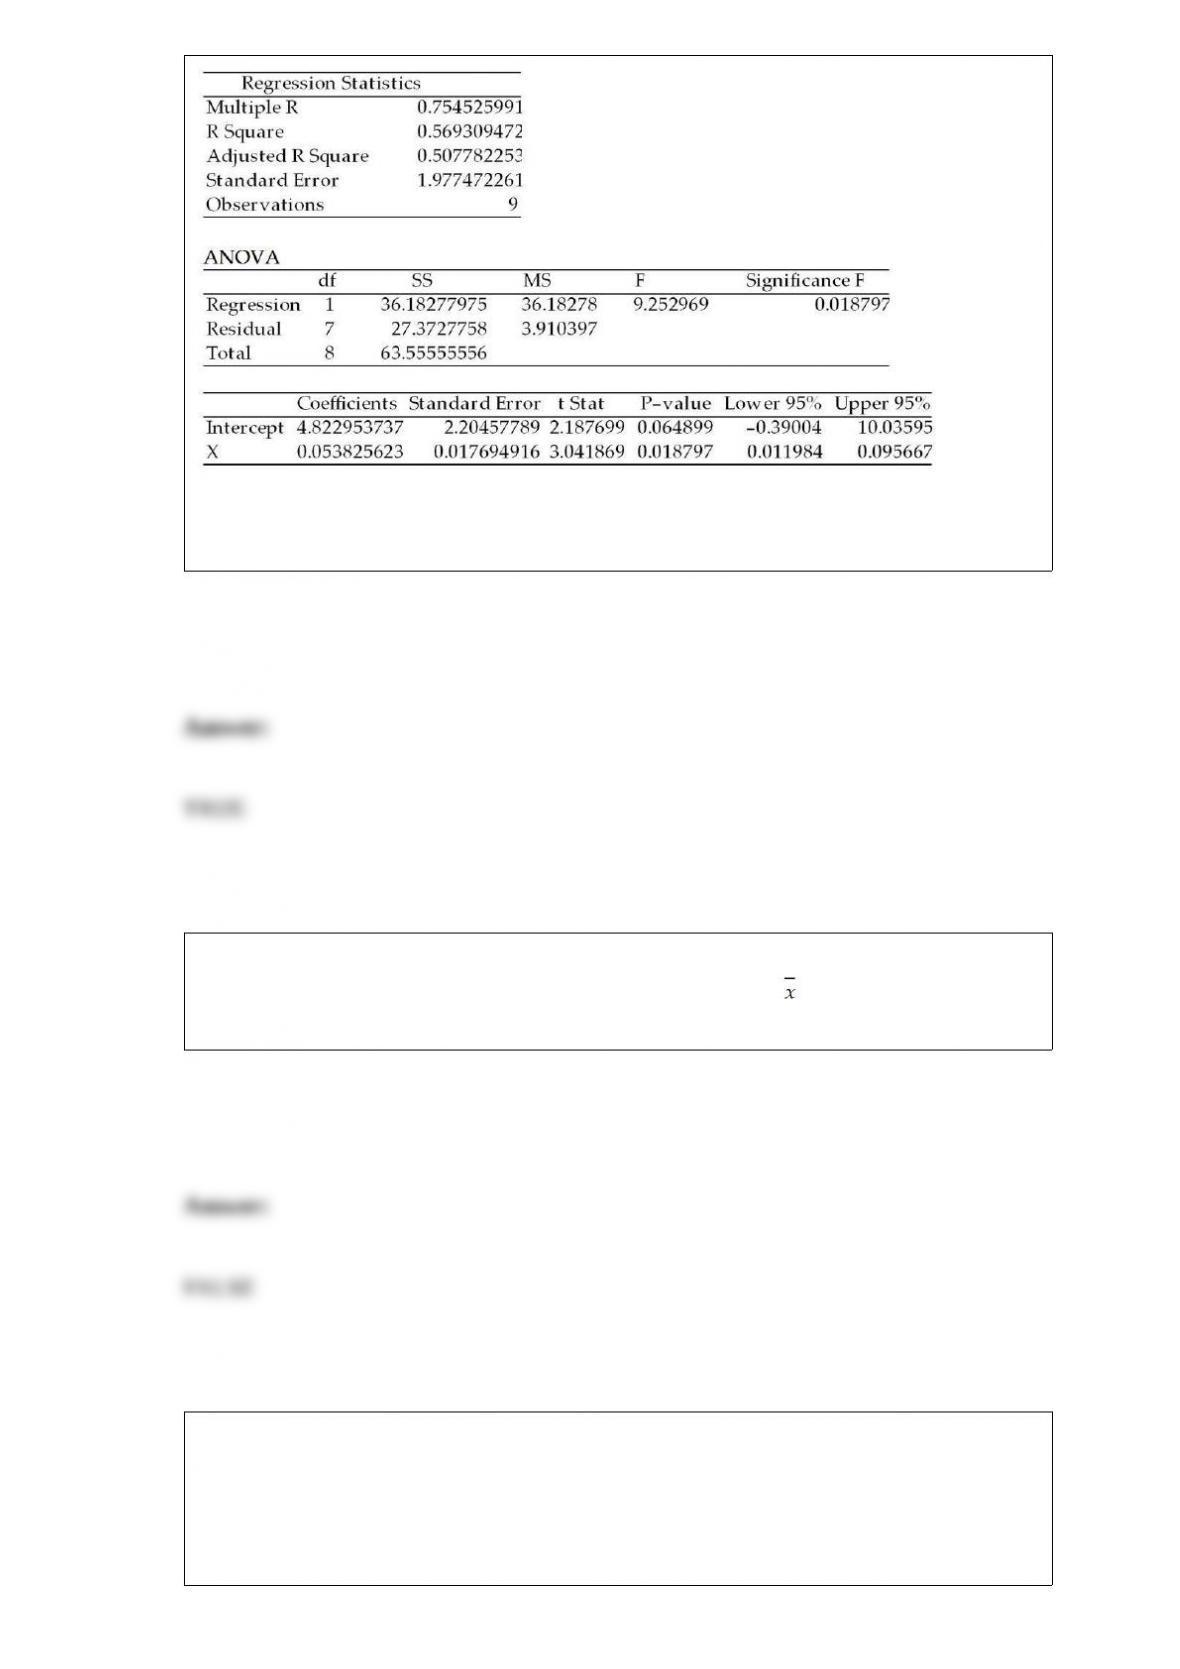
Given this, we know that approximately 57 percent of the variation in the y variable is
explained by the x variable.
The population mean of income for adults in a particular community is known to be
$28,600. Given this information, the sampling distribution of values will be less than
this depending on the size of the sample used in developing the sampling distribution.
The Cranston Hardware Company is interested in estimating the difference in the mean
purchase for men customers versus women customers. It wishes to estimate this
difference using a 95 percent confidence level. Assume that the variances are equal and
the populations normally distributed. The following data represent independent samples
from each population:
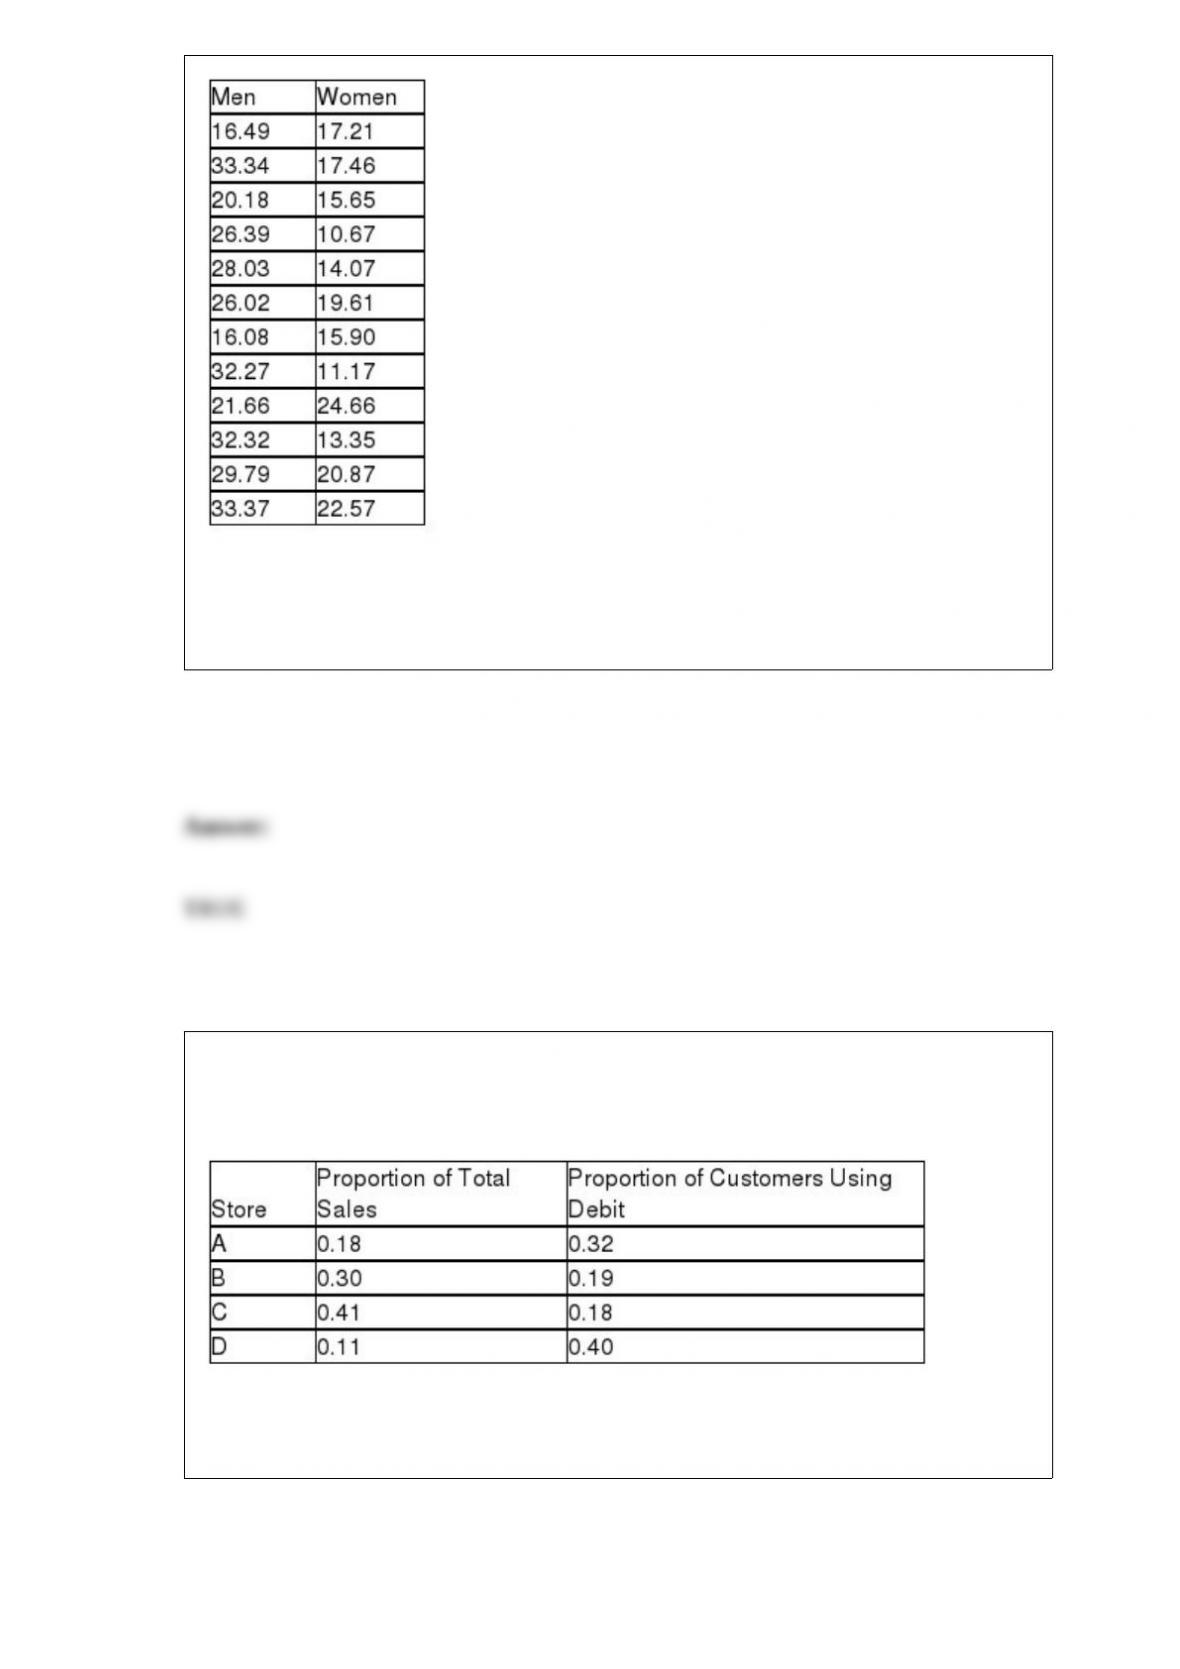
Based on these data, the company can conclude that there is a statistical difference
between men and women with regard to mean spending at the hardware store with men
tending to spend more on average than women.
The Baker Oil and Gas Company has four retail locations, code-named A, B, C, and D.
The following table illustrates the percentage of total company sales at each store and
also the percentage of customers at that store who make purchases with debit cards:
Based on this information, the probability that a customer will use a debit card is just
slightly greater than 0.23.

The State Department of Forests has determined that annual tree growth in a particular
forest area is normally distributed with a mean equal to 17 inches and a standard
deviation equal to 6 inches. Based on this information, it is possible for a randomly
selected tree not to have grown any during a year.
In a recent study of the sales prices of houses in a Midwestern city, the mean sales price
has been reported to be $167,811 while the median sales price was $155,600. From this
information, you can determine that the data involved in the study are left-skewed.
The following output is for a second-order polynomial regression model where the
independent variables are x and x2 (x^2 in output). Some of the output has been
omitted.
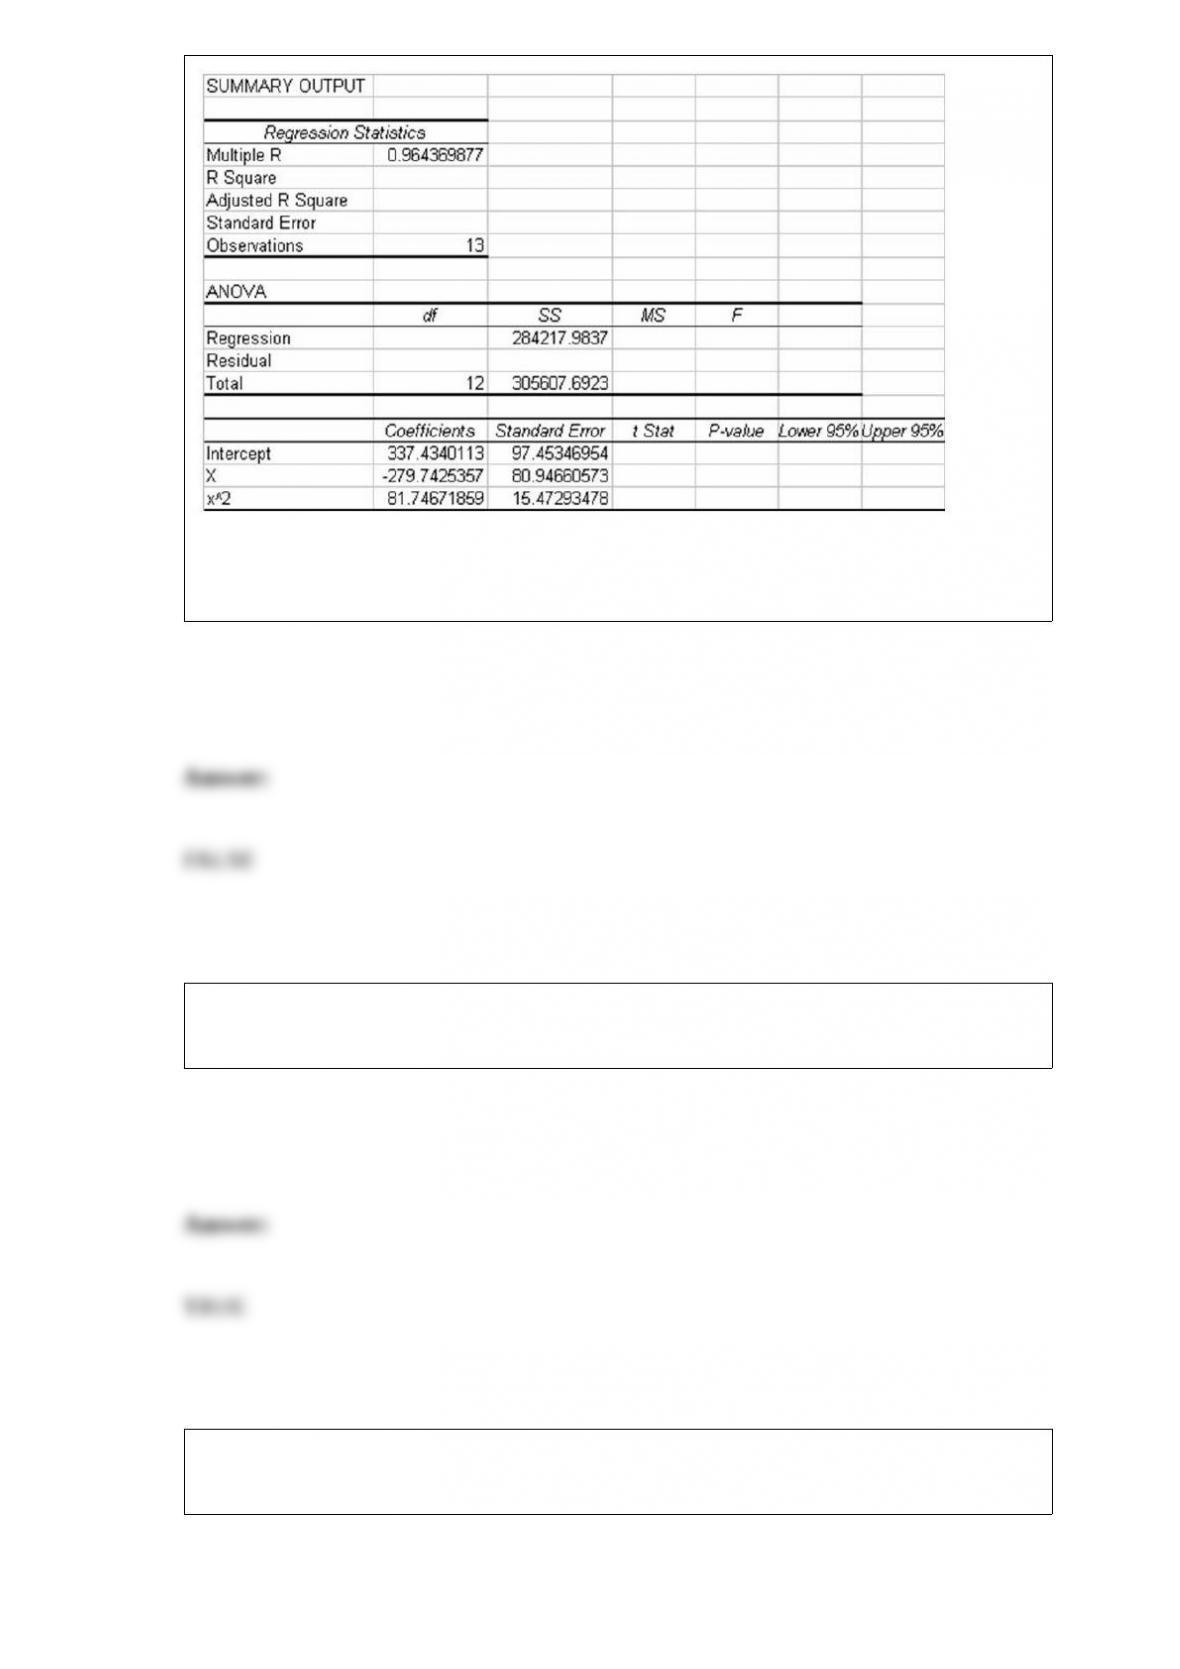
Considering the above information, the model explains approximately 56.7 percent of
the variation in the y variable.
When students are asked to list their age and the percentage of their college expenses
that they pay for themselves, the type of data being collected is quantitative.
When the expected cell frequencies are smaller than 5, the cells should be combined in
a meaningful way such that the expected cell frequencies do exceed 5.
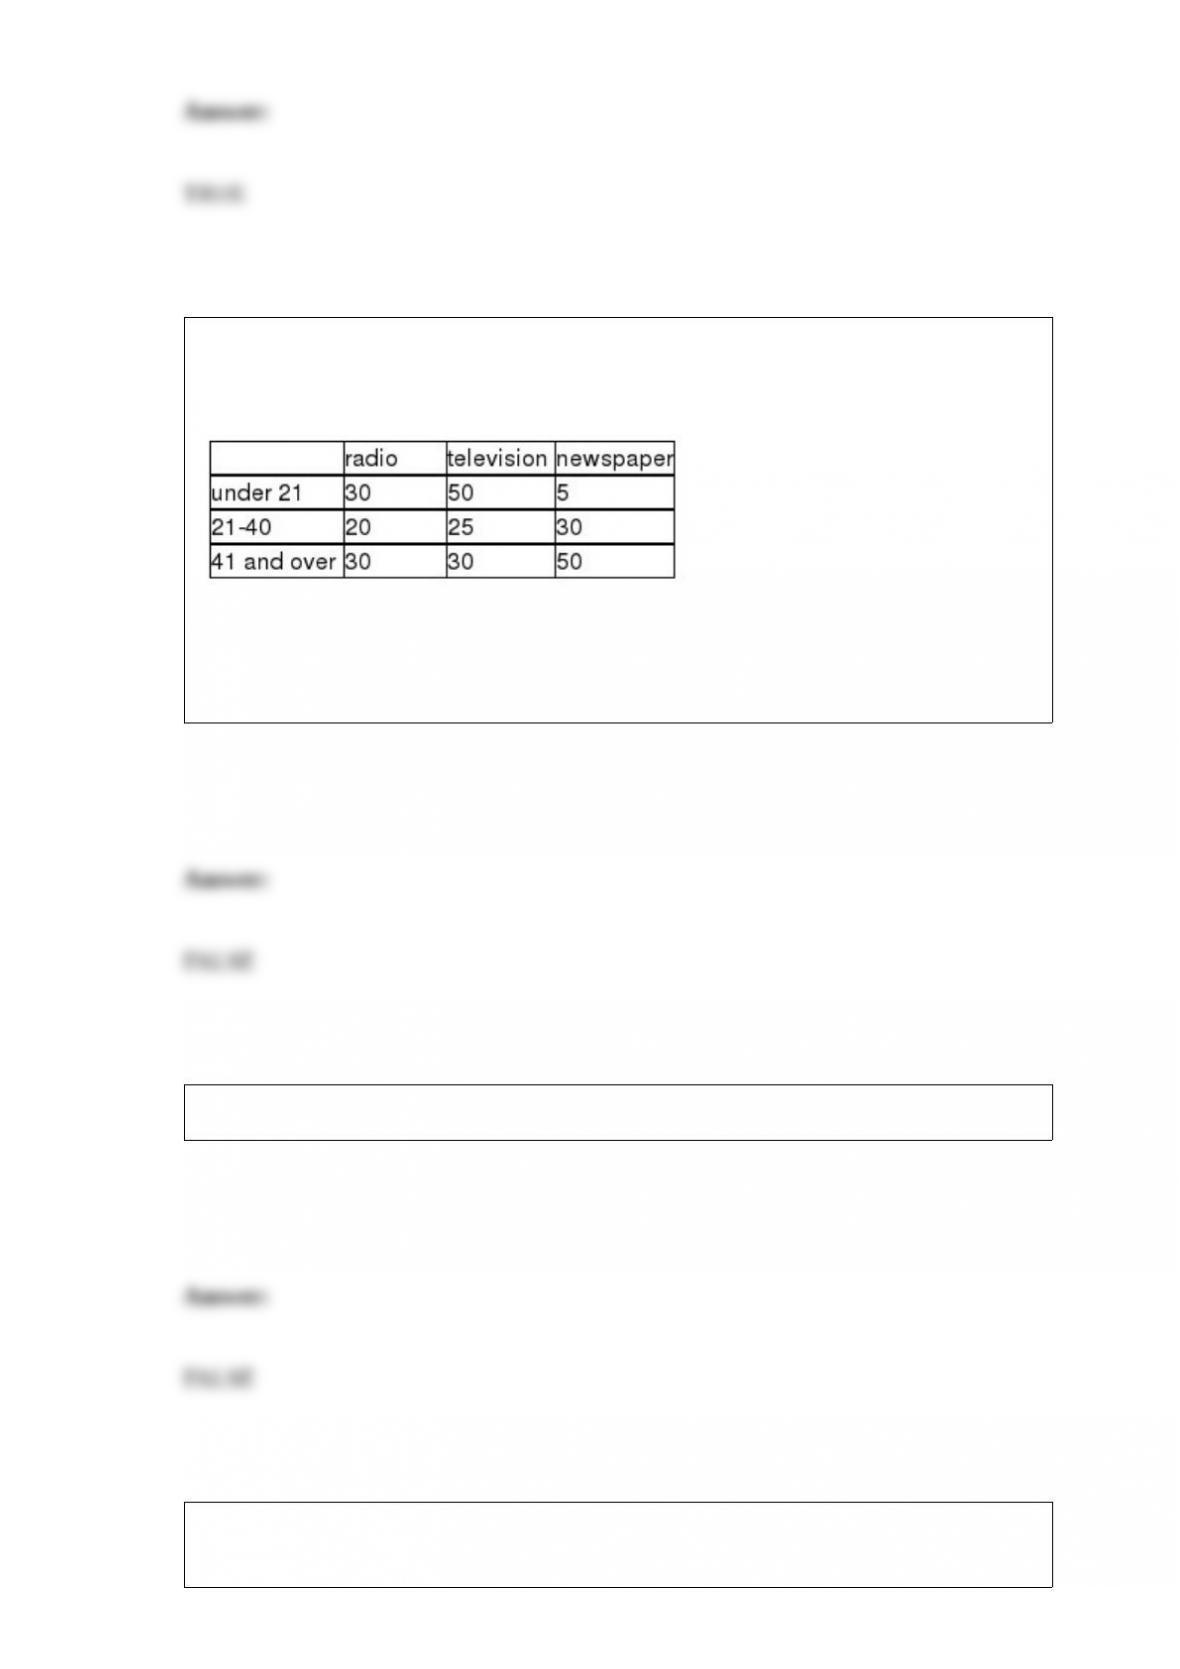
A study was recently conducted in which people were asked to indicate which news
medium was their preferred choice for national news. The following data were
observed:
Given this data, if we wish to test whether the preferred news source is independent of
age, for an alpha = .05 level, the critical value from the chi-square table is based on 8
degrees of freedom.
The symbol μ is used to represent the sample mean.
In a two-factor ANOVA, the minimum number of replications required in any cell is
two, but all cells must have the same number of replications.
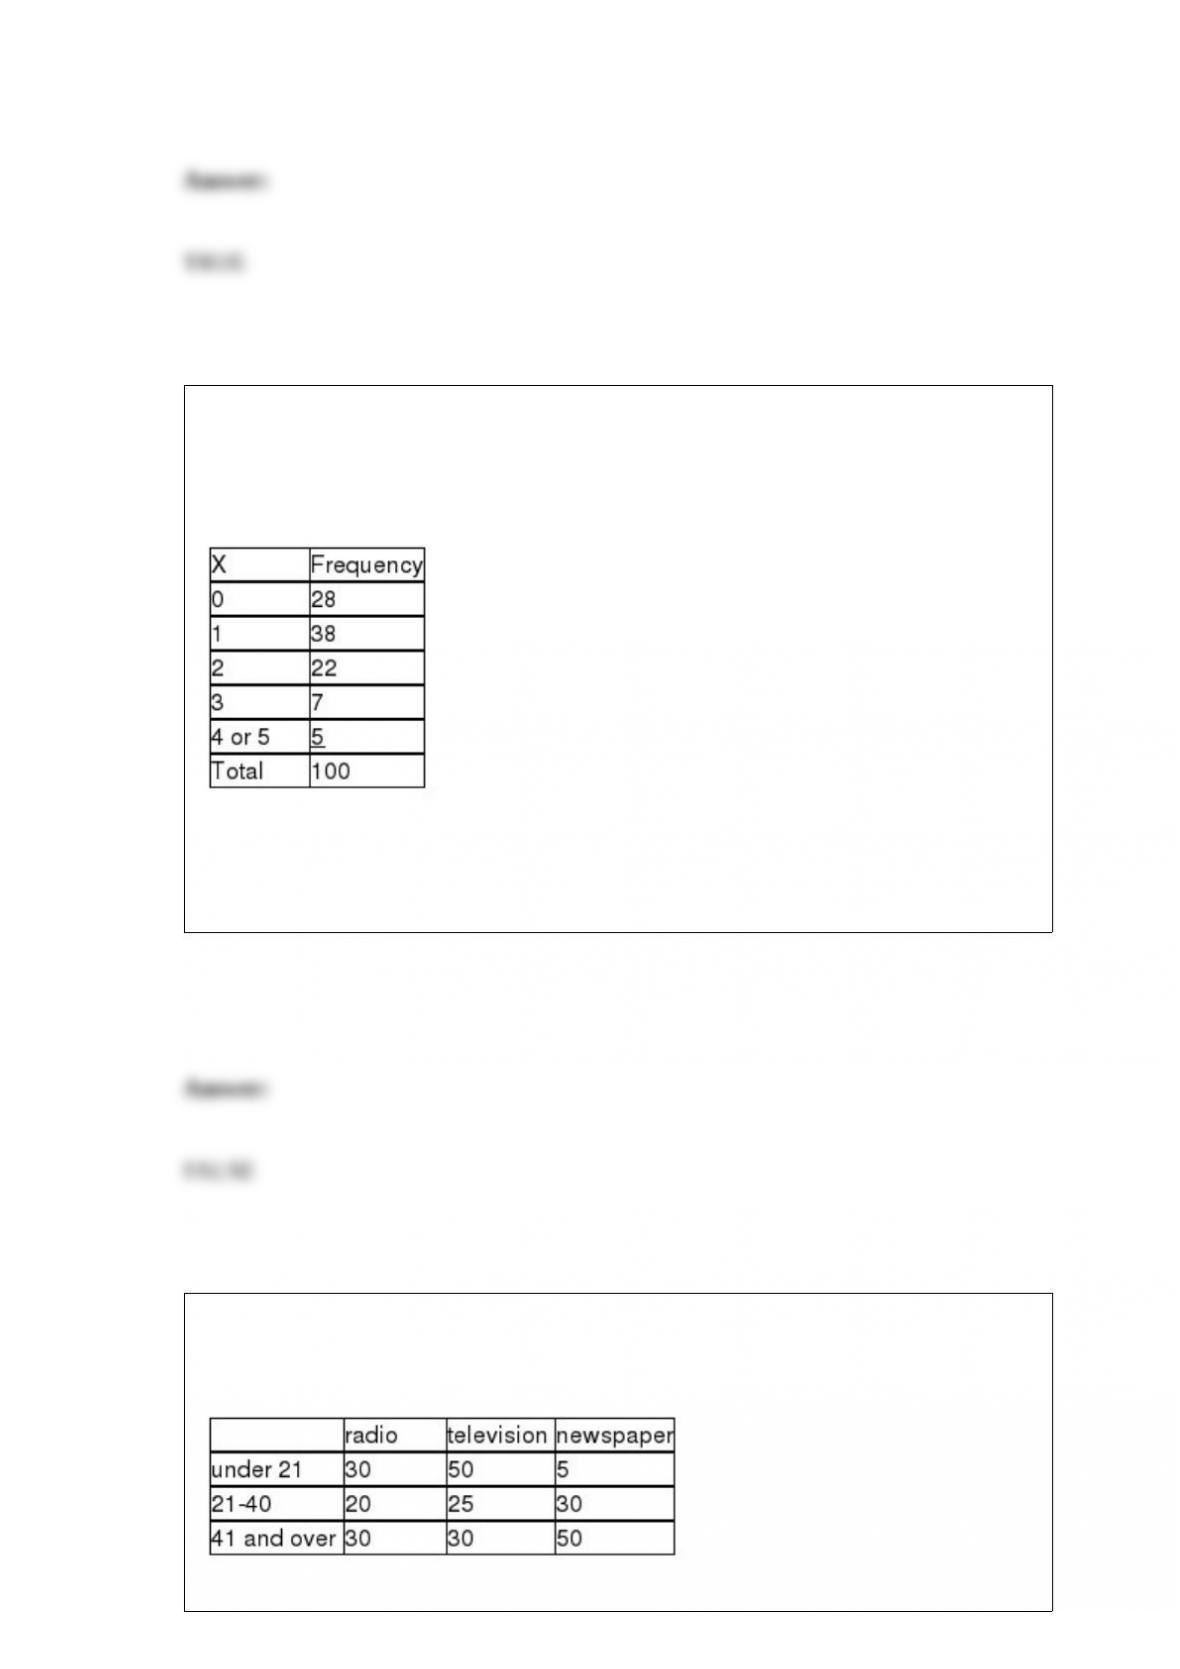
A business with 5 copy machines keeps track of how many copy machines need service
on a given day. It believes this is binomially distributed with a probability of p = 0.2 of
each machine needing service on any given day. It has collected the following based on
a random sample of 100 days.
Given this information, assuming that all expected values are sufficiently large to use
the classes as shown above, the critical value for testing the hypothesis will be based on
5 degrees of freedom.
A study was recently conducted in which people were asked to indicate which new
medium was their preferred choice for national news. The following data were
observed:
Given this data, if we wish to test whether the preferred news source is independent of
age, the expected frequency in the cell, radiounder 21 cell is 30.
An assembly process takes between 20 and 40 minutes to complete with the distribution
of time thought to be uniformly distributed. Based on this, the percentage of assemblies
that require less than 25 minutes is 0.05.
When testing a hypothesis involving population proportions, an increase in sample size
will result in a smaller chance of making a Type I statistical error.
When customers come to a bank, there are three primary locations they may select to go
to: teller, loan officer, or escrow department. Based on past experience, the following
probability distribution applies:
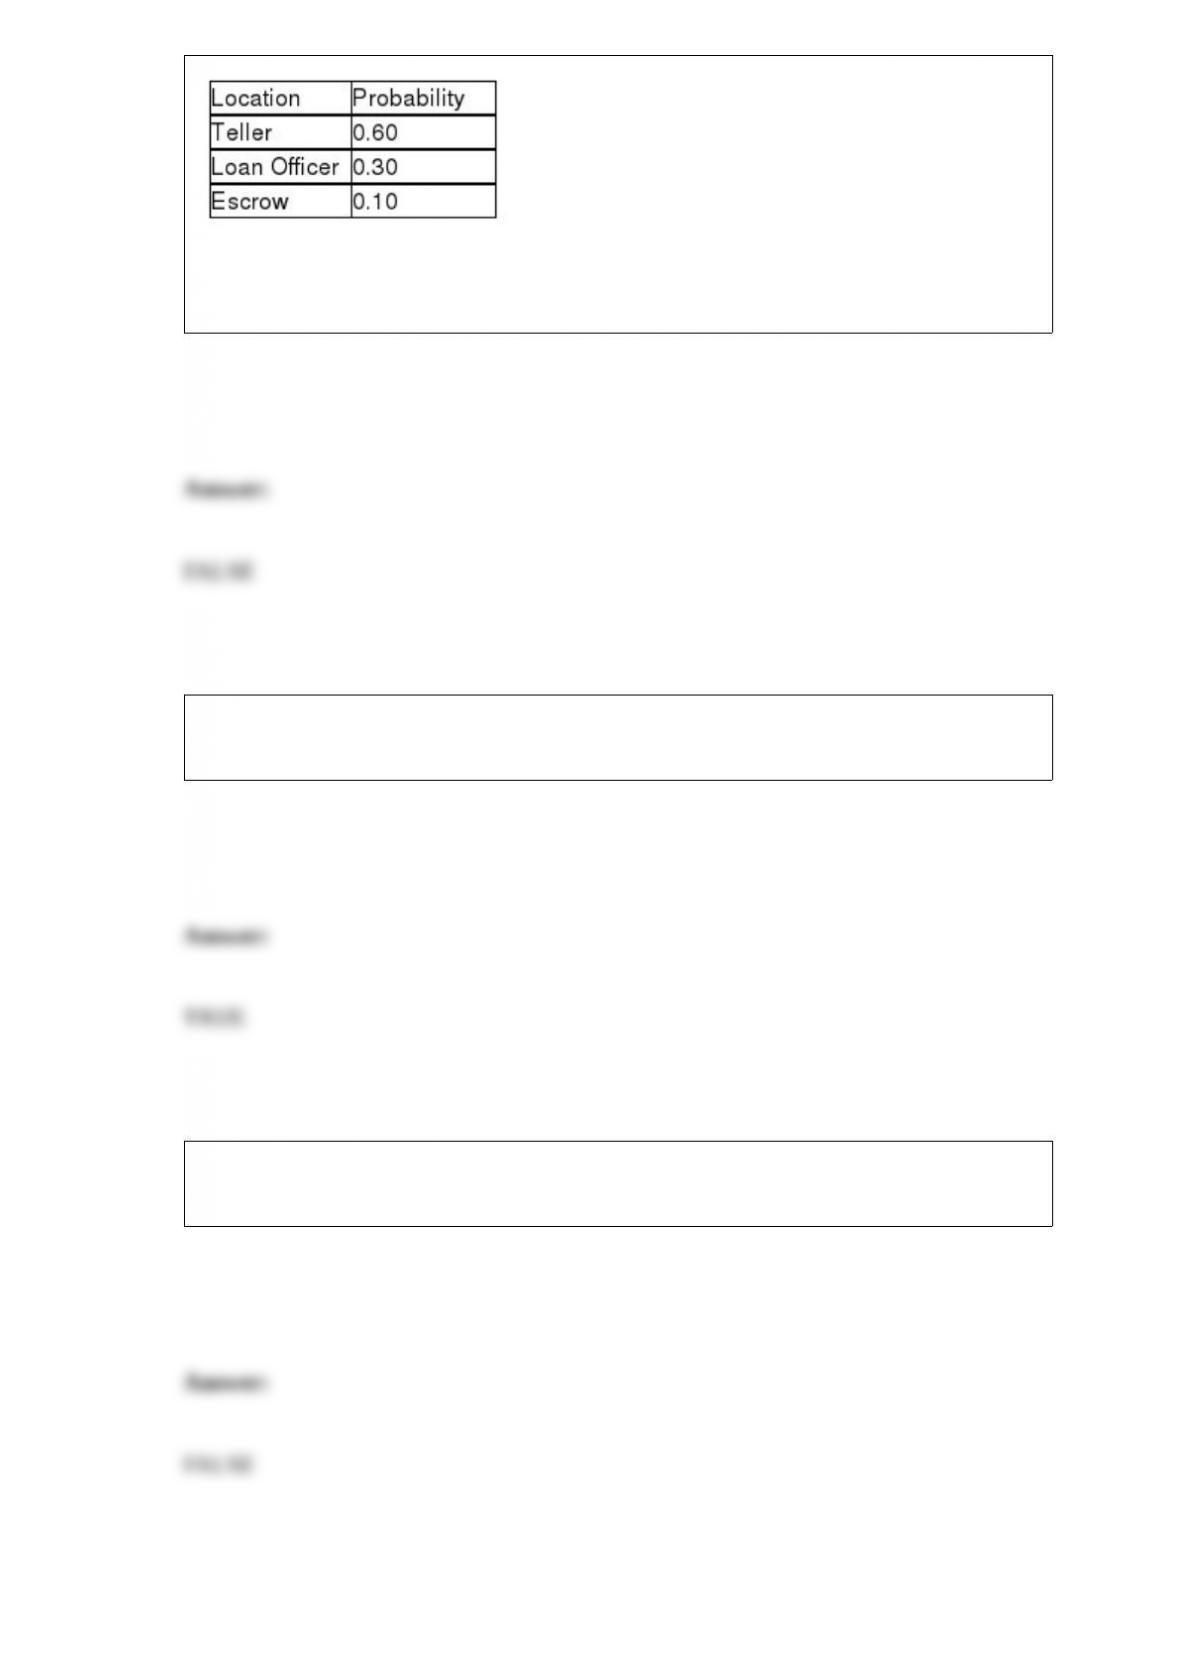
Seventy percent of customers are males. The probability that the next two customers to
enter the bank are males and go to the Loan Officer is 0.42.
In playing the game Monopoly, the probability of a player landing on Park Place would
be assessed using classical probability assessment.
The Central Limit Theorem is of most use to decision makers when the population is
known to be normally distributed.
The Wilcoxon signed rank test is always a one-tail test with the rejection region in the
upper tail.
A random sample of 500 customers at a large retail store was selected. These customers
were asked whether they had a positive experience the last time they shopped there.
Only 50 customers said that they did not have a positive experience. Thus, the
population parameter for proportion of customers who did have a positive experience
is .90.
If a process control chart has only one point outside the upper or lower control limits,
there is insufficient evidence to conclude that the process was out of control at the time
that the measurement was taken.
Interaction terms and polynomial terms should not be included in the same multiple
regression model.
The Conrad Real Estate Company recently conducted a statistical test to determine
whether the number of days that homes are on the market prior to selling is normally
distributed with a mean equal to 50 days and a standard deviation equal to 10 days. The
sample of 200 homes was divided into 8 groups to form a grouped data frequency
distribution. The degrees of freedom for the test will be 7.
The parameters of a normal distribution are the mean and the standard deviation.
If the null hypothesis is not rejected, you do not need to worry when the expected cell
frequencies drop below 5.0
Stepwise regression is the approach that is always taken when developing a regression
model to fit a curvilinear relationship between the dependent and potential independent
variables.
If the time it takes for a customer to be served at a fast-food chain business is thought to
be uniformly distributed between 3 and 8 minutes, then the probability that the time it
takes for a randomly selected customer to be served will be less than 5 minutes is 0.40.
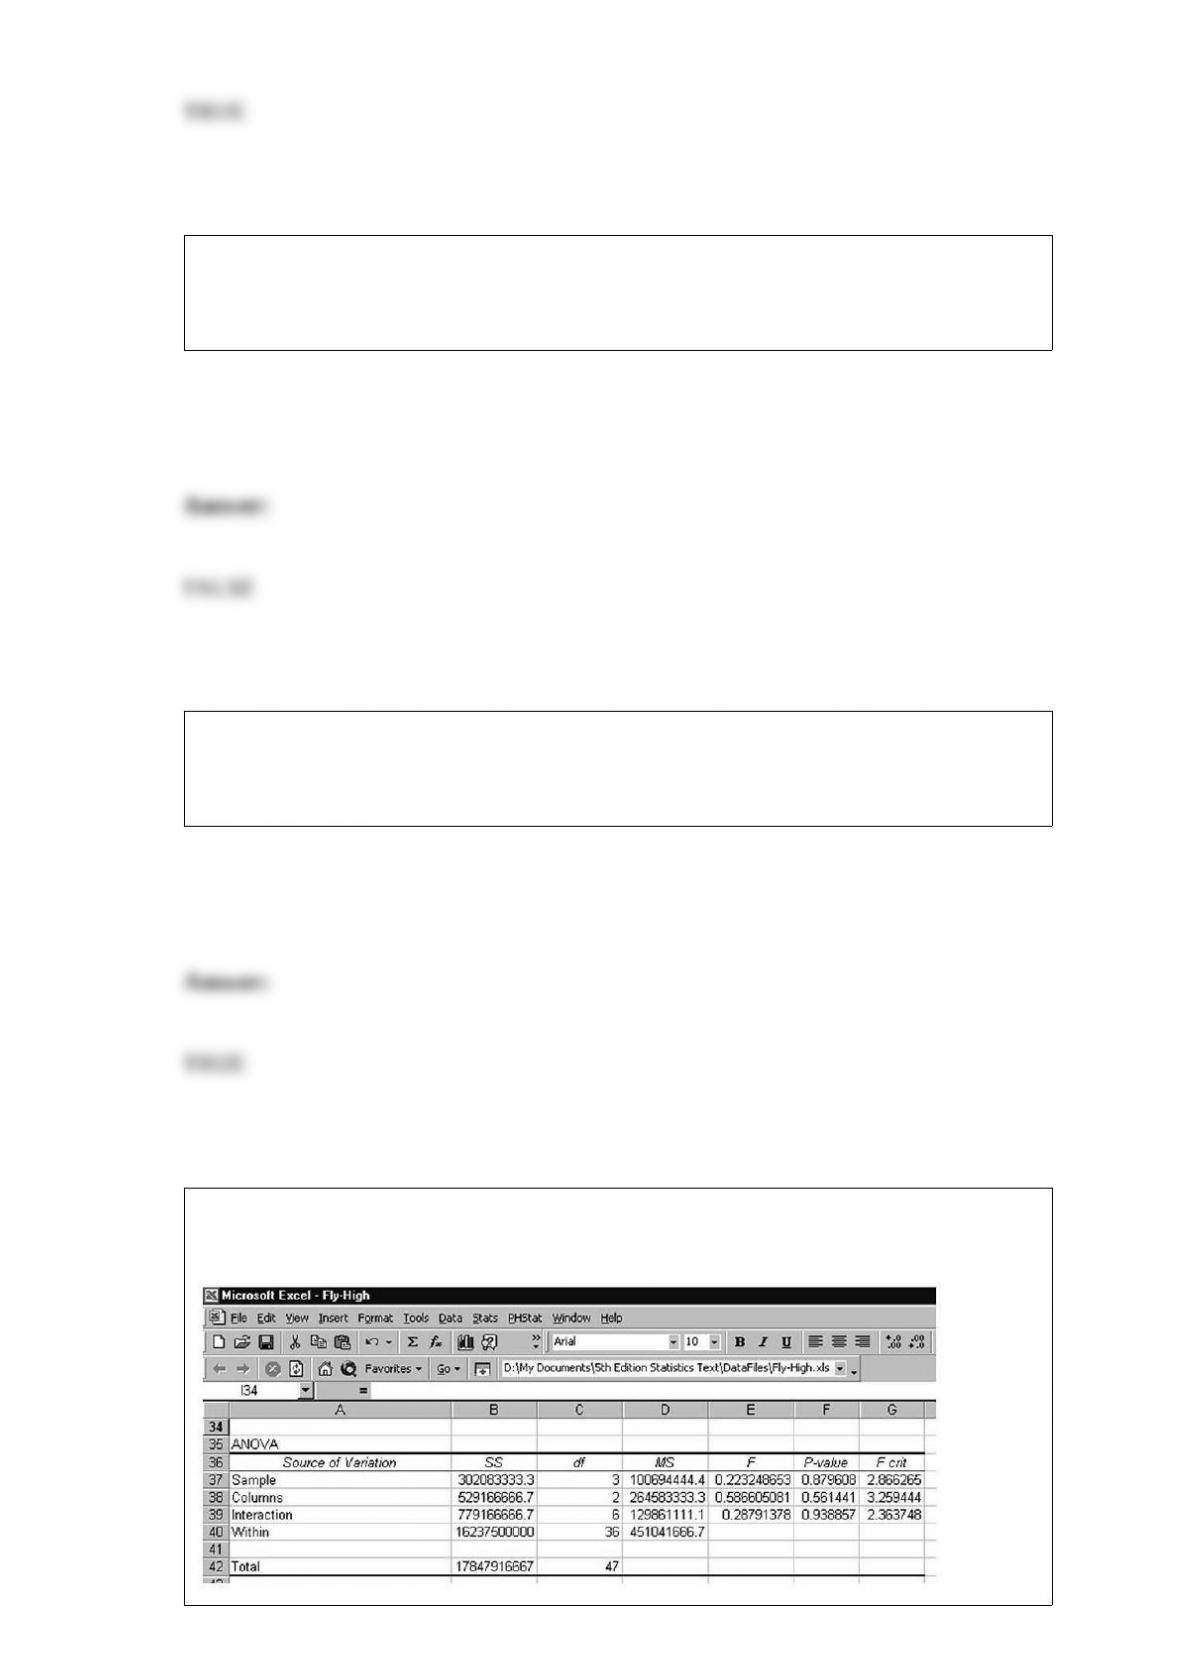
Considering the following printout for a two-factor ANOVA study, which of the
following is the number of replications used?

A) 2
B) 5
C) 4
D) Can’t be determined without more information.
Woof Chow Dog Food Company believes that it has a market share of 25 percent. It
surveys n = 100 dog owners and ask whether or not Woof Chow is their regular brand
of dog food, and 23 people say yes. Based upon this information, what is the value of
the test statistic?
A) -0.462
B) -0.475
C) 0.462
D) 0.475
Estimation and hypothesis testing are categories of:
A) inferential statistics.
B) descriptive statistics.

C) numerical measurement.
D) statistical charts.
Which of the following statements is true?
A) If the confidence interval estimate for the regression slope coefficient crosses over
zero, the average change in y for a one-unit change in x may be zero.
B) If the regression slope coefficient is very close to zero, this means that the
relationship between the x and y variables is statistically insignificant.
C) A statistically significant regression slope coefficient indicates that for a one-unit
change in y there will be a positive change in x by an amount equal to the regression
slope coefficient.
D) It is acceptable to make predictions for y using x values that are outside the range of
the data that was used in the regression.
The following data reflect the number of customers who return merchandise for a
refund on Monday. Note these data reflect the population of all 10 Mondays for which
data are available.

Assume that this same exact pattern of data were replicated for the next ten days. How
would this affect the standard deviation for the new population with 20 items?
A) The standard deviation would be doubled.
B) The standard deviation would be cut in half.
C) The standard deviation would not be changed.
D) There is no way of knowing the exact impact without knowing how the mean is
changed.
A store sells 6 different models of cell phones and have found that they sell an equal
number of each model. The probability distribution that would describe this random
variable is called:
A) uniform distribution.
B) Poisson distribution.
C) continuous distribution.
D) relative frequency distribution.
Examine the following two-factor analysis of variance table:
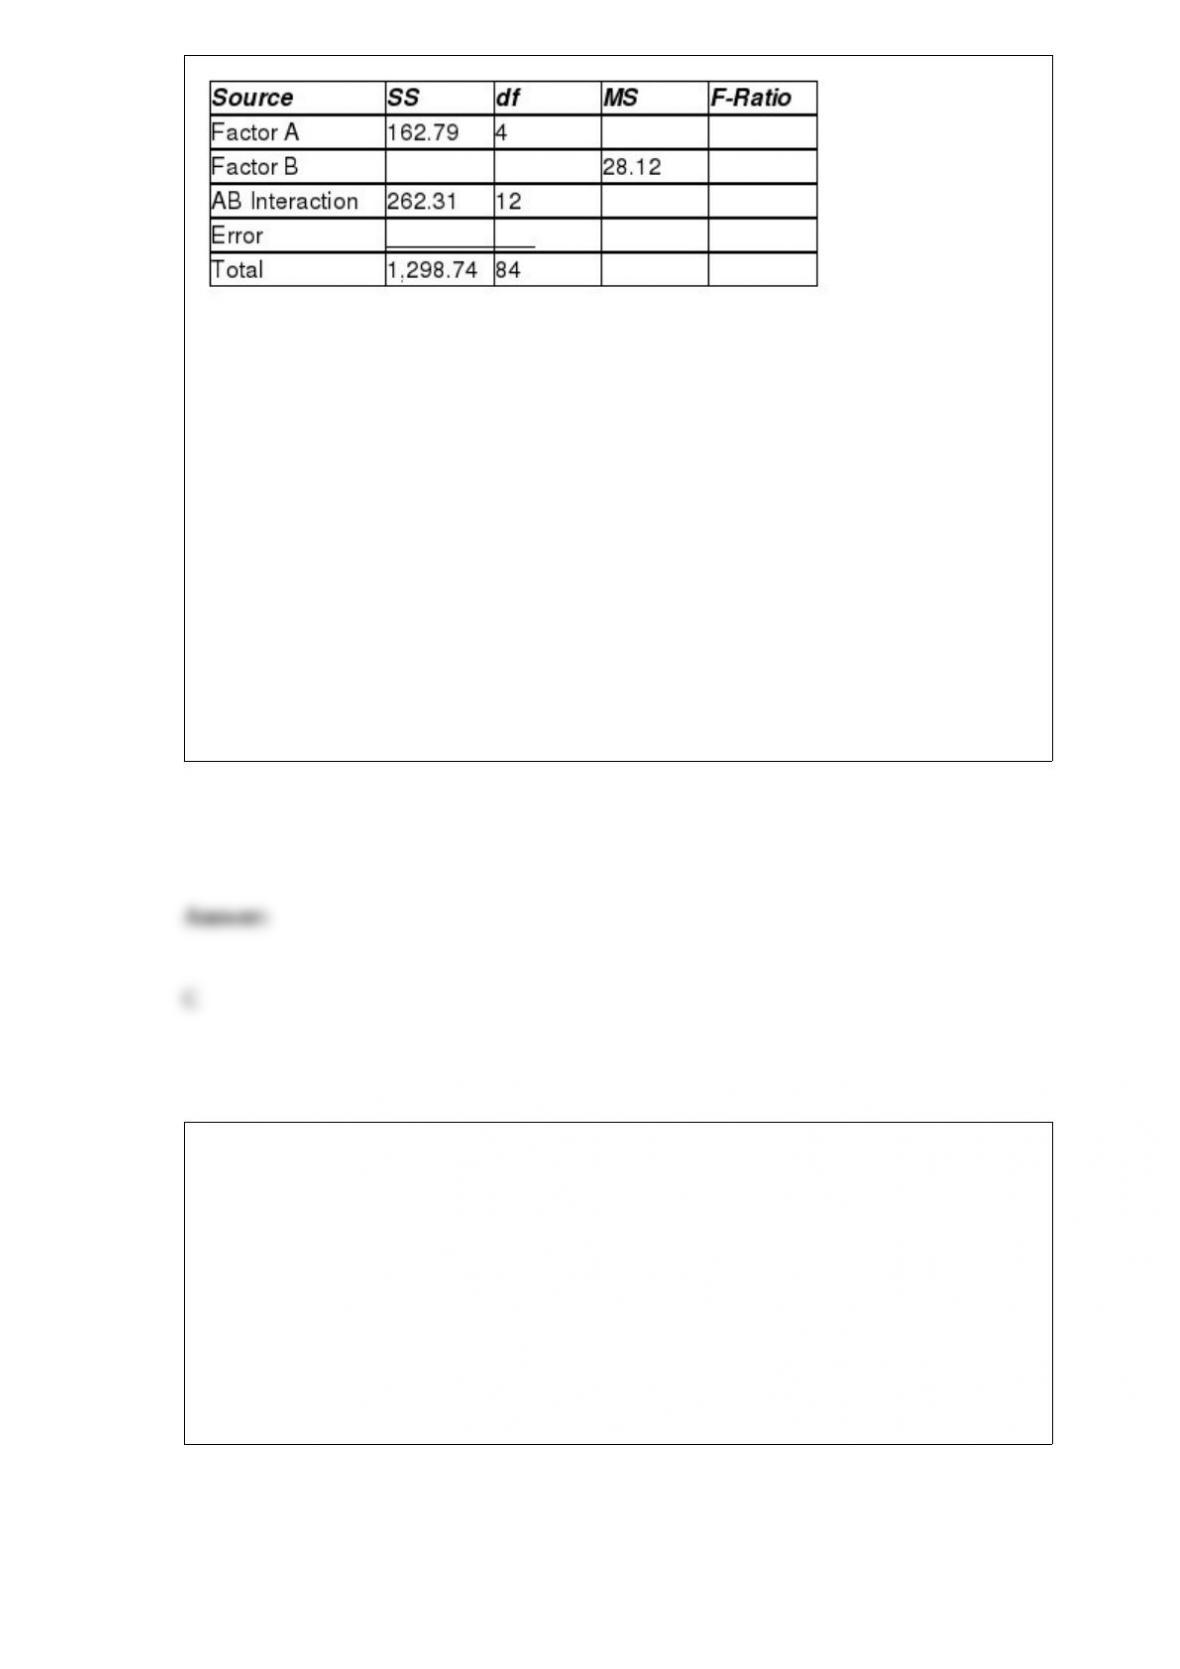
Determine if the levels of factor A have equal means. Use a significance level of 0.05.
A) Fail to reject H0. Conclude that there is sufficient evidence to indicate that at least
two levels of Factor A have different mean responses.
B) Fail to reject H0. Conclude that there is not sufficient evidence to indicate that at
least two levels of Factor A have different mean responses.
C) Reject H0. Conclude that there is sufficient evidence to indicate that at least two
levels of Factor A have different mean responses.
D) Reject H0. Conclude that there is not sufficient evidence to indicate that at least two
levels of Factor A have different mean responses.
What method of probability assessment would most likely be used to assess the
probability that a customer will return a purchase for a refund?
A) Classical probability based on the ratio of the number of ways the event can occur
B) Relative frequency based on previous history
C) Subjective probability based on expert opinion
D) Independent probability based on two unrelated outcomes

Given a population where the proportion of items with a desired attribute is p = 0.25, if
a sample of 400 is taken, what is the standard deviation of the sampling distribution of
?
A) 0.0512
B) 0.0312
C) 0.0217
D) 0.0412
According to data from the Environmental Protection Agency, the average daily water
consumption for a household of four people in the United States is approximately at
least 243 gallons. (Source:
http://www.catskillcenter.org/programs/csp/H20/Lesson3/house3.htm) Suppose a state
agency plans to test this claim using an alpha level equal to 0.05 and a random sample
of 100 households with four people.
Calculate the probability of committing a Type II error if the true population mean is
230 gallons. Assume that the population standard deviation is known to be 40 gallons.
A) 0.0331
B) 0.0712
C) 0.0537
D) 0.1412

Recently a shipping company took 30 samples, each of size n = 100, of packages that it
was responsible for delivering. Out of the 3,000 total packages, 300 were delivered late.
In setting up an appropriate process control chart, what would be the correct 3-sigma
upper control limit value?
A) 0.03
B) 0.13
C) 0.19
D) 0.07
The range is an ideal measure of variation since it is not sensitive to extreme values in
the data.
Assume that 4 populations are to be compared using a Kruskal-Wallis one-way analysis
of variance. What is the critical value using a 0.05 level of significance?

A) 5.9915
B) 6.2514
C) 7.8147
D) 9.4877
An inventory of appliances contains four white washers and one black washer. If a
customer selects one at random, what is the probability that the black washer will be
selected?
A) 0.5
B) 0.4
C) 0.2
D) 0.8
For which data collection method is it most important to have a polished-looking survey
form?
A) Telephone survey
B) Written questionnaire
C) Experimental design
D) Personal interview
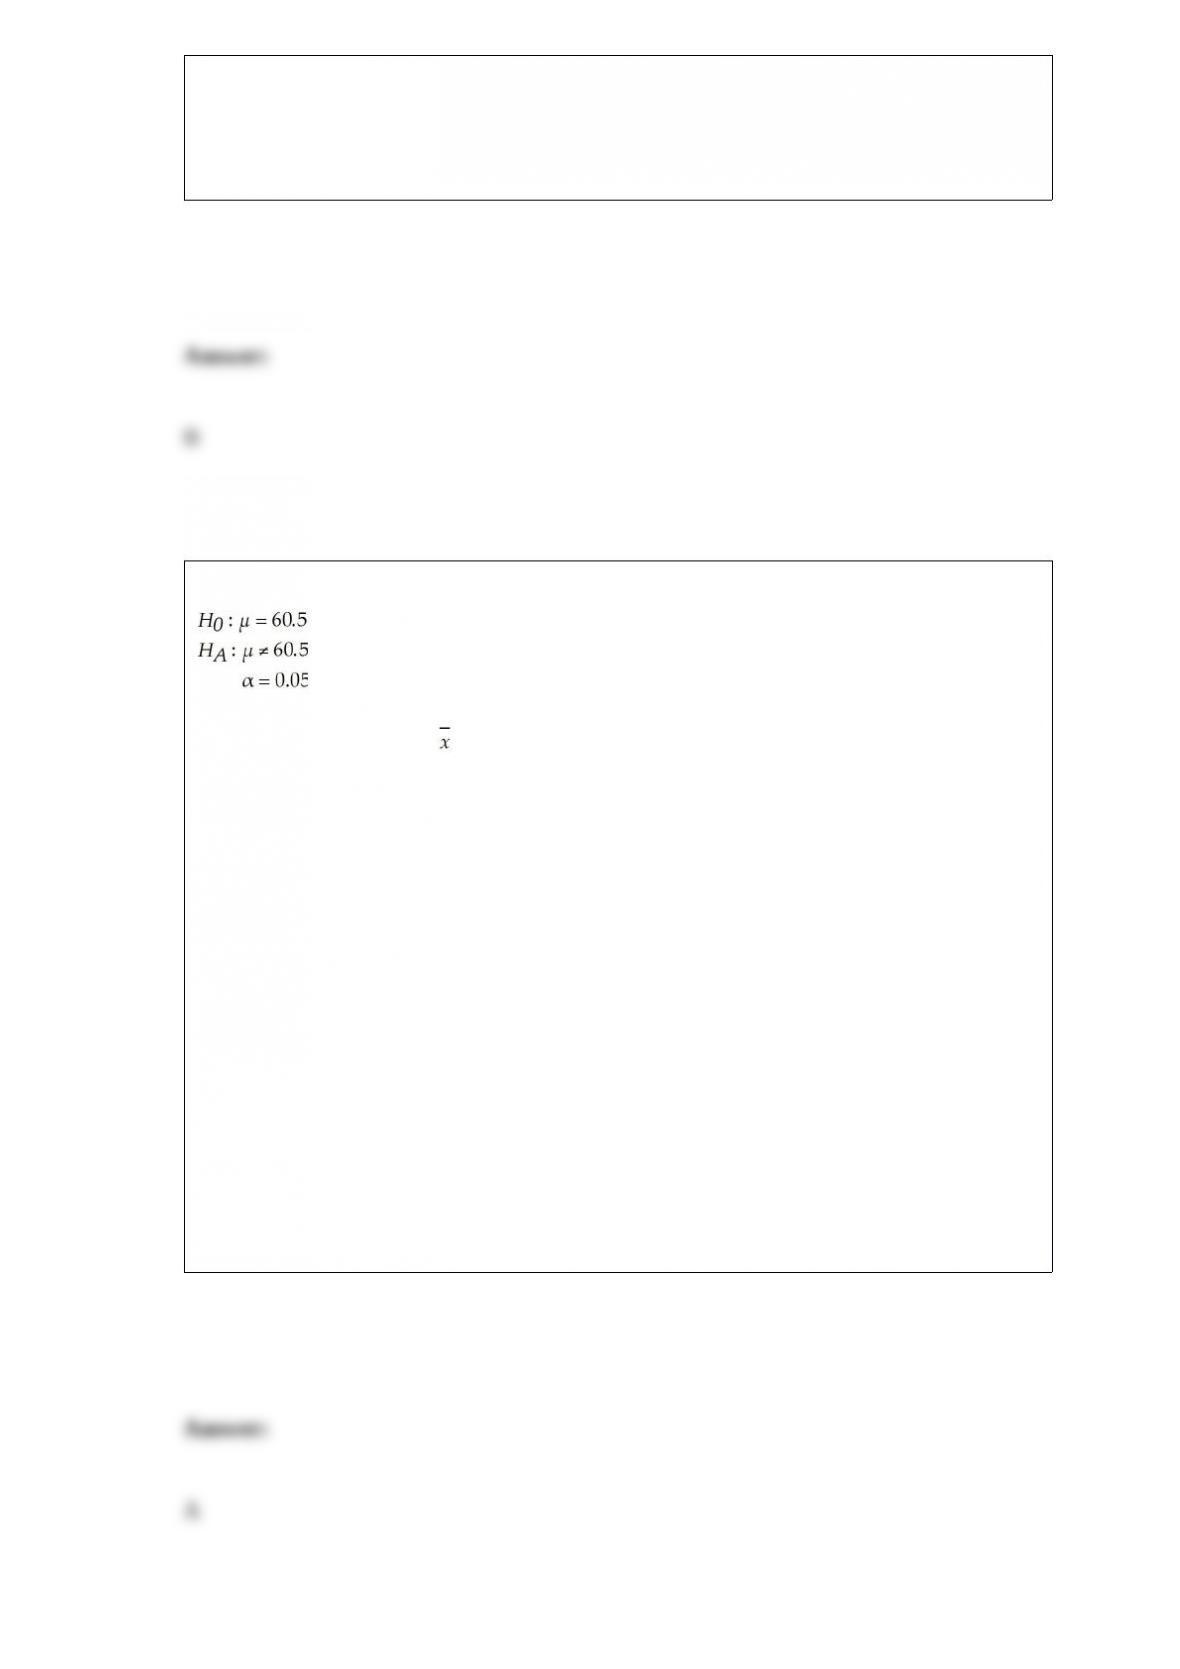
For the following hypothesis test:
With n = 15, s = 7.5, and = 62.2, state the decision rule in terms of the critical value of
the test statistic
A) This is a two-tailed test of the population mean with σ unknown. Therefore, the
decision rule is: reject the null hypothesis if the calculated value of the test statistic, t, is
less than -2.1448 or greater than 2.1448. Otherwise, do not reject.
B) This is a two-tailed test of the population mean with σ unknown. Therefore, the
decision rule is: accept the null hypothesis if the calculated value of the test statistic, t,
is less than -2.1448 or greater than 2.1448. Otherwise, do not accept.
C) This is a two-tailed test of the population mean with σ unknown. Therefore, the
decision rule is: reject the null hypothesis if the calculated value of the test statistic, t, is
less than -1.1828 or greater than 1.1828. Otherwise, do not reject.
D) This is a two-tailed test of the population mean with σ unknown. Therefore, the
decision rule is: reject the null hypothesis if the calculated value of the test statistic, t, is
less than -1.1828 or greater than 1.1828. Otherwise, do not accept.

The hypergeometric probability distribution is used rather than the binomial or the
Poisson when:
A) the sampling is performed with replacement.
B) the sampling is performed without replacement from an infinite population.
C) the sampling is performed without replacement from a finite population.
D) the sampling is performed with replacement from a finite population.
A normally distributed population has a mean of 500 and a standard deviation of 60.
Determine the probability that a random sample of size 16 selected from this population
will have a sample mean less than 475.
A) 0.3251
B) 0.7124
C) 0.0475
D) 0.0712
Which of the following statements is true in the context of a chi-square goodness-of-fit
test?
A) The degrees of freedom for determining the critical value will be the number of

categories minus 1.
B) The critical value will come from the standard normal table if the sample size
exceeds 30.
C) The null hypothesis will be rejected for a small value of the test statistic.
D) A very large test statistic will result in the null not being rejected.
If a Mann-Whitney U test was performed and U1 = 50 and U2 = 40, if the sample from
population 1 was 10, the sample size from population 2 was:
A) 10
B) 15
C) 9
D) Can’t be determined without more information.
For the following hypothesis test
With n = 100 and p = 0.66, state the calculated value of the test statistic.

A) 2.7299
B) -2.0785
C) 1.4919
D) -0.3421
When a hypothesis test is to be conducted regarding a population variance, the test
statistic will be:
A) a t-value from the t-distribution.
B) an x2 value from the chi-square distribution.
C) a z-value from the standard normal distribution.
D) a binomial distribution p value.
Dynamic random-access memory (DRAM) memory chips are made from silicon wafers
in manufacturing facilities through a very complex process called wafer fabs. The
wafers are routed through the fab machines in an order that is referred to as a recipe.
The wafers may go through the same machine several times as the chip is created. The
data file DRAM Chips contains a sample of processing times, measured in fractions of
hours, at a particular machine center for one chip recipe.
Compute the median processing time.

A) 0.31 minutes
B) 0.24 minutes
C) 0.21 minutes
D) 0.44 minutes
Most major airlines allow passengers to carry two pieces of luggage (of a certain
maximum size) onto the plane. However, their studies show that the more carry-on
baggage passengers have, the longer it takes to unload and load passengers. One
regional airline is considering changing its policy to allow only one carry-on per
passenger. Before doing so, it decided to collect some data. Specifically, a random
sample of 1,000 passengers was selected. The passengers were observed, and the
number of bags carried on the plane was noted. Out of the 1,000 passengers, 345 had
more than one bag.
Suppose the airline also noted whether the passenger was male or female. Out of the
1,000 passengers observed, 690 were males. Of this group, 280 had more than one bag.
Using this data, obtain and interpret a 95% confidence interval estimate for the
proportion of male passengers in the population who would have been affected by the
one-bag limit.
A) (0.2815, 0.5124)
B) (0.3361, 0.4712)
C) (0.3692, 0.4424)
D) (0.3814, 0.4125)
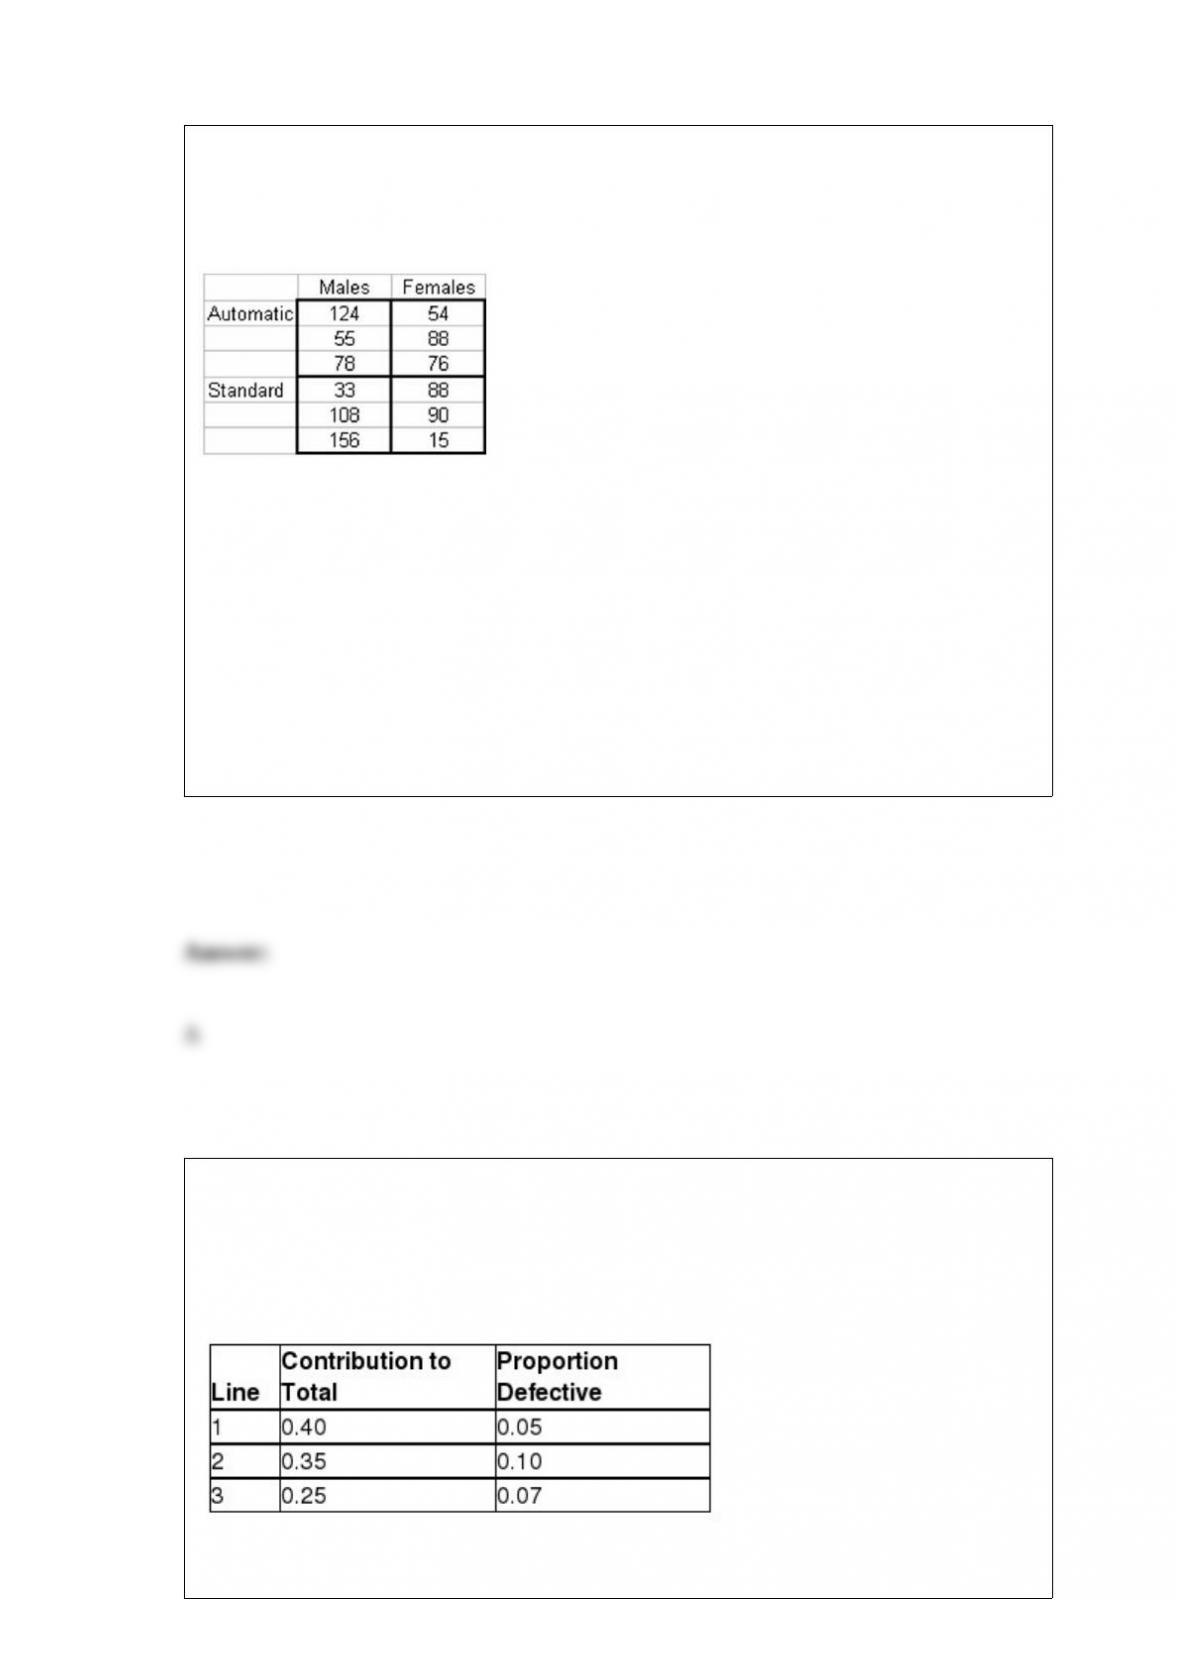
A national car rental company recently conducted a study recently in which cars with
automatic and standard transmissions (factor A-Sample) were rented to male and female
customers (factor B-Columns). Three customers in each category were randomly
selected and the miles driven per day was recorded as follows:
Based on the design of this study, how many degrees of freedom will be associated with
the mean square for factor A?
A) 1
B) 2
C) 3
D) 8
Vegetables from the summer harvest are currently being processed at Skone and
Conners Foods, Inc. The manager has found a case of cans that has not been properly
sealed. There are three lines that processed cans of this type, and the manager wants to
know which line is most likely to be responsible for this mistake. Provide the manager
this information.
A) Line 1

B) Line 2
C) Line 3
D) Cannot be determined from this information
Which of the following is not a type of commonly used process control chart?
A) x-bar chart
B) R-chart
C) p-chart
D) n-chart
A new phone answering system installed by the Ohio Power Company is capable of
handling five calls every 10 minutes. Prior to installing the new system, company
analysts determined that the incoming calls to the system are Poisson distributed with a
mean equal to two every 10 minutes. If this incoming call distribution is what the
analysts think it is, what is the probability that in a 10-minute period more calls will
arrive than the system can handle?
A) 0.174
B) 0.0812

C) 0.0166
D) 0.0233
In a recent report, it was stated that the proportion of employees who carpool to their
work is 0.14 and that the standard deviation of the sampling proportion is 0.0259.
However, the report did not indicate what the sample size was. What was the sample
size?
A) 100
B) 180
C) 460
D) Can’t be determined without more information
Dynamic random-access memory (DRAM) memory chips are made from silicon wafers
in manufacturing facilities through a very complex process called wafer fabs. The
wafers are routed through the fab machines in an order that is referred to as a recipe.
The wafers may go through the same machine several times as the chip is created. The
data file DRAM Chips contains a sample of processing times, measured in fractions of
hours, at a particular machine center for one chip recipe.
Determine what the mode processing time is.

A) 0.22
B) 0.24
C) 0.33
D) 0.34
It is assumed that the time failures for an electronic component are exponentially
distributed with a mean of 50 hours between consecutive failures. Based on this
information, what is the probability that a randomly selected part will fail in less than
10 hours?
A) About 0.82
B) About 0.20
C) About 0.33
D) About 0.18
A recent report in which a major pharmaceutical company released the results of testing
that had been done on the cholesterol reduction that people could expect if they use the
company’s new drug indicated that the Type II error probability for a given “true” mean
was 0.1250 based on the sample size of n = 64 subjects. Given this, what was the power
of the test under these same conditions? The alpha level used in the test was 0.05.
A) 0.95
B) 0.875
C) Essentially zero
D) Power would be undefined in this case since the hypothesis would be rejected.
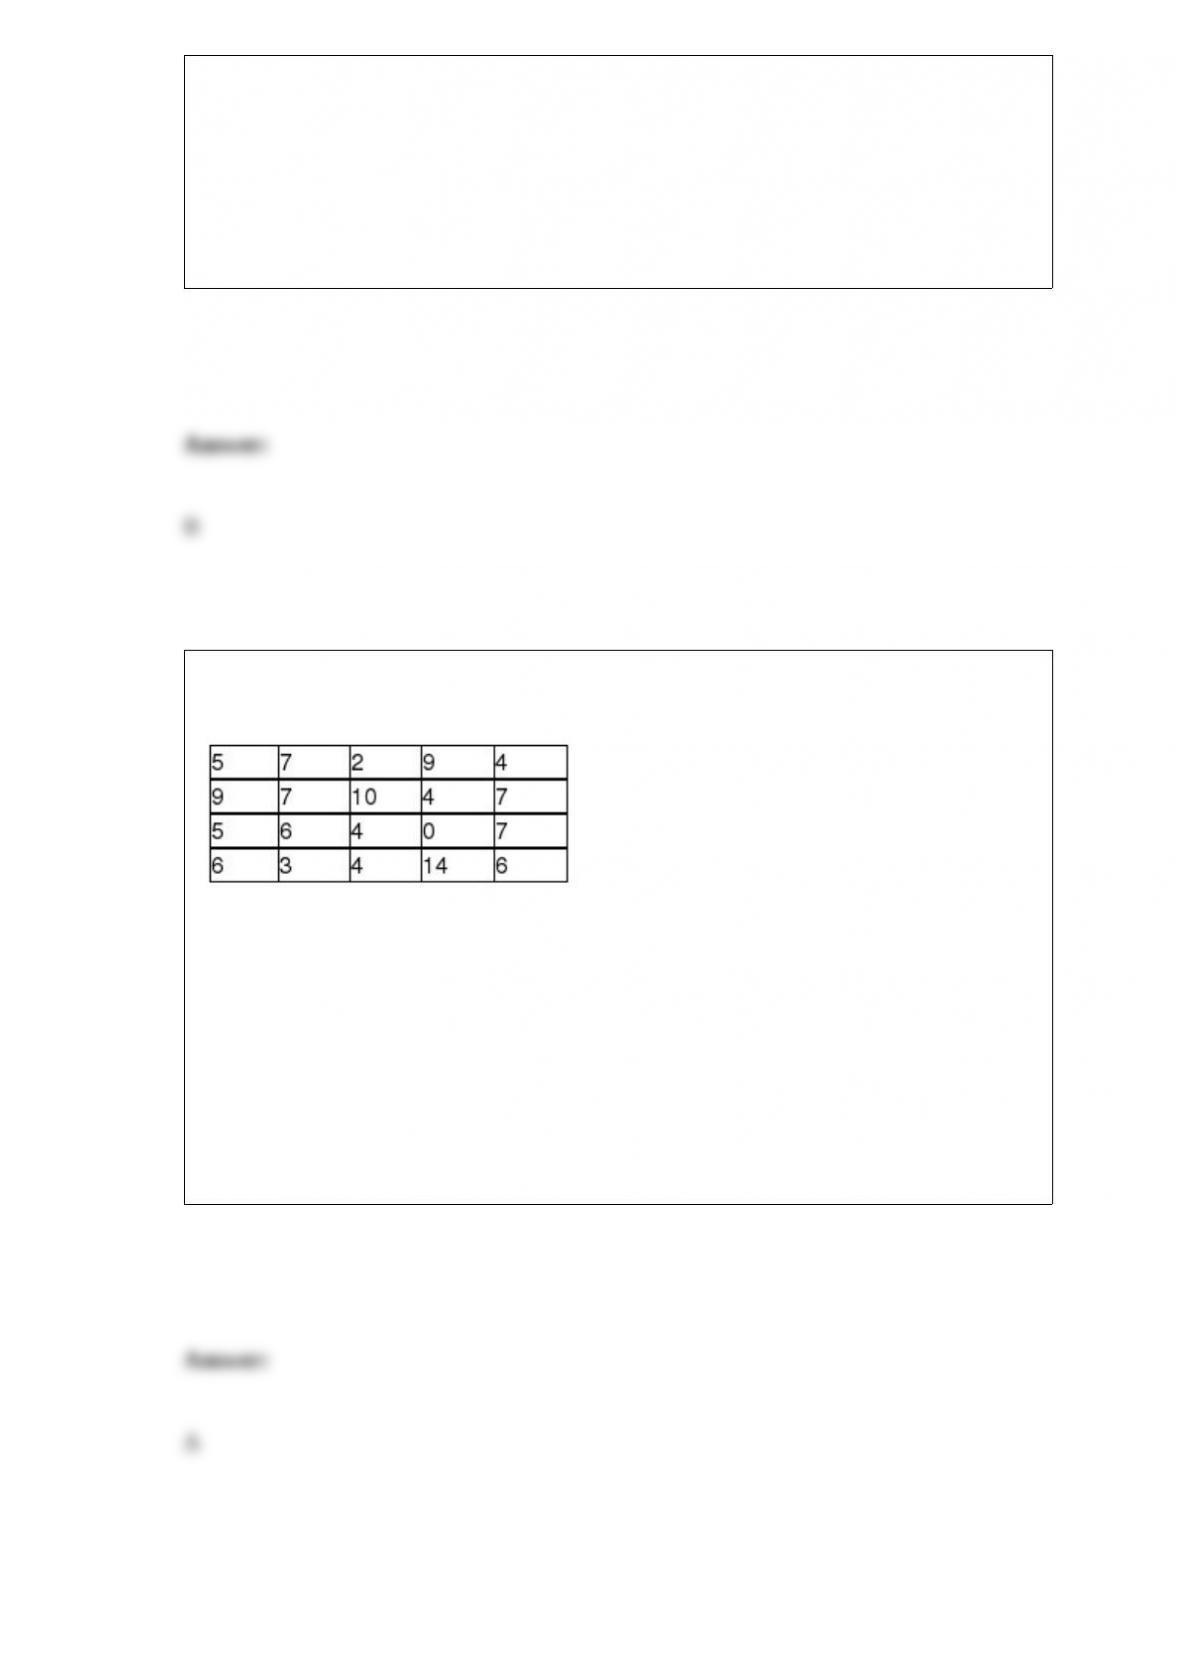
The following data reflect the number of customers who test drove new cars each day
for a sample of 20 days at the Redfield Ford Dealership.
Given these data, what is the range?
A) 14
B) 1
C) Approximately 3.08
D) 5.95