
One of the major uses of residual analysis is to test some of the assumptions underlying
regression.
Many human characteristics such as height and weight and many measurements such as
variables such as household insurance and cost per square foot of rental space are
normally distributed.
For the Poisson distribution the mean represents twice the value of the standard
deviation..
In a decision-making under risk scenario, the expected monetary value of a decision
alternative is the weighted average (using the probability of each state of nature as the
weight) of the payoffs to the decision alternative in each state of the nature.

If a 98% confidence interval for the difference in the two population means does not
contain zero, then the null hypothesis of zero difference between the two population
means cannot be rejected at a 0.02 level of significance.
In a decision-making under uncertainty scenario, the decision maker chooses the
decision alternative that has the minimum expected (i.e., probability-weighted) payoff
among all the available alternatives.
If the correlation coefficient between two variables is -1, it means that the two variables
are not related.

The range of admissible values for the coefficient of determination is −1 to +1.
Probability is used to develop knowledge of the fundamental mathematical tools for
quantitatively assessing risk.
In a chi-square goodness-of-fit test, theoretical frequencies are also called expected
frequencies.

A scatter plot shows how the numbers in a data set are scattered around their average.
In the simple regression model, y = 21 − 5x, if the coefficient of determination is 0.81,
we can say that the coefficient of correlation between y and x is 0.90.
When conducting a hypothesis test is on a population proportion the value of q is
defined as p + 1.
The statistical methods of analysis of variance assume equal sample means.

The Tukey-Kramer procedure is based on construction of confidence intervals for each
pair of treatment means at a time.
In a decision-making under uncertainty scenario, the decision maker attempts to
develop a strategy based on payoffs since virtually no information is available about
which state of nature will occur.
The Mann-Whitney U test is a generalization of the two sample t-test under the
underlying assumptions of equality of variances.

If the populations are normally distributed but the population variances are unknown
the z-statistic can be used as the basis for statistical inferences about the difference in
two population means using two independent random samples.
Assigning probabilities to uncertain events based on one’s beliefs or intuitions is called
classical method.
The coefficient of determination is the proportion of variability of the dependent
variable (y) accounted for or explained by the independent variable (x).

One of the assumptions of simple regression analysis is that the error terms are
exponentially distributed
The proportion of variability of the dependent variable (y) accounted for or explained
by the independent variable (x) is called the coefficient of correlation.
A schematic representation of all the activities and interactions that occur in a process is
called a flowchart.
The probability of committing a Type I error is called the power of the test.

The directory or map from which a sample is taken is called the census.
Time-series data are data gathered on a desired characteristic at a particular point in
time.
If a qualitative variable has c categories, then c dummy variables must be included in
the regression model, one for each category.

Regression output from Excel software directly shows the regression
equation.
The two major categories of sampling methods are proportionate and disproportionate
sampling.
In decision-making under risk, the expected monetary value without information is the
largest of the expected monetary values for the various decision alternatives.
If the effect of an independent variable (e.g., square footage) on a dependent variable
(e.g., price) is affected by different ranges of values for a second independent variable

(e.g., age ), the two independent variables are said to interact.
Elwin Osbourne, CIO at GFS, Inc., is studying employee use of GFS e-mail for
non-business communications. He plans to use a 98% confidence interval estimate of
the proportion of e-mail messages that are non-business; he will accept a 0.05 error.
Previous studies indicate that approximately 30% of employee e-mail is not business
related. Elwin should sample _______ e-mail messages.
a) 323
b) 12
c) 457
d) 14
e) 100
Suppose you are testing the null hypothesis that a population mean is greater than or
equal to 60, against the alternative hypothesis that the population mean is less than 60.
The sample size is 64 and = .05. If the sample mean is 58 and the population standard
deviation is 16, the observed zvalue is _______.
a) -1
b) 1
c) -8
d) 8

e) 58
The total of the squared residuals is called the _______.
a) coefficient of determination
b) sum of squares of error
c) standard error of the estimate
d) R-squared
e) coefficient of correlation
A variable contains five categories. It is expected that data are uniformly distributed
across these five categories. To test this, a sample of observed data is gathered on this
variable resulting in frequencies of 27, 30, 29, 21, and 24. Using
= .01, the degrees of
freedom for this test are _______.
a) 5
b) 4
c) 3
d) 2
e) 1
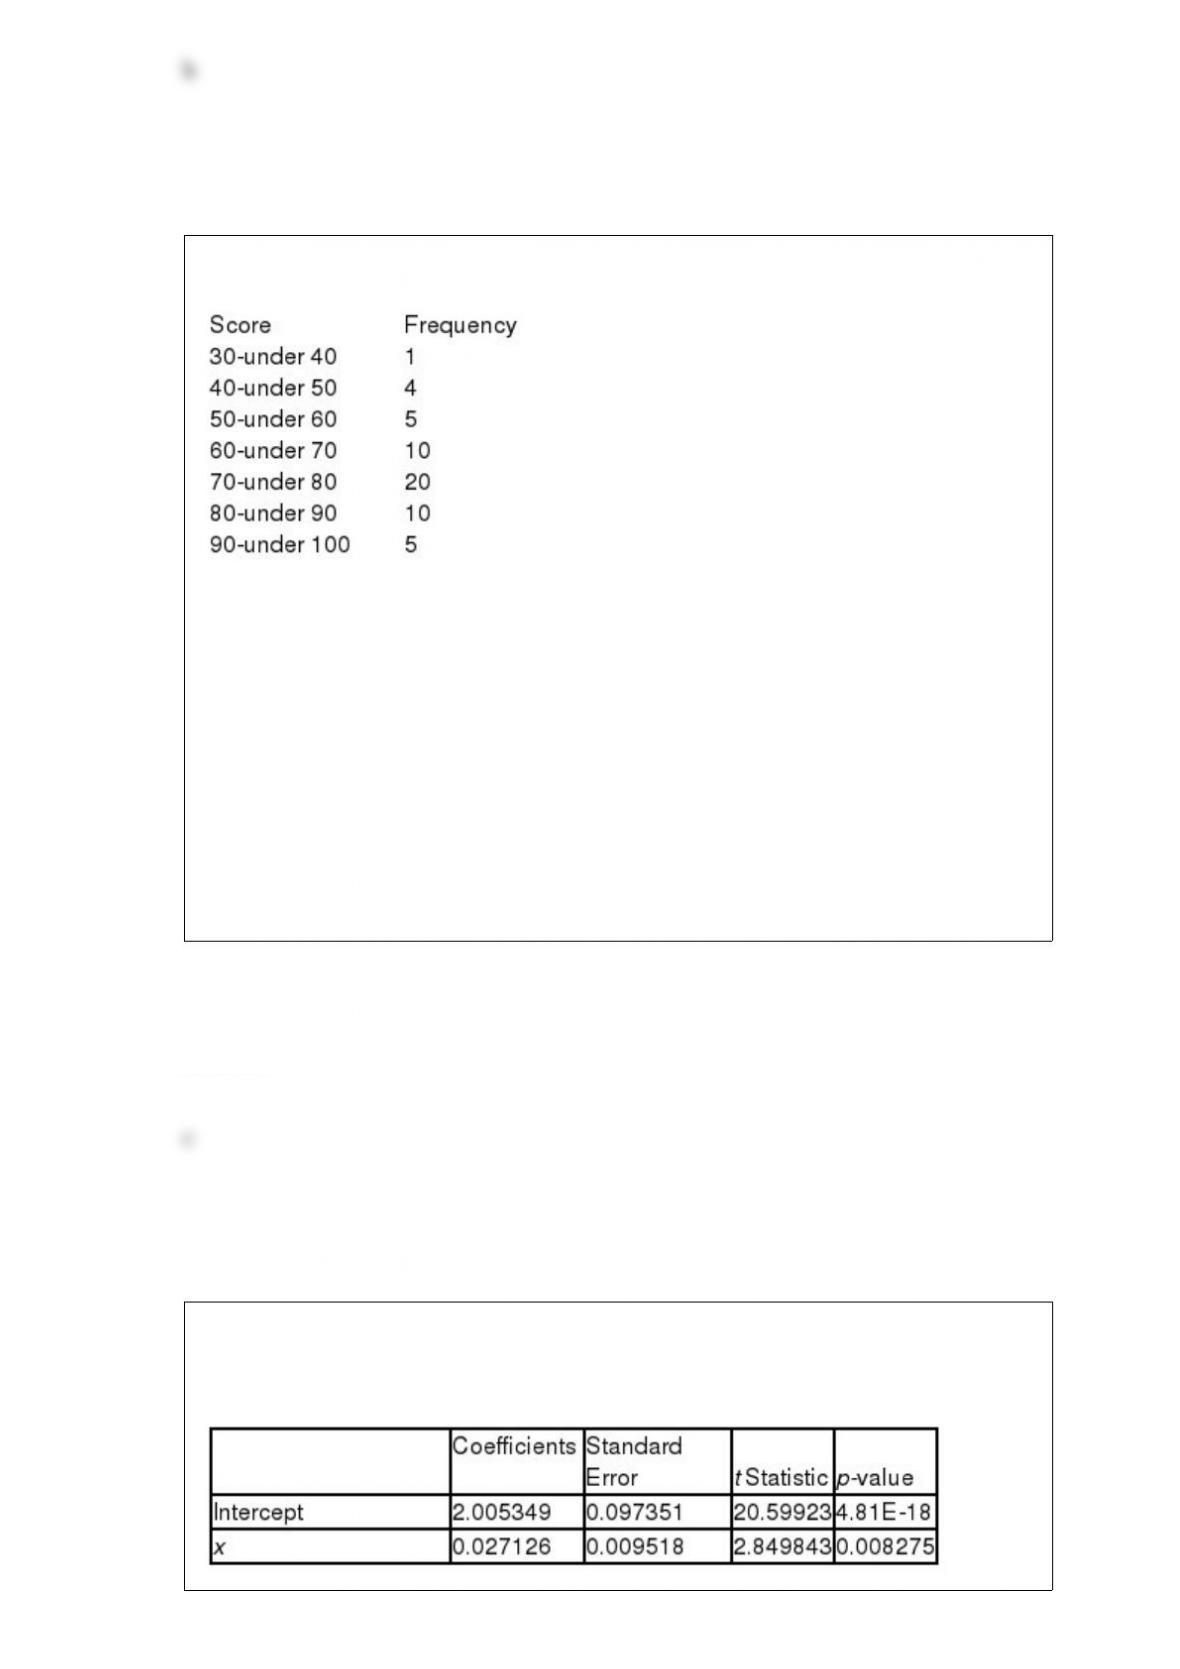
An instructor made a frequency table of the scores his students got on a test
The midpoint of the last class interval is _________.
a) 90
b) 5
c) 95
d) 100
e) 50
After a transformation of the y-variable values into log y, and performing a regression
analysis produced the following tables.

For x1= 10, the predicted value of y is ____________.
a) 155.79
b) 1.25
c) 2.42
d) 189.06
e) 18.90
Albert Abbasi, VP of Operations at Ingleside International Bank, is evaluating the
service level provided to walk-in customers. Accordingly, he plans a sample of waiting
times for walk-in customers. If the population of waiting times has a mean of 15
minutes and a standard deviation of 4 minutes, the probability that Albert’s sample of 64
will have a mean between 13.5 and 16.5 minutes is ________.
a) 0.9974
b) 0.4987
c) 0.9772
d) 0.4772
e) 0.5000

Ray Crofford is evaluating investment alternatives to invest $100,000 which he
inherited from his grandfather. His investment advisor has identified four alternatives
and constructed the following payoff table which shows expected profits (in $10,000’s)
for various market conditions.
If Ray uses the Hurwicz criterion with alpha = 0.1, the appropriate choice is ______.
a) T-Bills
b) Stocks
c) Bonds
d) Mixture
e) None
The local oil changing business is very busy on Saturday mornings and is considering
expanding. A national study of similar businesses reported the mean number of
customers waiting to have their oil changed on Saturday morning is 3.6. Suppose the
local oil changing business owner, wants to perform a hypothesis test. The null
hypothesis is the population mean is 3.6 and the alternative hypothesis that the
population mean is not equal to 3.6. The owner takes a random sample of 16 Saturday
mornings during the past year and determines the sample mean is 4.2 and the sample
standard deviation is 1.4. It can be assumed that the population is normally distributed.
The observed “t” value for this problem is _______.
a) 0.05

b) 0.43
c) 1.71
d) 1.33
e) 0.71
A suburban realtor is studying commuter time in the Houston metropolitan area. She
has been told the average weekday travel time from a southern suburb at 8:00am is 45
minutes. For five months she counts the number of days that it takes her more than 45
minutes to arrive in downtown when she leaves her house at 8:00am. She expects the
data are uniformly distributed across the five months. Her sample of observed data
yields the following frequencies 9 days, 15 days, 8 days, 11 days, 12 days. Using
= .
01, the critical chi-square value is _______.
a) 13.277
b) 15.086
c) 7.779
d) 11.070
e) 2.727
Inspection of the following table of correlation coefficients for variables in a multiple
regression analysis reveals potential multicollinearity with variables ___________.
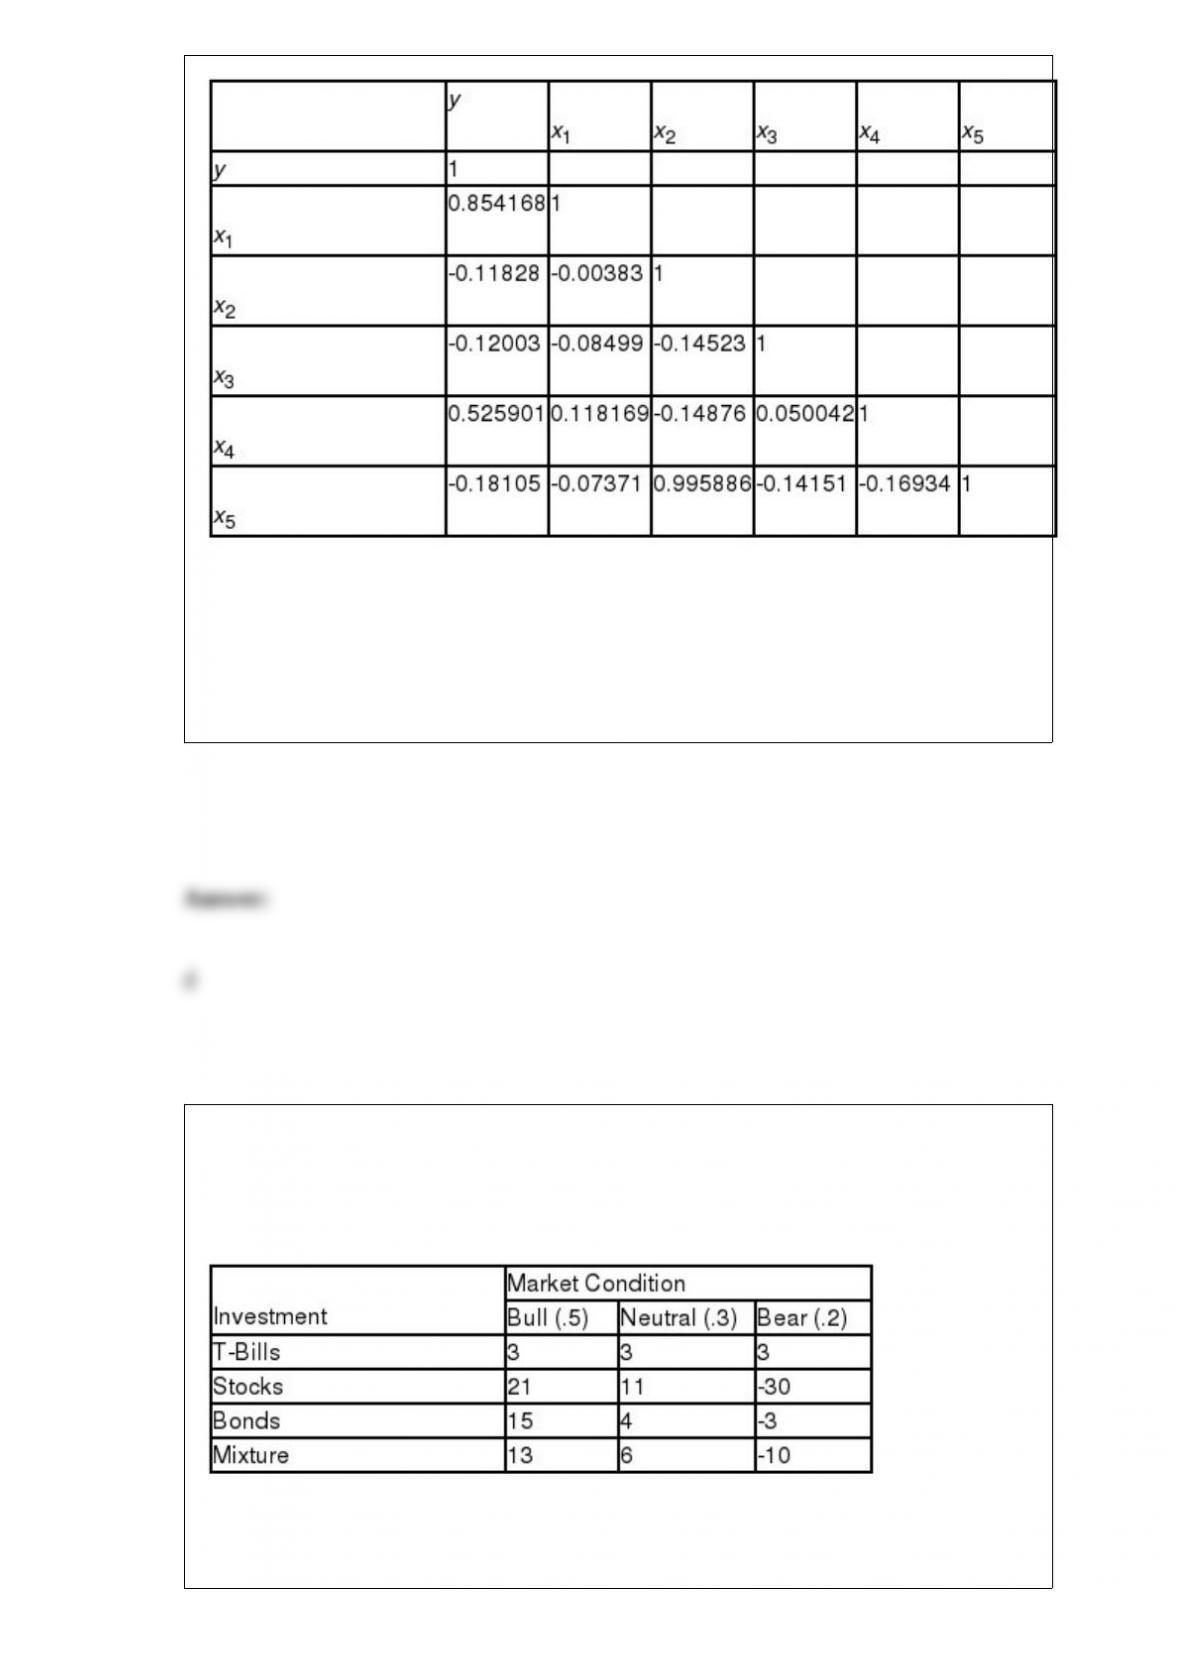
a) x1and x2
b) x1and x5
c) x3and x4
d) x2and x5
e) x3and x5
Ray Crofford is evaluating investment alternatives for the $100,000 which he inherited
from his grandfather. His investment advisor has identified four alternatives and
constructed the following table which shows expected profits (in $10,000’s) for various
market conditions and their probabilities.
The EMV of investing in Bonds is ________.

a) $30,000
b) $63,000
c) $78,000
d) $81,000
e) $100,000
If x, the time (in minutes) to complete an oil change job at certain auto service station,
is uniformly distributed over the interval 20 to 30, inclusively (20 x 30), then the mean
of this distribution is __________________.
a) 50
b) 25
c) 10
d) 15
e) 5
Dorothy Little purchased a mailing list of 2,000 names and addresses for her mail order
business, but after scanning the list she doubts the authenticity of the list. She randomly
selects five names from the list for validation. If 40% of the names on the list are
non-authentic, and x is the number of non-authentic names in her sample, P(x>0) is
______________.
a) 0.2172

b) 0.9533
c) 0.1846
d) 0.9222
e) 1.0000
The average starting salary for graduates at a university is $33,000 with a standard
deviation of $2,000. If a histogram of the data shows that it takes on a mound shape, the
empirical rule says that approximately 68% of the graduates would have a starting
salary between _______.
a) 29,000 and 37,000
b) 27,000 and 39,000
c) 25,000 and 41,000
d) 29,000 and 37,000
e) 21,000 and 29,000
A chi-square goodness of fit test is to be performed to see if data fit the Poisson
distribution. There are 6 categories, and lambda must be estimated. How many degrees

of freedom should be used?
a) 6
b) 5
c) 4
d) 3
e) 2
Let F be the event that a student is enrolled in a finance course, and let S be the event
that a student is enrolled in a statistics course. It is known that 40% of all students are
enrolled in a finance course and 35% of all students are enrolled in statistics. Included
in these numbers are 15% who are enrolled in both statistics and finance. A student is
randomly selected, and it is found that the student is enrolled in finance. What is the
probability that this student is also enrolled in statistics?
a) 0.15
b) 0.75
c) 0.375
d) 0.50
e) 0.80
Maureen McIlvoy, owner and CEO of a mail order business for wind surfing equipment
and supplies, is reviewing the order filling operations at her warehouses. Her goal is

100% of orders shipped within 24 hours. In previous years, neither warehouse has
achieved the goal, but the East Coast Warehouse has consistently out-performed the
West Coast Warehouse. Her staff randomly selected 200 orders from the West Coast
Warehouse (population 1) and 400 orders from the East Coast Warehouse (population
2), and reports that 190 of the West Coast Orders were shipped within 24 hours, and the
East Coast Warehouse shipped 372 orders within 24 hours. Maureen’s alternative
hypothesis is _______.
a) p1” p20
b) 1– 2> 0
c) p1” p2> 0
d) 1– 20
e) 1– 2≥0
Large correlations between two or more independent variables in a multiple regression
model could result in the problem of ________.
a) multicollinearity
b) autocorrelation
c) partial correlation
d) rank correlation
e) non-normality
Catherine Chao, Director of Marketing Research, is evaluating consumer acceptance of
alternative toothpaste packages. She wonders whether acceptance is influenced by

children in the household. Her staff prepared the following contingency table from a
random sample of 100 households.
Using
= .05, the appropriate decision is ______________.
a) reject the null hypothesis and conclude the two variables are not independent
b) do not reject the null hypothesis and conclude the two variables are not independent
c) reject the null hypothesis and conclude the two variables are independent
d) do not reject the null hypothesis and conclude the two variables are independent
e) do nothing
An analysis of personal loans at a local bank revealed the following facts: 10% of all
personal loans are in default (D), 90% of all personal loans are not in default (D΄), 20%
of those in default are homeowners (H | D), and 70% of those not in default are
homeowners (H | D΄). If a personal loan is selected at random, P (D | H) =
___________.
a) 0.03
b) 0.63
c) 0.02
d) 0.18
e) 0.78
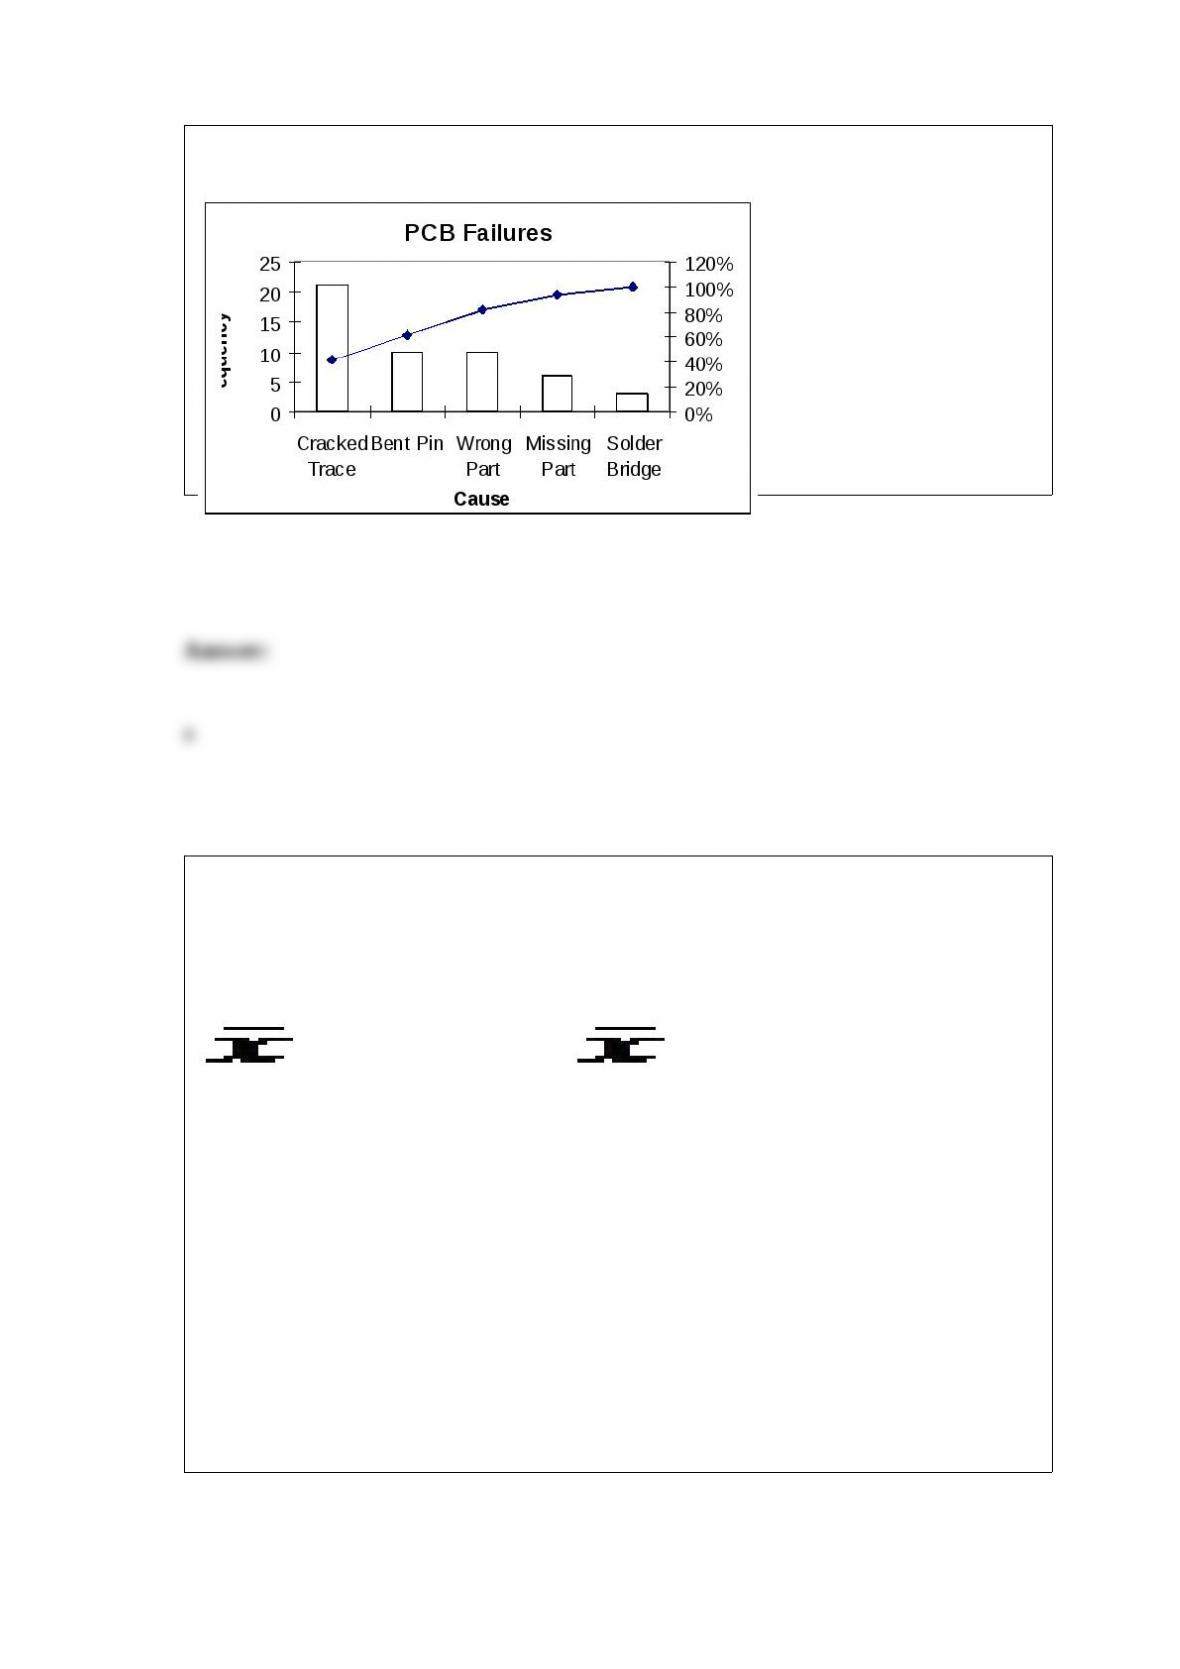
According to the following graphic, the most common cause of PCB Failures is a
_____________.
a) Cracked Trace
b) Bent Pin
c) Missing Part
d) Solder Bridge
e) Wrong Part
Golf course designer Roberto Langabeer is evaluating two sites, Palmetto Dunes and
Ocean Greens, for his next golf course. He wants to prove that Palmetto Dunes
residents (population 1) play golf more often than Ocean Greens residents (population
2). Roberto commissions a market survey to test this hypothesis. The market researcher
used a random sample of individuals from each suburb, and reported the following:
1= 16 times per month and 2= 14 times per month. Assume that
1= 4 and 2= 3. With a= .01, the appropriate decision is _____________.
a) do nothing
b) reject the null hypothesis s1< s2
c) accept the alternate hypothesis 1– m2> 0
d) reject the alternate hypothesis n1= n2= 64
e) do not reject the null hypothesis 1– 2= 0

Jessica Salas, president of Salas Products, is reviewing the warranty policy for her
company’s new model of automobile batteries. Life tests performed on a sample of 100
batteries indicated: (1) an average life of 75 months, (2) a standard deviation of 5
months, and (3) a bell shaped battery life distribution. Approximately 99.7% of the
batteries will last between ________________.
a) 70 and 80 months
b) 60 and 90 months
c) 65 and 85 months
d) 55 and 95 months
e) 50 and 100 months
Hope Hernandez is the new regional Vice President for a large gasoline station chain.
She wants a regression model to predict sales in the convenience stores. Her data set
includes two qualitative variables: the gasoline station location (inner city, freeway, and
suburbs), and curb appeal of the convenience store (low, medium, and high). The
number of dummy variables needed for Hope’s regression model is ______.
a) 2
b) 4
c) 6
d) 8
e) 9

A cost accountant is developing a regression model to predict the total cost of
producing a batch of printed circuit boards as a linear function of batch size (the
number of boards produced in one lot or batch), production plant (Kingsland, and
Yorktown), and production shift (day, and evening). In this model, “shift” is ______.
a) a response variable
b) an independent variable
c) a quantitative variable
d) a dependent variable
e) a constant
Cindy Ho, VP of Finance at Discrete Components, Inc. (DCI), theorizes that the
discount level offered to credit customers affects the average collection period on credit
sales. Accordingly, she has designed an experiment to test her theory using four sales
discount rates (0%, 2%, 4%, and 6%) by randomly assigning five customers to each
sales discount rate. An analysis of Cindy’s data produced the following ANOVA table.
Using
= 0.01, the observed F value is _________.
a) 6.2102
b) 0.1610
c) 0.1875
d) 5.3333
e) 4.9873

A researcher is estimating the average difference between two population means based
on matched”pairs samples. She gathers data on each pair in the study resulting in:
Assume that the data are normally distributed in the population. To obtain a 90%
confidence interval, the table tvalue would be _______.
a) 1.86
b) 1.397
c) 1.533
d) 2.132
e) 3.346
A completely randomized design has been analyzed by using a one-way ANOVA. There
are three treatment groups in the design, and each sample size is four. The mean for
group 1 is 25.00 and for group 3 it is 27.50. MSE is 3.19. Using α=0.05 there is a
significant difference between these two groups.

Suppose that 3% of all TVs made by some Company in 2012 are defective. If 2 of these
TVs are randomly selected what is the probability that both are defective?
a) 0.0009
b) 0.0025
c) 0.0900
d) 0.0475
e) 0.19
Suppose the owners of a new bed and breakfast establishment are interested in
conducting an experiment to determine effective advertisement strategies for increasing
the number of reservations. The bed and breakfast owners intend to rotate
advertisements for 12 weeks between a travel website, a travel magazine and a local
billboard. Customers making reservations will be asked if they saw the advertisement.
In this experiment, the dependent variable is ________________.
a. advertisement venue
b. bed and breakfast establishment
c. travel website
d. number of reservations
e. number of customer calls
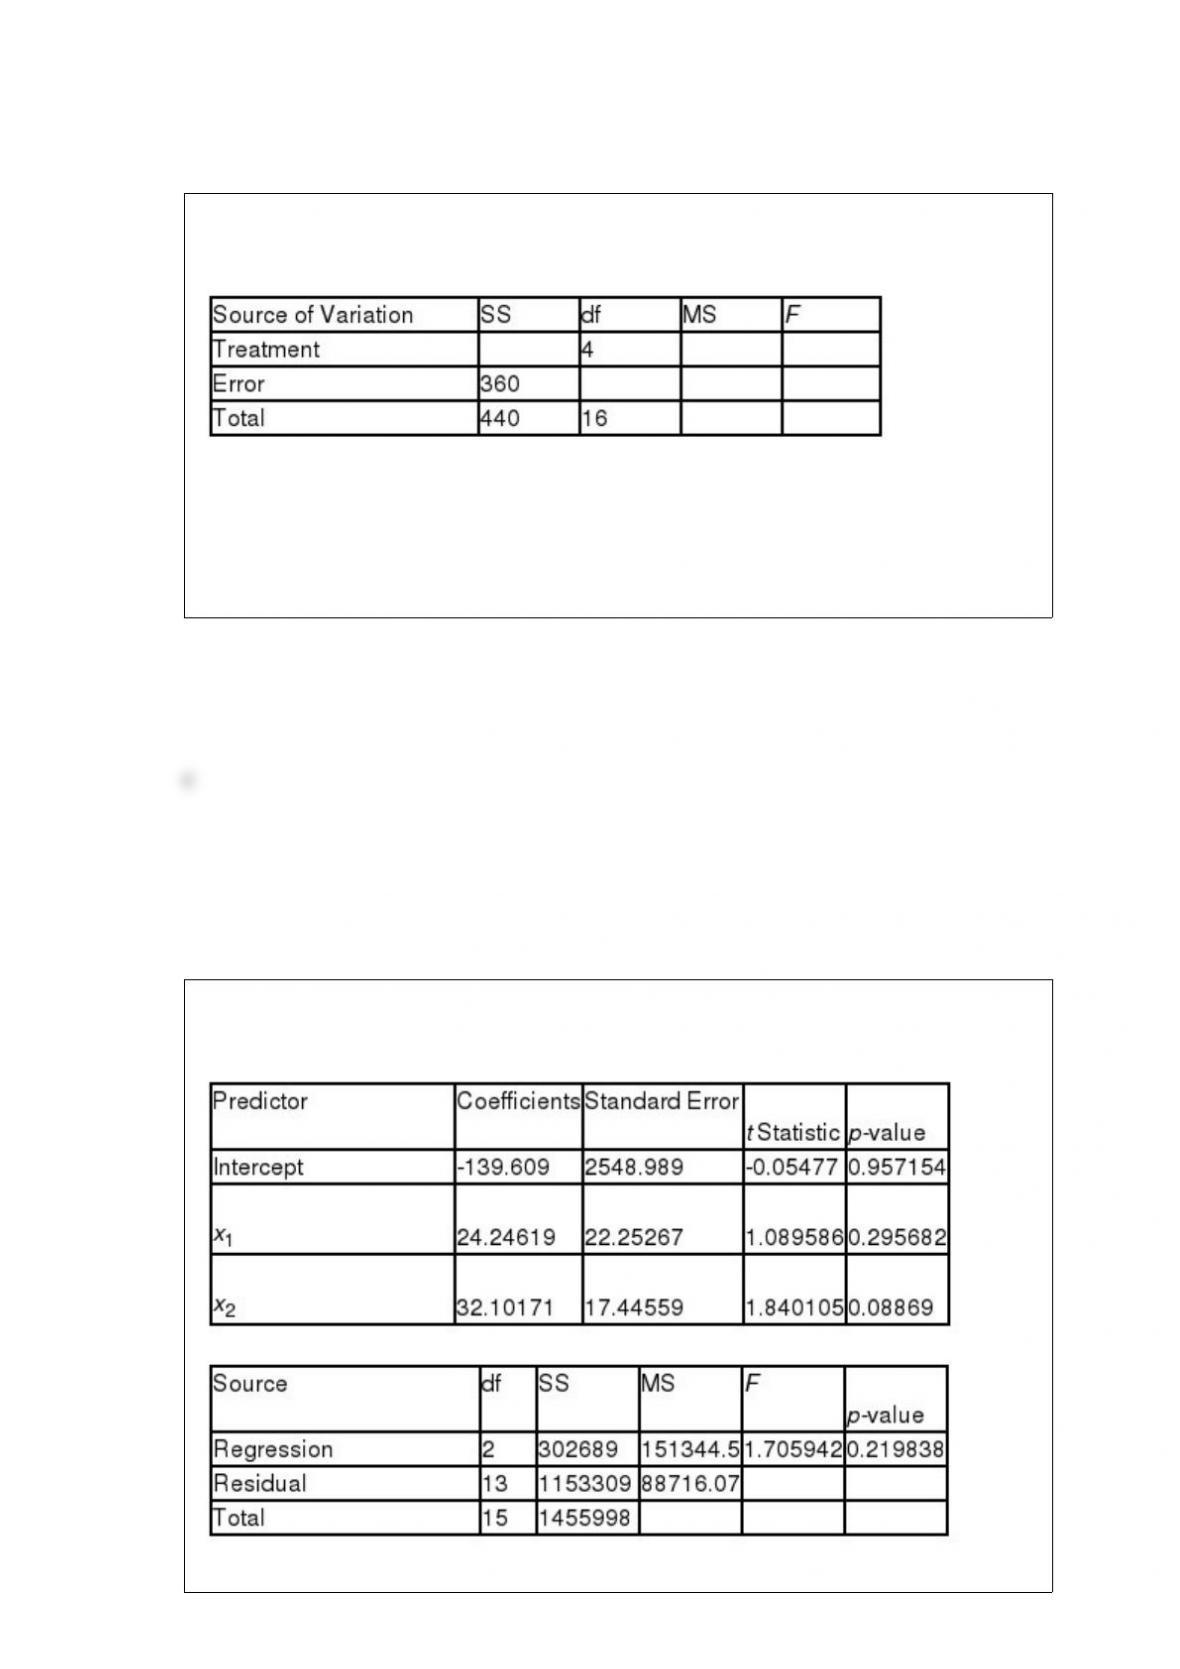
For the following ANOVA table, the dfErrorvalue is ___________.
a) 4
b) 20
c) 12
d) 64
e) 16
A multiple regression analysis produced the following tables.
The sample size for this analysis is ____________.
a) 17
b) 13
c) 16
d) 11
e) 15
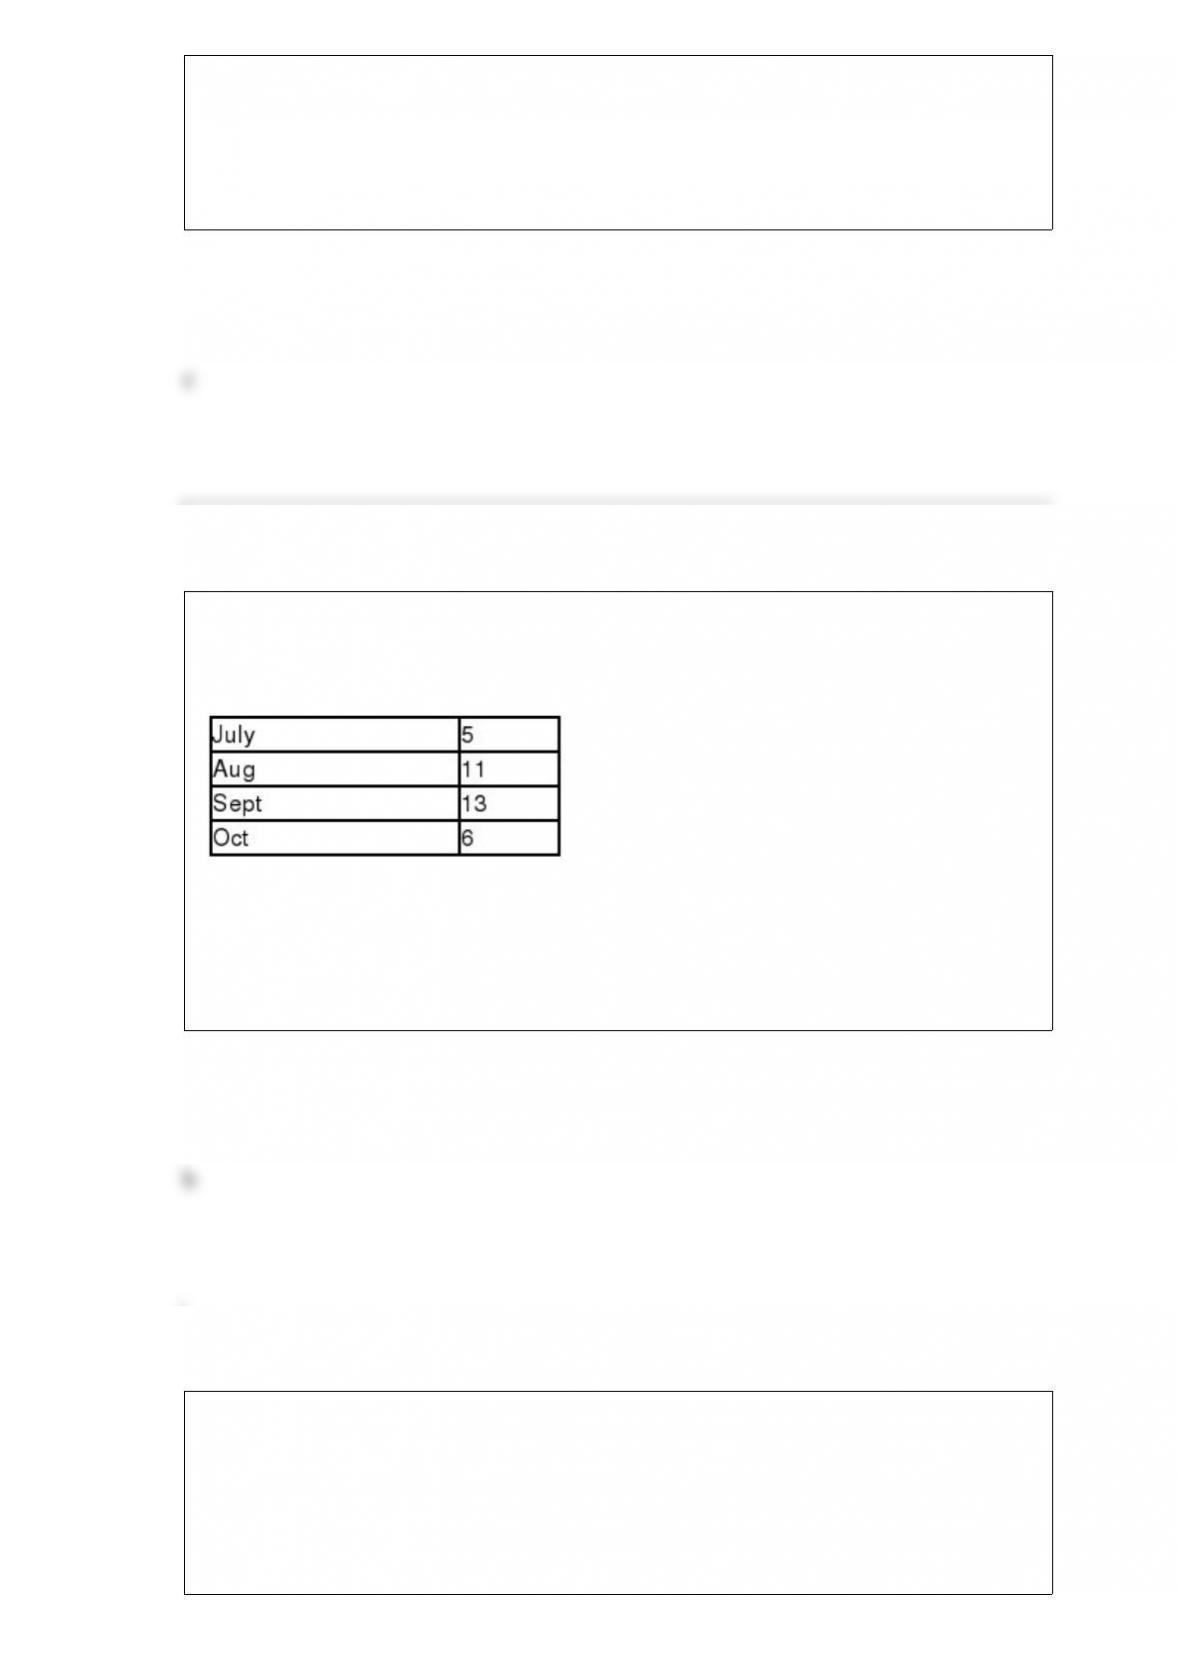
Using a three-month moving average, the forecast value for November in the following
time series is ____________.
a) 11.60
b) 10.00
c) 9.67
d) 8.60
e) 6.00
The multiple regression formulas used to estimate the regression coefficients are
designed to ________________.
a) minimize the total sum of squares (SST)
b) minimize the sum of squares of error (SSE)
c) maximize the standard error of the estimate

d) maximize the p-value for the calculated F value
e) minimize the mean error