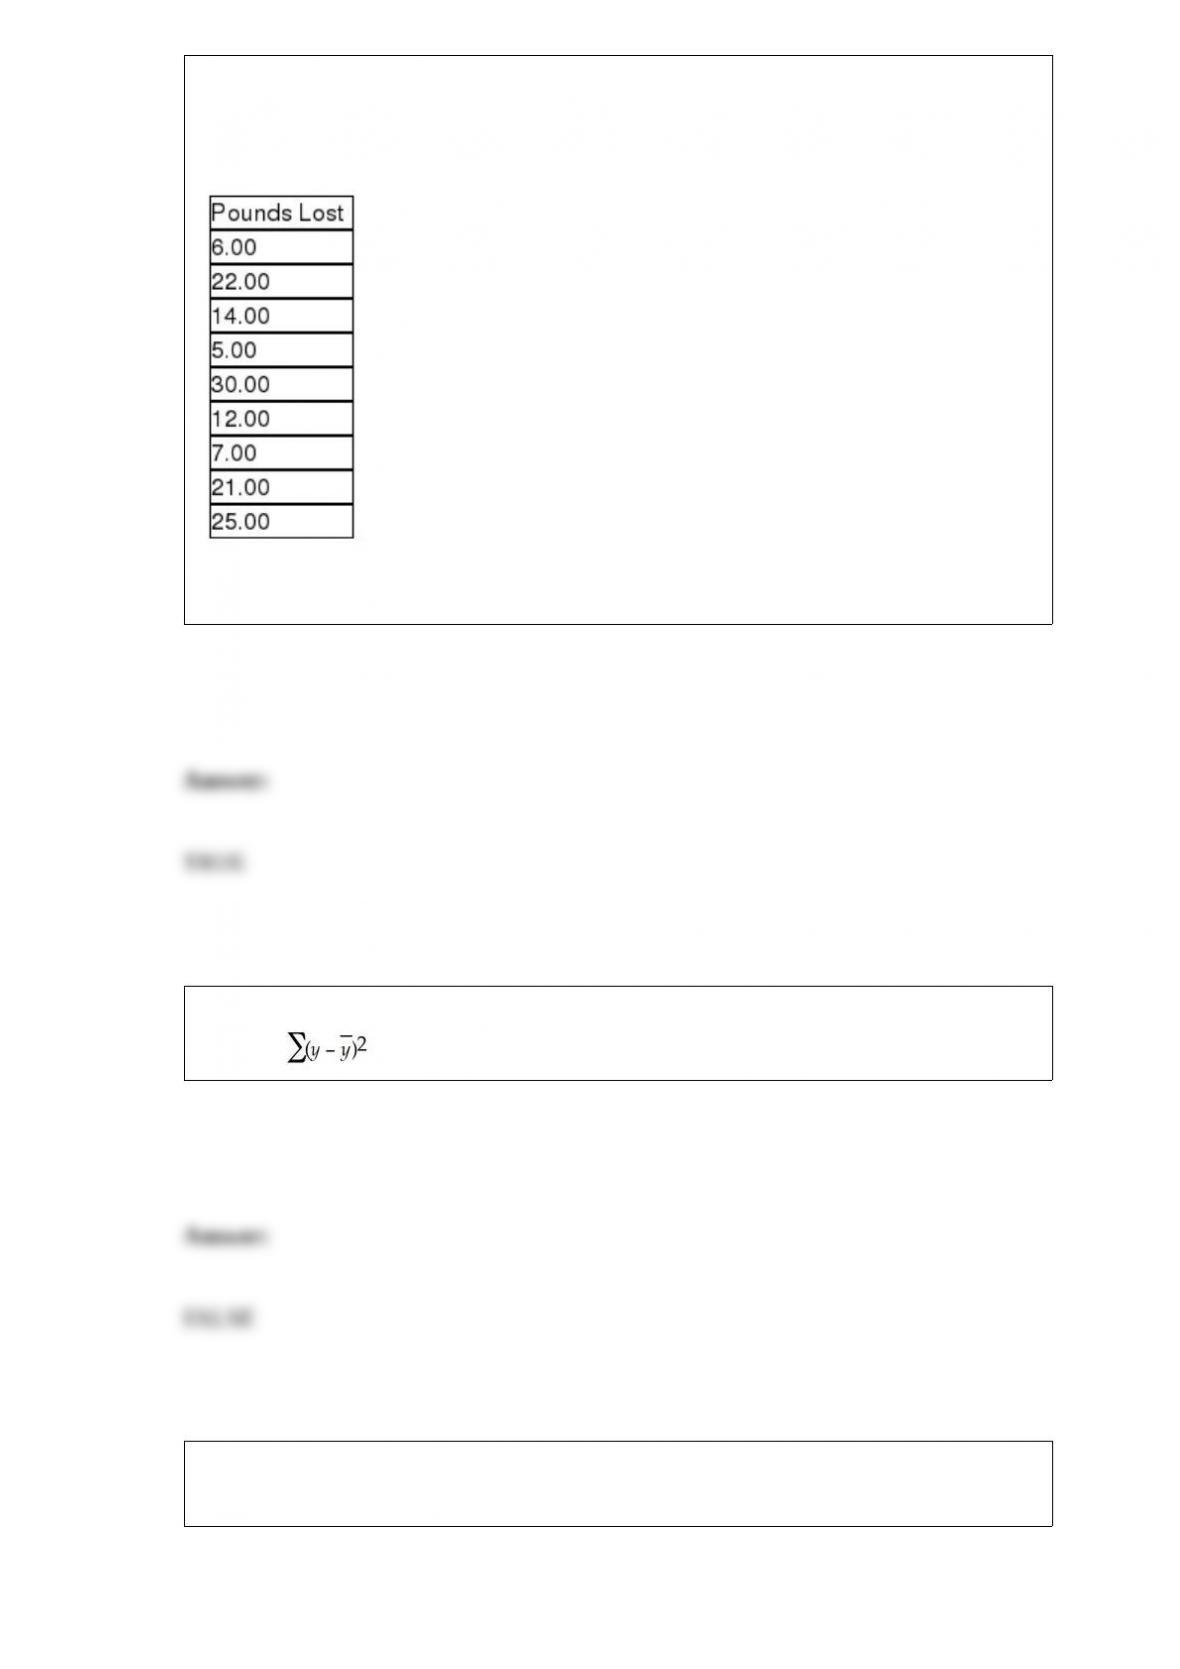
Managers for a company that produces a weight loss product claim that the median
weight lost over six weeks for people who use this product will be at least 20 pounds.
The following data were collected from a sample of nine people who used the product.
Based on these data, the test statistic is W = 12.
In a multiple regression model, the regression coefficients are calculated such that the
quantity, , is minimized.
For a given sample size and a given confidence level, the closer p is to 1.0, the greater
the margin of error will be.

A sample is selected from a population in cases where selecting data from the entire
population is either very difficult or very expensive.
It is possible for an interviewer to interject bias into the data collection project by the
way he or she asks the questions.
If a contingency analysis test performed with a 4 6 design results in a test statistic value
of 18.72, and if alpha = .05, the null hypothesis that the row and column variable are
independent should be rejected.
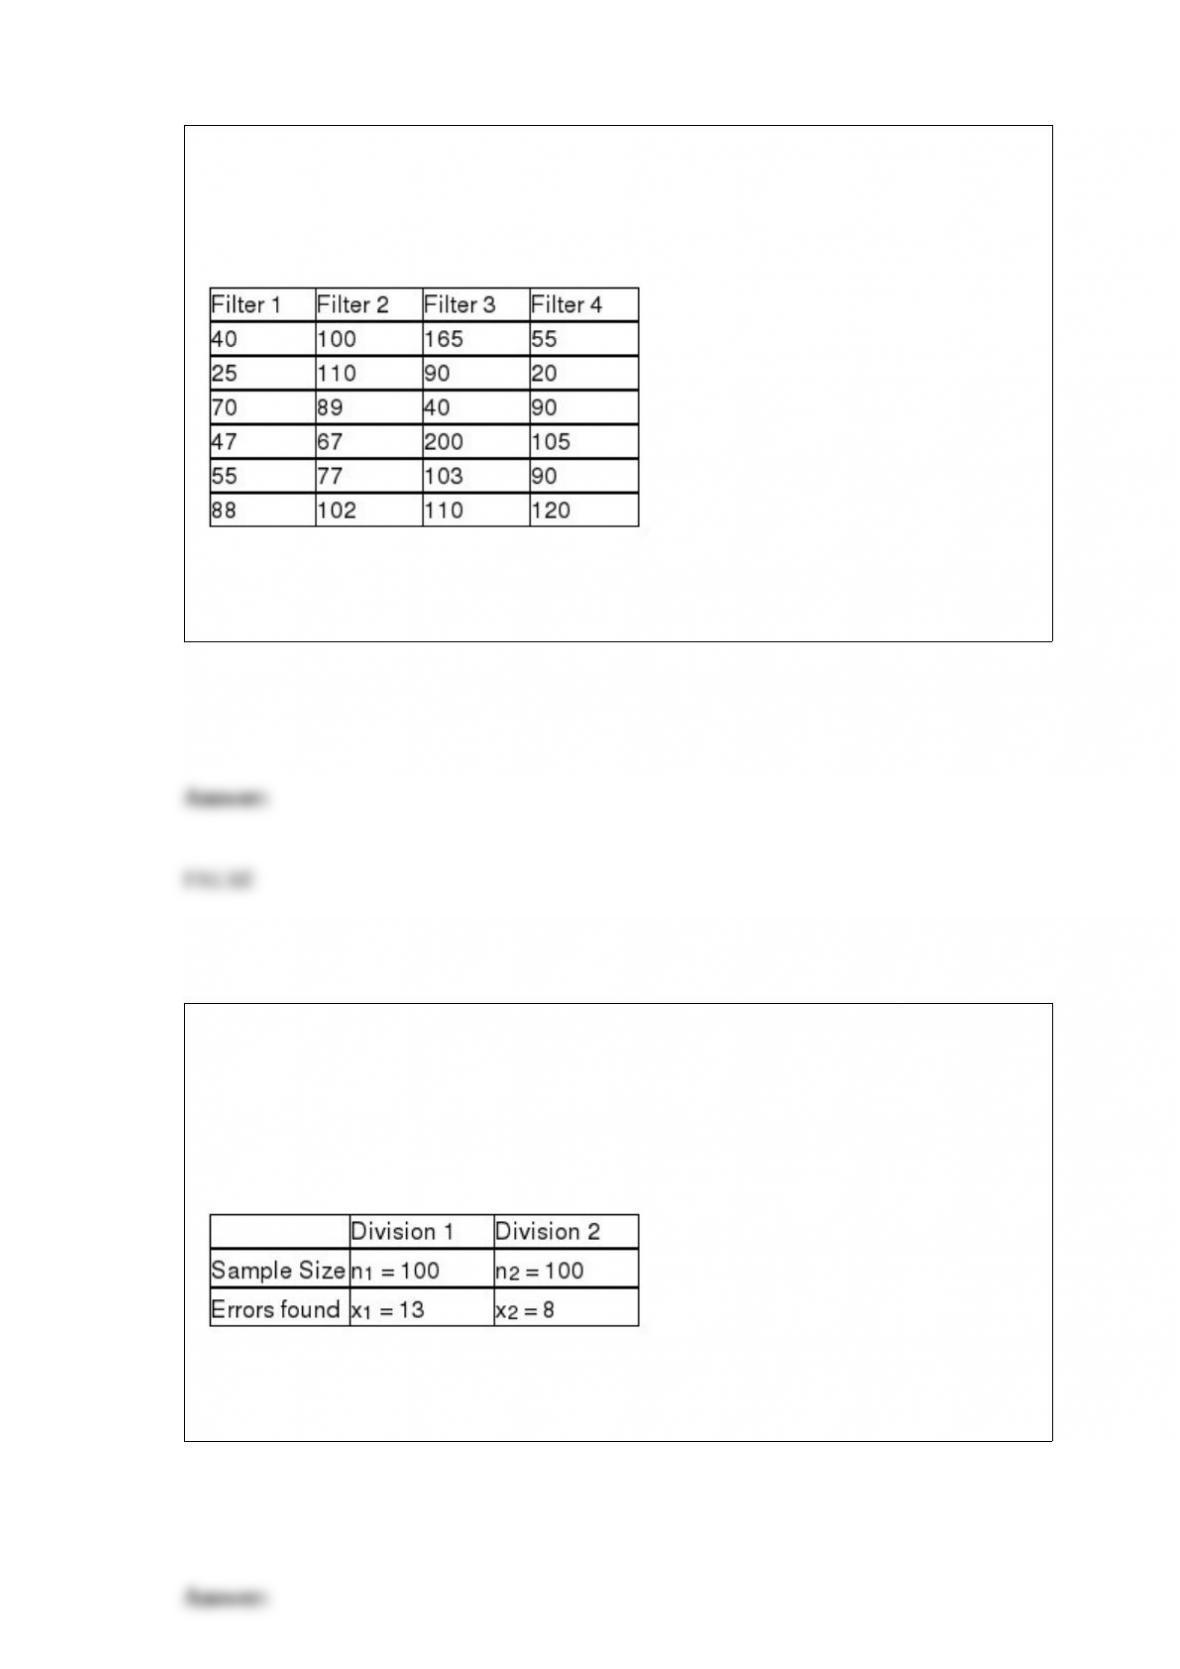
The makers of furnace filters recently conducted a test to determine whether the median
number of particulates that would pass through their four leading filters was the same. A
random sample of 6 of each type of filter was used with the following data being
recorded:
If the managers are unwilling to assume that the populations are normally distributed,
the appropriate test in this case would be the Mann-Whitney U test.
An accounting firm has been hired by a large computer company to determine whether
the proportion of accounts receivables with errors in one division (Division 1) exceeds
that of the second division (Division 2). The managers believe that such a difference
may exist because of the lax standards employed by the first division. To conduct the
test, the accounting firm has selected random samples of accounts from each division
with the following results.
Based on this information and using a significance level equal to 0.05, the critical value
from the standard normal table is z = 1.645.

When regression analysis is used for descriptive purposes, two of the main items of
interest are whether the sign on the regression slope coefficient is positive or negative
and whether the regression slope coefficient is significantly different from zero.
The Nationwide Motel Company has determined that 70 percent of all calls for motel
reservations request nonsmoking rooms. Recently, the customer service manager for the
company randomly selected 25 calls. Assuming that the distribution of calls requesting
nonsmoking rooms is described by a binomial distribution, the expected number of
requests for nonsmoking rooms is 14.
Whenever possible, in establishing the null and alternative hypotheses, the research
hypothesis should be made the alternative hypothesis.

If a hypothesis test leads to incorrectly rejecting the null hypothesis, a Type II statistical
error has been made.
The primary purpose of performing a pre-test when developing a telephone or mail
survey is to make sure that the respondents can understand the questions and are able to
provide meaningful responses.
If a population mean is equal to 200, the sample mean for a random sample selected
from the population is about as likely to be higher or lower than 200.
An emergency room in a hospital wants to determine the sample size needed for
estimating their mean number of visits per day. If they want a 99 percent confidence
level the correct critical value to use is 2.33.
A random sample of 500 customers at a large retail store was selected. These customers
were asked whether they had a positive experience the last time they shopped there.
Only 50 customers said that they did not have a positive experience. Thus, the
population parameter for proportion of customers who did have a positive experience
is .90.
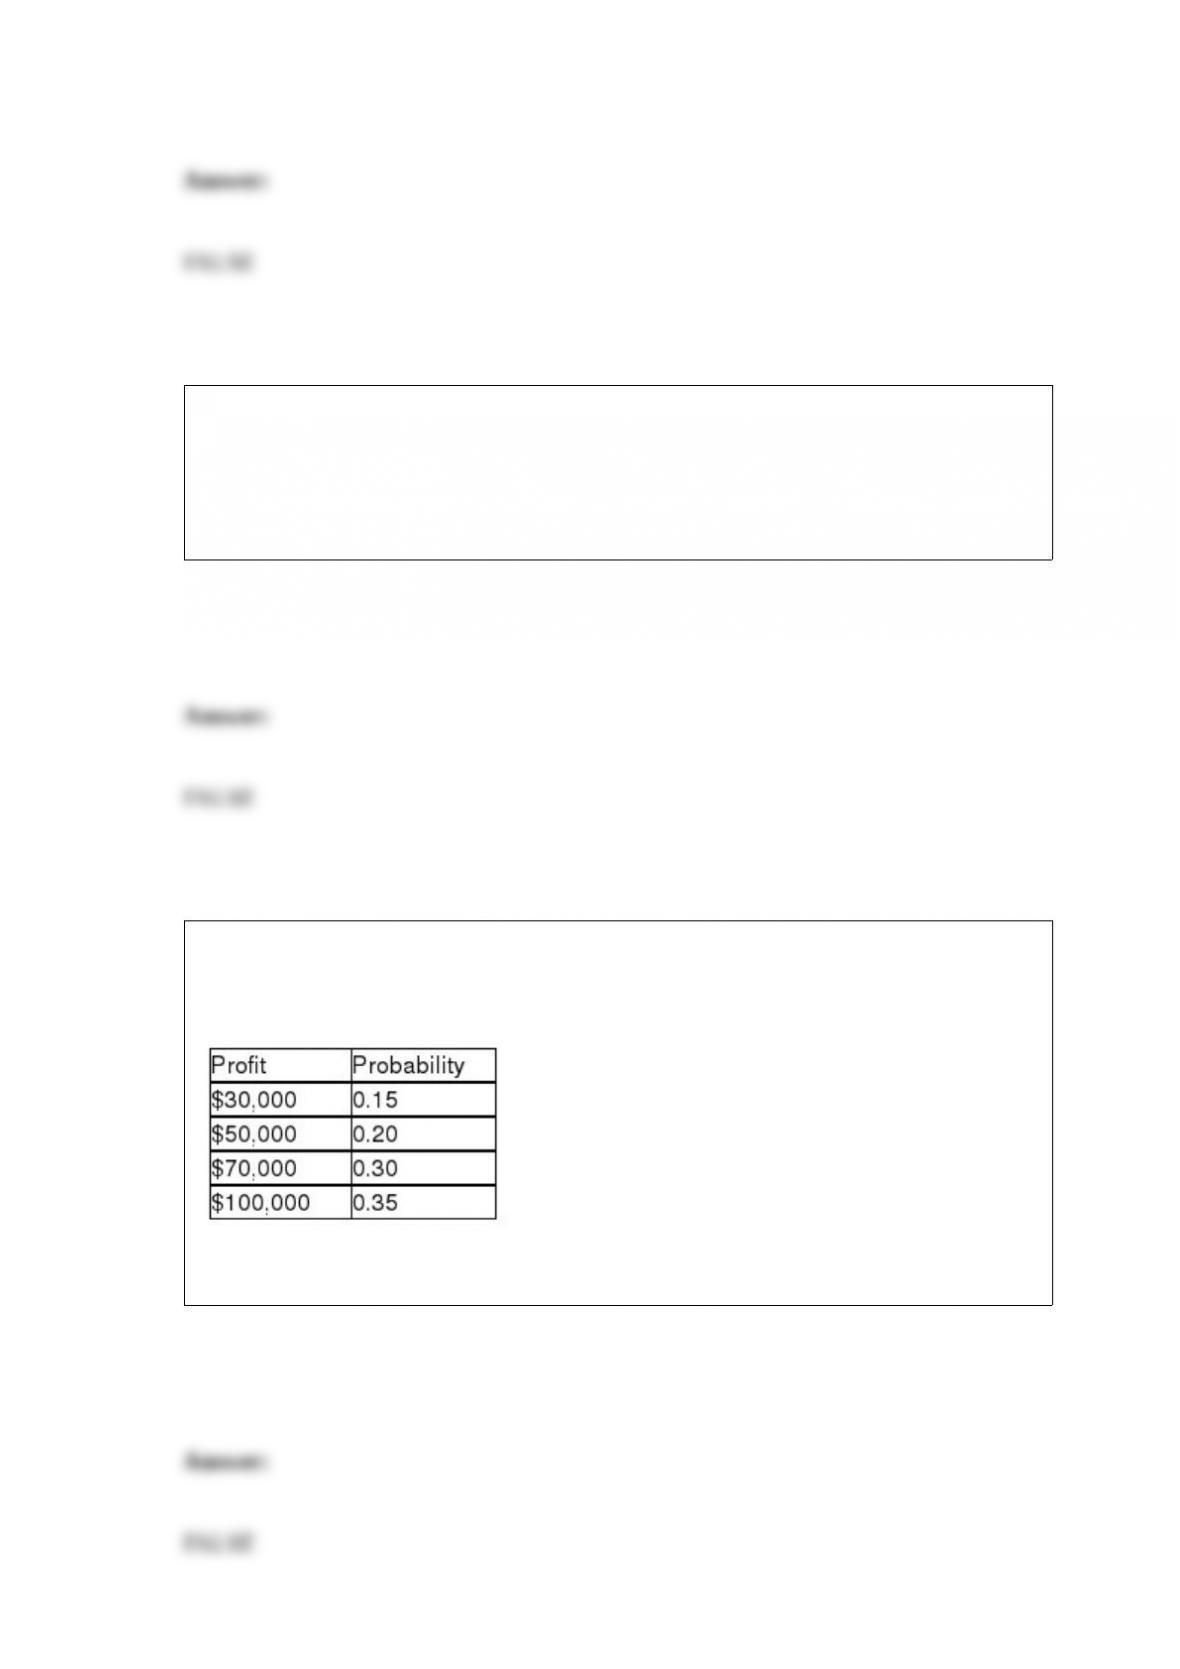
The Cromwell Construction Company has the opportunity to enter into a contract to
build a mountain road. The following table shows the probability distribution for the
profit that could occur if it takes the contract:
Based on this information, the probability of profit being at least $50,000 is 0.50.
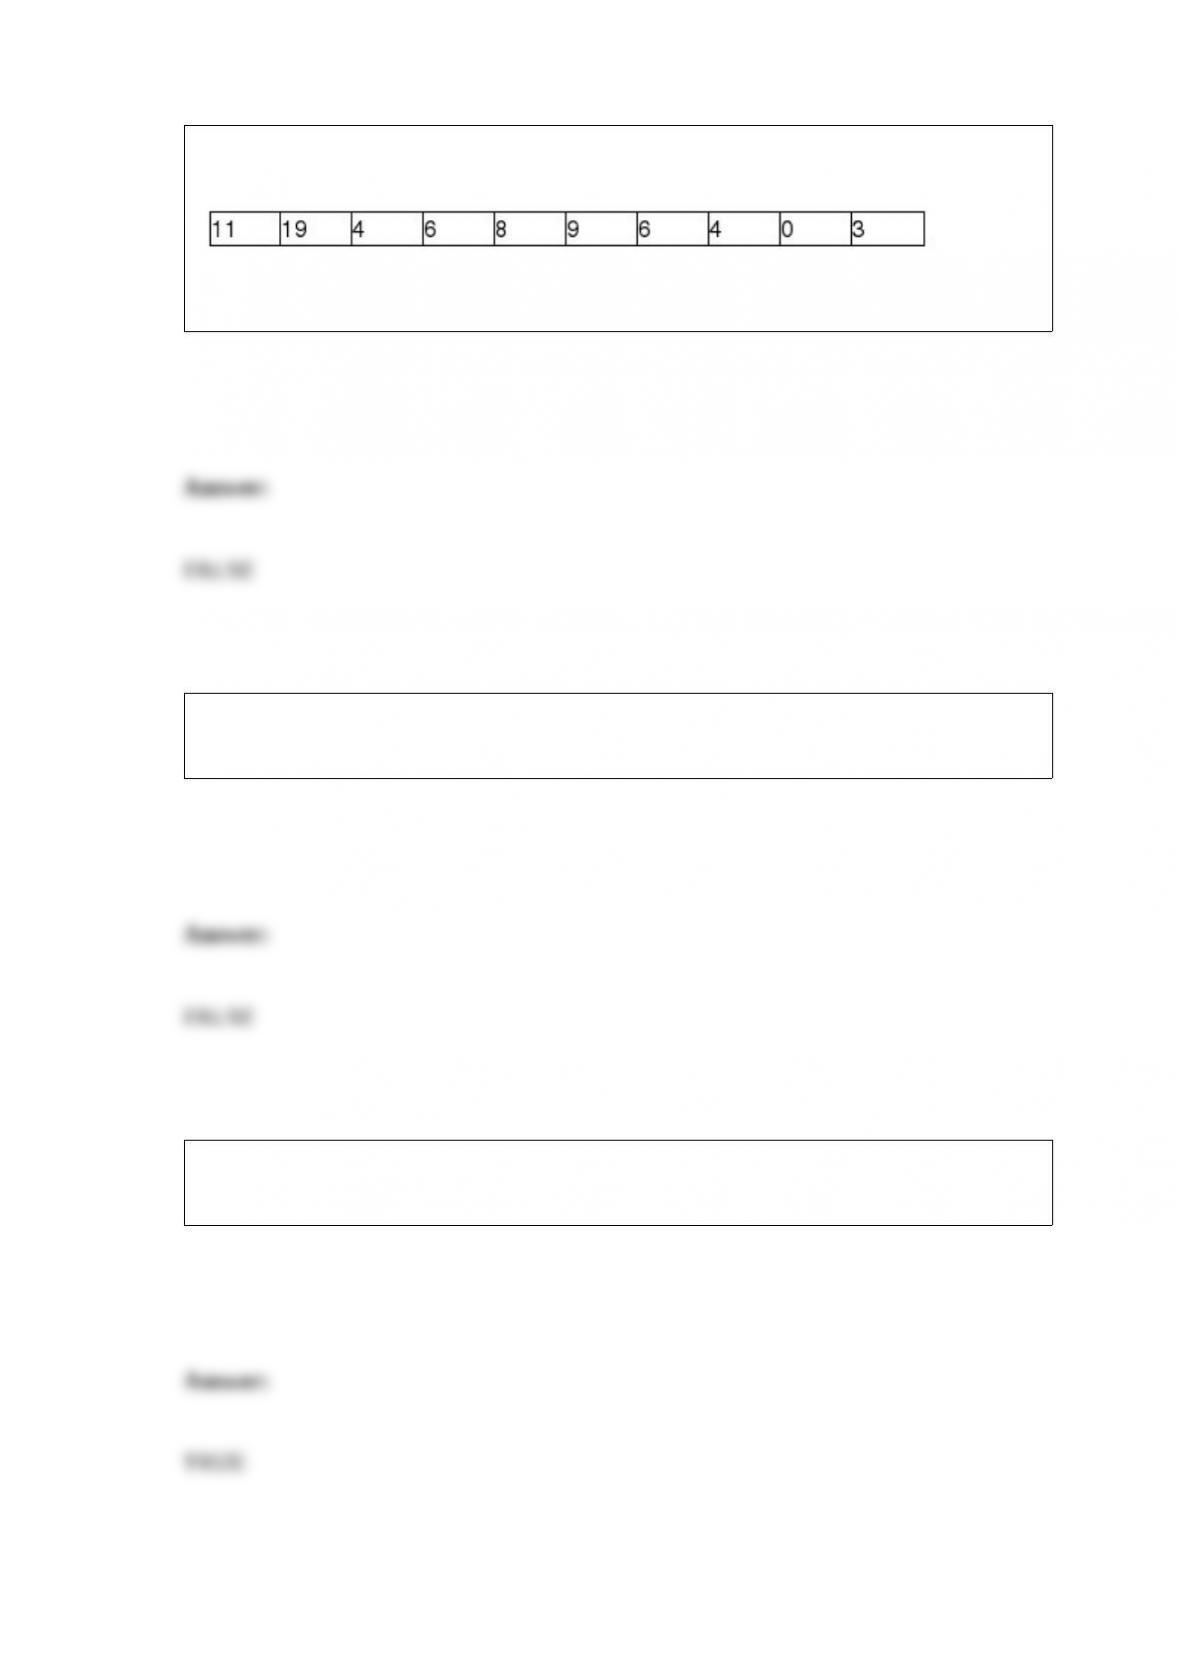
A store manager tracks the number of customer complaints each week. The following
data reflect a random sample of ten weeks.
The standard deviation for these data is approximately 27.78.
In process improvement efforts, the goal is to first remove the common cause variation
and then to reduce the special cause variation in a system.
Some of the most common methods of collecting data include experiments, telephone
surveys, mail questionnaires, direct observations, and personal interviews.

The one-way ANOVA test involves assuming that the population variances are equal.
Classical probability assessment is likely to be the most common method of probability
assessment used in business decision making.
Recently a survey was conducted in which customers of a large insurance company
were asked to indicate the number of speeding tickets they had received in the past
three years. The minimum value in the data was zero and the largest was six tickets. If
you wished to illustrate the proportion of people who had three or fewer tickets, you
would most likely construct a cumulative relative frequency distribution.
In comparing two populations using paired differences, after the difference is found for
each pair, the method for testing whether the mean difference is equal to 0 becomes the
same as was used for a one-sample hypothesis test with unknown standard deviation.

A national car rental agency is interested in determining whether the mean days that
customers rent cars is the same between three of its major cities. The following data
reflect the number of days people rented a car for a sample of people in each of three
cities. Assuming that a one-way analysis of variance is to be performed, the total sum of
squares is computed to be approximately 120.9.
The upper and lower limits of each class in a frequency distribution are also referred to
as the data array.

The Nationwide Motel Company has determined that 70 percent of all calls for motel
reservations request nonsmoking rooms. Recently, the customer service manager for the
company randomly selected 25 calls. Assuming that the distribution of calls requesting
nonsmoking rooms is described by a binomial distribution, the standard deviation of
requests for nonsmoking rooms is 5.25 customers.
By combining cells we guard against having an inflated test statistic that could have led
us to incorrectly accept the null hypothesis.
In conducting a hypothesis test where the conclusion is to reject the null hypothesis,
then either a correct decision has been made or else a Type I error.
When developing a frequency distribution, the following classes would be considered
acceptable:

5 to < 10
10 to < 20
20 to < 40
The Ace Construction Company has entered into a contract to widen a street in Boston.
The possible payoffs for this project have been determined by management. The
probabilities for these payoffs could be determined using a binomial distribution.
The number of customers who arrive at a fast food business during a one-hour period is
known to be Poisson distributed with a mean equal to 8.60. The probability that exactly
8 customers will arrive in a one-hour period is 0.1366.
Generally, it is possible to appropriately test a null and alternative hypotheses using the

test statistic approach and reach a different conclusion than would be reached if the
p-value approach were used.
Recently, Major League Baseball officials stated that the median cost for a family of
four to attend a baseball game including, parking, tickets, food, and drinks did not
exceed $125.00. As long as the data are considered interval or ratio level, the t-test can
be used to test MLB’s claim.
Two separate frequency distributions for two variables provide the same information as
one joint frequency distribution involving the same two variables.
Given the following sample data
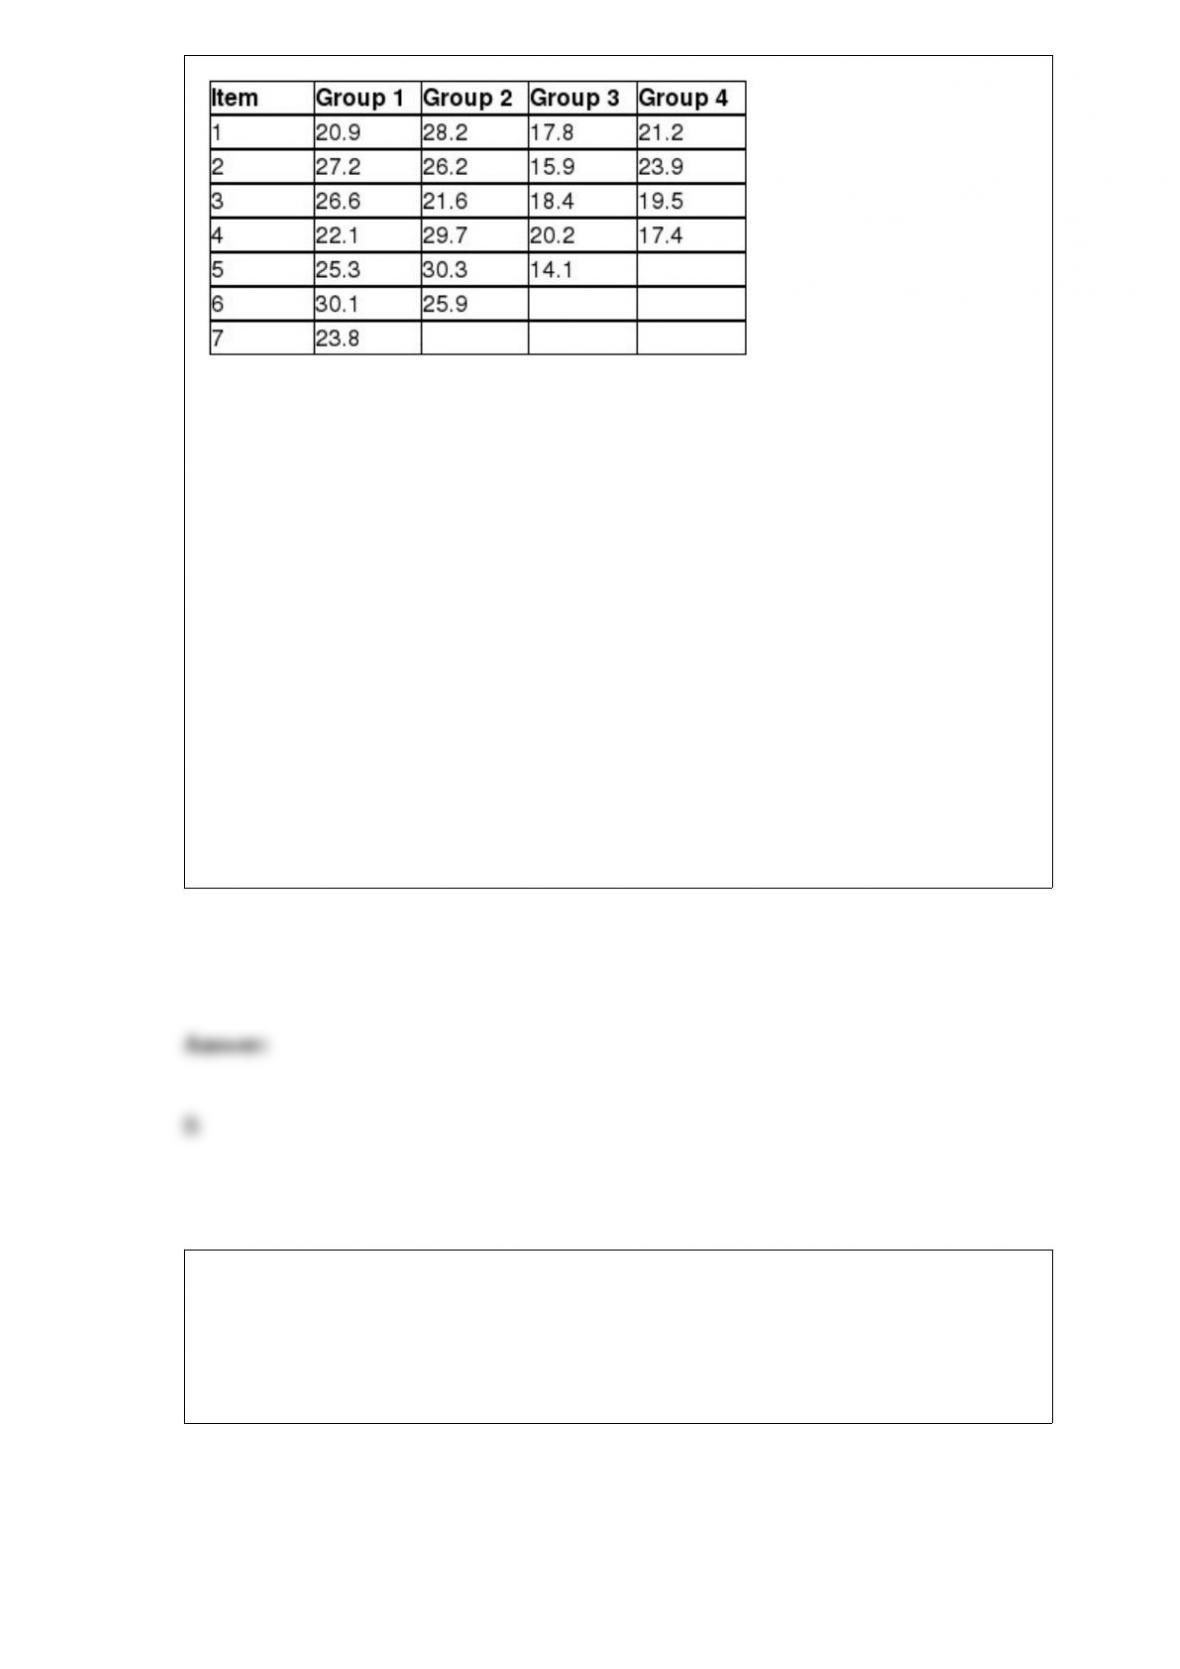
Based on the computations for the within- and between-sample variation, develop the
ANOVA table and test the appropriate null hypothesis using alpha= 0.05. Use the
p-value approach.
A) Since p-value = 0.0678 > 0.05 reject H0 and conclude that at least two population
means are different.
B) Since p-value = 0.000136 < 0.05 reject H0 and conclude that at least two population
means are different.
C) Since p-value = 0.0678 > 0.05 accept H0 and conclude that all population means are
the same.
D) Since p-value = 0.000136 < 0.05 accept H0 and conclude that all population means
are the same.
A major retail clothing store is interested in estimating the difference in mean monthly
purchases by customers who use the store’s in-house credit card versus using a Visa,
Mastercard, or one of the other major credit cards. To do this, it has randomly selected a
sample of customers who have made one or more purchases with each of the types of
credit cards. The following represents the results of the sampling:
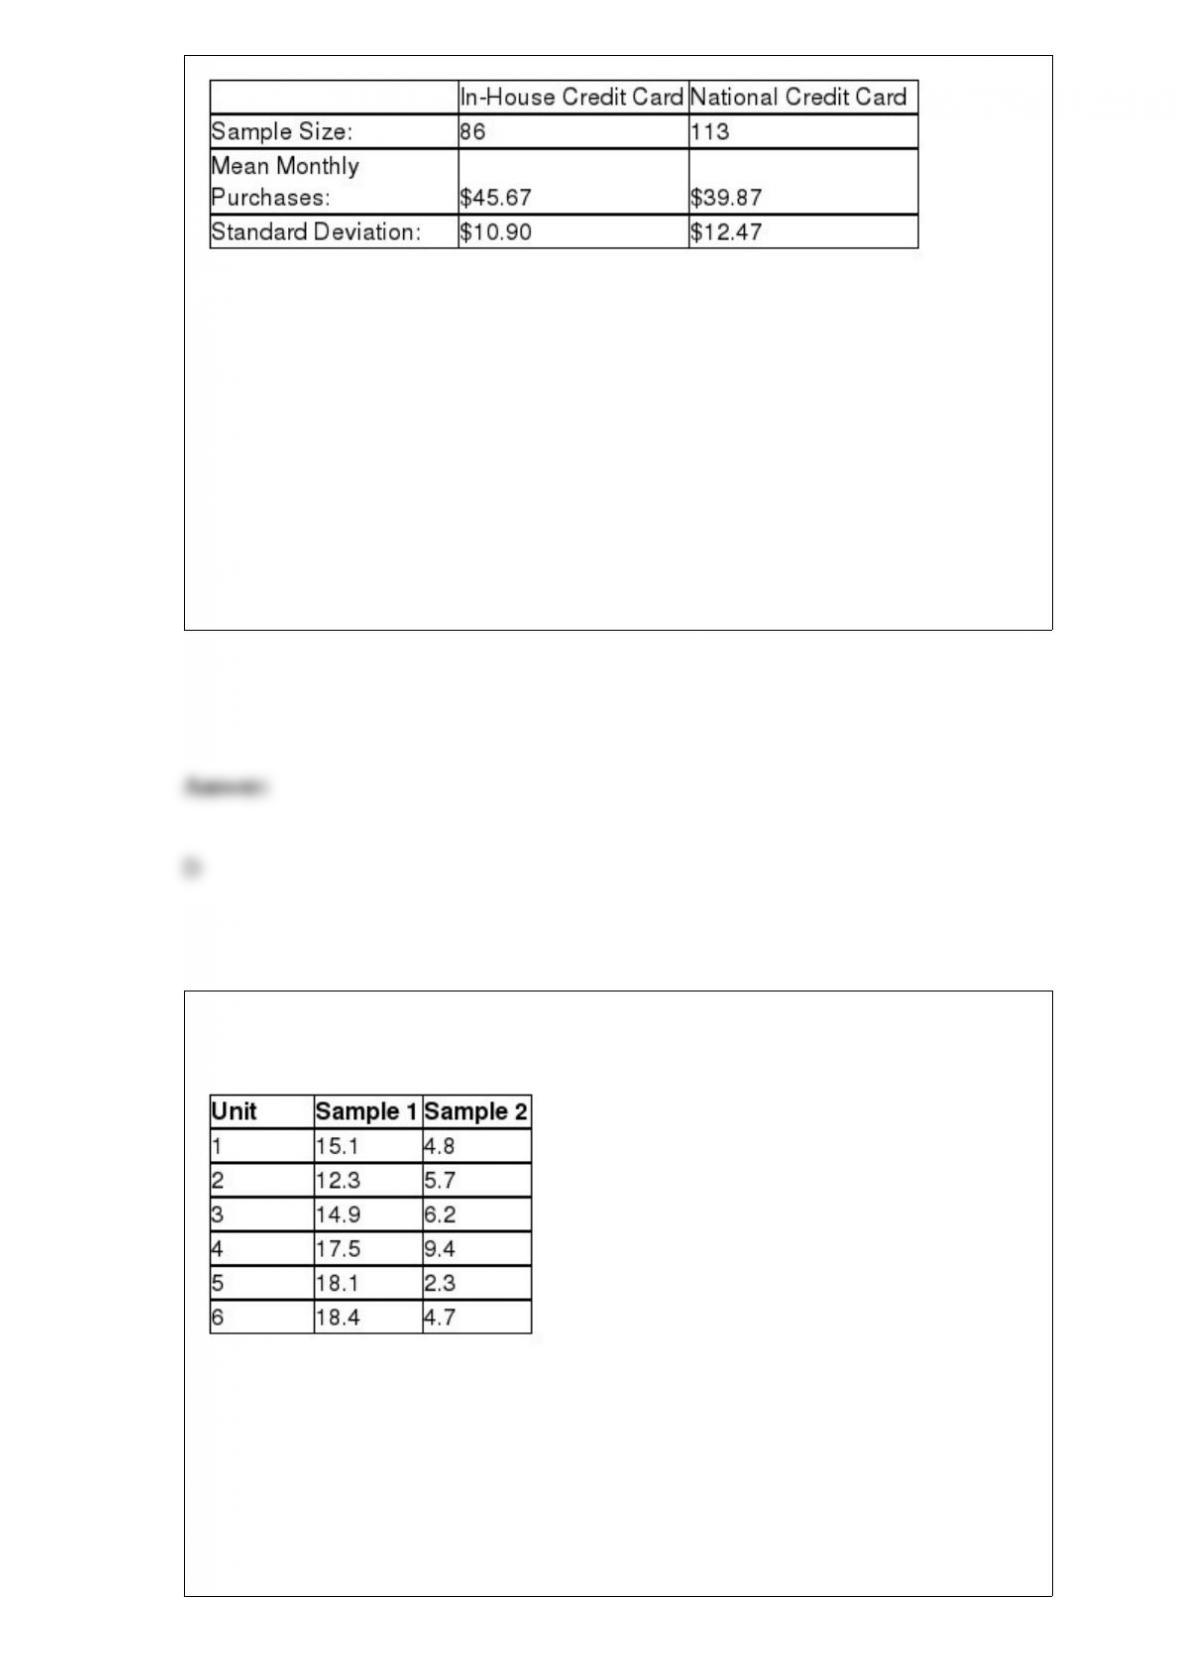
Given this information, which of the following statements is true?
A) If either of the sample sizes is increased, the resulting confidence interval will have
a smaller margin of error.
B) If the confidence level were changed from 95 percent to 90 percent, the margin of
error in the estimate would be reduced.
C) Neither A nor B are true.
D) Both A and B are true.
The following samples are observations taken from the same elements at two different
times:
Assume that the populations are normally distributed and construct a 90% confidence
interval for the difference in the means of the distribution at the times in which the
samples were taken.
A) (7.6232, 13.4434)
B) (5.2825, 15.8127)

C) (6.8212, 14.7821)
D) (7.4122, 14.6801)
When the world’s largest retailer, Walmart, decided to enter the grocery marketplace in
a big way with its “Super Stores,” it changed the retail grocery landscape in a major
way. The other major chains such as Albertsons have struggled to stay competitive. In
addition, regional discounters such as WINCO in the western United States have made
it difficult for the traditional grocery chains. Recently, a study was conducted in which a
“market basket” of products was selected at random from those items offered in three
stores in Boise, Idaho: Walmart, Winco, and Albertsons. At issue was whether the mean
prices at the three stores are equal or whether there is a difference in prices. The sample
data are in the data file called Food Price Comparisons. Using an alpha level equal to
0.05, test to determine whether the three stores have equal population mean prices. If
you conclude that there are differences in the mean prices, perform the appropriate
posttest to determine which stores have different means.
A) There is no difference between the three mean prices.
B) Based on the sample data, we conclude that Winco is significantly different (higher)
than Albertsons and Walmart in terms of average prices. However, we can make no
conclusion about Albertsons and Walmart.
C) Based on the sample data, we conclude that Walmart is significantly different
(higher) than Albertsons and Winco in terms of average prices. However, we can make
no conclusion about Albertsons and Winco.
D) Based on the sample data, we conclude that Albertsons is significantly different
(higher) than Walmart and Winco in terms of average prices. However, we can make no
conclusion about Walmart and Winco.

The most frequently used measure of central tendency is:
A) median.
B) mean.
C) mode.
D) middle value.
If a random sample of 200 items is taken from a population in which the proportion of
items having a desired attribute is p = 0.30, what is the probability that the proportion of
successes in the sample will be less than or equal to 0.27?
A) 0.0841
B) 0.1011
C) 0.1912
D) 0.1762
Swift is the holding company for Swift Transportation Co., Inc., a truckload carrier
headquartered in Phoenix, Arizona. Swift operates the largest truckload fleet in the
United States. Before Swift switched to its current computer-based billing system, the

average payment time from customers was approximately 40 days. Suppose before
purchasing the present billing system, it performed a test by examining a random
sample of 24 invoices to see if the system would reduce the average billing time. The
sample indicates that the average payment time is 38.7 days.
The company that created the billing system indicates that the system would reduce the
average billing time to less than 40 days. Conduct a hypothesis test to determine if the
new computer-based billing system would reduce the average billing time to less than
40 days. Assume the standard deviation is known to be 6 days. Use a significance level
of 0.025.
A) Since z = -0.423 > -1.96, we will not reject H0, there is not sufficient evidence to
conclude that the new computer-based billing system would reduce the average billing
time to less than 40 days.
B) Since z = -1.0614 > -1.96, we will not reject H0, there is not sufficient evidence to
conclude that the new computer-based billing system would reduce the average billing
time to less than 40 days.
C) z = -1.0231 > -1.96, we will reject H0, there is sufficient evidence to conclude that
the new computer-based billing system would reduce the average billing time to less
than 40 days.
D) z = 0.341 > -1.96, we will reject H0, there is sufficient evidence to conclude that the
new computer-based billing system would reduce the average billing time to less than
40 days.
A bar chart is most likely used to display which of the following?
A) A continuous variable
B) A nominal level variable
C) An ordinal level variable
D) Either B or C

SeeClear Windows makes windows for use in homes and commercial buildings. The
standards for glass thickness call for the glass to average 0.375 inches with a standard
deviation equal to 0.050 inch. Suppose a random sample of n = 50 windows yields a
sample mean of 0.392 inches. What is the probability if the windows meet the
standards?
A) 0.0612
B) 0.0082
C) 0.0015
D) 0.0009
Respond to the following questions using this partially completed one-way ANOVA
table:
Fill in the ANOVA table with the missing values.
A) SSB = 483, MSB = 161, F-ratio = 11.1309, Within Samples df = 28, MSW = 14.464
B) SSB = 483, MSB = 161, F- ratio = 8.1629, Within Samples df = 28, MSW = 14.464

C) SSB = 483, MSB = 161, F-ratio = 8.1629, Within Samples df = 25, MSW = 14.464
D) SSB = 504, MSB = 161, F-ratio = 8.1629, Within Samples df = 28, MSW = 14.464
In a one-way analysis of variance test in which the levels of the factor being analyzed
are randomly selected from a large set of possible factors, the design is referred to as:
A) a fixed-effects design.
B) a random-effects design.
C) an undetermined results design.
D) a balanced design.
A hotel chain has four hotels in Oregon. The general manager is interested in
determining whether the mean length of stay is the same or different for the four hotels.
She selects a random sample of n = 20 guests at each hotel and determines the number
of nights they stayed. Assuming that she plans to test this using an alpha level equal to
0.05, which of the following is the correct critical value?
A) F = 3.04
B) F = 2.76
C) t = 1.9917

D) F = 2.56
Assume that you are testing the difference in the means of two independent populations
at the 0.05 level of significance. The null hypothesis is: H0 : μA – μβ ≥ 0 and you have
found the test statistic is What should you conclude?
A) The mean of pop. A is greater than the mean of pop. B because p-value < α.
B) The mean of pop. A is greater than the mean of pop. B because p-value > α.
C) There is no significant difference in the two means because p-value > α.
D) The mean of pop. B is greater than the mean of pop. A because p-value < α.
A histogram is most commonly used to analyze which of the following?
A) Nominal level data
B) Quantitative data
C) Time-series data
D) Ordinal data

The use of charts and graphs is an example of:
A) descriptive statistics.
B) inferential statistics.
C) estimation.
D) hypothesis testing.
For which data collection method is it most important to have a polished-looking survey
form?
A) Telephone survey
B) Written questionnaire
C) Experimental design
D) Personal interview
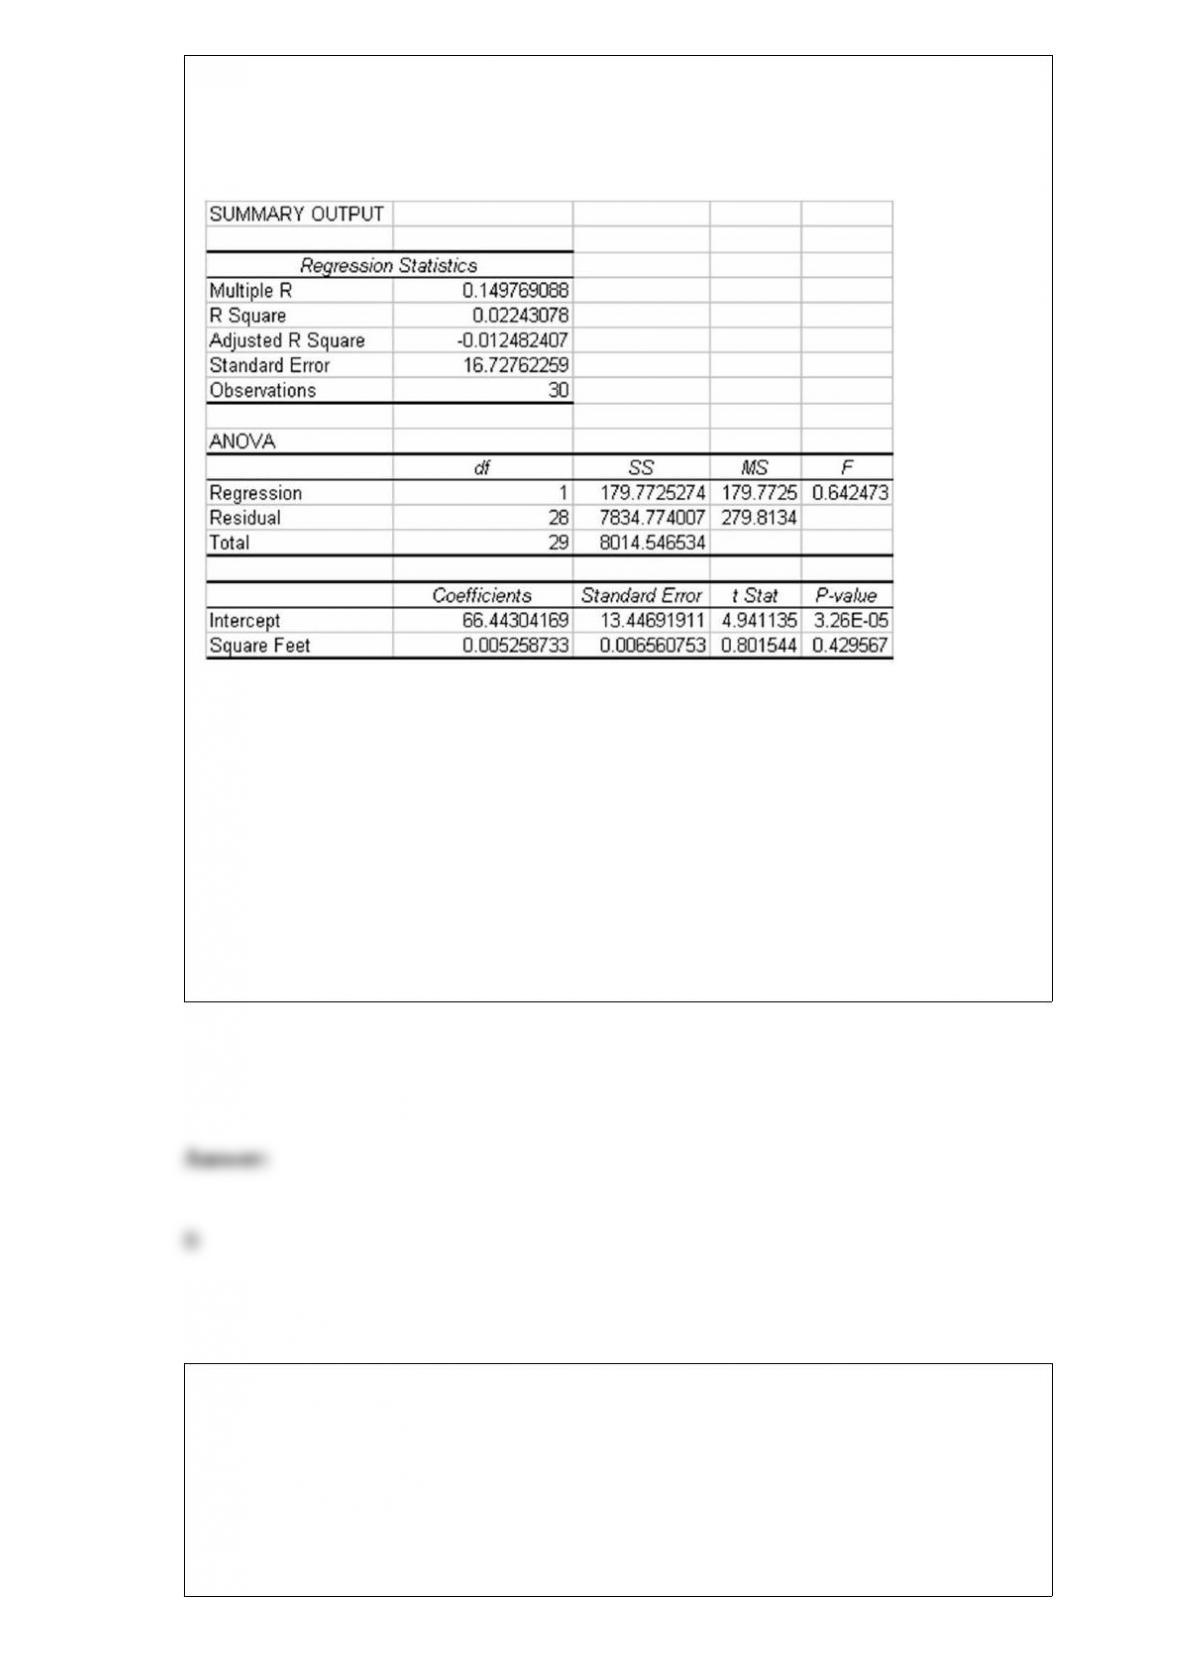
The following regression output was generated based on a sample of utility customers.
The dependent variable was the dollar amount of the monthly bill and the independent
variable was the size of the house in square feet.
Based on this regression output, what is the 95 percent confidence interval estimate for
the population regression slope coefficient?
A) Approximately -0.0003 —– +0.0103
B) About -0.0082 —– +0.0188
C) Approximately -32.76 —– +32.79
D) None of the above
Which of the following statements is true?
A) The decision maker controls the probability of making a Type I statistical error.
B) Alpha represents the probability of making a Type II error.
C) Alpha and beta are directly related such that when one is increased the other will
increase also.
D) The alternative hypothesis should contain the equality.
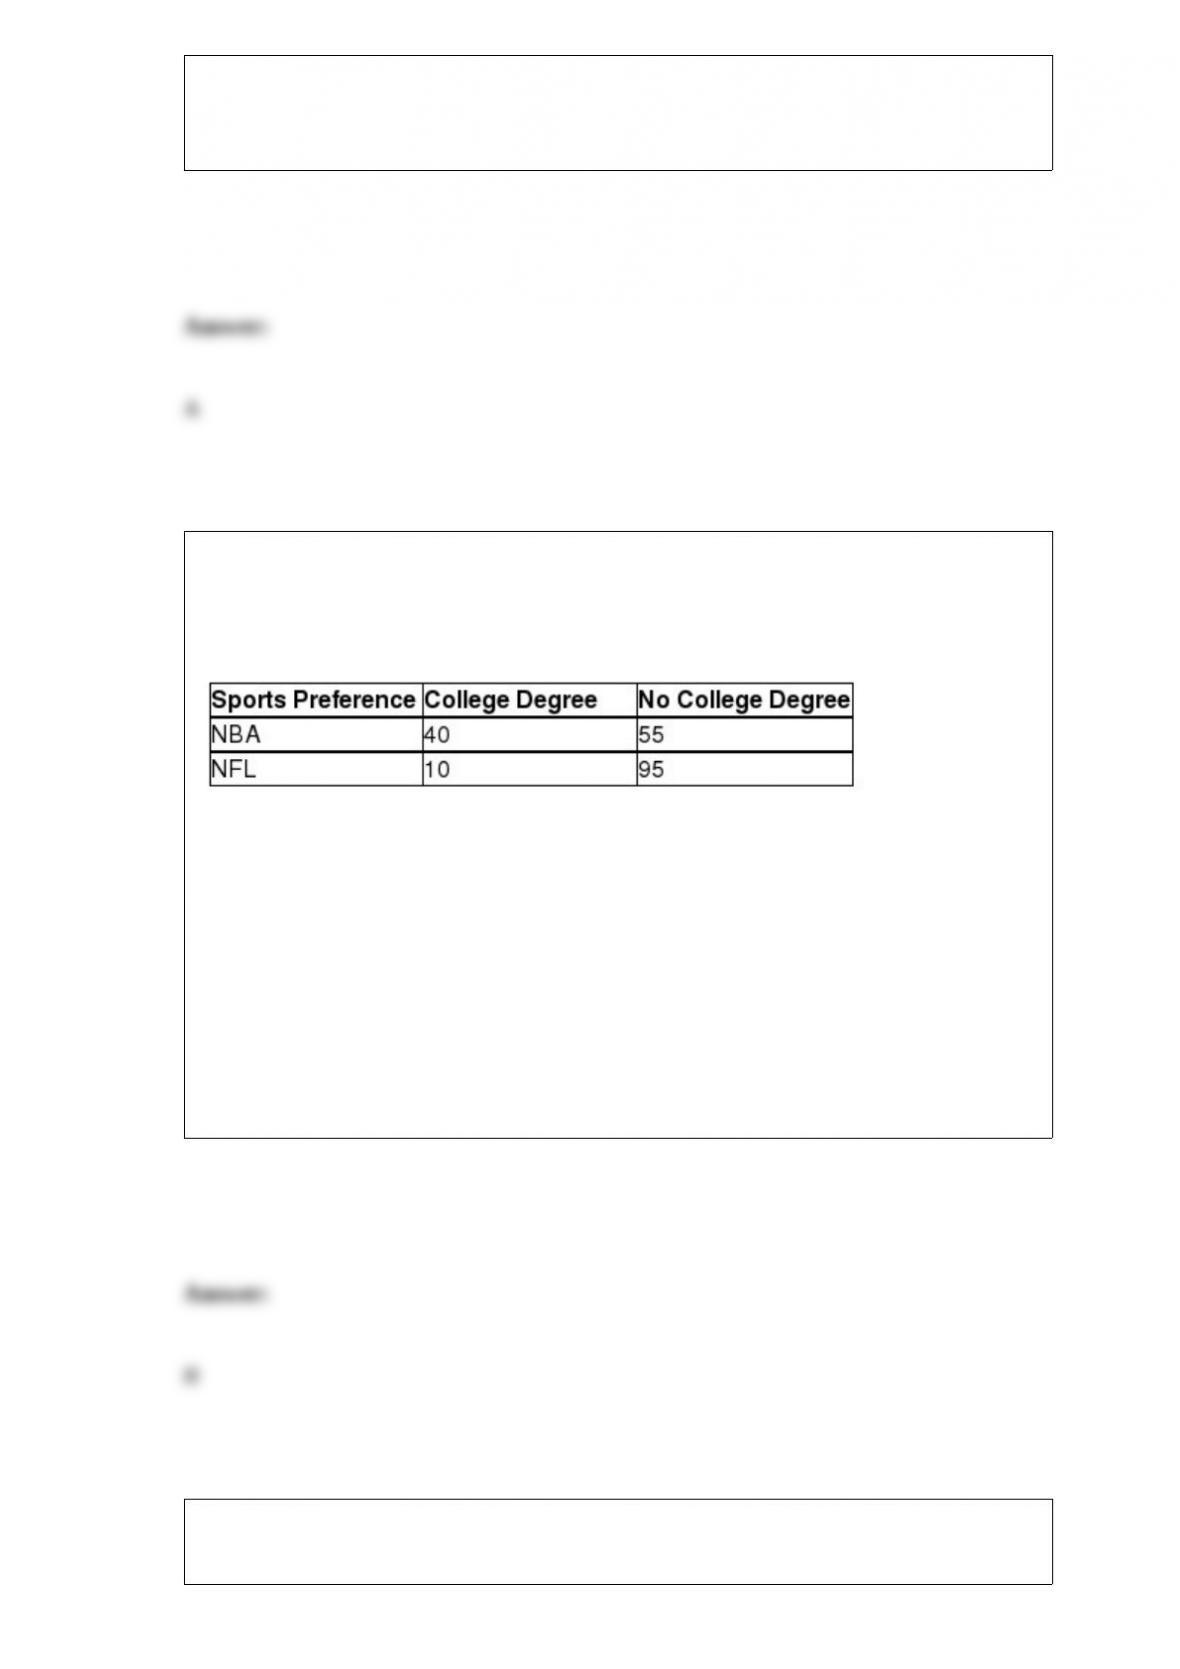
Drake Marketing and Promotions has randomly surveyed 200 men who watch
professional sports. The men were separated according to their educational level
(college degree or not) and whether they preferred the NBA or the National Football
League (NFL). The results of the survey are shown:
What is the probability that a randomly selected survey participant has a college degree
and prefers the NBA?
A) 0.5250
B) 0.2000
C) 0.6050
D) 0.5880
The Dalton Company has recently made a decision to build a new plant in Denver. In
making this decision it used data supplied by the U.S. Census Bureau. For the Dalton

Company, these data are examples of:
A) primary data.
B) secondary data.
C) reliable data.
D) experimental data.
It is possible for the same survey questionnaire to yield both quantitative and qualitative
data.
A corporation has 11 manufacturing plants. Of these, 7 are domestic and 4 are located
outside the United States. Each year a performance evaluation is conducted for 4
randomly selected plants.
What is the probability that a performance evaluation will include 2 or more plants
from outside the United States?
A) 0.4242
B) 0.3776
C) 0.3523
D) 0.4696

The chamber of commerce in a beach resort town wants to estimate the proportion of
visitors who are repeat visitors. Suppose that they have estimated that they need a
sample size of n=16,577 people to achieve a margin of error of .01 percentage points
with 99 percent confidence, but this is too large a sample size to be practical. How can
they reduce the sample size?
A) Use a higher level of confidence
B) Use a smaller margin or error
C) Use a lower level of confidence
D) Conduct a census
Damage to homes caused by burst piping can be expensive to repair. By the time the
leak is discovered, hundreds of gallons of water may have already flooded the home.
Automatic shutoff valves can prevent extensive water damage from plumbing failures.
The valves contain sensors that cut off water flow in the event of a leak, thereby
preventing flooding. One important characteristic is the time (in milliseconds) required
for the sensor to detect the water leak. Sample data obtained for four different shutoff
valves are contained in the file entitled Waterflow.
Produce the relevant ANOVA table and conduct a hypothesis test to determine if the
mean detection time differs among the four shutoff valve models. Use a significance
level of 0.05.
A) The ANOVA produces a p-value of 0.033 < alpha = 0.05. Therefore, the null
hypothesis is not rejected. There is not sufficient evidence to indicate that the mean

detection time differs among the four shutoff valve models
B) The ANOVA produces a p-value of 0.033 < alpha = 0.05. Therefore, the null
hypothesis is rejected. There is sufficient evidence to indicate that the mean detection
time differs among the four shutoff valve models
C) The ANOVA produces a p-value of 0.000 < alpha = 0.05. Therefore, the null
hypothesis is not rejected. There is not sufficient evidence to indicate that the mean
detection time differs among the four shutoff valve models
D) The ANOVA produces a p-value of 0.000 < alpha = 0.05. Therefore, the null
hypothesis is rejected. There is sufficient evidence to indicate that the mean detection
time differs among the four shutoff valve models
A value computed from a population is called:
A) a statistic.
B) a real number.
C) a parameter.
D) a point estimate.
Recently, a department store chain was interested in determining if there was a
difference in the mean number of customers who enter the three stores in Seattle. The
analysts set up a study in which the number of people entering the stores was counted

depending on whether the day of the week was Saturday, Sunday, or a weekday. The
following data were collected:
Given this format and testing using an alpha level equal to 0.05, which of the following
statements is true?
A) The total degrees of freedom is 9.
B) The between blocks degrees of freedom equals 8.
C) The between samples degrees of freedom equals 3.
D) The within sample degrees of freedom equals 4.
The American College Health Association produced the National College Health
Assessment (Andy Gardiner, “Surfacing from Depression,” February 6, 2006). The
assessment indicates that the percentage of U.S. college students who report having
been diagnosed with depression has risen from 2000. The assessment surveyed 47,202
students at 74 campuses. It discovered that 10.3% and 14.9% of students indicated that
they had been diagnosed with depression in 2000 and 2004, respectively. Assume that
half of the students surveyed were surveyed in 2004.
Indicate the margin of error for estimating p1 – p2 with 1 – 2.
A) 0.04156
B) 0.00121
C) 0.03418
D) 0.00597

When the California Highway Patrol states that a study of drivers on a rural highway
shows that the average speed is between 62.5 mph and 64.5 mph, they are most likely
basing this statement on:
A) descriptive statistics.
B) estimation.
C) hypothesis testing.
D) graphical analysis.
Which of the following statements is true with respect to a simple linear regression
model?
A) The regression slope coefficient is the square of the correlation coefficient.
B) The percentage of variation in the dependent variable that is explained by the
independent variable can be determined by squaring the correlation coefficient.
C) It is possible that the correlation between a y and x variable might be statistically
significant, but the regression slope coefficient could be determined to be zero since
they measure different things.
D) The standard error of the estimate is equal to the standard error of the slope.

For the following z-test statistic, compute the p-value assuming that the hypothesis test
is a one-tailed test: z = 1.34.
A) 0.0606
B) 0.0815
C) 0.0124
D) 0.0901
Which of the following probability distributions could be used to describe the
distribution for a continuous random variable?
A) Exponential distribution
B) Normal distribution
C) Uniform distribution
D) All of the above