
Two popular general categories of smoothing techniques are averaging models and
exponential models.
If a researcher selects every kth item from a population of N items, then she is likely
conducting a systematic random sampling.
One of the ways to overcome the autocorrelation problem in a regression forecasting
model is to increase the level of significance for the Ftest
An experimental design contains only independent variables.

In analysis of variance tests a Fdistribution forms the basis for making the decisions.
Regression output from Excel software includes an ANOVA table.
You are thinking of using a t-table to find a 95 percent confidence interval for the mean
μ of a population. The distribution of the population is normal and the population
standard deviation is unknown. A random sample of size n is drawn from this
population. You may use the t-distribution only if the sample size n is small.

In a multiple regression model, the partial regression coefficient of an independent
variable represents the increase in the y variable when that independent variable is
increased by one unit if the values of all other independent variables are held constant.
Given two events, A and B, if the probability of either A or B occurring is 0.6, then the
probability of neither A nor B occurring is -0.6.
The probability of A B where A is receiving a state grant and B is receiving a federal
grant is the probability of receiving no more than one of the two grants.
In a simple regression the coefficient of correlation is the square root of the coefficient

of determination.
In a hypergeometric distribution the population, N, is finite and known.
Given x, a 95% prediction interval for a single value of y is always wider than a 95%
confidence interval for the average value of y.
Nonparametric statistical techniques are based on fewer assumptions about the
population and the parameters compared to parametric statistical techniques.

A logarithmic transformation may be applied to both positive and negative numbers.
The F value that is used to test for the overall significance of a multiple regression
model is calculated by dividing the sum of mean squares regression (SSreg) by the sum
of squares error (SSerr).
A descriptive measure of the population is called a parameter.

The ratio of two independent sample variances follows the F distribution.
The complete collection of all entities under study is called the sample.
In order to find values in the t distribution table, you must determine the appropriate
degrees of freedom based on the sample sizes.
A variable is a numerical description of each of the possible outcomes of an experiment.

A variable that can take on values at any point over a given interval is called a discrete
random variable
Given two events A and B each with a non-zero probability, if the conditional
probability of A given B is zero, it implies that the events A and B are independent.
A quality circle is a round-table of top-level quality managers.

Inspecting the attributes of a finished product to determine whether the product is
acceptable, is in need of rework, or is to be rejected is called after-process quality
control.
When a false null hypothesis is rejected, the researcher has made aType II error.
All numerical data must be analyzed statistically in the same way because all of them
are represented by numbers.
If the sample sizes are small, but the populations are normally distributed and the
population variances are known, the z-statistic can be used as the basis for statistical
inferences about the difference in two population means using two independent random
samples.

The first step in testing a hypothesis is to establish a true null hypothesis and a false
alternative hypothesis.
The Fstatistic is a ratio of two independent sample variances.
Statistical measures used to yield information about the center or the middle parts of a
group of numbers are called the measures of central tendency.

A z-score is the number of standard deviations that a value of a random variable is
above or below the mean.
Virtually all areas of business use statistics in decision making.
The number of degrees of freedom in a chi-square goodness-of-fit test is the number of
categories minus the number of parameters estimated.

If the sample sizes are greater than 30 and the population variances are known, the basis
for statistical inferences about the difference in two population means using two
independent random samples is the z-statistic, regardless of the shapes of the population
distributions.
The probability of committing a Type II error changes for each alternative value of the
parameter.
The term Total Quality Management (TQM) was coined by the well-known quality
guru, Edward Deming.
Measuring product attributes at regular intervals throughout the manufacturing process
in an effort to pinpoint problem areas is called in-process quality control.

A t-test is used to determine whether the coefficients of the regression model are
significantly different from zero.
As in a binomial distribution, each trial of a hypergeometric distribution results in one
of two mutually exclusive outcomes, i.e., either a success or a failure.
A random sample of 225 items from a population results in 60% possessing a given
characteristic. Using this information, the researcher constructs a 90% confidence
interval to estimate the population proportion. The resulting confidence interval is
_______.
a) 0.546 to 0.654
b) 0.536 to 0.664
c) 0.596 to 0.604
d) 0.571 to 0.629
e) 0.629 to 0.687
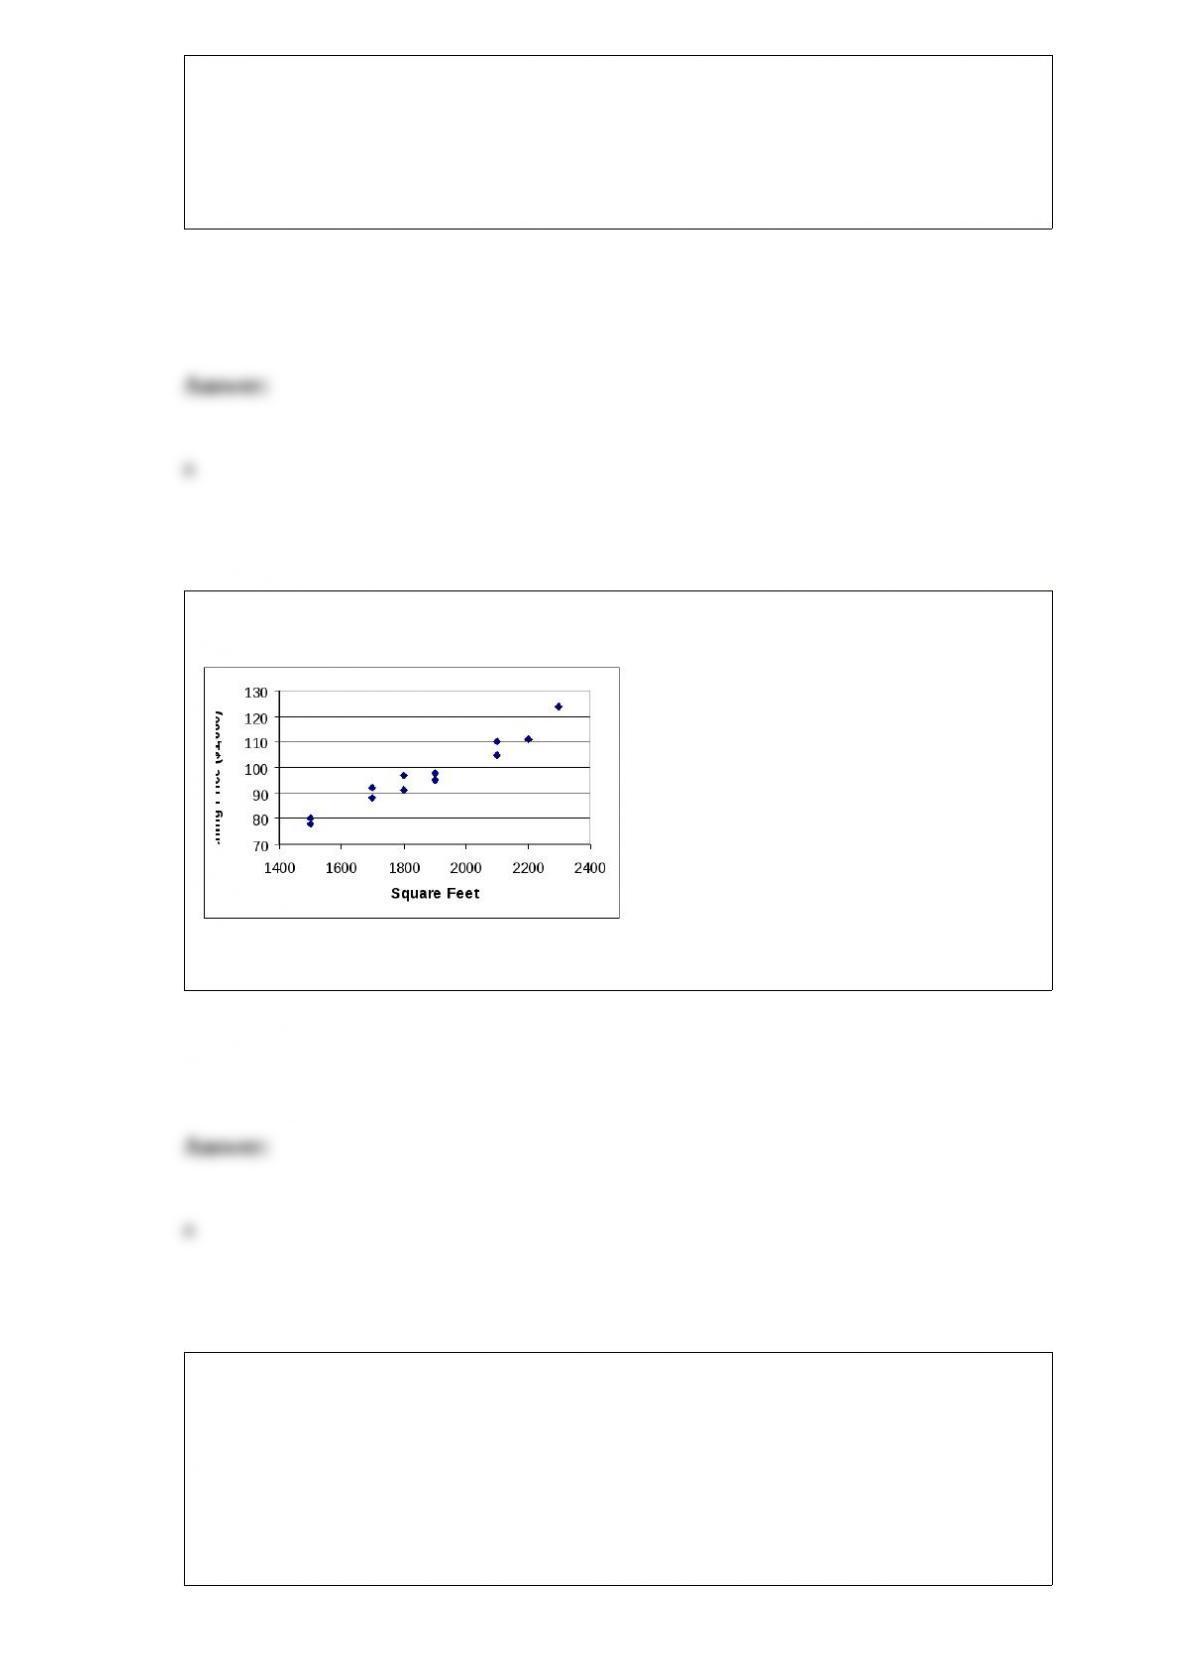
The following graphic of residential housing data (selling price and size in square feet)
is a _____________.
a) scatter plot
b) Pareto chart
c) pie chart
d) cumulative histogram
e) cumulative frequency
distribuion
If the population proportion is 0.90 and a sample of size 64 is taken, what is the
probability that the sample proportion is less than 0.88?
a) 0.2019
b) 0.2981

c) 0.5300
d) 0.7019
e) 0.7899
BigShots, Inc. is a specialty e-tailer that operates 87 catalog Web sites on the Internet.
Kevin Conn, Sales Director, feels that the style (color scheme, graphics, fonts, etc.) of a
Web site may affect its sales. He chooses three levels of design style (neon, old world
and sophisticated) and randomly assigns six catalog Web sites to each design style.
Analysis of Kevin’s data yielded the following ANOVA table.
Using
= 0.05, the critical F value is _____________.
a) 3.57
b) 19.43
c) 3.68
d) 19.45
e) 2.85
Consider the following sample space, S, and several events defined on it. S = {Albert,

Betty, Abel, Jack, Patty, Meagan}, and the events are: F = {Betty, Patty, Meagan}, H =
{Abel, Meagan}, and P = {Betty, Abel}. F H is ___________.
a) {Meagan}
b) {Betty, Abel, Patty, Meagan}
c) empty, since F and H are complements
d) empty, since F and H are independent
e) empty, since F and H are mutually exclusive
The z value associated with a two”sided 80% confidence interval is _______.
a) 1.645
b) 1.28
c) 0.84
d) 0.29
e) 2.00
A goodness of fit test is to be performed to see if Web Surfers prefer any of four Web

sites (A, B, C and D) more than the other three. A sample of 60 consumers is used.
What is the expected frequency for Web site A?
a) 1/4
b) 20
c) 15
d) 10
e) 30
A home building company routinely orders standard interior doors with a height of 80
inches. Recently the installers have complained that the doors are not the standard
height. The quality control inspector for the home building company is concerned that
the manufacturer is supplying doors that are not 80 inches in height. In an effort to test
this, the inspector is going to gather a sample of the recently received doors and
measure the height. The alternative hypothesis for the statistical test to determine if the
doors are not 80 inches is
a) the mean height is > 80 inches
b) the mean height is < 80 inches
c) the mean height is = 80 inches
d) the mean height is ≠80 inches
e) the mean height is ≥80 inches
The 2010 and 2012 market share data of the three competitors (Alston, Baren, and
Clemson) in an oligopolistic industry are presented in the following pie charts. Total
sales for this industry were $1.5 billion in 2010 and $1.8 billion in 2012.
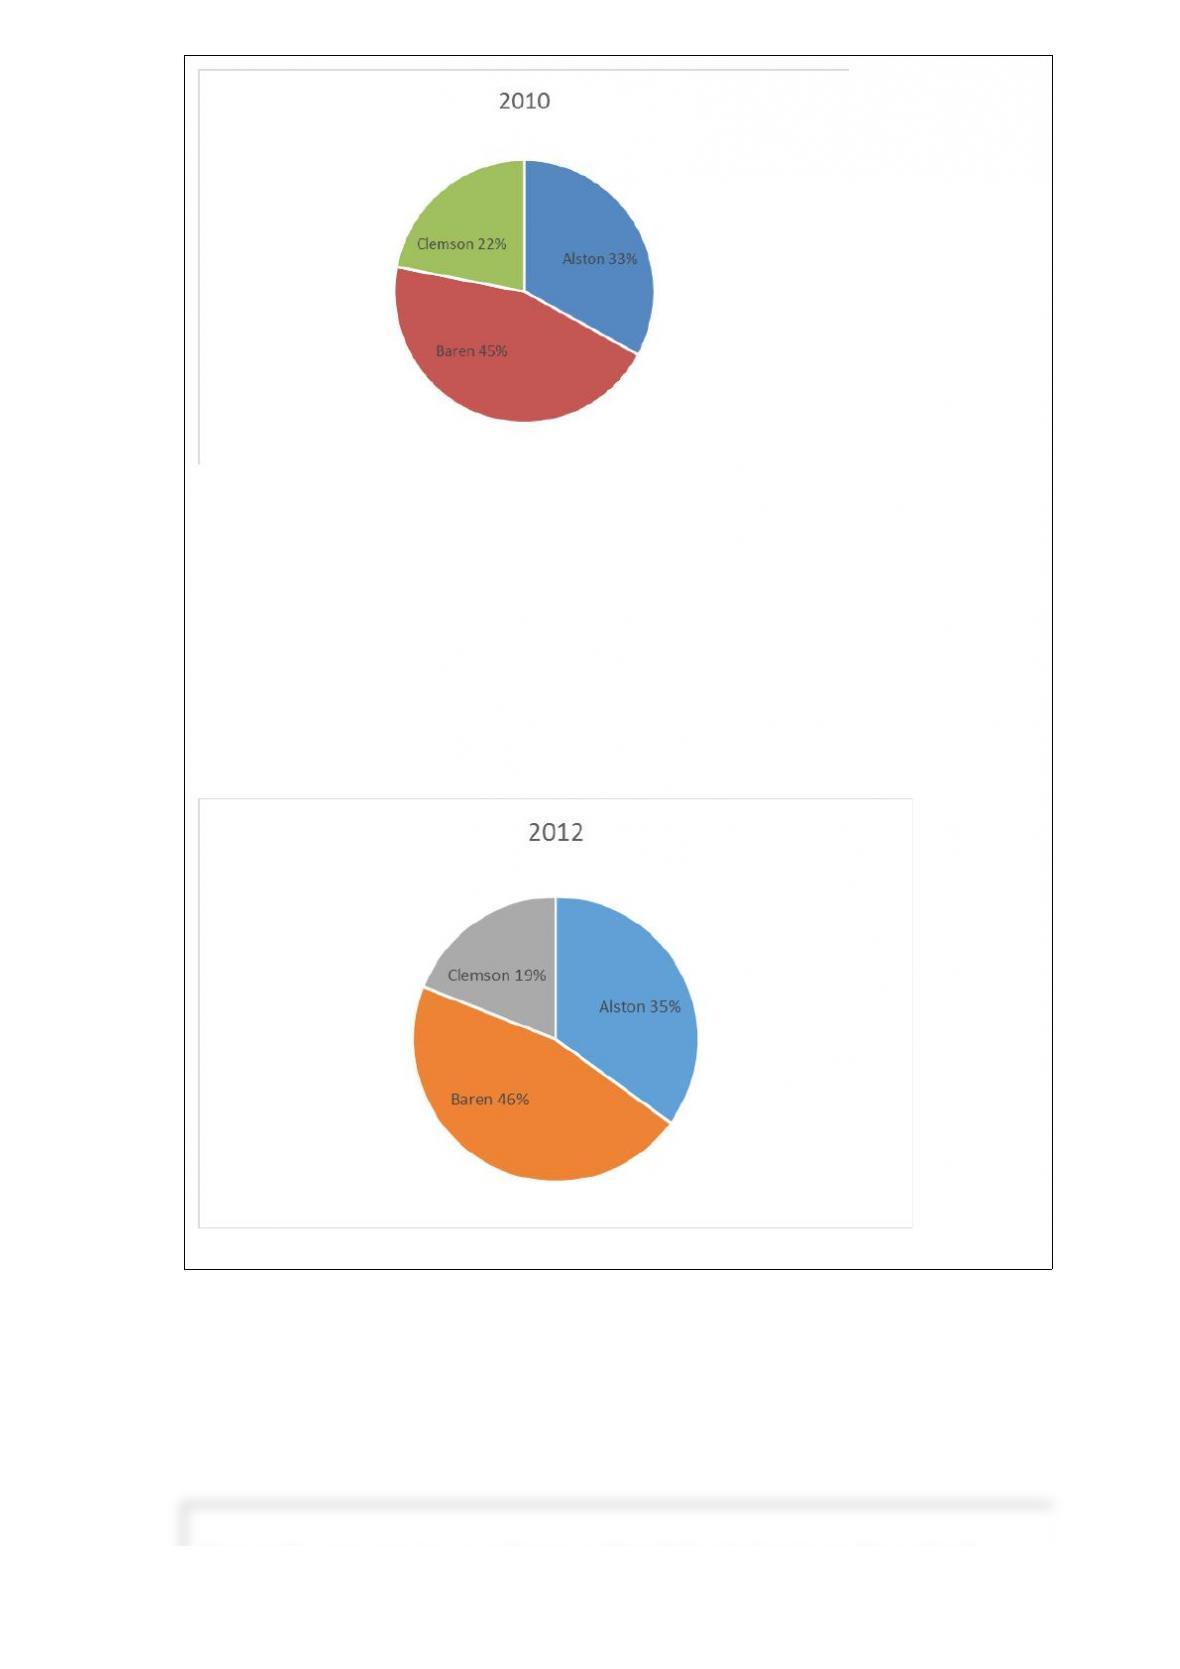
Baren’s sales in 2010 were ___________.
a) $342 million
b) $630 million
c) $675 million
d) $828 million
e)
$928 million

Discrete Components, Inc. manufactures a line of electrical resistors. Presently, the
carbon composition line is producing 100 ohm resistors. The population variance of
these resistors “must not exceed 4” to conform to industry standards. Periodically, the
quality control inspectors check for conformity by randomly select 10 resistors from the
line, and calculating the sample variance. The last sample had a variance of 4.36.
Assume that the population is normally distributed. Using = 0.05, the observed value of
chi-square is _________________.
a) 1.74
b) 1.94
c) 10.90
d) 9.81
e) 8.91
Higher output wattage means higher quality to some consumers of audio amplifiers.
Among Garvin’s five quality types, this is an example of ______________.
a) user quality
b) transcendent quality
c) product quality
d) manufacturing-based quality
e) value quality

A cancer research group surveys 100 women more than 40 years old to test the
hypothesis that 50% of women in this age group have regularly scheduled
mammograms. Forty of the women respond affirmatively. Using a= 0.05, the
alternative hypothesis is __________.
a) p < 0.50
b) p ≠ 0.50
c) p > 0.50
d) p =0.50
e) p ≠ 0.40
Suppose 40% of the population of pre-teens have a TV in their bedroom. If a random
sample of 500 pre-teens is drawn from the population, then the probability that between
36% and 44% of the pre-teens have a TV in their bedroom is _______.
a) 0.9644
b) 0.4644
c) 0.0356
d) 0.9328
e) 0.0712
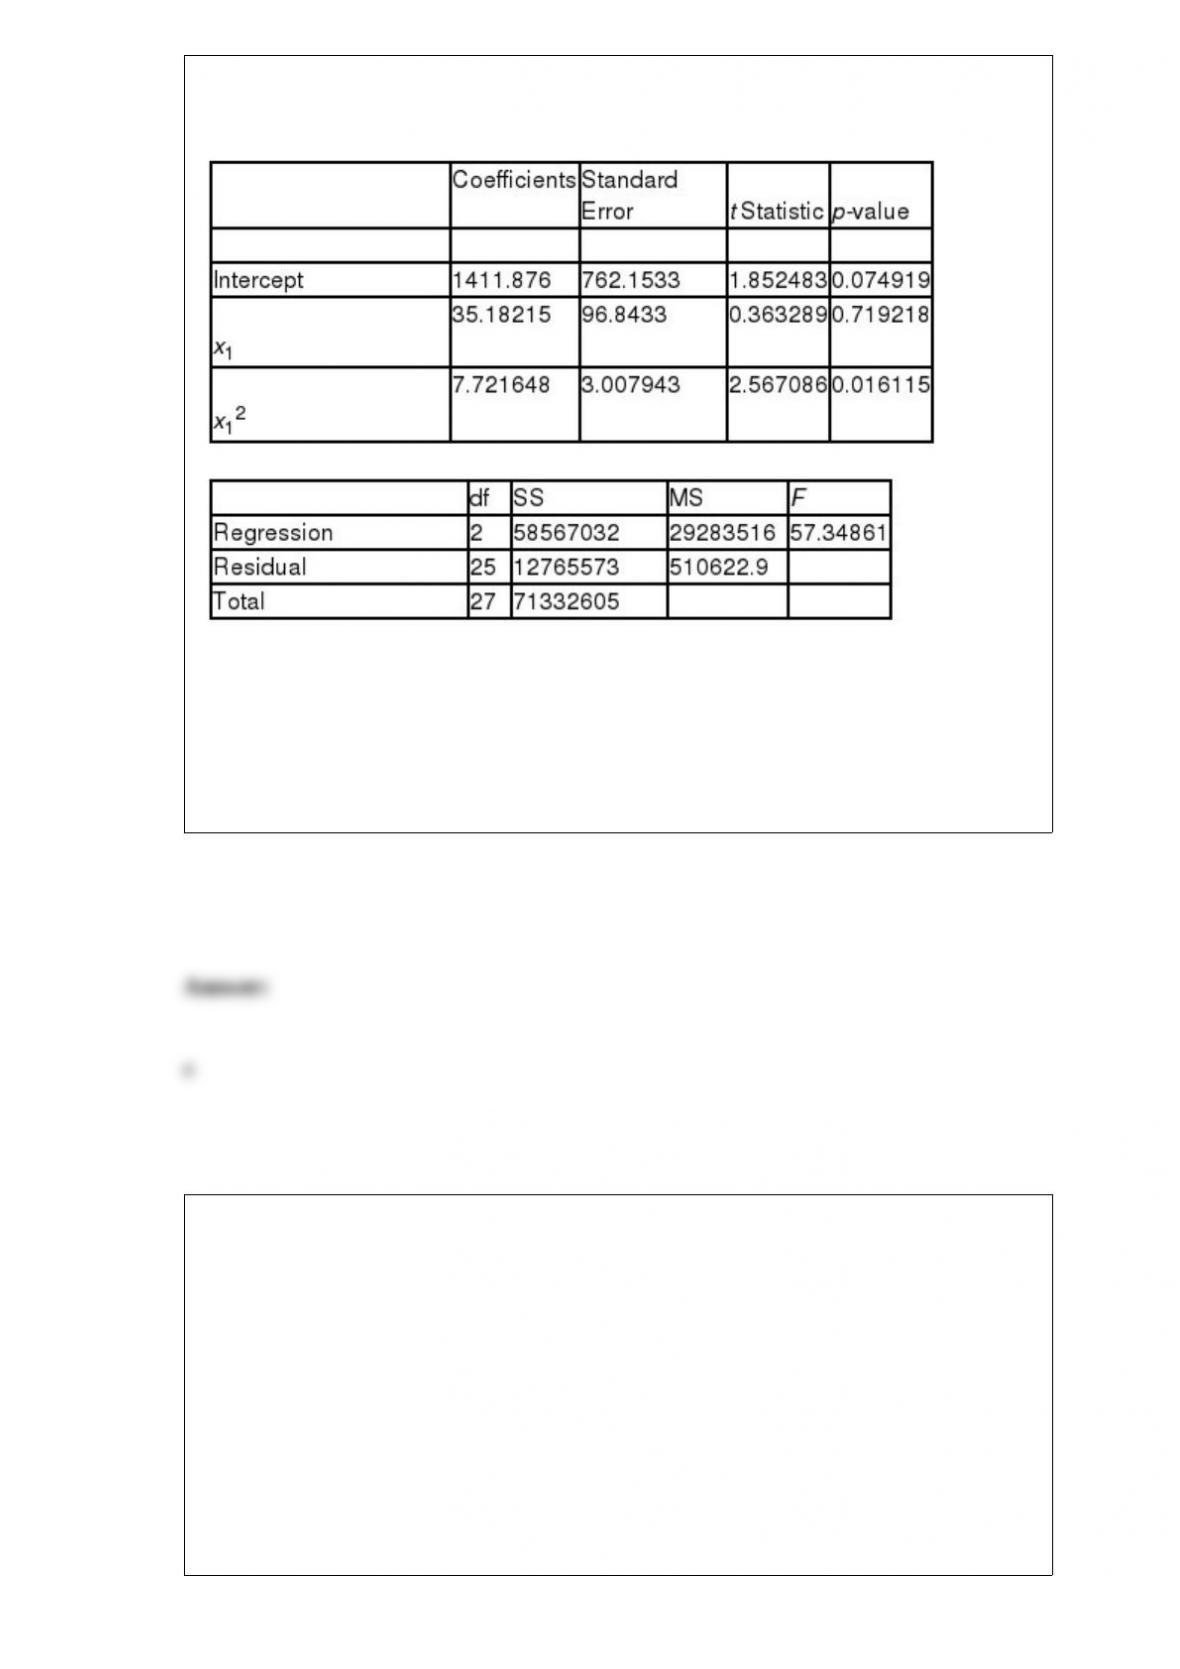
A multiple regression analysis produced the following tables.
Using
= 0.10 to test the null hypothesis H0:
2= 0, the critical t value is ____.
a) 1.316
b) 1.314
c) 1.703
d) 1.780
e) 1.708
A recognized brand name product means higher quality to many consumers. Among
Garvin’s five quality types, this is an example of ___________________.
a) user quality
b) transcendent quality
c) product quality
d) manufacturing-based quality
e) value quality
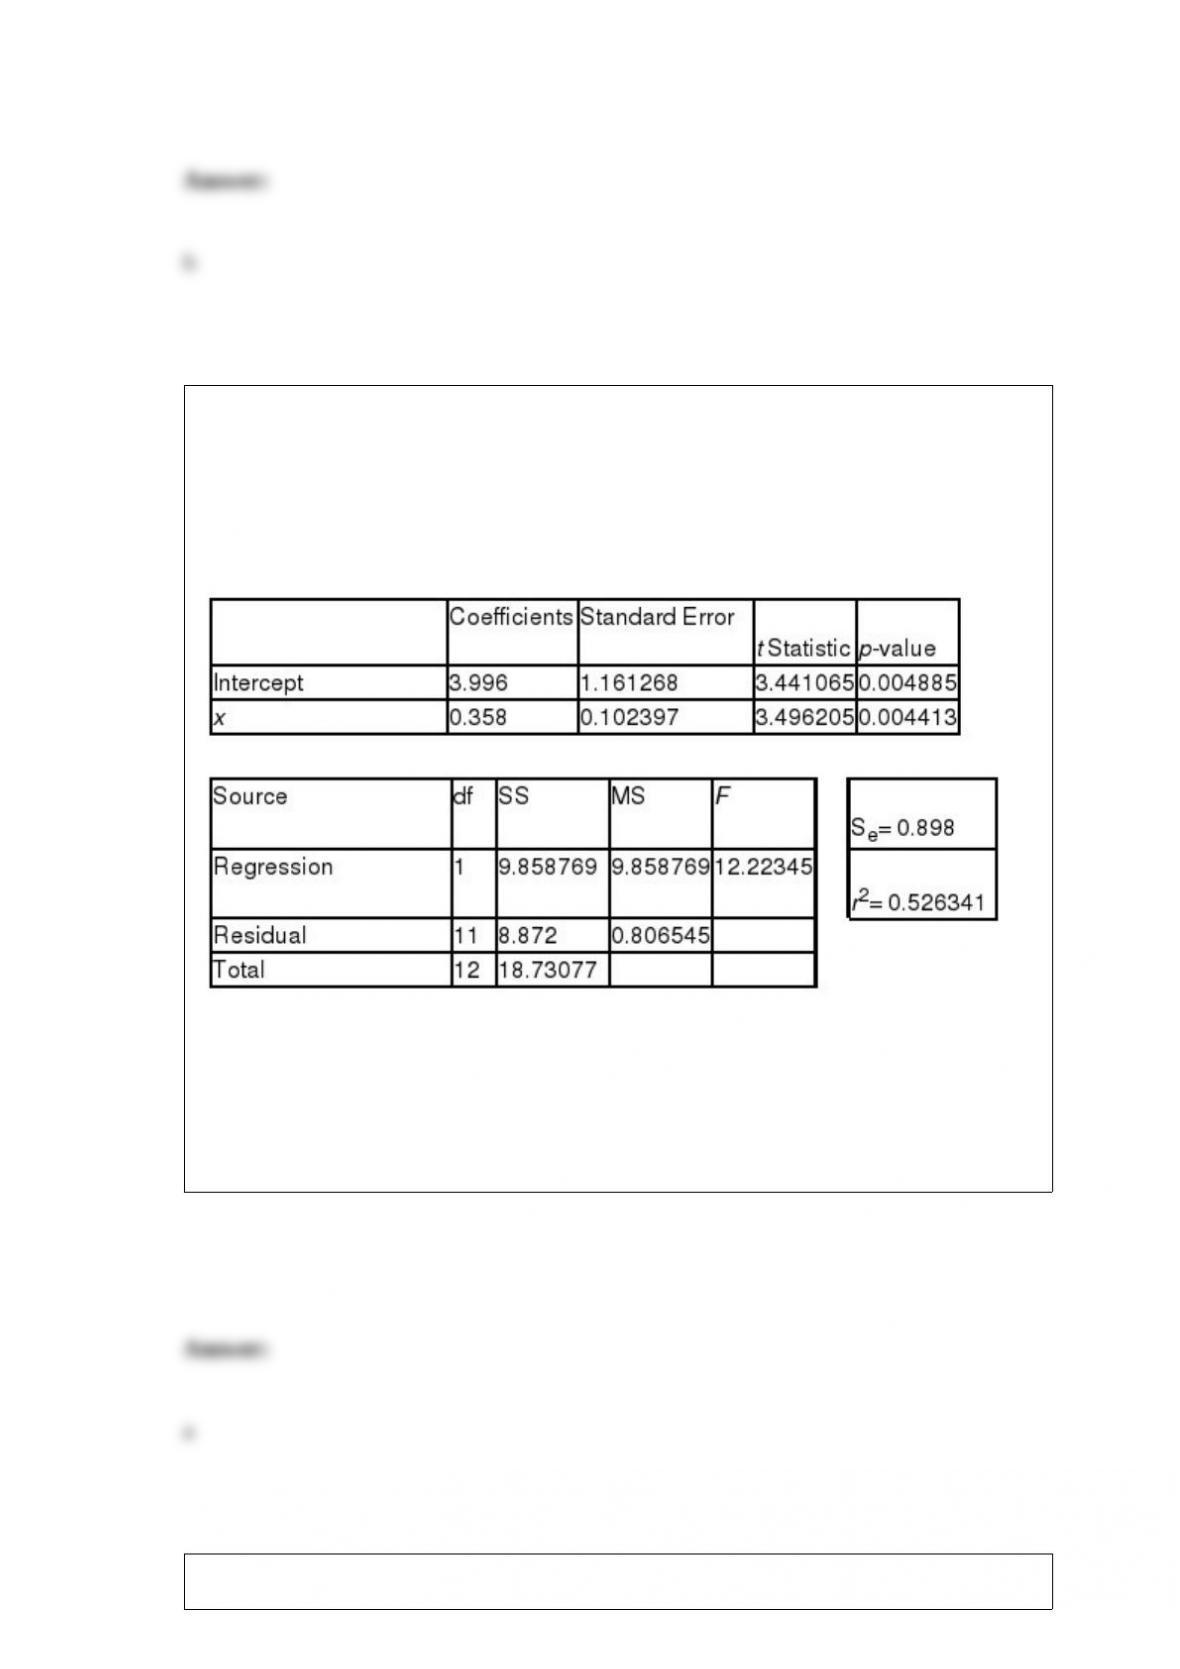
Louis Katz, a cost accountant at Papalote Plastics, Inc. (PPI), is analyzing the
manufacturing costs of a molded plastic telephone handset produced by PPI. Louis’s
independent variable is production lot size (in 1,000’s of units), and his dependent
variable is the total cost of the lot (in $100’s). Regression analysis of the data yielded
the following tables.
Louis’s sample size (n) is ________________.
a) 13
b) 14
c) 12
d) 24
e) 1
Circuit boards for wireless telephones are etched, in an acid bath, in batches of 100

boards. A sample of seven boards is randomly selected from each lot for inspection. A
particular batch contains two defective boards; and x is the number of defective boards
in the sample. P(x=0) is _______.
a) 0.1315
b) 0.8642
c) 0.0042
d) 0.6134
e) 0.8134
A market researcher is studying the use of coupons by consumers of varying ages. She
classifies consumers into four age categories and counts the number of grocery store
customers who use at least one coupon during check out. It is expected that data are
uniformly distributed across the four age categories. The observed data results in
frequencies of 22, 35, 32, and 21. Using
= .05, the critical chi”square value is
_______.
a) 13.277
b) 15.086
c) 7.8147
d) 11.070
e) 15.546
A researcher has developed a regression model from fifteen pairs of data points. He
wants to test if the slope is significantly different from zero. He uses a two”tailed test
and
= 0.10. The critical table t value is _______.
a) 1.771
b) 1.350
c) 1.761
d) 2.145
e) 2.068
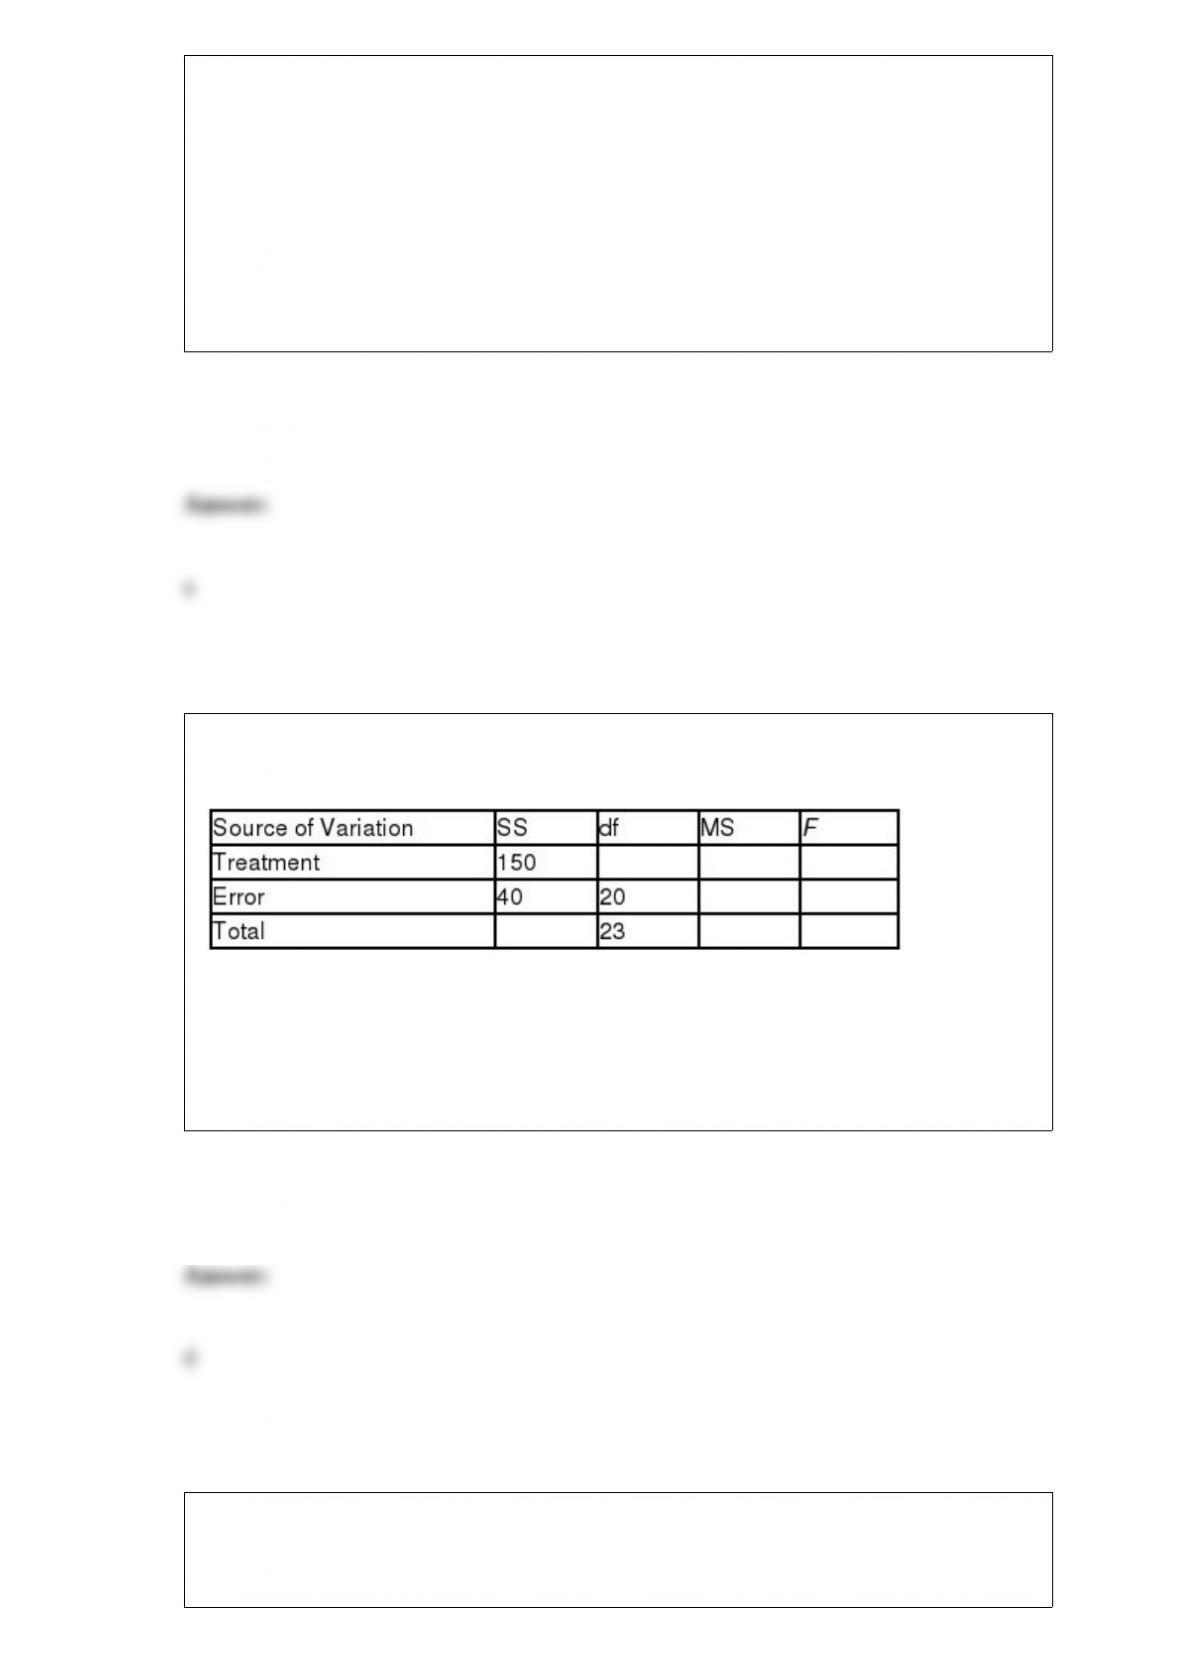
For the following ANOVA table, the MS Error value is ___________.
a) 20
b) 60
c) 800
d) 2
e) 200
If x is a binomial random variable withn=10 andp=0.8, the standard deviation of x is
_________.

a) 8.0
b) 1.26
c) 1.60
d) 64.0
e) 10
Suppose the total time to fill a routine prescription at a local pharmacy is 35 minutes
based on the time the physician places the order to the time it is dispensed. Assume the
standard deviation is 11 minutes. the z-score for x = 46 is ________.
a) 1.0
b) -1.0
c) 11
d) -11
e) .10
Trey Leeman, Operations Manager at National Consumers, Inc. (NCI), is evaluating
alternatives for increasing capacity at NCI’s Fountain Hill plant. He has identified four
alternatives, and has constructed the following payoff table which shows payoffs (in
$1,000,000’s) for the three possible levels of market demand.

If Trey uses the Hurwicz criterion with alpha = 0.1, the appropriate alternative would
be: _____________.
a) Lease New Equipment
b) Purchase New Equipment
c) Add Third Shift
d) Do Nothing
e) Do everything
Suppose the total time to fill a routine prescription at a local pharmacy is 35 minutes
based on the time the physician places the order to the time it is dispensed. Assume the
standard deviation is 11 minutes and the zscore is -1.3. What is x?
a) 20.7
b) 0.0
c) -14.3
d) 14.3
e) -20.7

A chi-square goodness of fit test is to be performed to see if data fit the Poisson
distribution. There are 8 categories, and lambda must be estimated. Alpha is chosen to
be 0.10. The critical (table) value of chi-square is _______.
a) 10.645
b) 12.017
c) 3.828
d) 16.812
e) 17.345
A business is attempting to find the best small town in the United States in which to
relocate. As part of the investigation, the elevations of all small towns in the United
States are researched. Some towns are located high in the Rockies with elevations over
8,000 feet. There are even some towns located in the south central valley of California
with elevations below sea level. These elevations can best be described as which level
of data?
a) Interval level
b) Ordinal level
c) Nominal level
d) Ratio level
e) Relative level

Participants in a 2 day biking event, cross the finish line at a rate of 10 bike riders per
fifteen minute interval. On average, how much time, in minutes, elapses between bike
riders?
a) 1.50
b) .0667
c) .1667
d) 1.00
e) 2.50
In decision-making under risk, the expected monetary value without information is
____________.
a) the weighted average of the best payoff for each state of nature
b) the largest of the EMVs for the different decision alternatives
c) never smaller than the expected monetary payoff with perfect information
d) the average of the EMVs
e) half the expected monetary value with information
Tamara Hill, fund manager of the Hill Value Fund, manages a portfolio of 250 common
stocks. Tamara is searching for a ‘low risk’ issue to add to the portfolio, i.e., one with a
price variance less than that of the S&P 500 index. Moreover, she assumes an issue is

not ‘low risk’ until demonstrated otherwise. Her staff reported that during the last nine
quarters the price variance for the S&P 500 index (population 1) was 25, and for the last
seven quarters the price variance for XYC common (population 2) was 8. Assume that
stock prices are normally distributed in the population. Using
= 0.05, the observed
Fvalue is _______.
a) 3.13
b) 0.32
c) 1.77
d) 9.77
e) 9.87
Which of the following tests might be used to compare the means of two populations if
the samples are related?
a) Mann-Whitney test
b) Wilcoxon test
c) Runs test
d) Spearman’s test
e) Kruskal-Wallis test
Ophelia O’Brien, VP of Consumer Credit of American First Banks (AFB), monitors the
default rate on personal loans at the AFB member banks. One of her standards is “no
more than 5% of personal loans should be in default.” On each Friday, the default rate
is calculated for a sample of 500 personal loans. Last Friday’s sample contained 30
defaulted loans. Using
= 0.01, the appropriate decision is _______.

a) reject the null hypothesis p > 0.05
b) do not reject the null hypothesisp = 0.05
c) reject the null hypothesis
> 30
d) do not reject the null hypothesis
30
e) do nothing
A cancer research group surveys 100 women more than 40 years old to test the
hypothesis that 50% of women in this age group have regularly scheduled
mammograms. Forty of the women respond affirmatively. Using a= 0.05, the
appropriate decision is ________.
a) do not reject the null hypothesisp ≠0.50
b) reject the null hypothesisp = 0.50
c) reject the null hypothesis p < 0.50
d) p < 0.50
e) do nothing