
Lube-Tech is a major chain whose primary business is performing lube and oil changes
for passenger vehicles. The national operations manager has stated in an industry
newsletter that the mean number of miles between oil changes for all passenger cars
exceeds 4,200 miles. To test this, an industry group has selected a random sample of
100 vehicles that have come into a lube shop and determined the number of miles since
the last oil change and lube. The sample mean was 4,278 and the standard deviation
was known to be 780 miles. Based on this information, the p-value for the hypothesis
test is less than 0.10.
Two samples are said to be independent if they are collected at different points in time.
A manufacturing company is interested in predicting the number of defects that will be
produced each hour on the assembly line. The managers believe that there is a
relationship between the defect rate and the production rate per hour. The managers
believe that they can use production rate to predict the number of defects. The
following data were collected for 10 randomly selected hours.
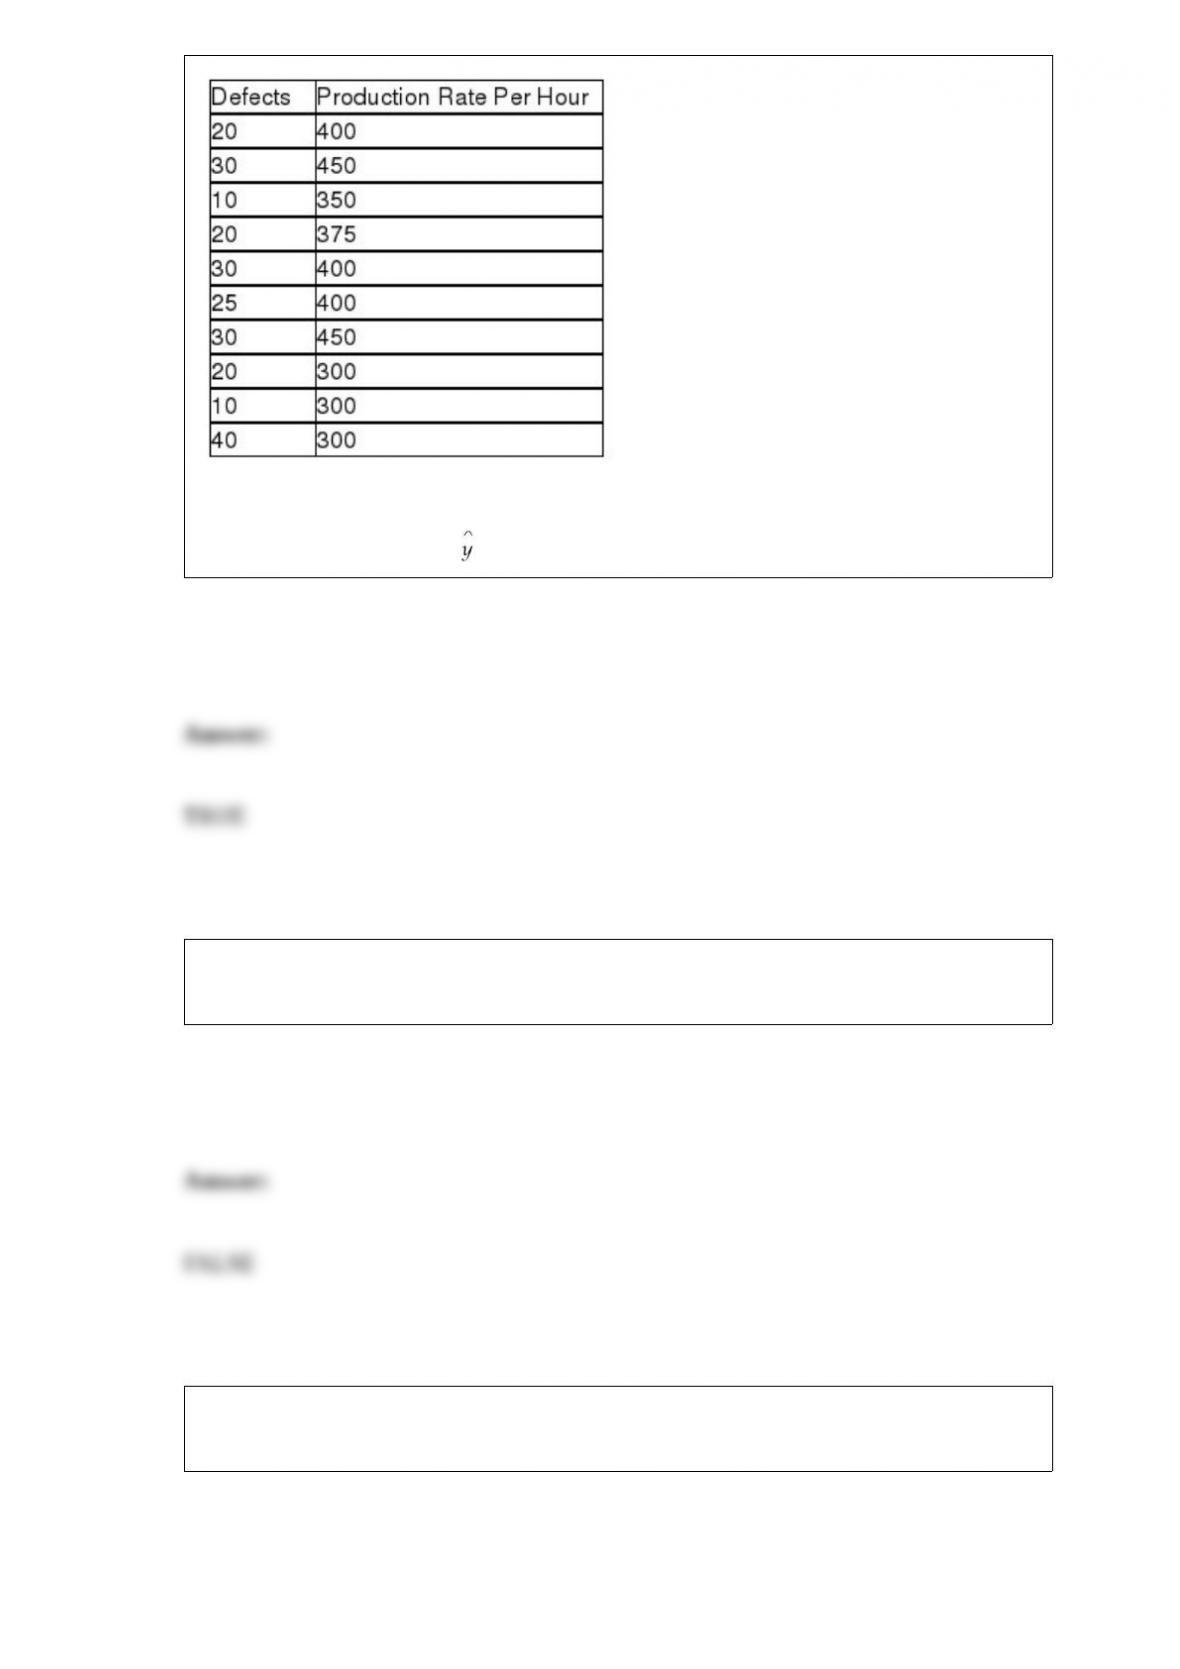
Given these sample data, the simple linear regression model for predicting the number
of defects is approximately = 5.67 + 0.048x.
If you suspect that your time-series data has a strong downward trend, you should set
the beta smoothing constant at value fairly close to negative 1.0
The term one-way analysis of variance refers to the fact that in conducting the test,
there is only one way to set up the null and alternative hypotheses.

In a study of 30 customers’ utility bills in which the monthly bill was the dependent
variable and the number of square feet in the house is the independent variable, the
resulting regression model is = 23.40 + 0.4x. Given this, the sample correlation
coefficient is known to be positive.
In a one-way analysis of variance design, there is a single factor of interest but there
may be multiple levels of the factor.
A study of cars arriving at a parking structure at the local airport shows that the time
between arrivals is 1.2 minutes and is exponentially distributed. The probability that
more than 2 minutes will elapse between the arrivals of cars is about 0.81.
Common cause variation is variation in the output of a process that is unexpected and
has an assignable cause.
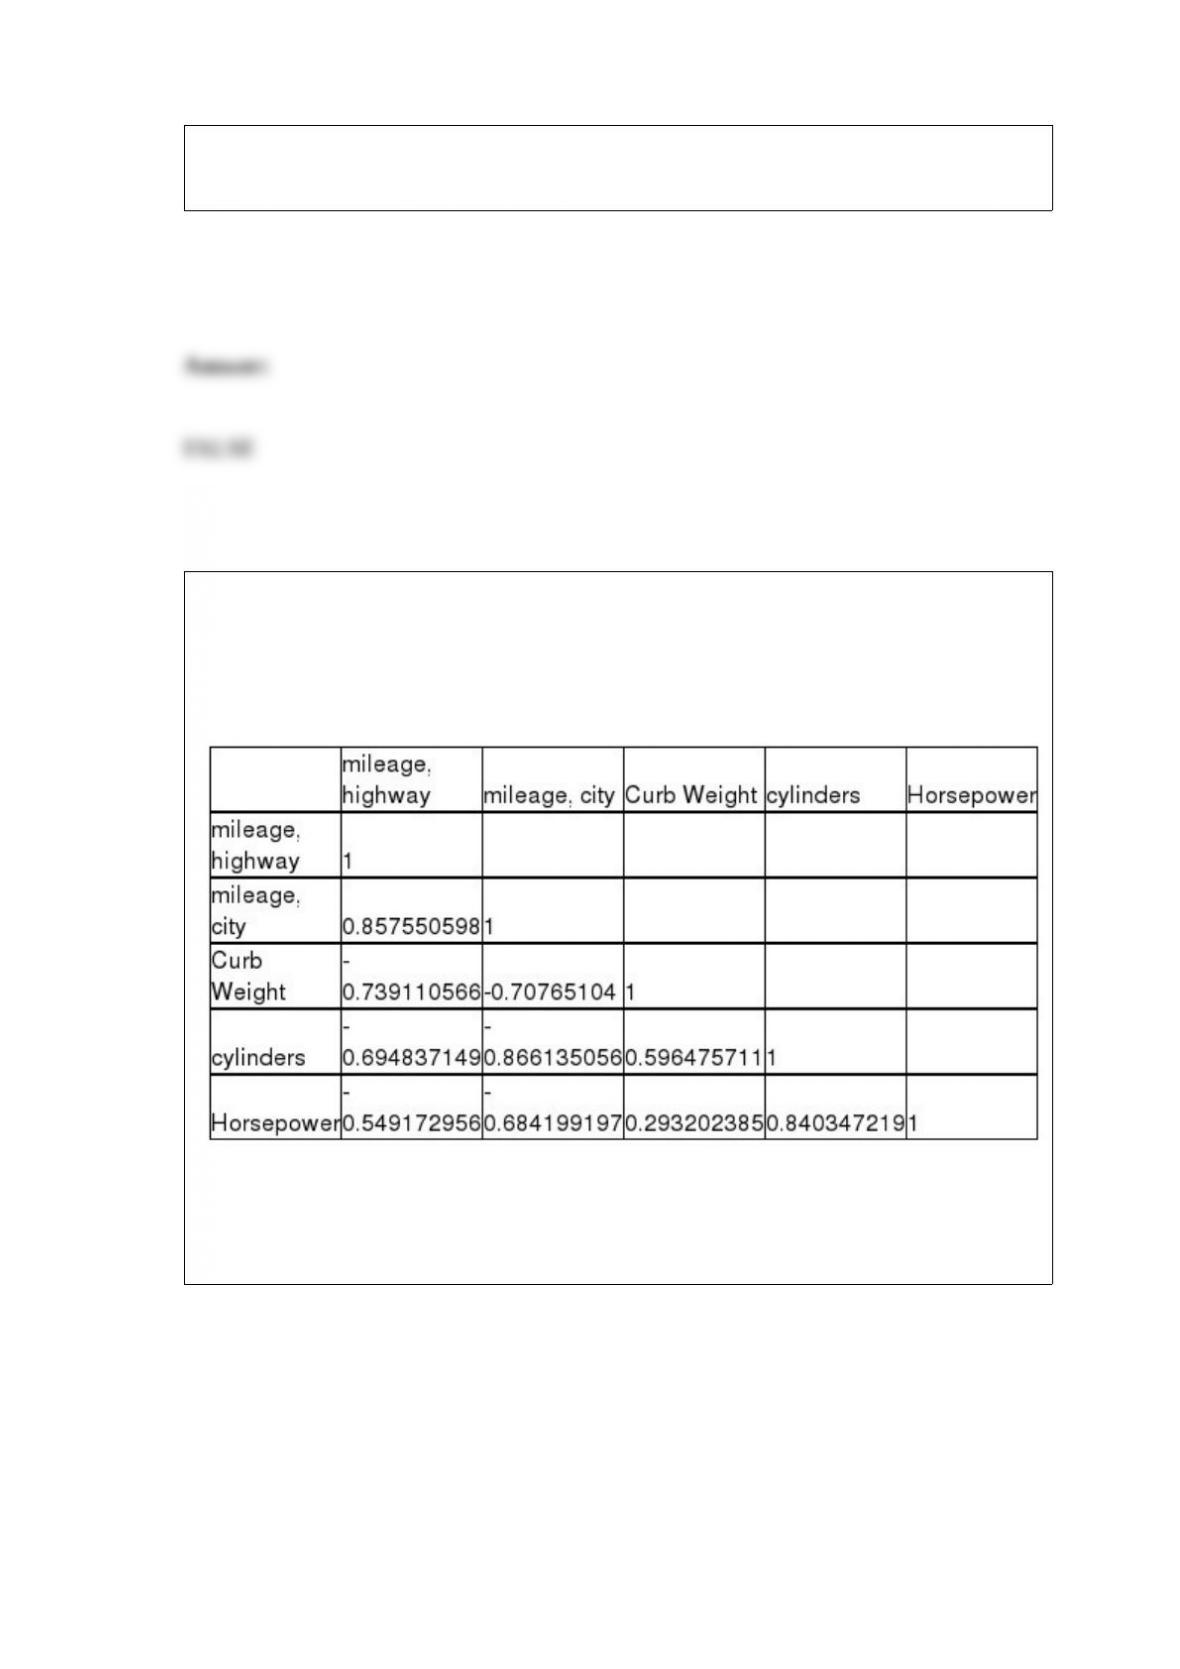
A major car magazine has recently collected data on 30 leading cars in the U.S. market.
It is interested in building a multiple regression model to explain the variation in
highway miles. The following correlation matrix has been computed from the data
collected:
The analysts also produced the following multiple regression output using curb weight,
cylinders, and horsepower as the three independent variables. Note, a number of the
output fields are missing, but can be determined from the information provided.
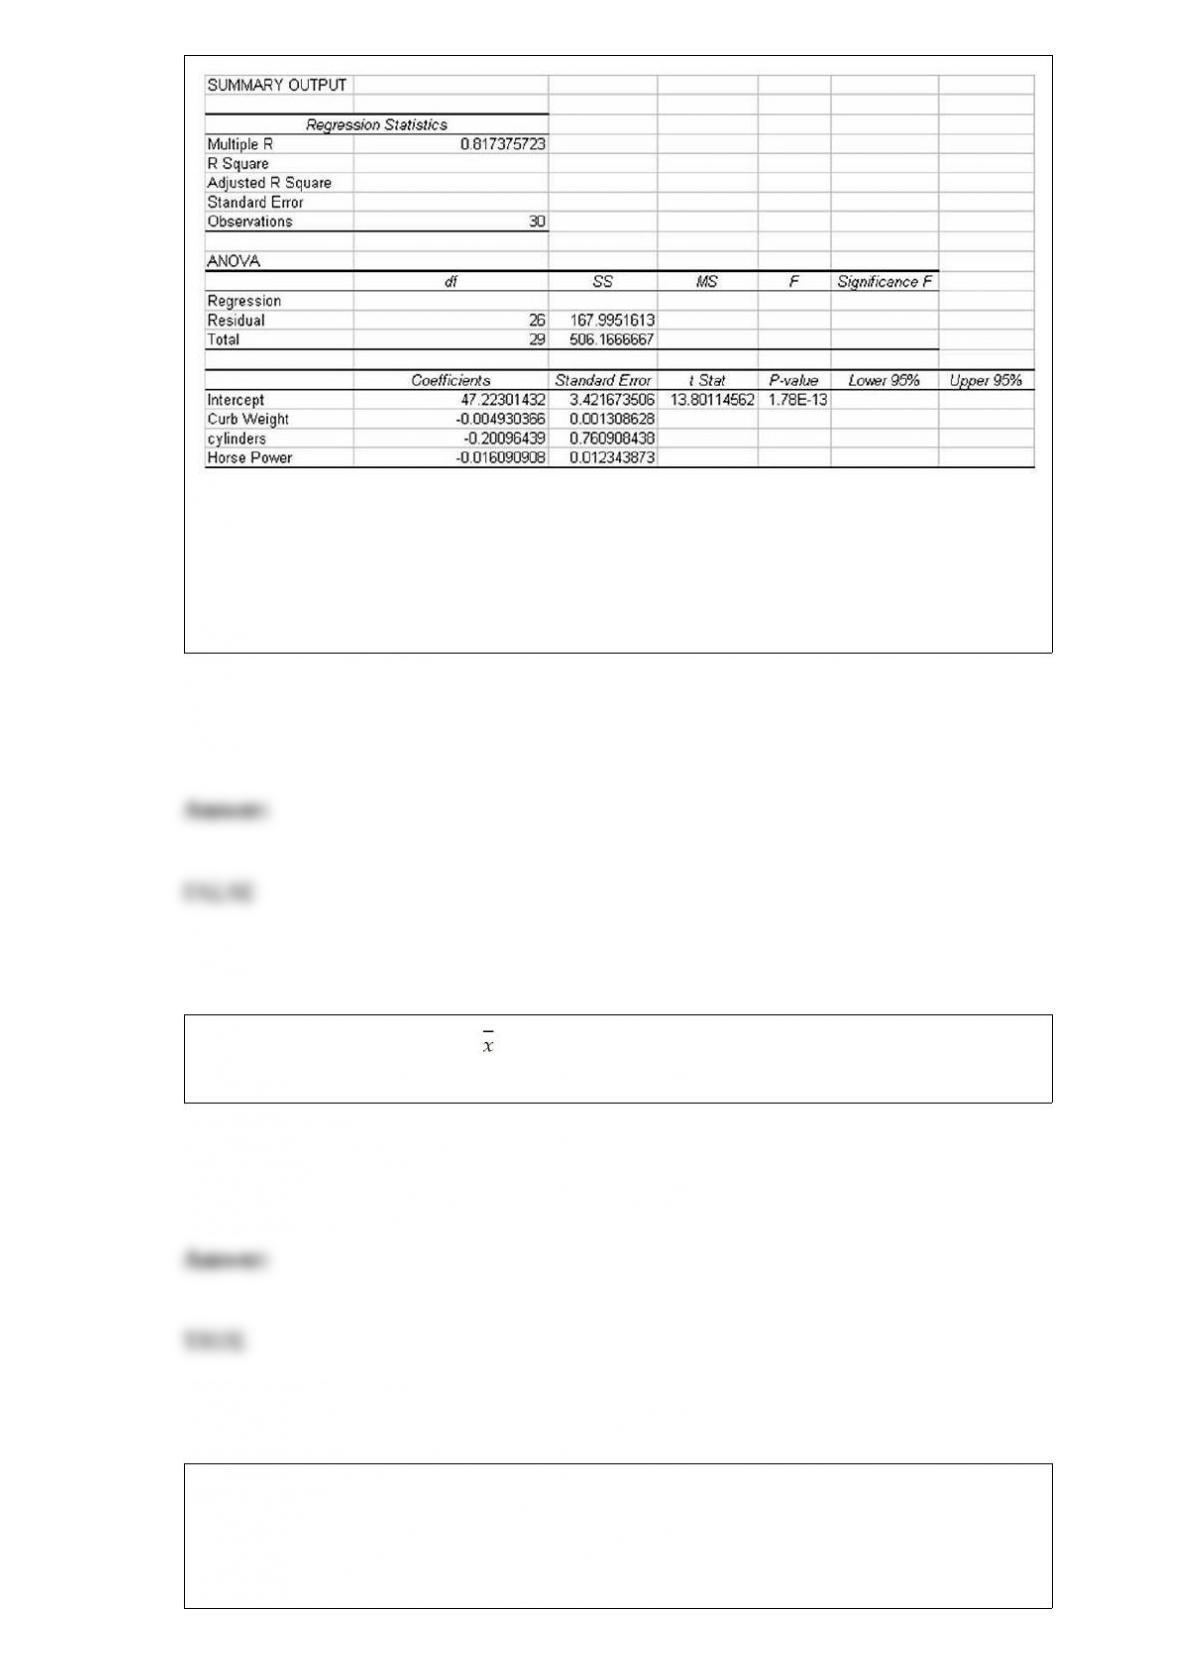
If the analysts are interested in testing whether the overall regression model is
statistically significant, the appropriate null and alternative hypotheses are:
H0: β1= β2= β3
Ha: β1≠ β2≠ β3
The sampling distribution for is actually the distribution of possible sampling error for
samples of a given size selected at random from the population.
A national car rental agency is interested in determining whether the mean days that
customers rent cars is the same between three of its major cities. The following data
reflect the number of days people rented a car for a sample of people in each of three
cities. Assuming that a one-way analysis of variance is to be performed, the value of the

test statistic is approximately F = 3.4.
We expect virtually all the data in a stable process to fall within 2 standard deviations of
the mean.
In a hypothesis test, the p-value measures the probability that the alternative hypothesis
is true.

In conducing one-way analysis of variance, the population distributions are assumed
normally distributed.
Lube-Tech is a major chain whose primary business is performing lube and oil changes
for passenger vehicles. The national operations manager has stated in an industry
newsletter that the mean number of miles between oil changes for all passenger cars
exceeds 4,200 miles. To test this, an industry group has selected a random sample of
100 vehicles that have come into a lube shop and determined the number of miles since
the last oil change and lube. The sample mean was 4,278 and the sample standard
deviation was 780 miles. Based on this information, the test statistic is approximately t
= 1.000.
If a random variable is discrete, it means that the outcome for the random variable can
take on only one of two possible values.

The NCAA is interested in estimating the difference in mean number of daily training
hours for men and women athletes on college campuses. They want 95 percent
confidence and will select a sample of 10 men and 10 women for the study. If the
NCAA assumes that the population standard deviations are known, the critical value for
the confidence interval is t = 2.1009.
When performing a hypothesis test for the difference between the means of two
independent populations, where the standard deviations are known, the variances must
be assumed equal.
If the correlation of x and y is -0.65, then coefficient of determination is -0.4225.
The concept of margin of error applies directly when estimating a population mean, but
is not appropriate when estimating a population proportion.

In a study of 30 customers’ utility bills in which the monthly bill was the dependent
variable and the number of square feet in the house is the independent variable, the
resulting regression model is = 23.40 + 0.4x. Based on this model, the expected utility
bill for a customer with a home with 2,300 square feet is approximately $92.00.
Sampling error can be eliminated if the sample size is large enough.
The makers of furnace filters recently conducted a test to determine whether the median
number of particulates that would pass through their four leading filters was the same. A
random sample of 6 of each type of filter was used with the following data being
recorded:

If the Kruskal-Wallis test is used, the critical value for an alpha = .05 is 7.814
Selection bias occurs when the respondent decides which of the questions on the survey
to answer.
Mutually exclusive means that the occurrence of event A has no effect on the
probability of the occurrence of event B, and independent means the occurrence of
event A prevents the occurrence of event B.

The sampling distribution for a goodness-of-fit test is the Poisson distribution.
When using the Histogram tool in Excel to construct a frequency distribution and
histogram, if the first bin value is 10 and the second bin value is 20, the frequency count
for the second class will include all values from 10 up to, but not including, 20.
On a scatter diagram, the independent variable should be placed on the horizontal axis
and the dependent variable should be placed on the vertical axis.
A decision maker is considering constructing a multiple regression model with two
independent variables. The correlation between x1 and y is 0.70, and the correlation
between variable x2 and y is 0.50. Based on this, the regression model containing both

independent variables will explain 74 percent of the variation in the dependent variable.
To find the pooled standard deviation involves taking a weighted average of the two
sample variances, then finding its square root.
Suppose a player is dealt 2 cards from a standard deck of 52 playing cards. To
determine the probability of having a blackjack would involve classical probability.
A major car magazine has recently collected data on 30 leading cars in the U.S. market.
It is interested in building a multiple regression model to explain the variation in
highway miles. The following correlation matrix has been computed from the data
collected:
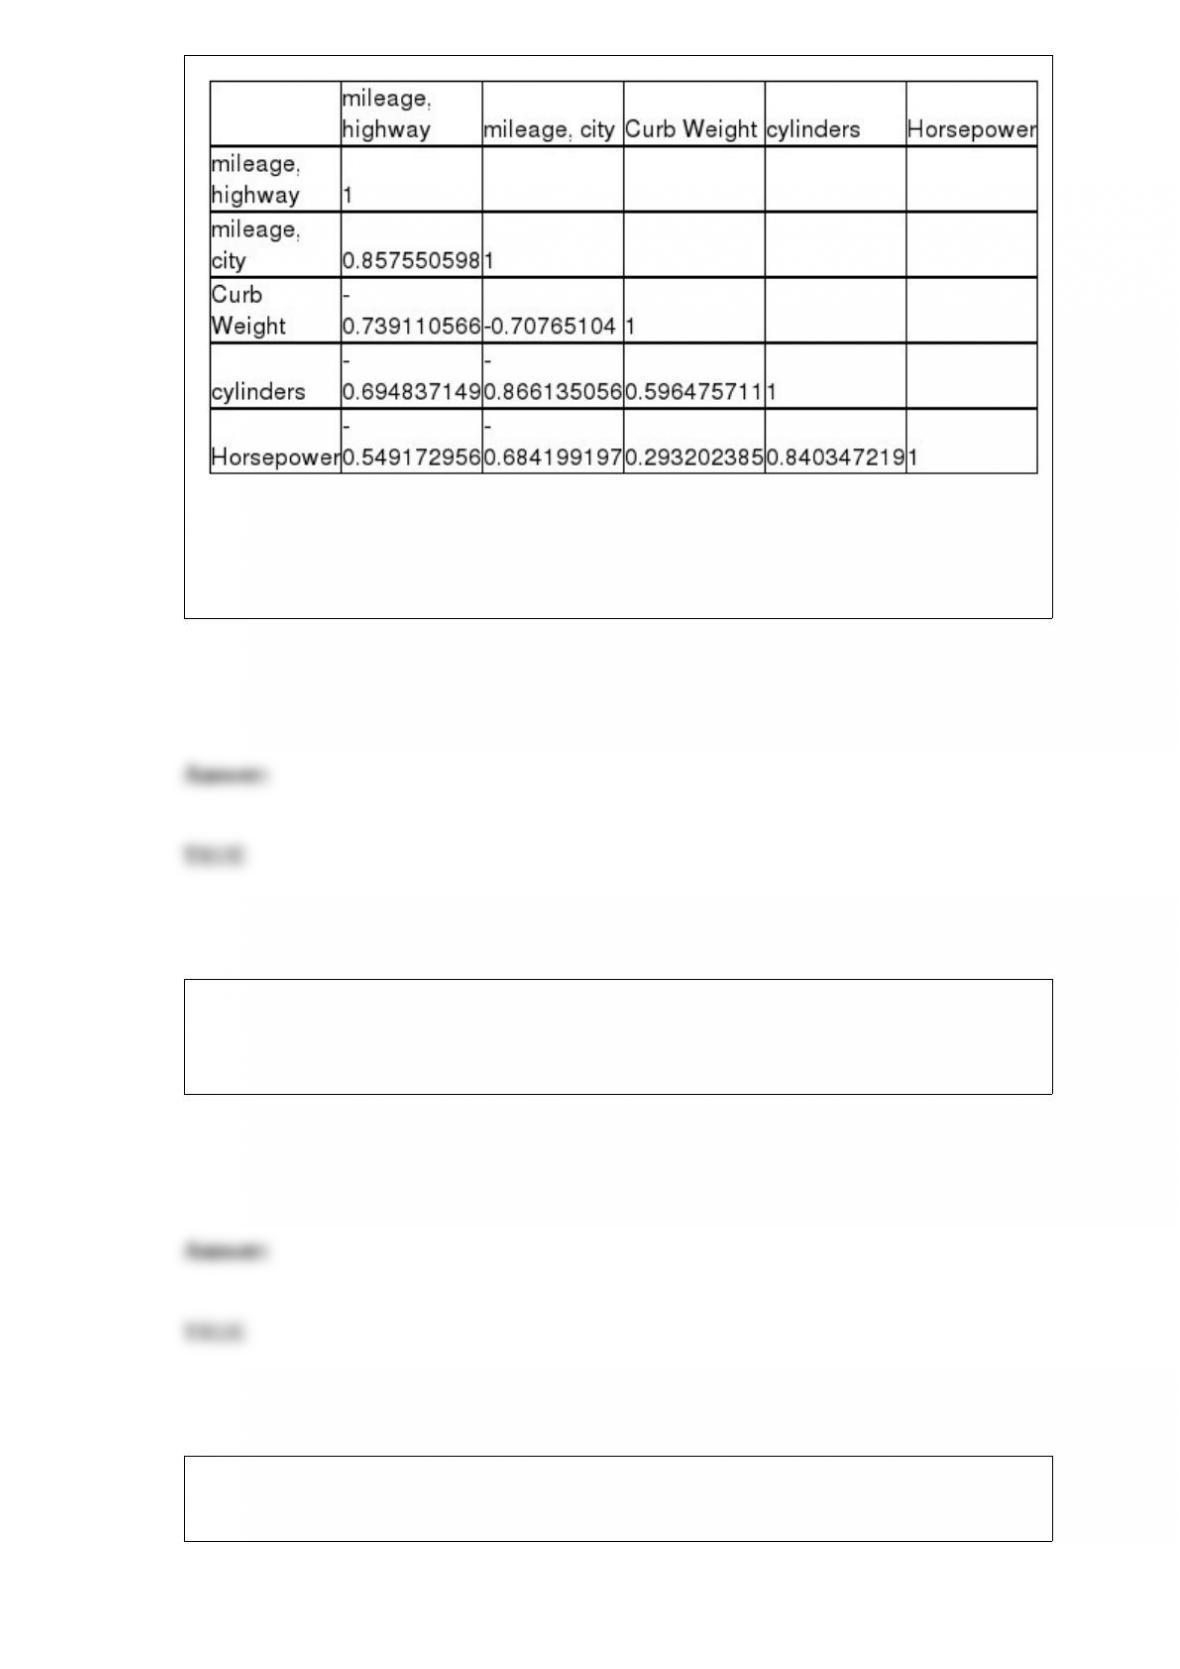
If the independent variables, curb weight, cylinders, and horsepower are used together
in a multiple regression model, there may be a potential problem with multicollinearity
since horsepower and cylinders are highly correlated.
The time required to assemble two components into a finished part is recorded for each
employee at the plant. The resulting random variable is an example of a continuous
random variable.
A variable that has all the properties of an interval variable, but also has a true zero, is a
ratio level variable.

Which of the following types of questions provide the respondent with the greatest
choice in responding to a question?
A) Open-end questions
B) Close-end questions
C) Multiple choice questions
D) True/false questions
Assume that 4 populations are to be compared using a Kruskal-Wallis one-way analysis
of variance. What is the critical value using a 0.05 level of significance?
A) 5.9915
B) 6.2514
C) 7.8147
D) 9.4877

In order to compute the mean and standard deviation, the level of data measurement
should be:
A) ratio or interval.
B) qualitative.
C) nominal.
D) ordinal.
A fast food restaurant that sells burritos is concerned about the variability in the amount
of filling that different employees place in the burritos. To achieve product consistency
it needs this variability to be no more than 1.7 ounces. A sample of n = 18 burritos
showed a sample variance of 2.89 ounces. Using a 0.10 level of significance, what can
you conclude?
A) The standards are being met since (test statistic) < (critical value).
B) The standards are not being met since (test statistic) > (critical value).
C) The standards are being met since (test statistic) > (critical value).
D) The standards are not being met since (test statistic) < (critical value).

The Wisconsin Dairy Association is interested in estimating the mean weekly
consumption of milk for adults over the age of 18 in that state. To do this, they have
selected a random sample of 300 people from the designated population. The following
results were recorded:
Given this information, if the leaders wish to estimate the mean milk consumption with
90 percent confidence, what is the approximate margin of error in the estimate?
A) z = 1.645
B) 12.996 ounces
C) 0.456 ounce
D) 0.75 ounce
Which of the following is the difference between forward selection and standard
stepwise regression?
A) In the standard stepwise regression, variables that were added at earlier steps can be
removed at later steps, which is not the case with forward selection.
B) The standard stepwise approach will generally produce a regression model with a
higher R-square value than the forward selection approach.
C) Forward selection begins by selecting the variable with the highest correlation with
the dependent variable and then proceeds to select subsequent variables in order of their
F-to-enter value, while standard stepwise selects the variables in the order specified by
the decision maker and then removes them from the model as needed.
D) There are no appreciable differences between the two methods, just different names
for the same technique.

The management of a department store is interested to estimate the difference in the
amount of money spent by female and male shoppers. You are given the following
information.
A 95 percent confidence interval estimate for the difference between the average
purchases of the customers using the two different credit cards is:
A) 49 to 64
B) 11.68 to 18.32
C) 125 to 140
D) 8 to 10
A random variable, x, has a normal distribution with μ = 13.6 and σ = 2.90. Determine a
value, x0, so that P(μ – x0 ≤ x ≤ μ + x0) = 0.95.
A) 7.916
B) 4.535
C) 3.178
D) 9.425

The State Department of Weights and Measures is responsible for making sure that
commercial weighing and measuring devices, such as scales, are accurate so customers
and businesses are not cheated. Periodically, employees of the department go to
businesses and test their scales. For example, a dairy bottles milk in 1-gallon containers.
Suppose that if the filling process is working correctly, the mean volume of all gallon
containers is 1.00 gallon with a standard deviation equal to 0.10 gallon. The
department’s test process requires that they select a random sample of n = 9 containers.
If the sample mean is less than 0.97 gallons, the department will fine the dairy. Based
on this information, what is the probability that the dairy will get fined even when its
filling process is working correctly?
A) 0.90
B) Approximately 0.3159
C) About 0.1841
D) Approximately 0.3821
If time-series data exhibit a seasonal pattern, which of the following approaches could
be used to compute season indexes?
A) The exponential smoothing technique
B) The multiplicative model
C) The Pearson product-moment approach

D) None of the above
Given a population in which the probability of success is p =0.20, if a sample of 500
items is taken, then calculate the probability the proportion of successes in the sample
will be between 0.18 and 0.23.
A) 0.7812
B) 0.8221
C) 0.9212
D) 0.6812
Hypothesis testing and estimation are two statistical tools that are used to draw
inferences about a large data set based on a subset of the data.
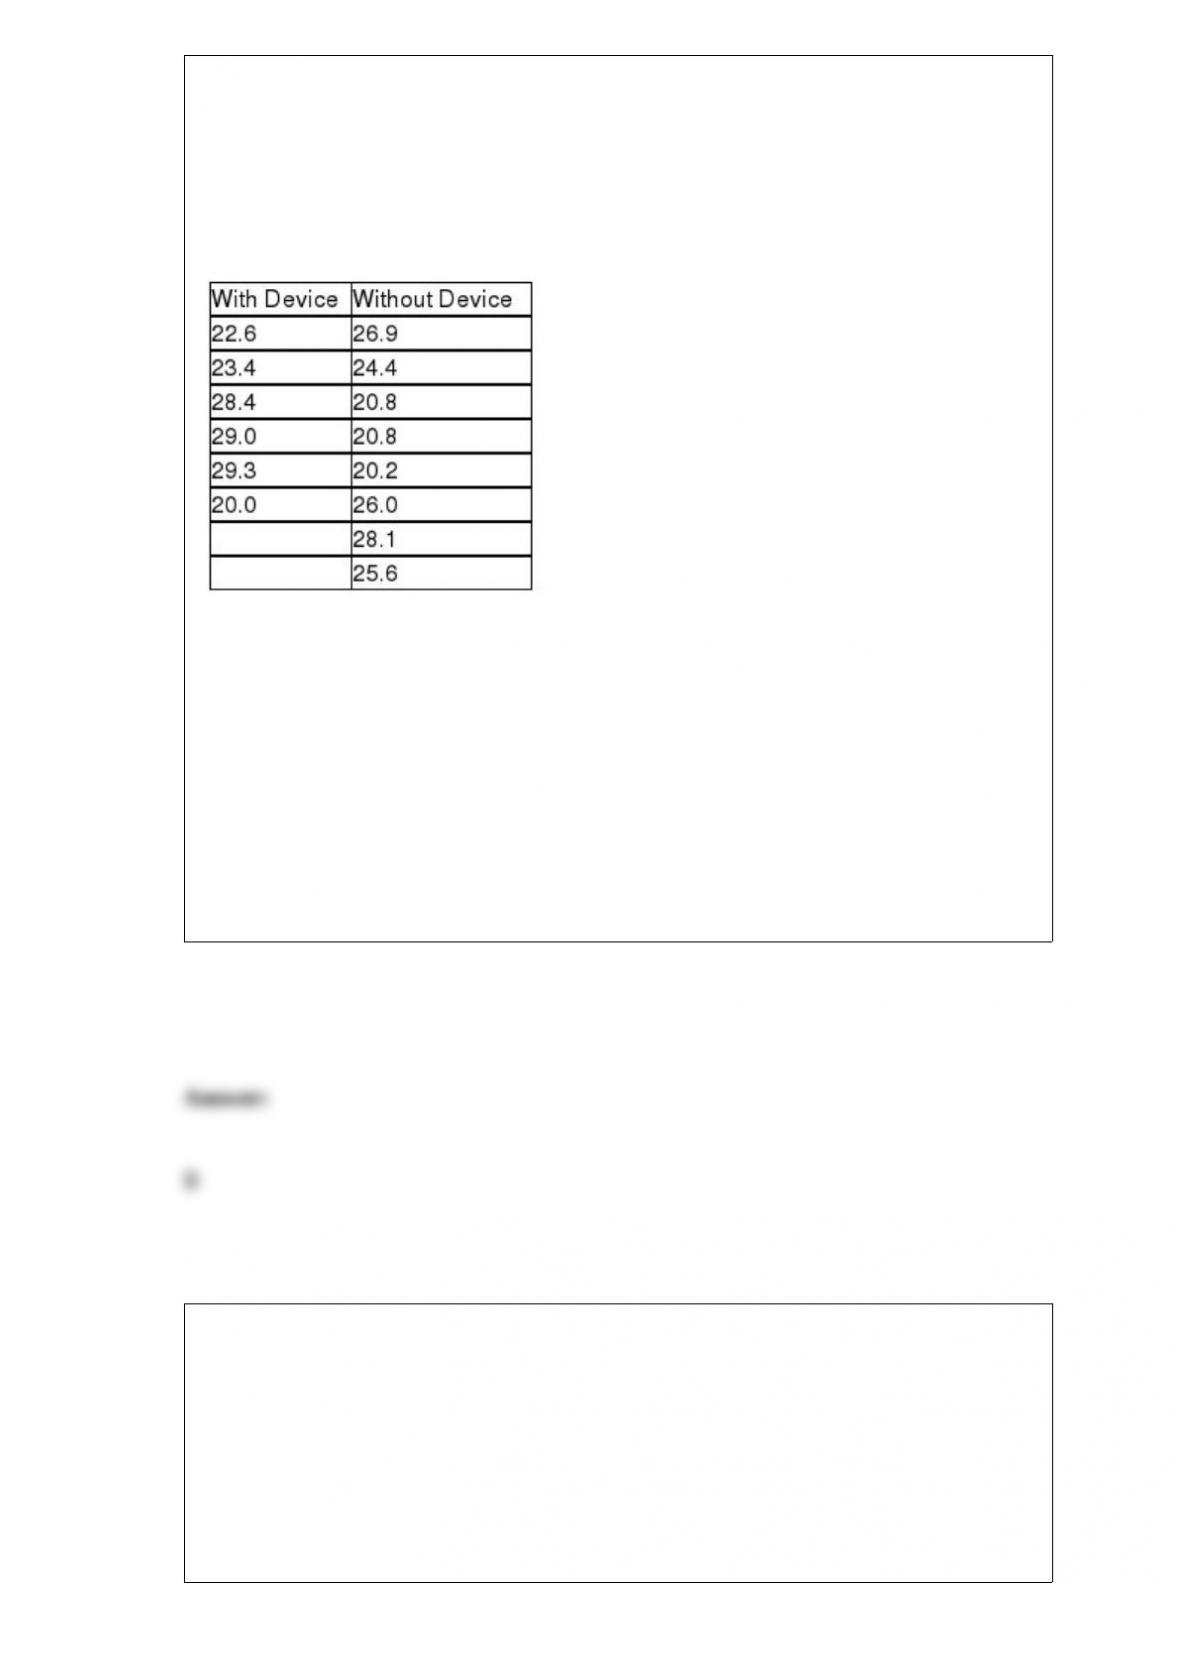
A company in Maryland has developed a device that can be attached to car engines,
which it believes will increase the miles per gallon that cars will get. The owners are
interested in estimating the difference between mean mpg for cars using the device
versus those that are not using the device. The following data represent the mpg for
random independent samples of cars from each population. The variances are assumed
equal and the populations normally distributed.
Given this data, what is the upper limit for a 95 percent confidence interval estimate for
the difference in mean mpg?
A) Approximately 3.88 mpg
B) About 5.44 mpg
C) Just under 25.0
D) None of the above
Three events occur with probabilities P(E1) = 0.35, P(E2) = 0.15, P(E3) = 0.40. If the
event B occurs, the probability becomes P(E1|B) = 0.25, P(B) = 0.30. Calculate P(E1
and B).
A) 0.575
B) 0.075
C) 0.021
D) 0.475
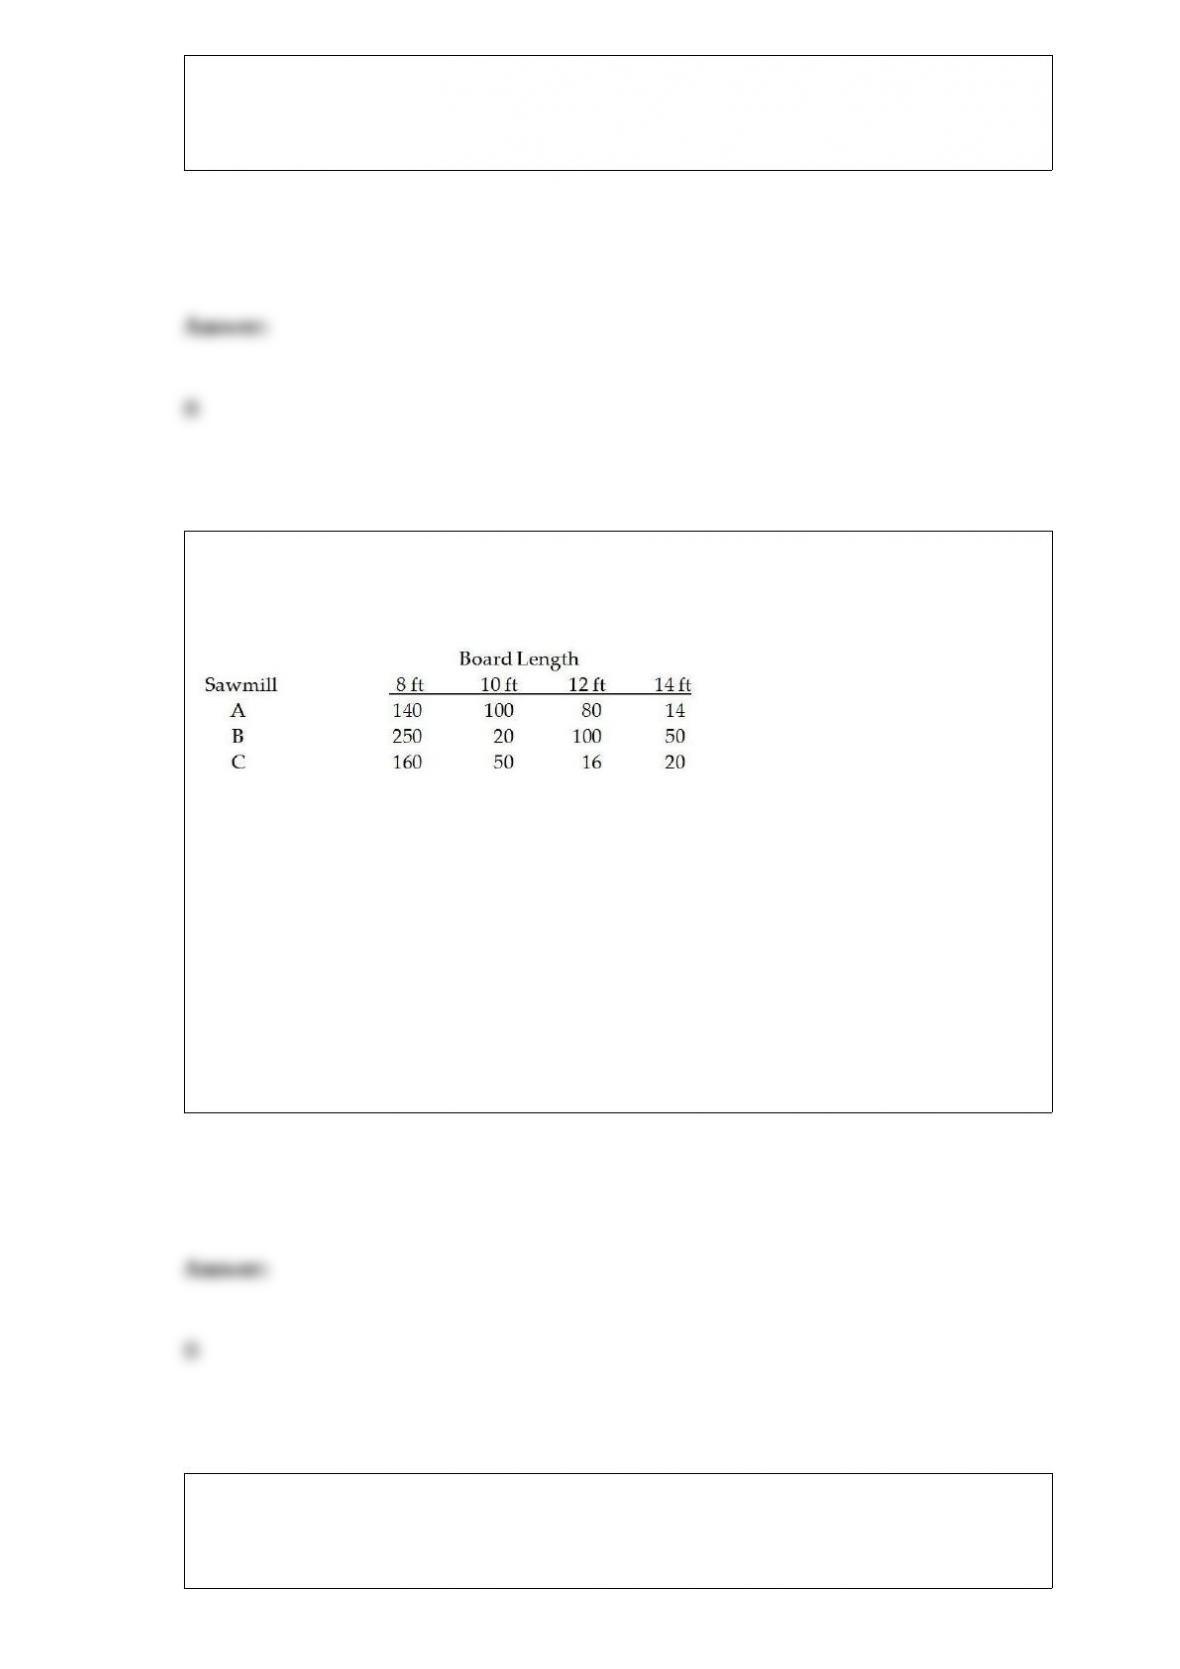
The Anderson Lumber Company has three sawmills that produce boards of different
lengths. The following table is a joint frequency distribution based on a random sample
of 1,000 boards selected from the lumber inventory.
Based on these data, if a board is selected that is 12 feet long, the probability that it was
made at sawmill A is:
A) 0.08
B) 0.41
C) 0.24
D) 0.20
Most major airlines allow passengers to carry two pieces of luggage (of a certain
maximum size) onto the plane. However, their studies show that the more carry-on
baggage passengers have, the longer it takes to unload and load passengers. One

regional airline is considering changing its policy to allow only one carry-on per
passenger. Before doing so, it decided to collect some data. Specifically, a random
sample of 1,000 passengers was selected. The passengers were observed, and the
number of bags carried on the plane was noted. Out of the 1,000 passengers, 345 had
more than one bag.
Based on this sample, develop and interpret a 95% confidence interval estimate for the
proportion of the traveling population that would have been impacted had the one-bag
limit been in effect.
A) (0.3155, 0.3745)
B) (0.3220, 0.3680)
C) (0.3216, 0.3684)
D) (0.3336, 0.3564)
The chamber of commerce in a beach resort town wants to estimate the proportion of
visitors who are repeat visitors. From previous experience they believe the portion is
not larger than 20 percent. They want to estimate the proportion to within 0.04
percentage points with 95 percent confidence. The sample size they should use is:
A) n = 601
B) n = 97
C) n = 10
D) n = 385
A major airline is interested in monitoring customer satisfaction with its baggage
handling process. To do so, each day the airline randomly selects 100 customers and
surveys them to determine if they are satisfied or not with the service provided. After 20
samples, a total of 260 unsatisfied customers were surveyed.
a. If the airline wishes to use a control chart, which chart would you recommend and
why?
b. Determine the 3-sigma control limits for the appropriate control chart.

The Polson Pole and Fence Company recently did a quality check on the length of fence
posts. To do this, each of the 400 posts in inventory was numbered. Numbers from 1 to
400 were placed in a bowl. Twenty numbers were selected from the bowl without
looking. These 20 poles were the ones selected for the study. This type of sampling is
called:
A) cluster sampling.
B) simple random sampling.
C) nonstatistical.
D) convenience sampling.
In a contingency analysis, the greater the difference between the actual and the expected
frequencies, the more likely:
A) H0 should be rejected.
B) H0 should be accepted.
C) we cannot determine H0.

D) the smaller the test statistic will be.
Which of the following is not among the most common sources of variation?
A) People
B) Materials
C) Methods
D) Quotas
The following model:
y = β0 + β1x1 + β2x2 + β3x1x2 + ε
A) is a linear model with interaction.
B) is a second order polynomial model.
C) is a composite model.
D) is a convex model.

Beacon Hill Trees & Shrubs currently has an inventory of 10 fruit trees, 8 pine trees,
and 14 maple trees. It plans to give 4 trees away at next Saturday’s lawn and garden
show in the city park. The 4 winners can select which type of tree they want. Assume
they select randomly.
What is the probability that no fruit trees and 2 of each of the others will be selected?
A) 0.0058
B) 0.0218
C) 0.0355
D) 0.0709
The Weyerhauser Lumber Company headquartered in Tacoma, Washington, is one of
the largest timber and wood product companies in the world. Weyerhauser
manufactures plywood at one of its Oregon plants. Plywood contains minor
imperfections that can be repaired with small “plugs.” One customer will accept
plywood with a maximum of 3.5 plugs per sheet on average. Suppose a shipment was
sent to this customer and when the customer inspected two sheets at random, 10
plugged defects were counted. What is the probability of observing 10 or more plugged
defects if in fact the 3.5 average per sheet is being satisfied?
A) 0.1887
B) 0.1695
C) 0.2115
D) 0.2675
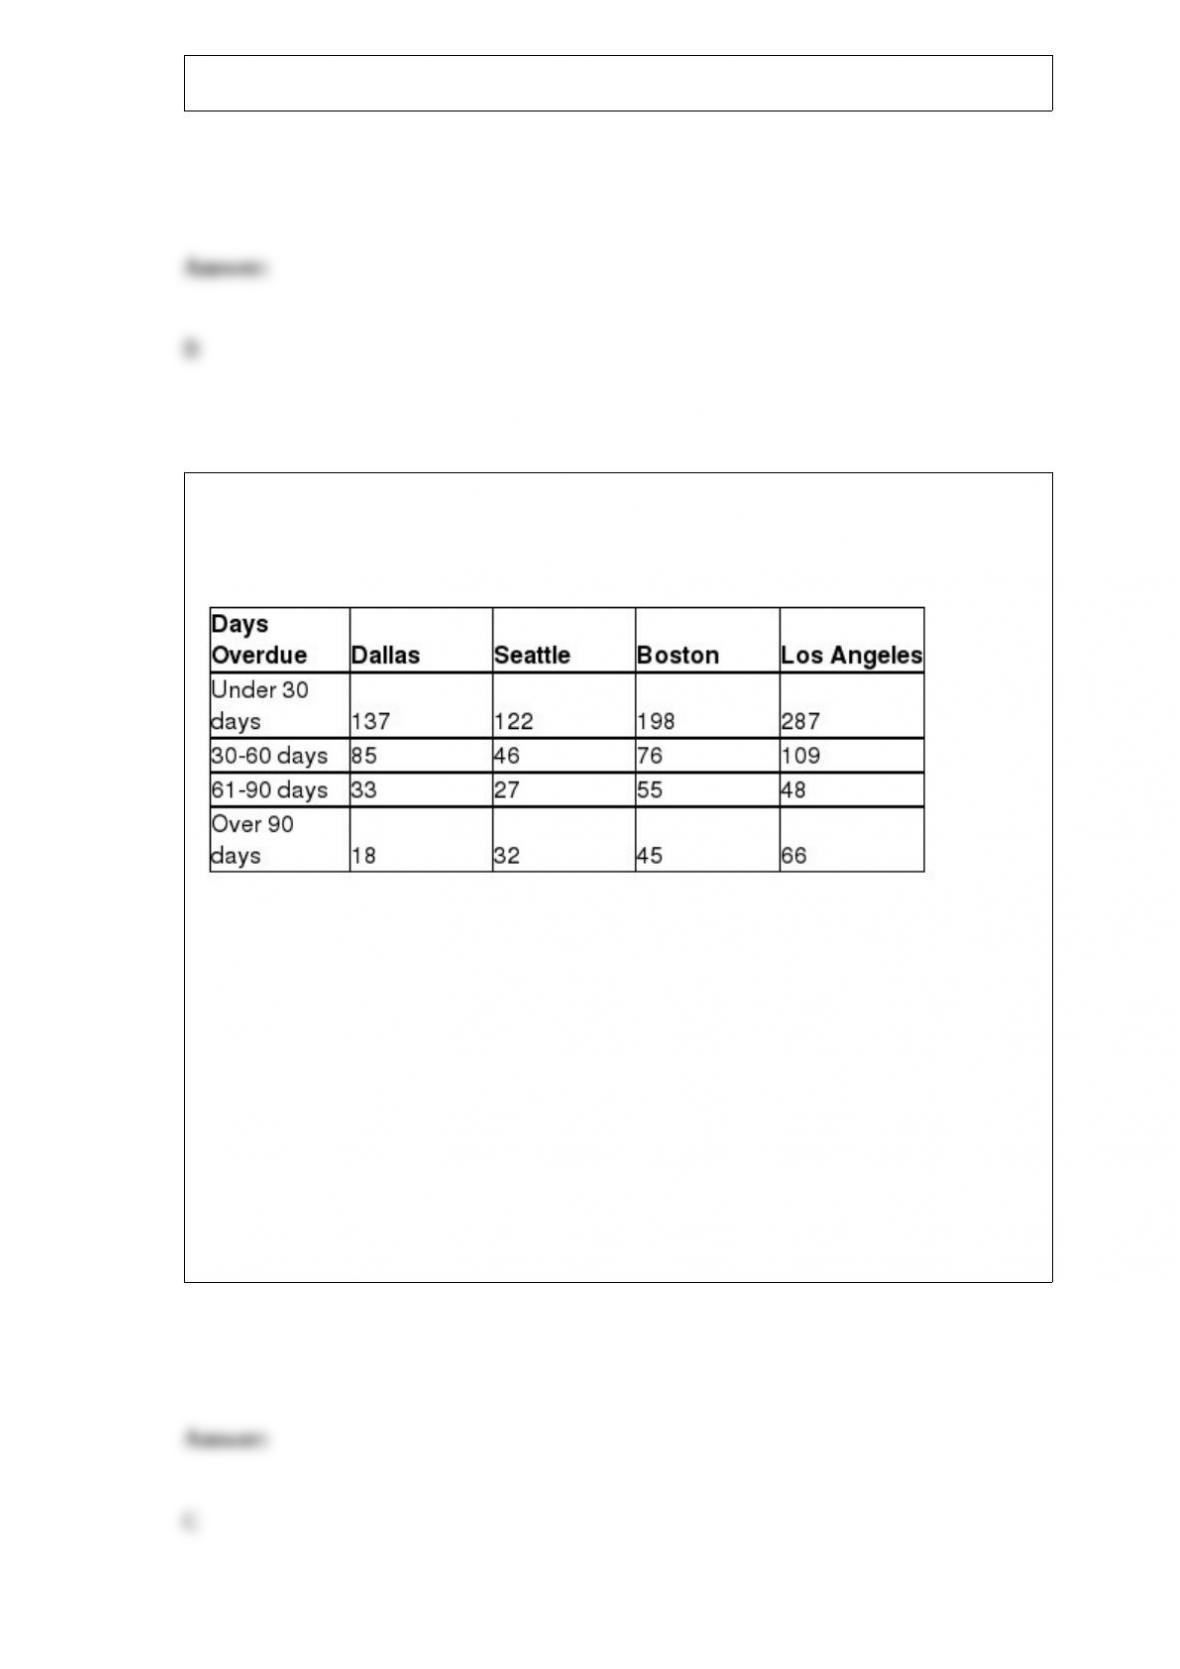
Micron Technology has sales offices located in four cities: Dallas, Seattle, Boston, and
Los Angeles. An analysis of the company’s accounts receivables reveals the number of
overdue invoices by days, as shown here.
Assume the invoices are stored and managed from a central database.
What is the probability that a randomly selected invoice from the database is between
30 and 90 days overdue?
A) 0.2702
B) 0.0231
C) 0.3461
D) 0.7765

Which of the following is an assumption for the one-way analysis of variance
experimental design?
A) All populations are normally distributed.
B) The populations have equal variances.
C) The observations are independent.
D) All of the above
In constructing a scatter diagram:
A) the independent variable should be on the vertical axis.
B) the independent variable should be on the horizontal axis.
C) the dependent variable should be on the horizontal axis.
D) It does not matter which variable goes on which axis.
A cell phone company wants to determine if the use of text messaging is independent of
age. The following data has been collected from a random sample of customers.
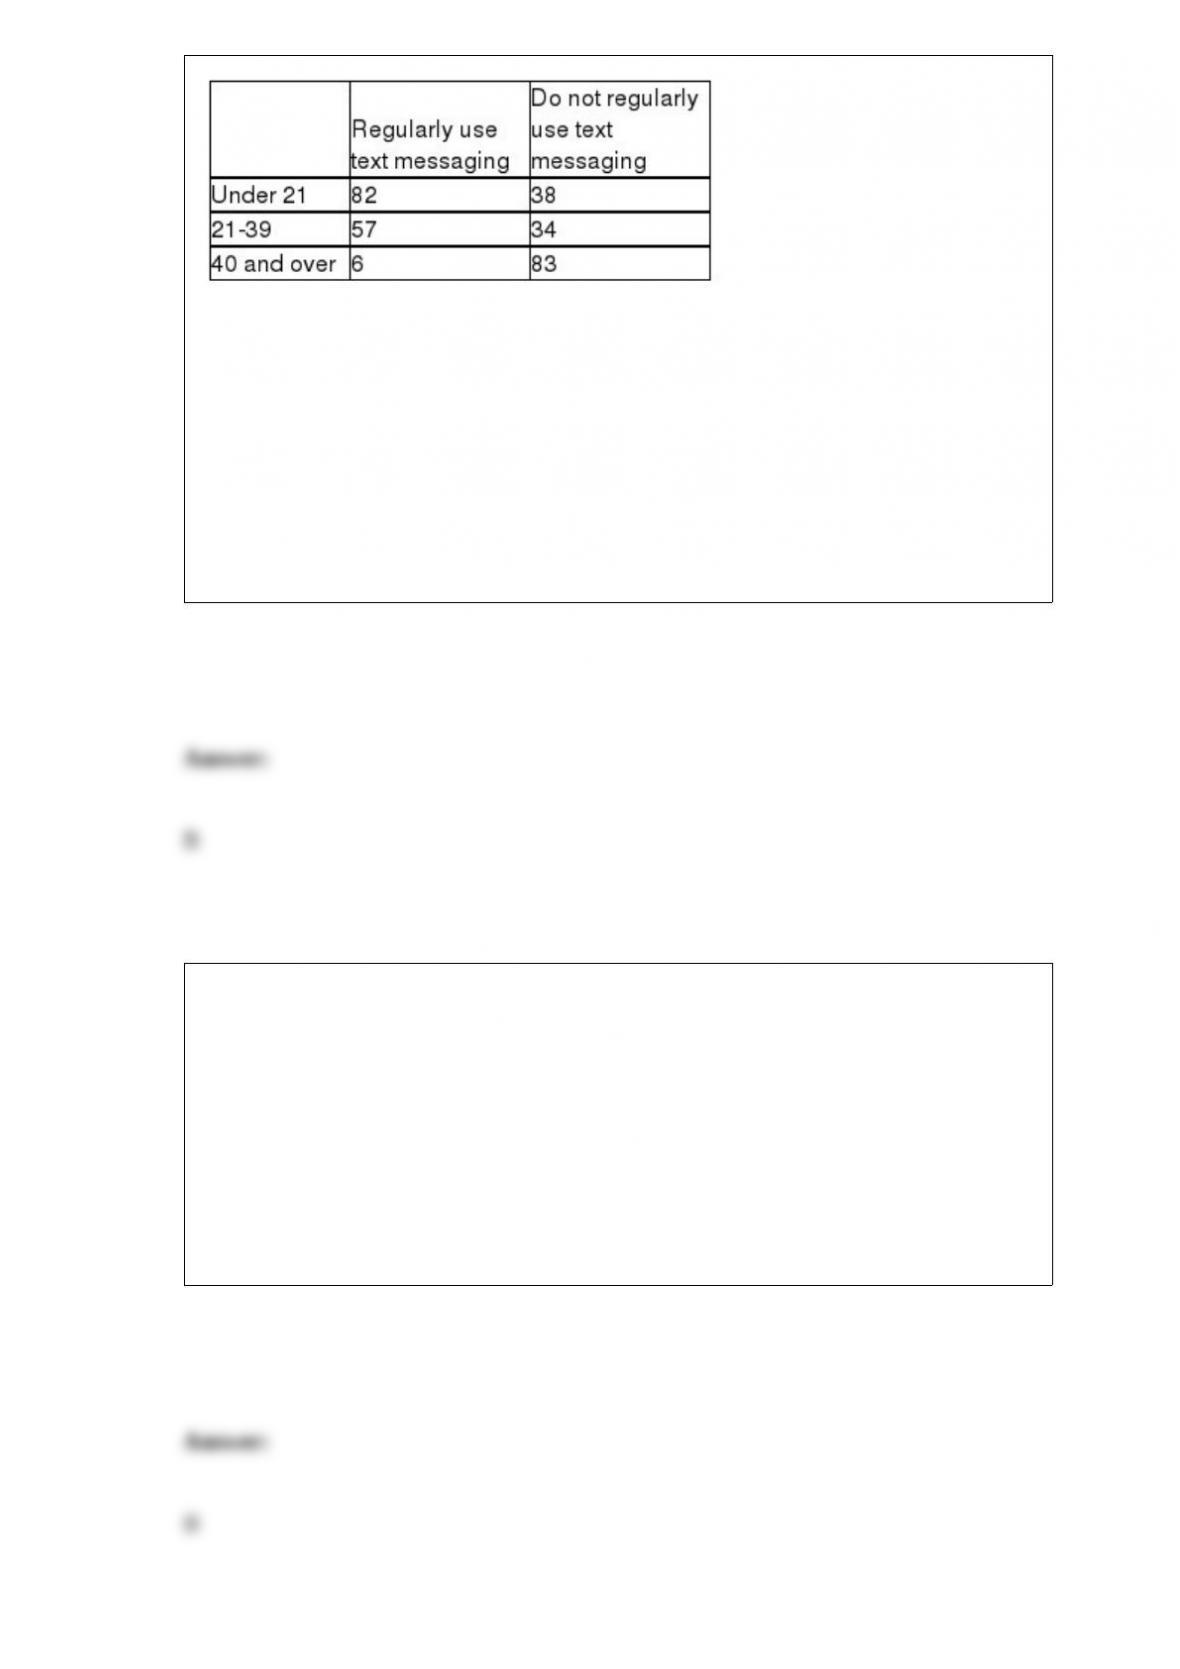
To conduct a contingency analysis, the value of the test statistic is:
A) 9.2104
B) 88.3
C) 275.02
D) 14.6
In developing a confidence interval estimate for the population mean, the t-distribution
is used to obtain the critical value when:
A) the sample contains some extreme values that skew the results.
B) the population standard deviation is unknown.
C) the sampling that is being used is not a statistical sample.
D) the confidence level is low.

Waiters at Finegold’s Restaurant and Lounge earn most of their income from tips. Each
waiter is required to “tip-out” a portion of tips to the table bussers and hostesses. The
manager has based the “tip-out” rate on the assumption that the mean tip is at least 15%
of the customer bill. To make sure that this is the correct assumption, he has decided to
conduct a test by randomly sampling 60 bills and recording the actual tips.
State the appropriate null and alternative hypotheses.
A) H0 : μ ≥ 15 Ha : μ < 15
B) H0 : μ ≤ 15 Ha : μ > 15
C) H0 : μ ≥ 9 Ha : μ < 9
D) H0 : μ ≤ 9 Ha : μ > 9
A measure computed from the entire population is called:
A) a statistic.
B) a mean.
C) a parameter.
D) a qualitative value.